


Features
- 26 Unique slides
- Fully editable and easy to edit in Microsoft Powerpoint, Keynote and Google Slides
- 16:9 widescreen layout
- Clean and professional designs
- Export to JPG, PDF or send by email


Do you have any questions?
Recommend


6 slides
Circular Strategy Wheel Breakdown Presentation
Visualize interconnected steps or strategies using this five-part circular wheel layout. Ideal for showcasing workflows, processes, or recurring phases. Each segment includes an icon, number, and editable text field. Perfect for business, marketing, or planning teams. Fully customizable in PowerPoint, Keynote, and Google Slides to match your branding needs.


26 slides
Networking for Success Presentation Template
Elevate your professional connections and opportunities with this sleek and impactful presentation template designed for networking success. Tailored for professionals, entrepreneurs, and career coaches, it features dynamic layouts for showcasing strategies, tools, and benefits of effective networking. The template includes sections for step-by-step guides, actionable tips, relationship-building techniques, and key metrics to measure success. With modern visuals and well-organized content, it ensures your message is both compelling and easy to follow. Highlight your ideas with infographics, timelines, and data charts to keep your audience engaged. Whether you’re conducting a workshop, pitching a business, or presenting at a seminar, this template adapts to various purposes with ease. Fully customizable and easy to edit, it ensures your presentation reflects your unique style and message. Compatible with PowerPoint, Keynote, and Google Slides, this template makes it simple to deliver a polished and professional presentation across any platform.


12 slides
Compliance and Policy Management Presentation
Visualize your compliance ecosystem with the Compliance and Policy Management Presentation. Designed around a planetary orbit concept, this slide maps core policies at the center with surrounding regulations and enforcement layers. Each orbit can represent levels of governance, department roles, or regulatory zones—making it ideal for risk teams, auditors, and legal advisors. Fully customizable in PowerPoint, Keynote, and Google Slides for seamless use.


26 slides
Digital Art Tools and Techniques Presentation
Unleash your creativity with this vibrant presentation on digital art tools and techniques. Covering essential topics like graphic design software, digital brushes, layering methods, and creative workflows, this template helps artists and designers enhance their skills. Fully customizable and compatible with PowerPoint, Keynote, and Google Slides for a seamless and visually stunning presentation experience.


5 slides
Employee Onboarding Training Roadmap Presentation
Visualize your training journey with the Employee Onboarding Training Roadmap Presentation. This layout uses a road-style timeline with trucks to represent each step of the onboarding process—perfect for outlining key milestones, training modules, or departmental introductions. Fully editable in PowerPoint, Keynote, Google Slides, or Canva.
22 slides
Nova Startup Funding Proposal Presentation
Craft an impressive startup funding proposal with this elegant template. It includes sections for mission, vision, market analysis, business model, and financial overview. Ideal for clear and professional presentations. Fully compatible with PowerPoint, Keynote, and Google Slides for easy customization.


3 slides
Introduction to Cryptocurrency Presentation
Step into the future of finance with this sleek, modern template designed to explain digital currencies in a simple, engaging way. Perfect for educators, startups, and analysts, it transforms complex ideas into clear visuals. Fully compatible with PowerPoint, Keynote, and Google Slides for effortless editing and professional presentations.


4 slides
Stakeholder Analysis Mapping Strategy Presentation
Turn complex stakeholder relationships into clear, actionable insights with this dynamic and modern quadrant design. Ideal for visualizing influence, communication strategies, and engagement priorities, it helps teams build stronger collaboration frameworks. Fully editable and compatible with PowerPoint, Keynote, and Google Slides for effortless professional use.


4 slides
Modern Company Profile Layout Presentation
Bring your brand to life with this clean and modern layout built to highlight your company’s mission, values, and team. Its balanced design and easy-to-read sections make every detail stand out beautifully. Fully editable and compatible with PowerPoint, Keynote, and Google Slides for smooth customization and professional presentations.


4 slides
Green Business Sustainability Report Presentation
Communicate your sustainability efforts effectively with the Green Business Sustainability Report Presentation template. This visually engaging slide deck is designed to showcase eco-friendly business initiatives, corporate responsibility strategies, and environmental impact assessments. With an organic, nature-inspired design and a clear, structured layout, this template is perfect for sustainability consultants, corporate leaders, and environmental advocates. Fully editable and compatible with PowerPoint, Keynote, and Google Slides for seamless customization and presentation.
10 slides
Professional Business People Icons Presentation
The "Professional Business People Icons" presentation template offers a range of icons designed to represent business roles or activities visually. These slides are structured to incorporate iconography alongside text placeholders, allowing for easy customization to describe specific business functions or departments. The use of simple, clean icons ensures that the content is accessible and straightforward, suitable for professional presentations that require a blend of visual appeal and clarity. This template can effectively communicate various aspects of business operations or team roles in corporate presentations.


6 slides
Modern Treatment Plans in Medicine Presentation
Highlight six key elements of your healthcare strategy with the Modern Treatment Plans in Medicine Presentation. This clean, grid-style layout uses pill-shaped icons and vibrant colors to present treatments, initiatives, or categories. Ideal for breaking down complex medical plans. Fully customizable in Canva, PowerPoint, Keynote, and Google Slides.


26 slides
Raoul Presentation Template
Are you looking for business presentation template with a powerful framework that allows you to present and promote your latest ideas? Raoul is a sleek and clean, bold business presentation template. It's perfect for sharing your ideas, brand identity and how you want to be perceived with the world, in an appealing way. Raoul is great presentation for big or small businesses, company owners, reporters or managers. This template is all about simplicity and style. You will gain authority and convince others with this masterfully crafted professional presentation design.


4 slides
Team and Department Setup Structure Presentation
Organize your team with clarity using the Team and Department Setup Structure Presentation. This template is perfect for showcasing internal team hierarchies, departmental layouts, or functional groupings in a clean and professional layout. Each slide is fully customizable, allowing you to edit icons, titles, and structure to suit your organization. Compatible with Canva, PowerPoint, Keynote, and Google Slides.


19 slides
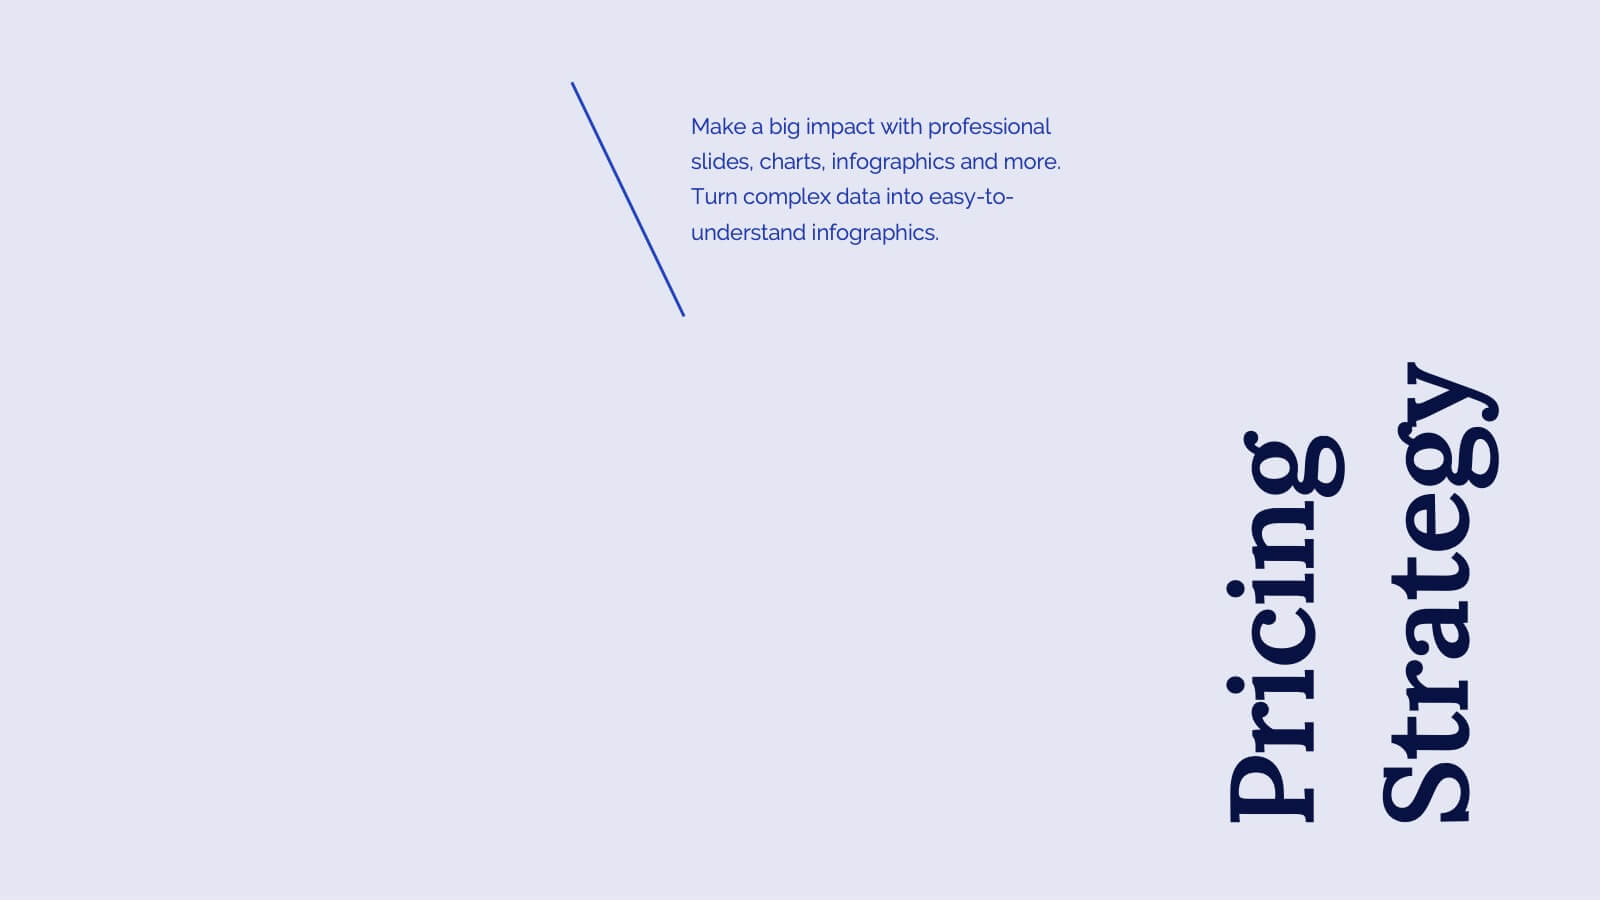
Haze Sales Forecast Presentation
Elevate your sales strategy with this stunning Sales Forecast template! Designed to highlight your objectives, team, pricing strategies, and future opportunities, it presents data in a sleek and professional manner. Impress your audience with clear visuals and a modern aesthetic. Perfect for PowerPoint, Keynote, and Google Slides presentations!


5 slides
Employee Onboarding HR Presentation
Start your presentation with energy and clarity using this clean, engaging slide designed to simplify every step of the onboarding journey. It helps explain employee integration, training stages, and team alignment in a way that feels intuitive and visually organized. Fully compatible with PowerPoint, Keynote, and Google Slides.


20 slides
Galaxion Marketing Proposal Presentation
This Marketing Proposal Presentation template offers a comprehensive structure to showcase your strategies, goals, and financial plans effectively. Covering key sections such as objectives, budget breakdown, and timeline, it's perfect for making a strong impression. Fully customizable and compatible with PowerPoint, Keynote, and Google Slides for seamless adaptation to your needs.