


Features
- 5 Unique slides
- Fully editable and easy to edit in Microsoft Powerpoint, Keynote and Google Slides
- 16:9 widescreen layout
- Clean and professional designs
- Export to JPG, PDF or send by email


Do you have any questions?
Recommend


4 slides
Educational Infographic Slide Presentation
Ignite curiosity from the very first slide with a clear, classroom-style visual that makes explanations feel simple and engaging. This presentation helps break down lessons, key concepts, or training points in a way audiences instantly understand. Clean layouts keep the focus on your message. Fully compatible with PowerPoint, Keynote, and Google Slides.


4 slides
Patient Care Plan and Metrics Presentation
Turn healthcare data into meaningful stories with this modern and professional presentation. Perfect for highlighting patient progress, clinical outcomes, and care efficiency, it balances visuals and data for clarity and impact. Easy to edit and fully compatible with PowerPoint, Keynote, and Google Slides for smooth customization.
22 slides
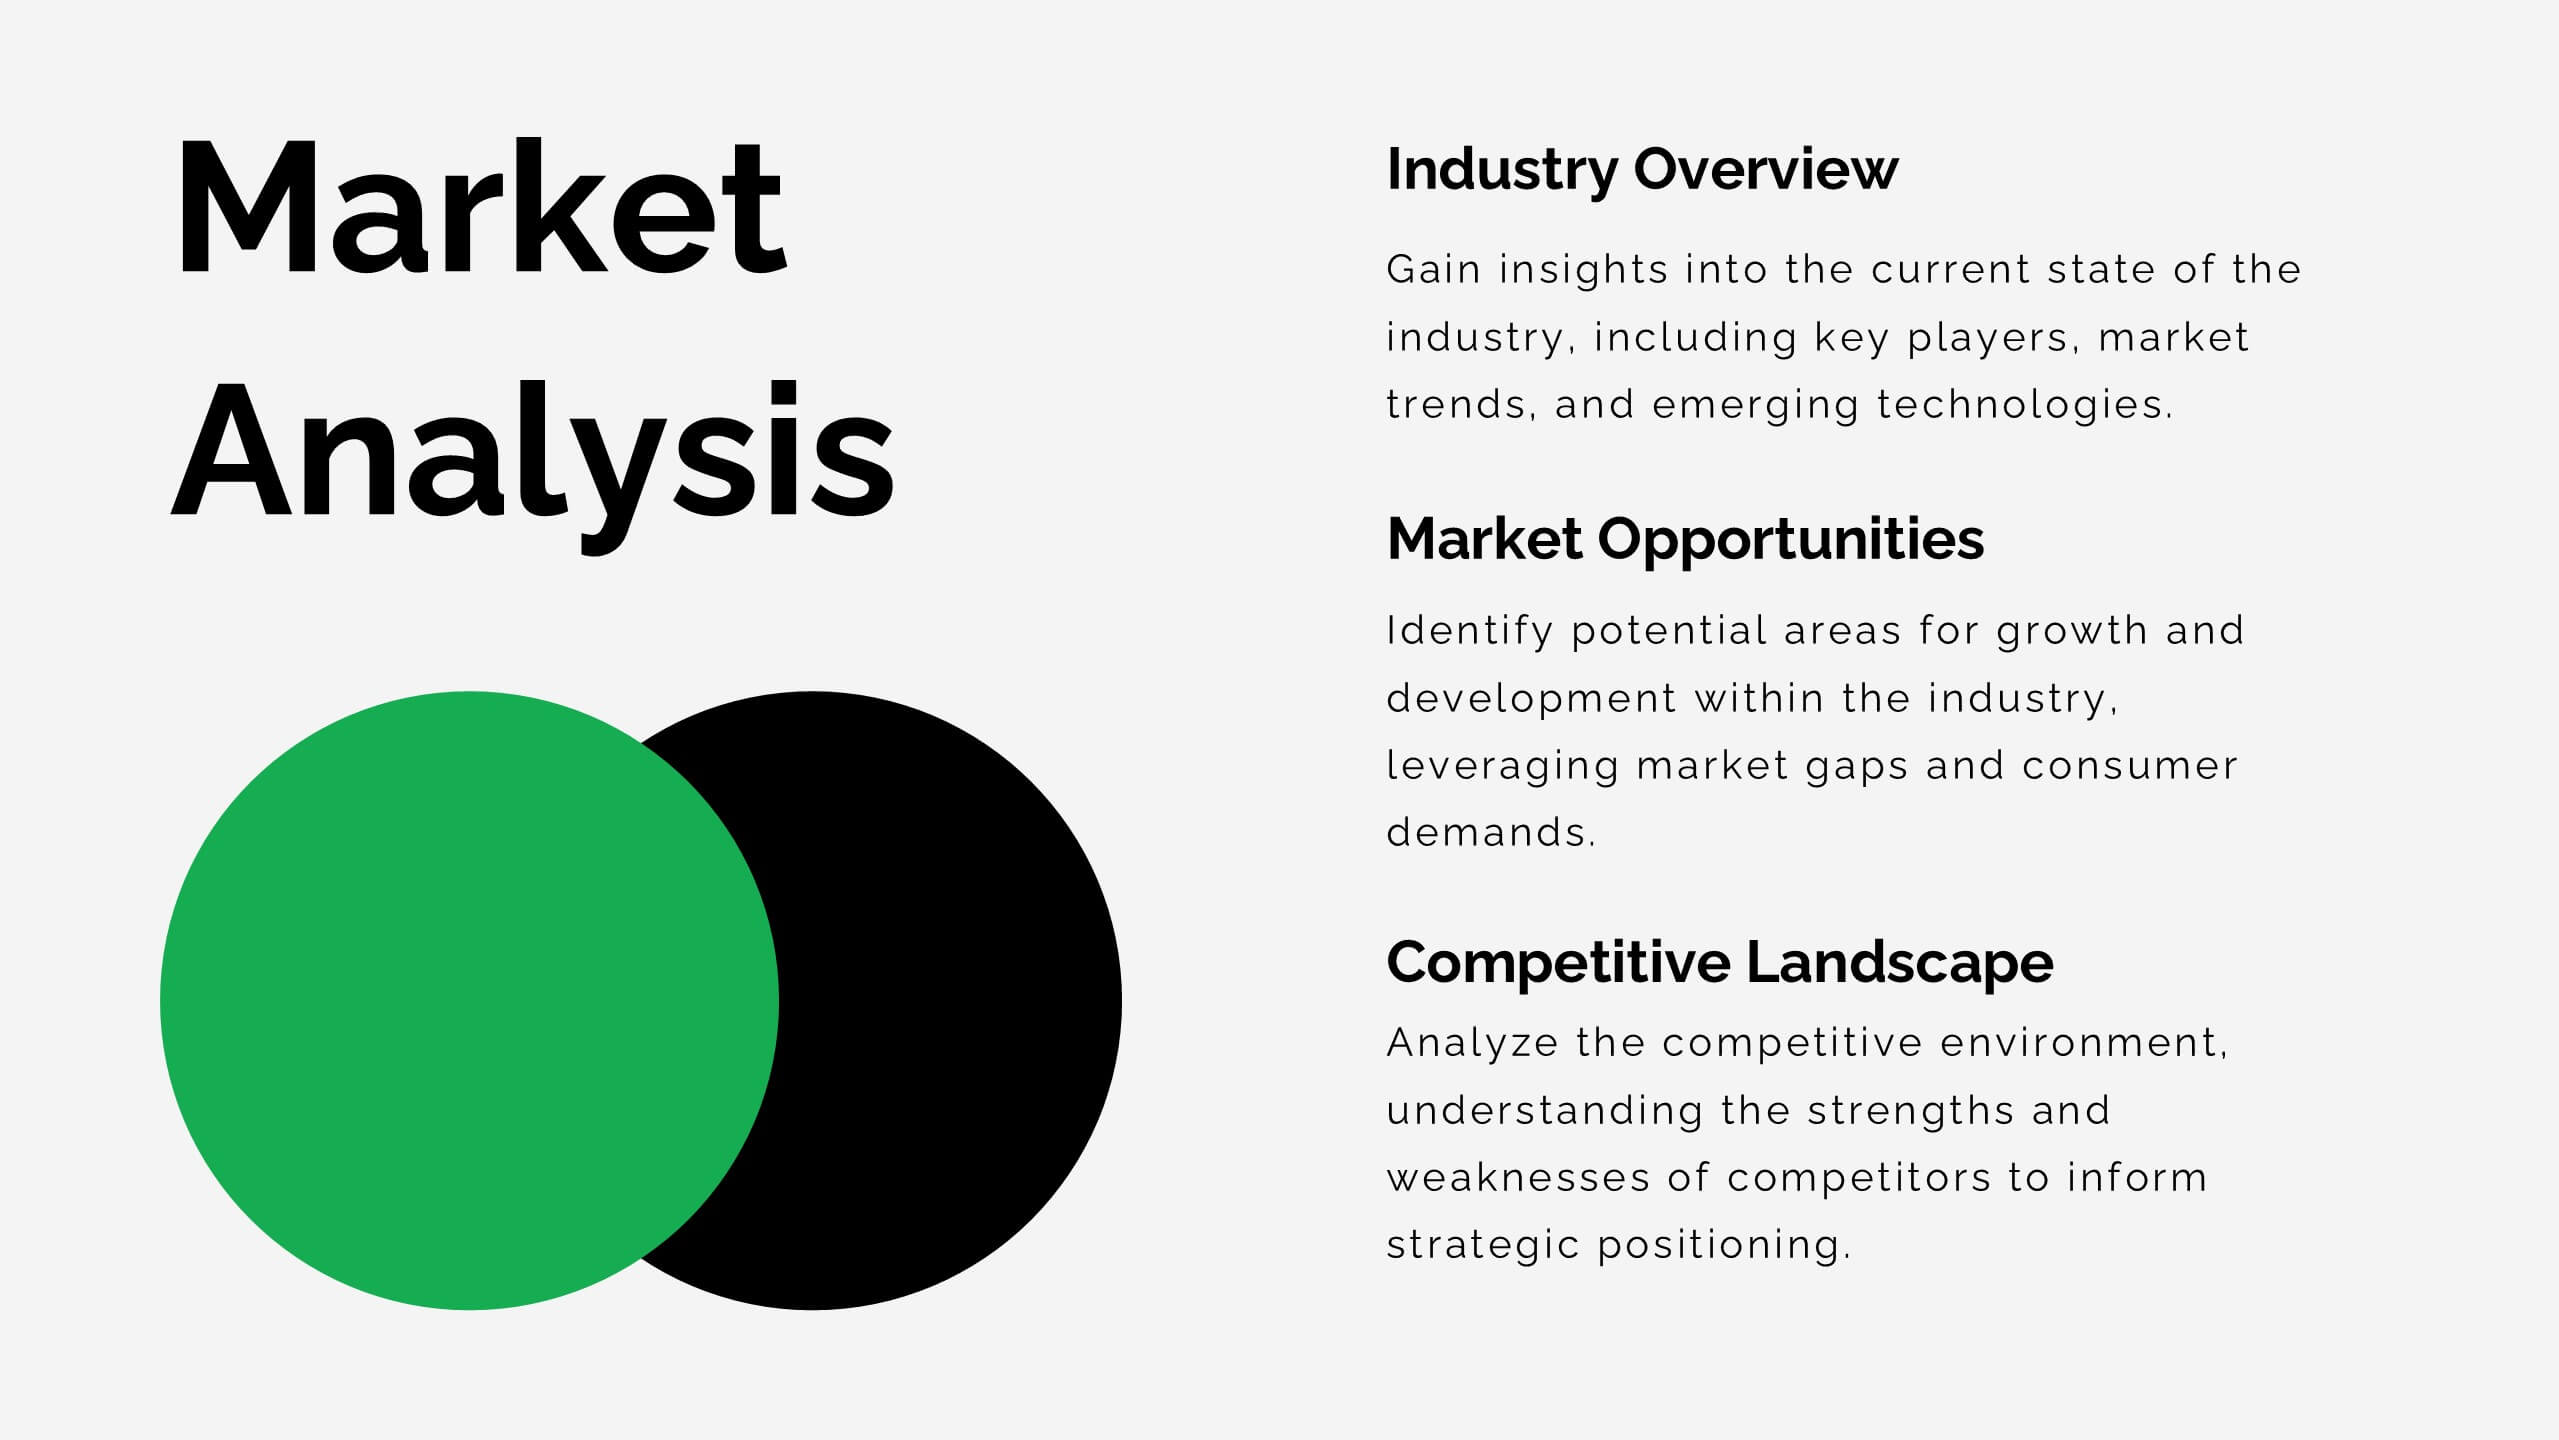
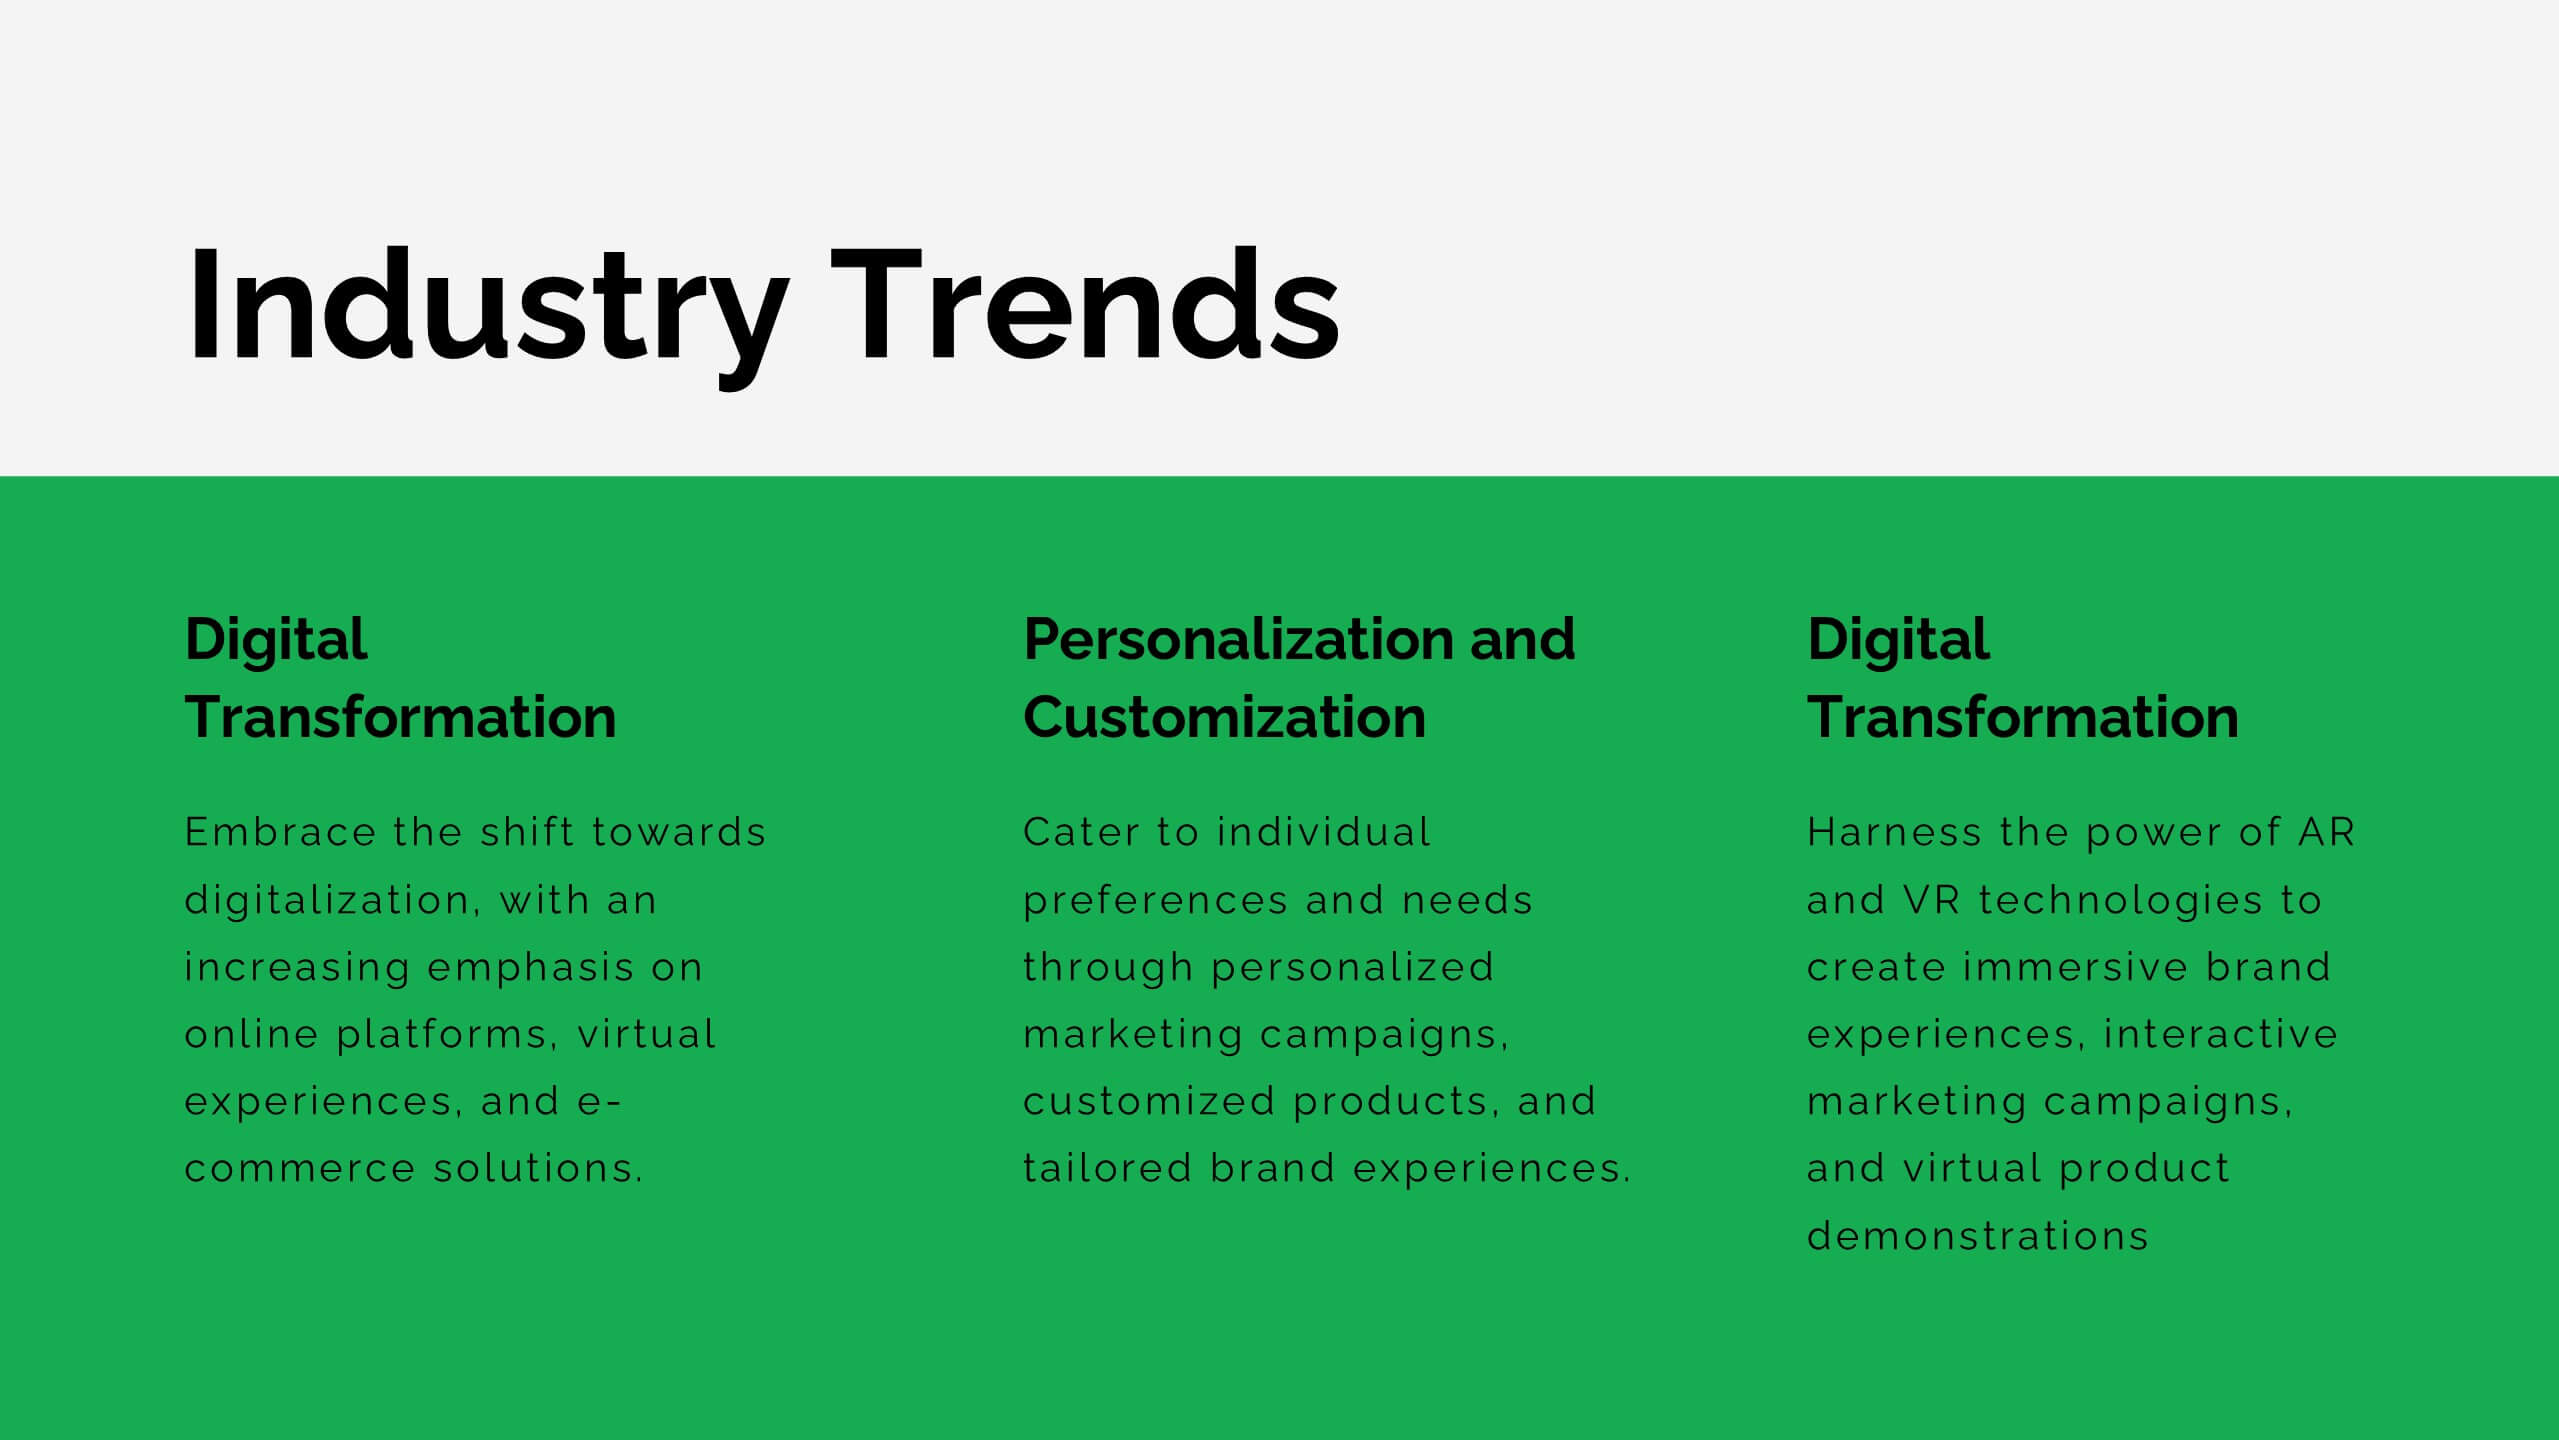
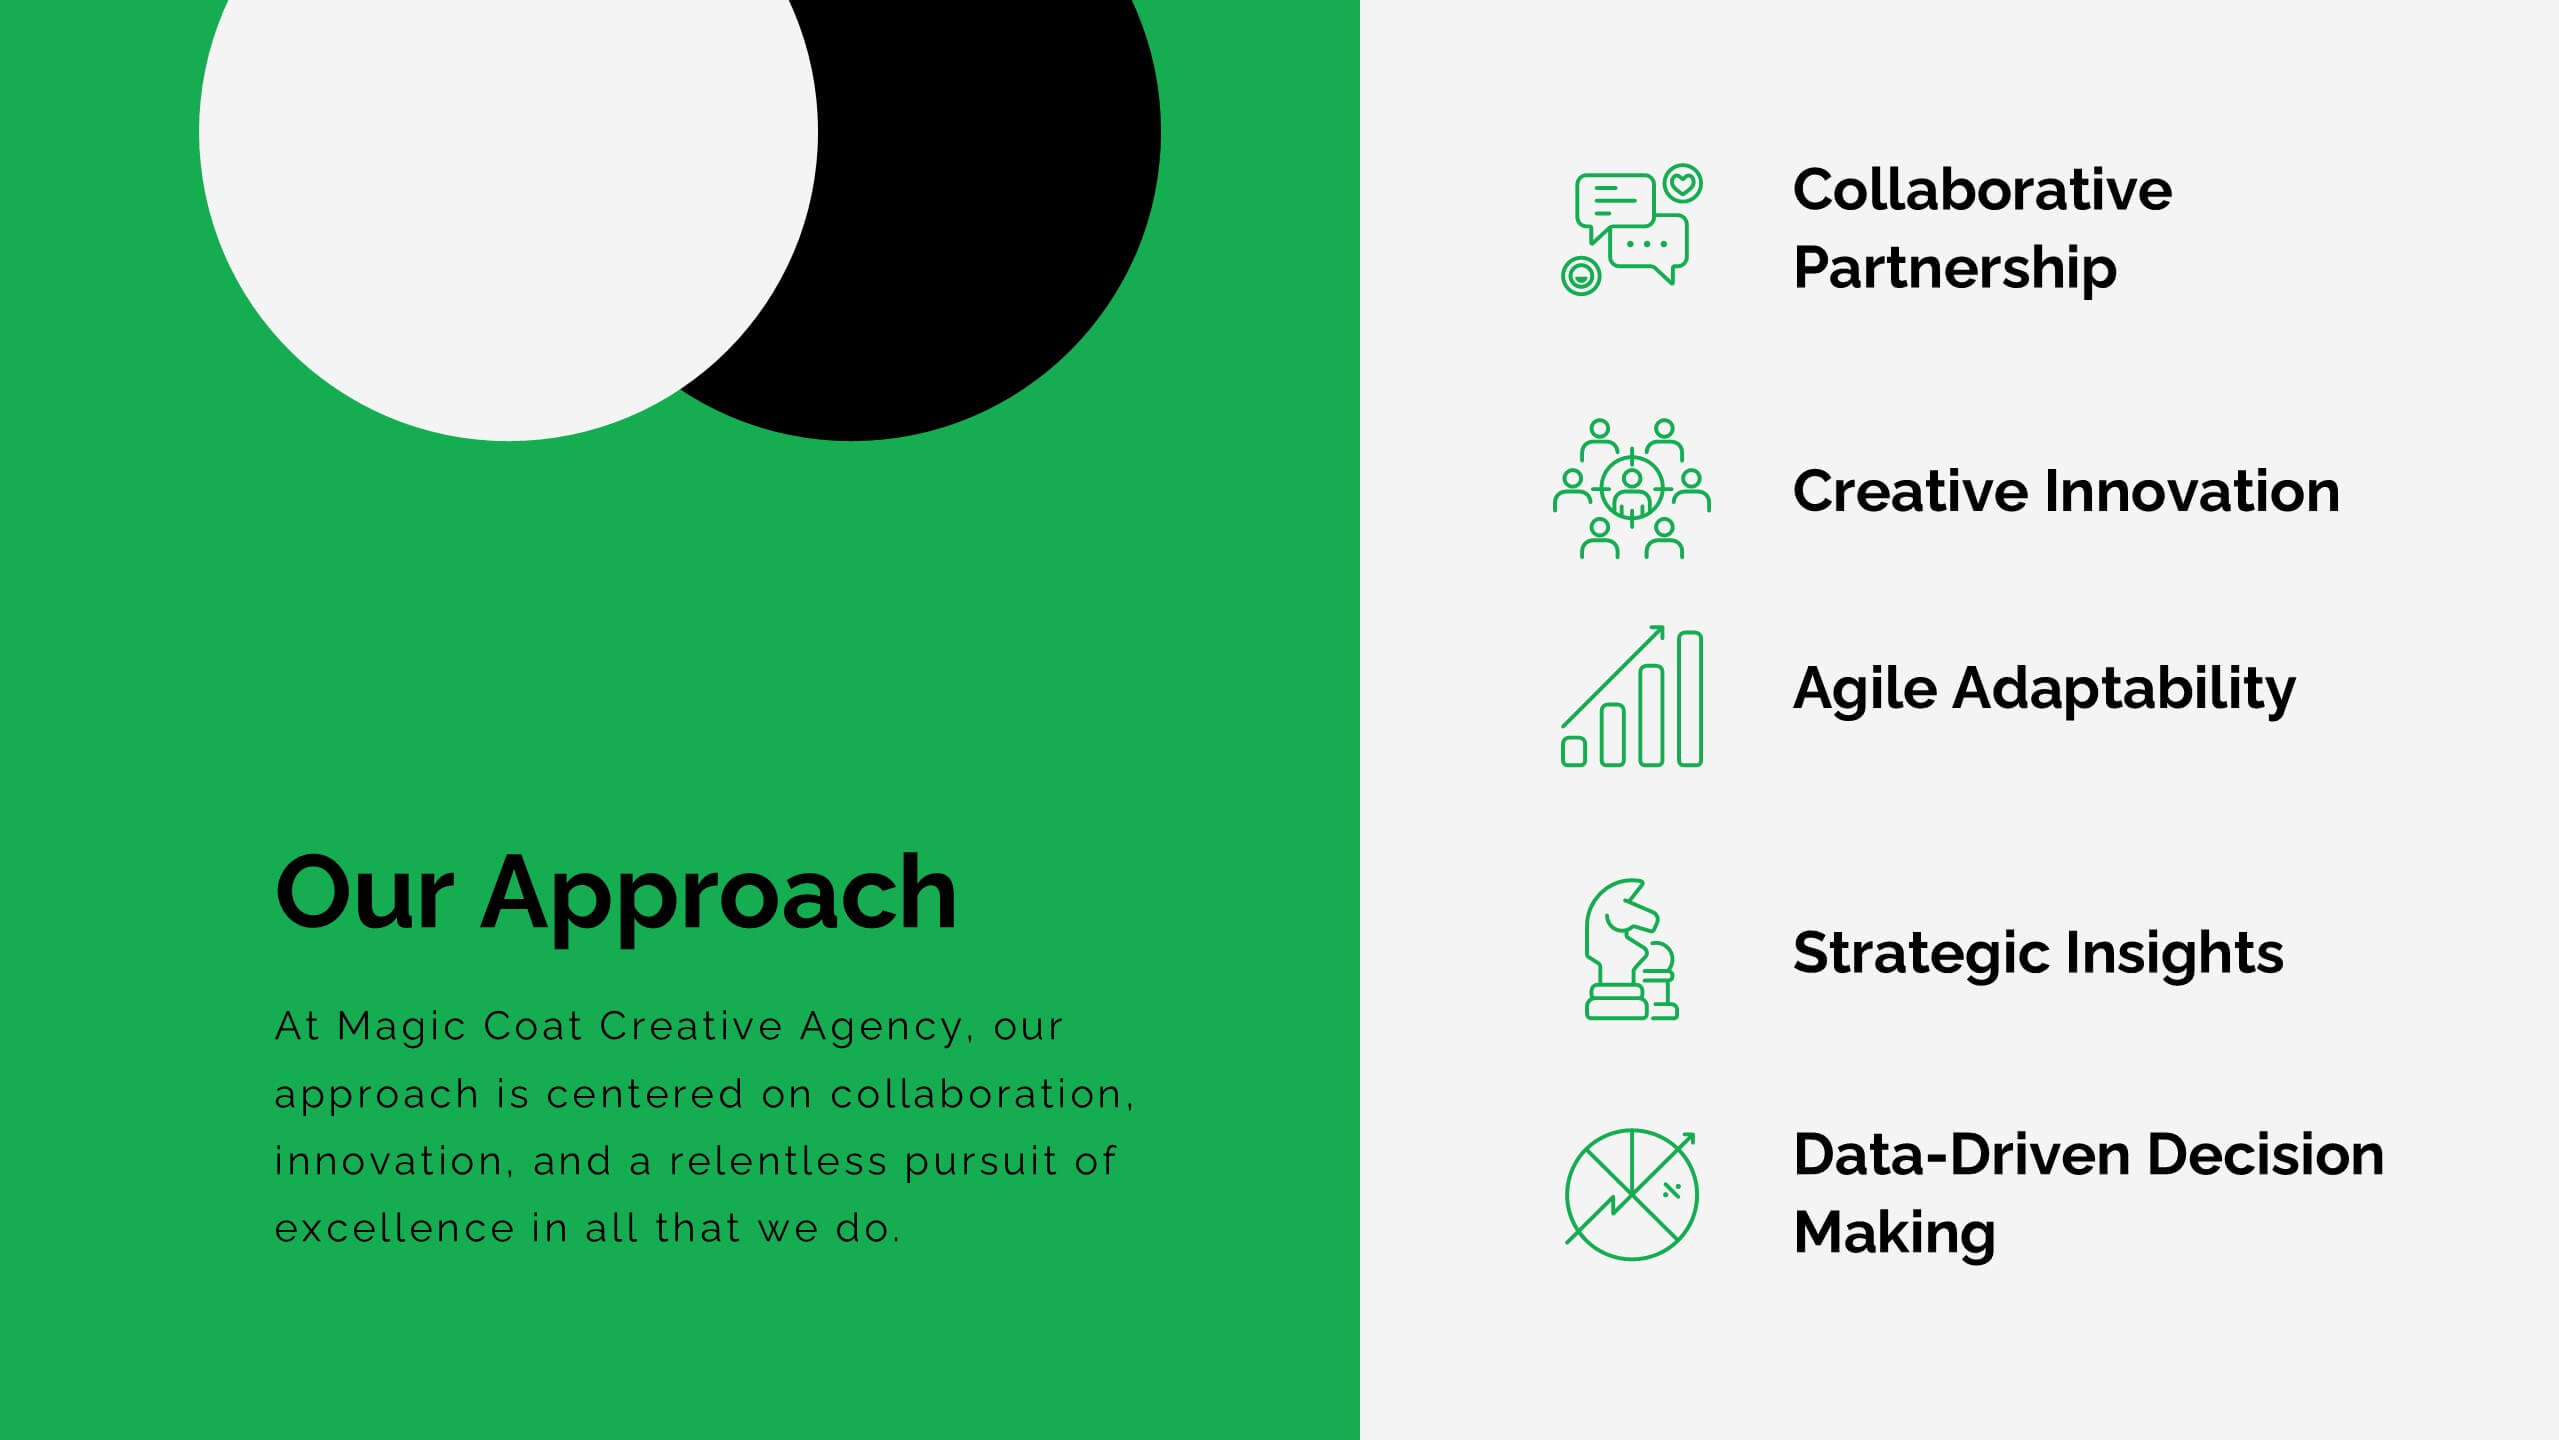
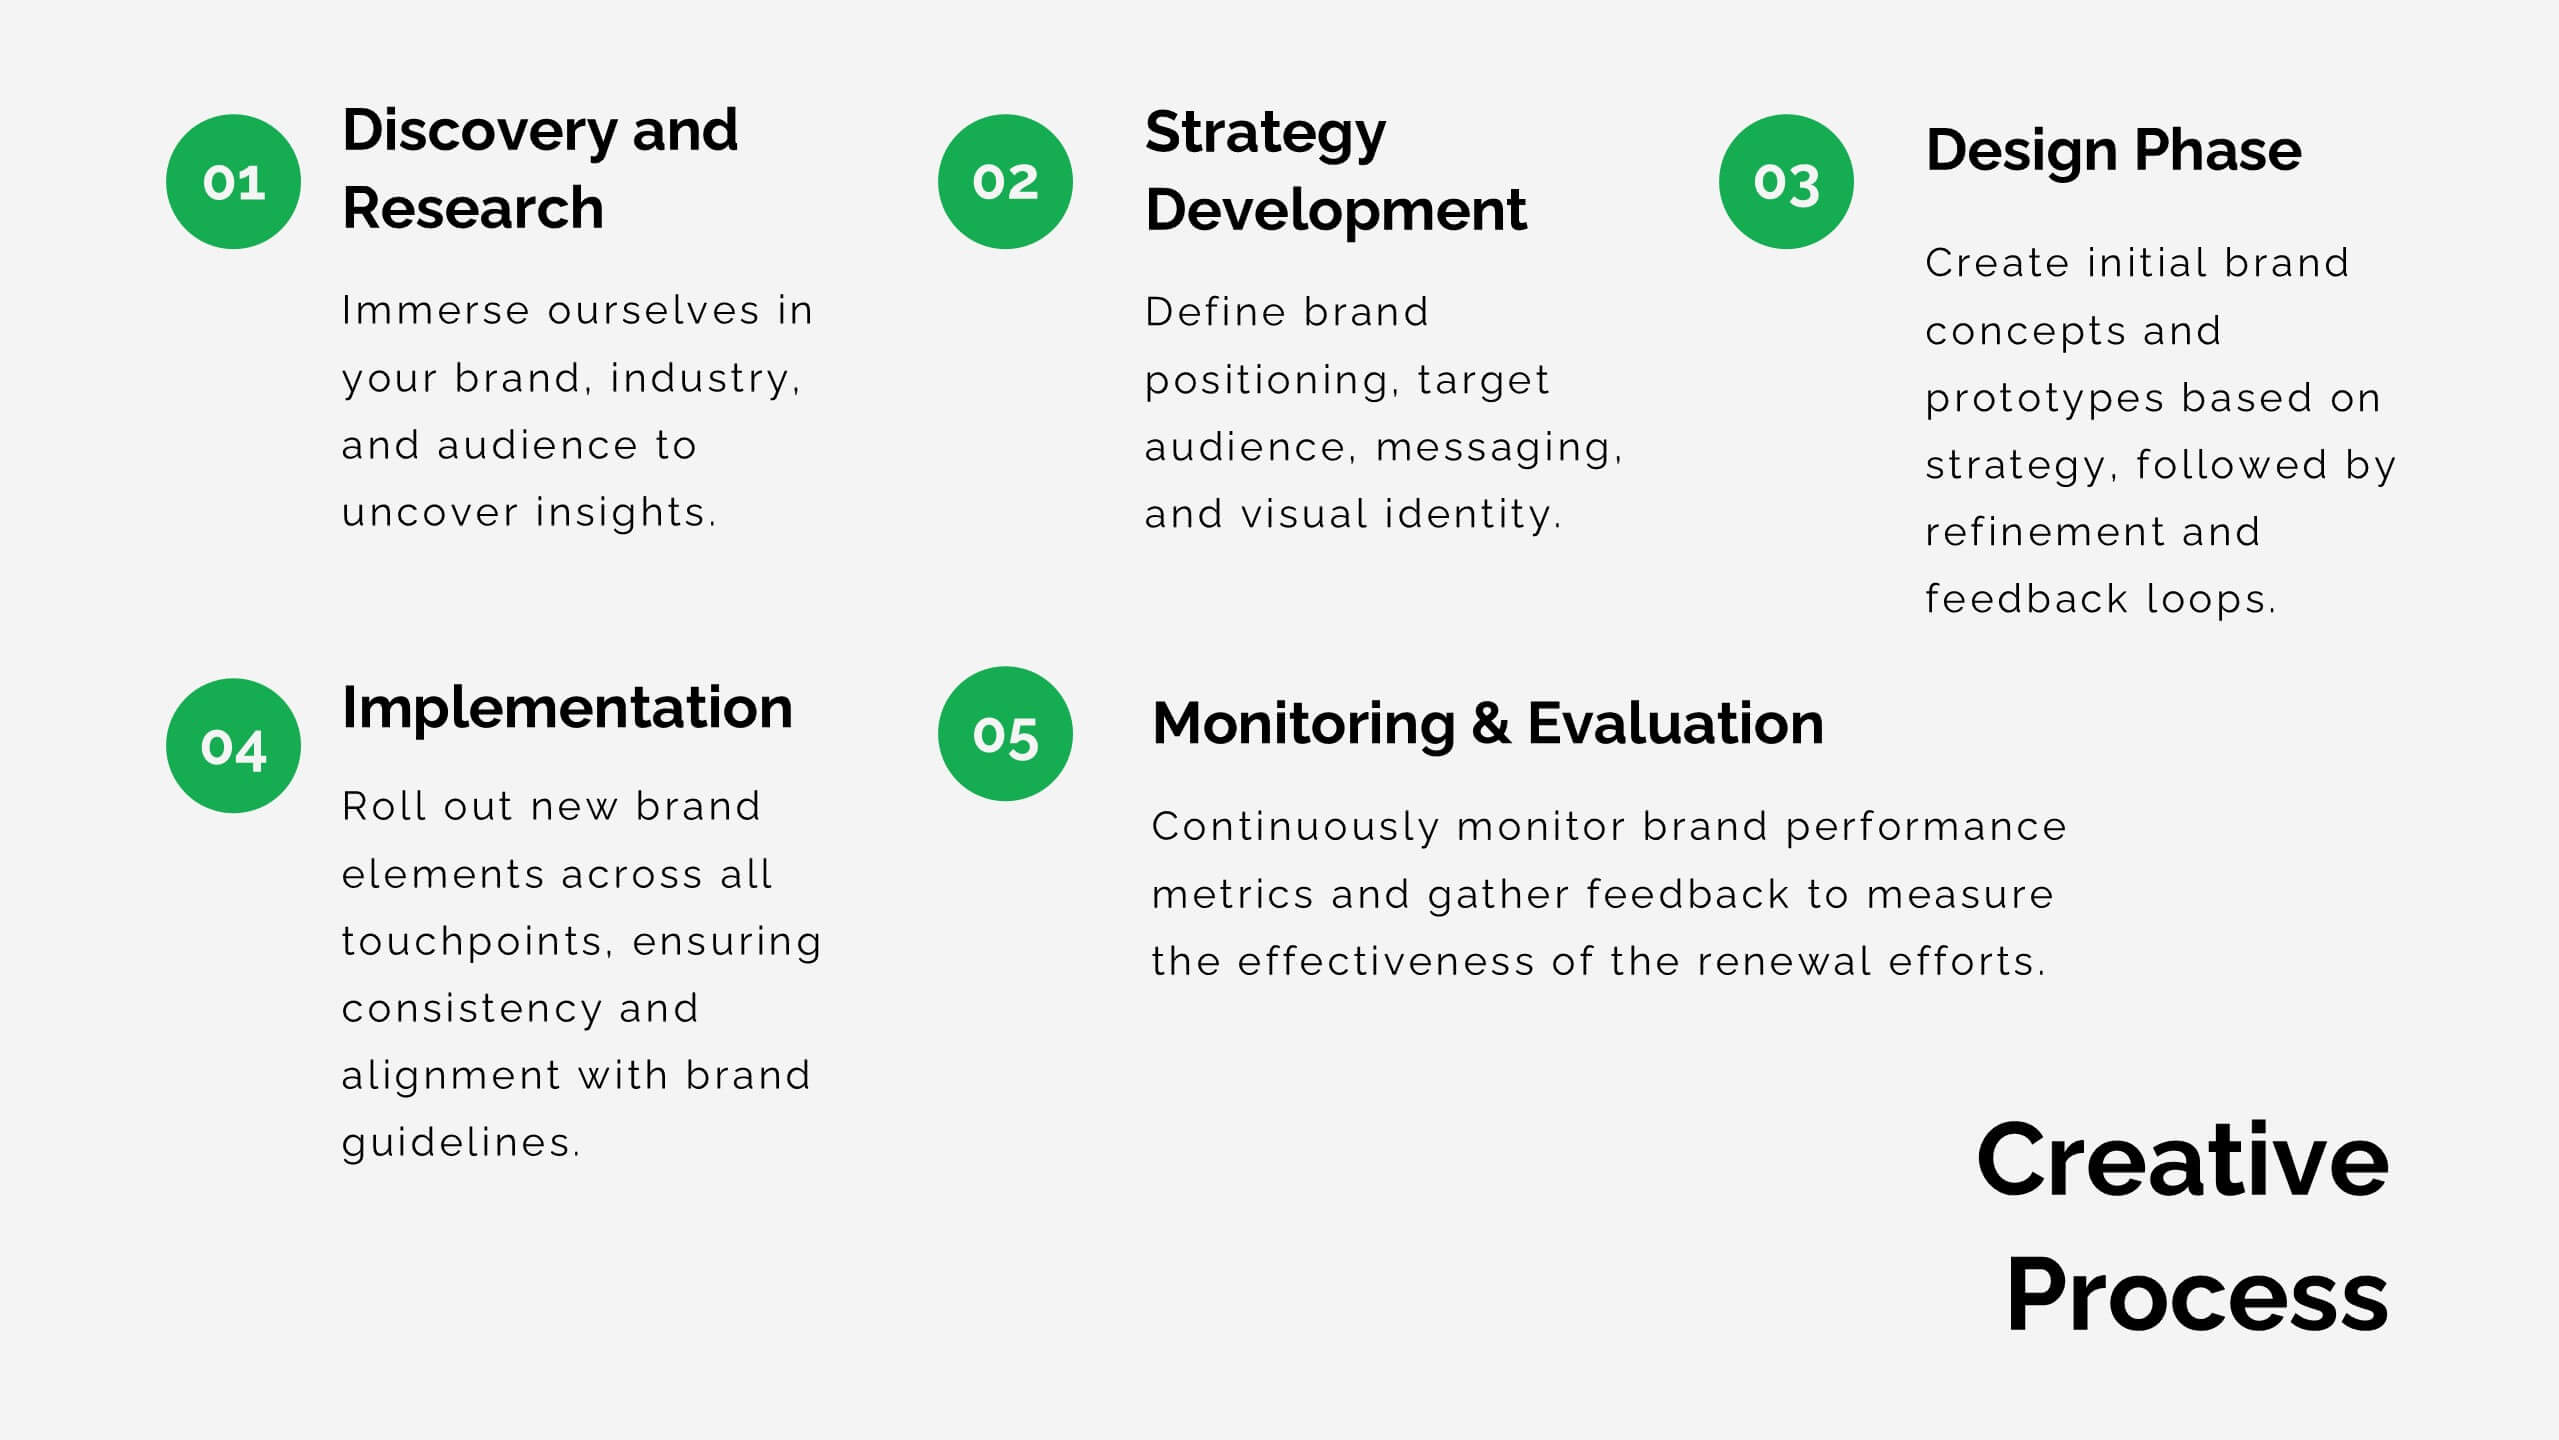
Lithium Advertising Agency Proposal Presentation
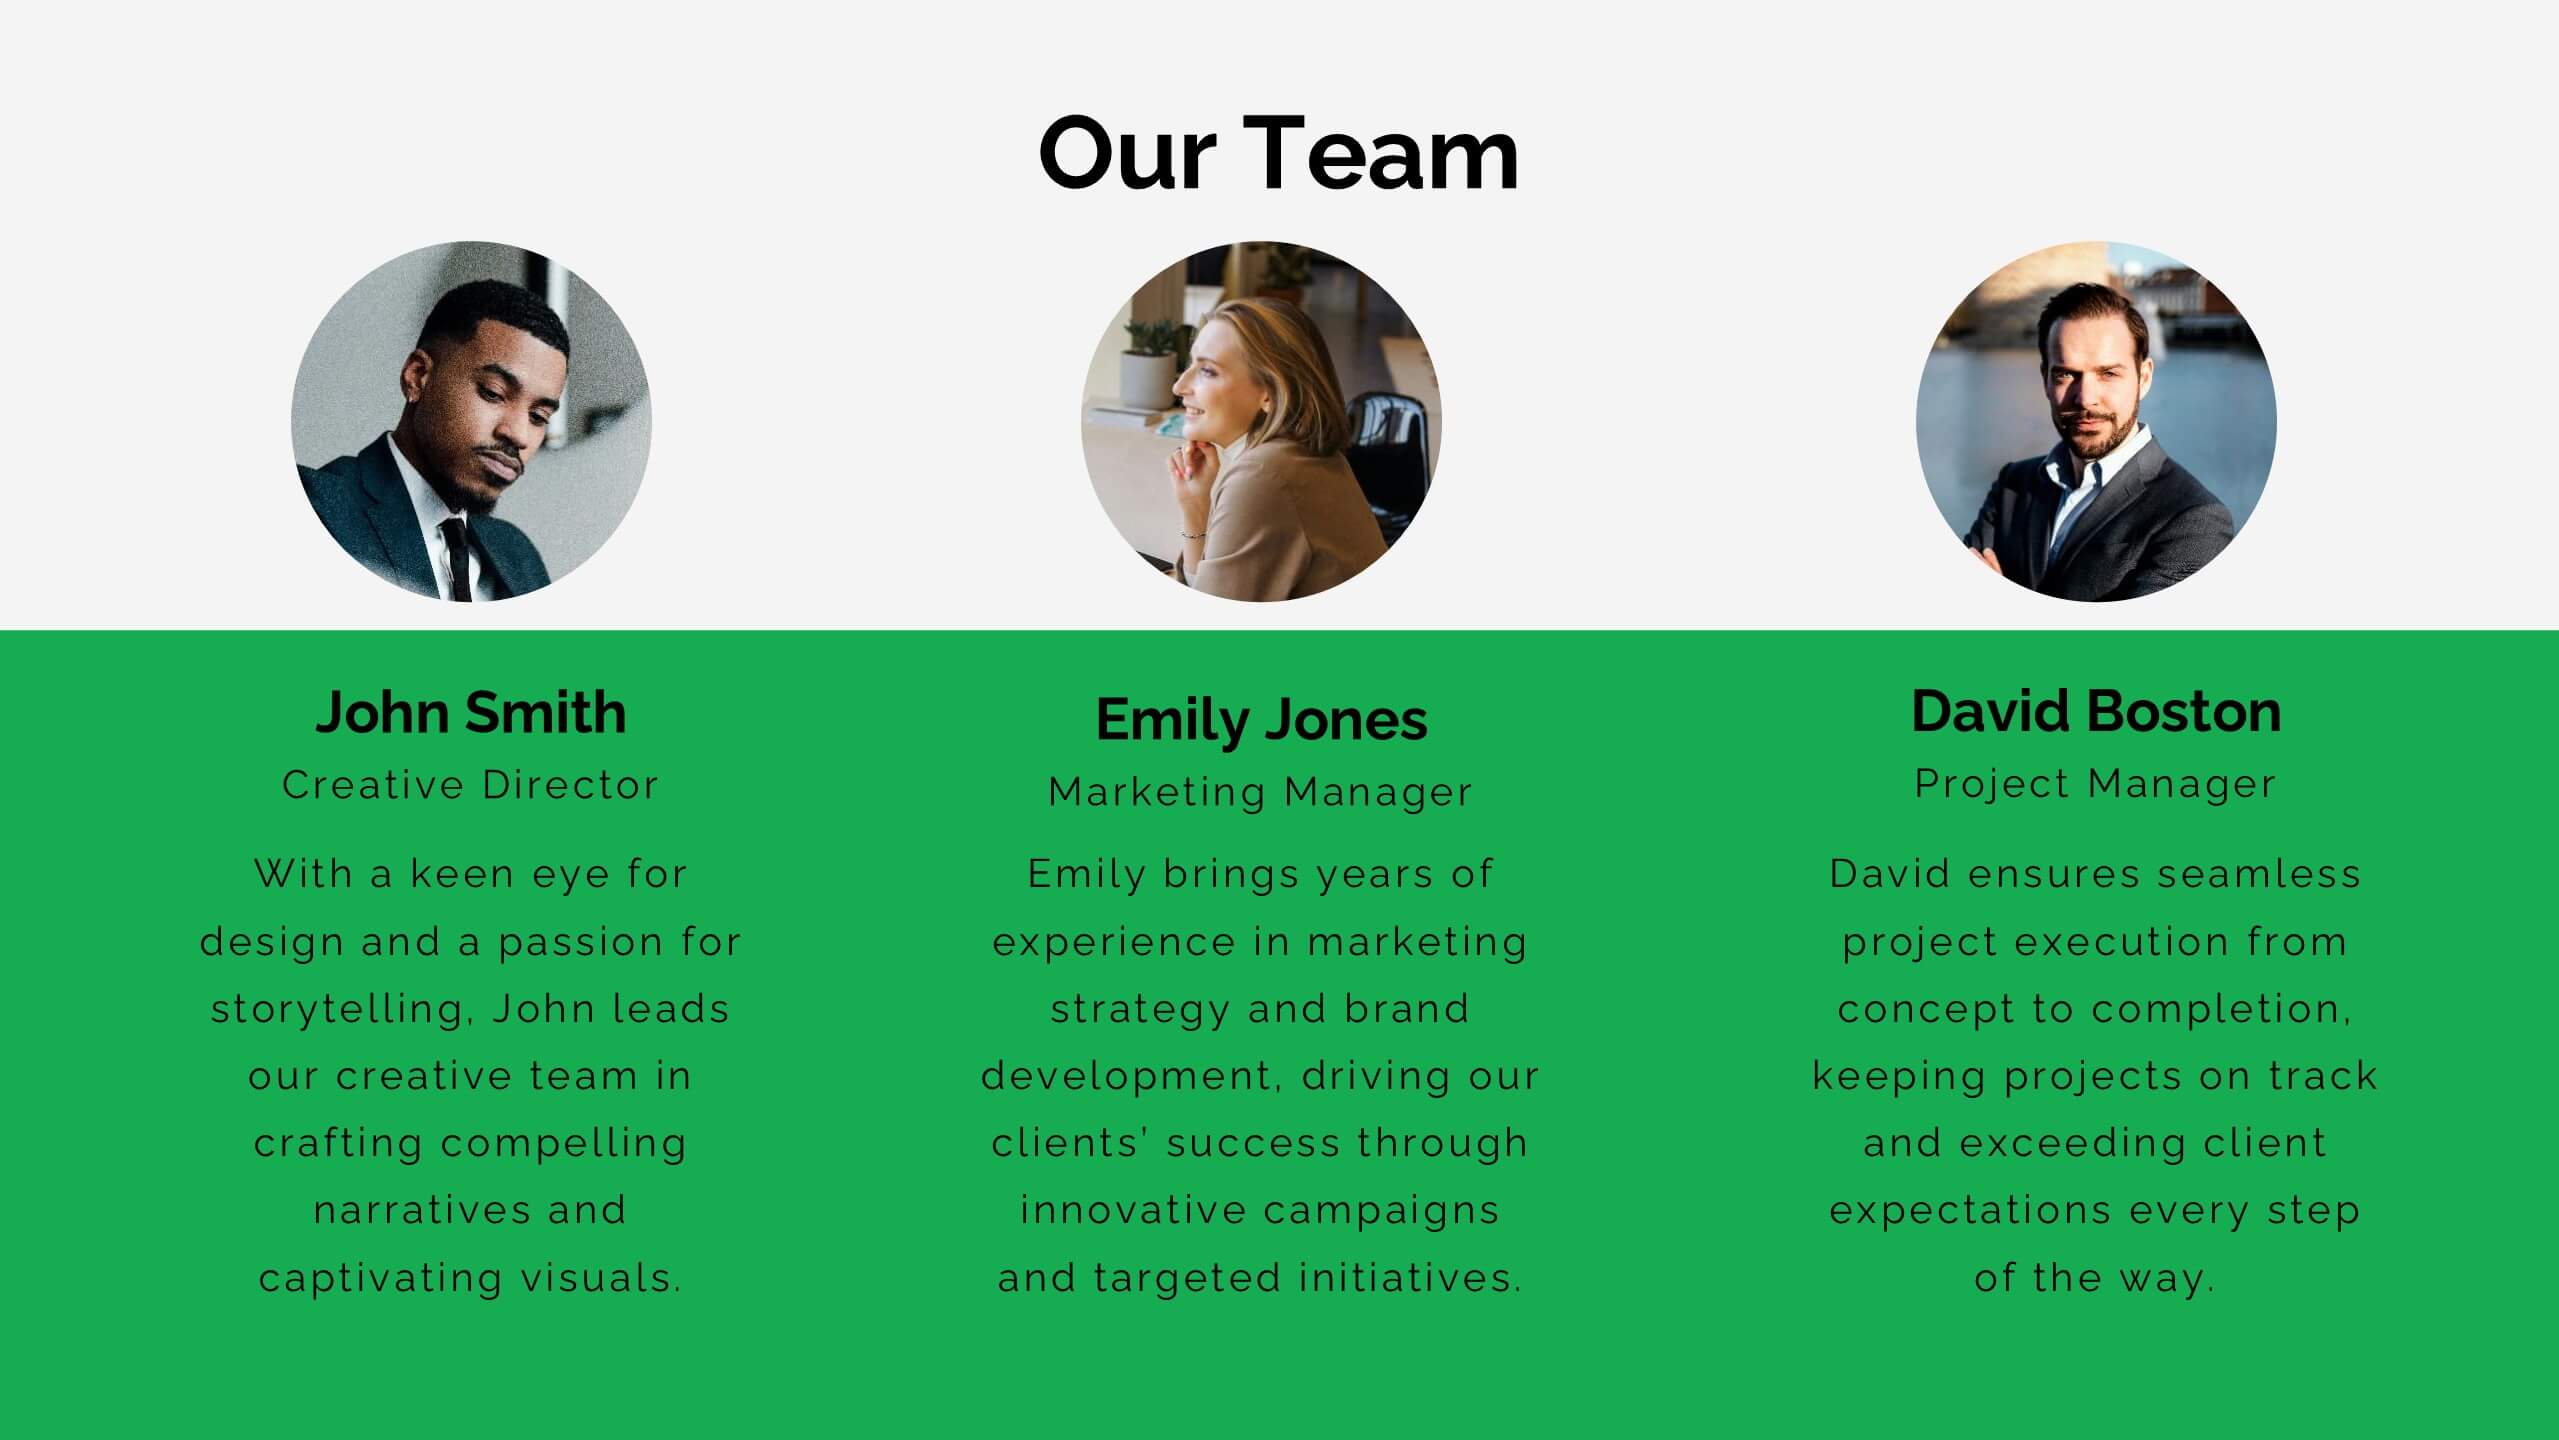
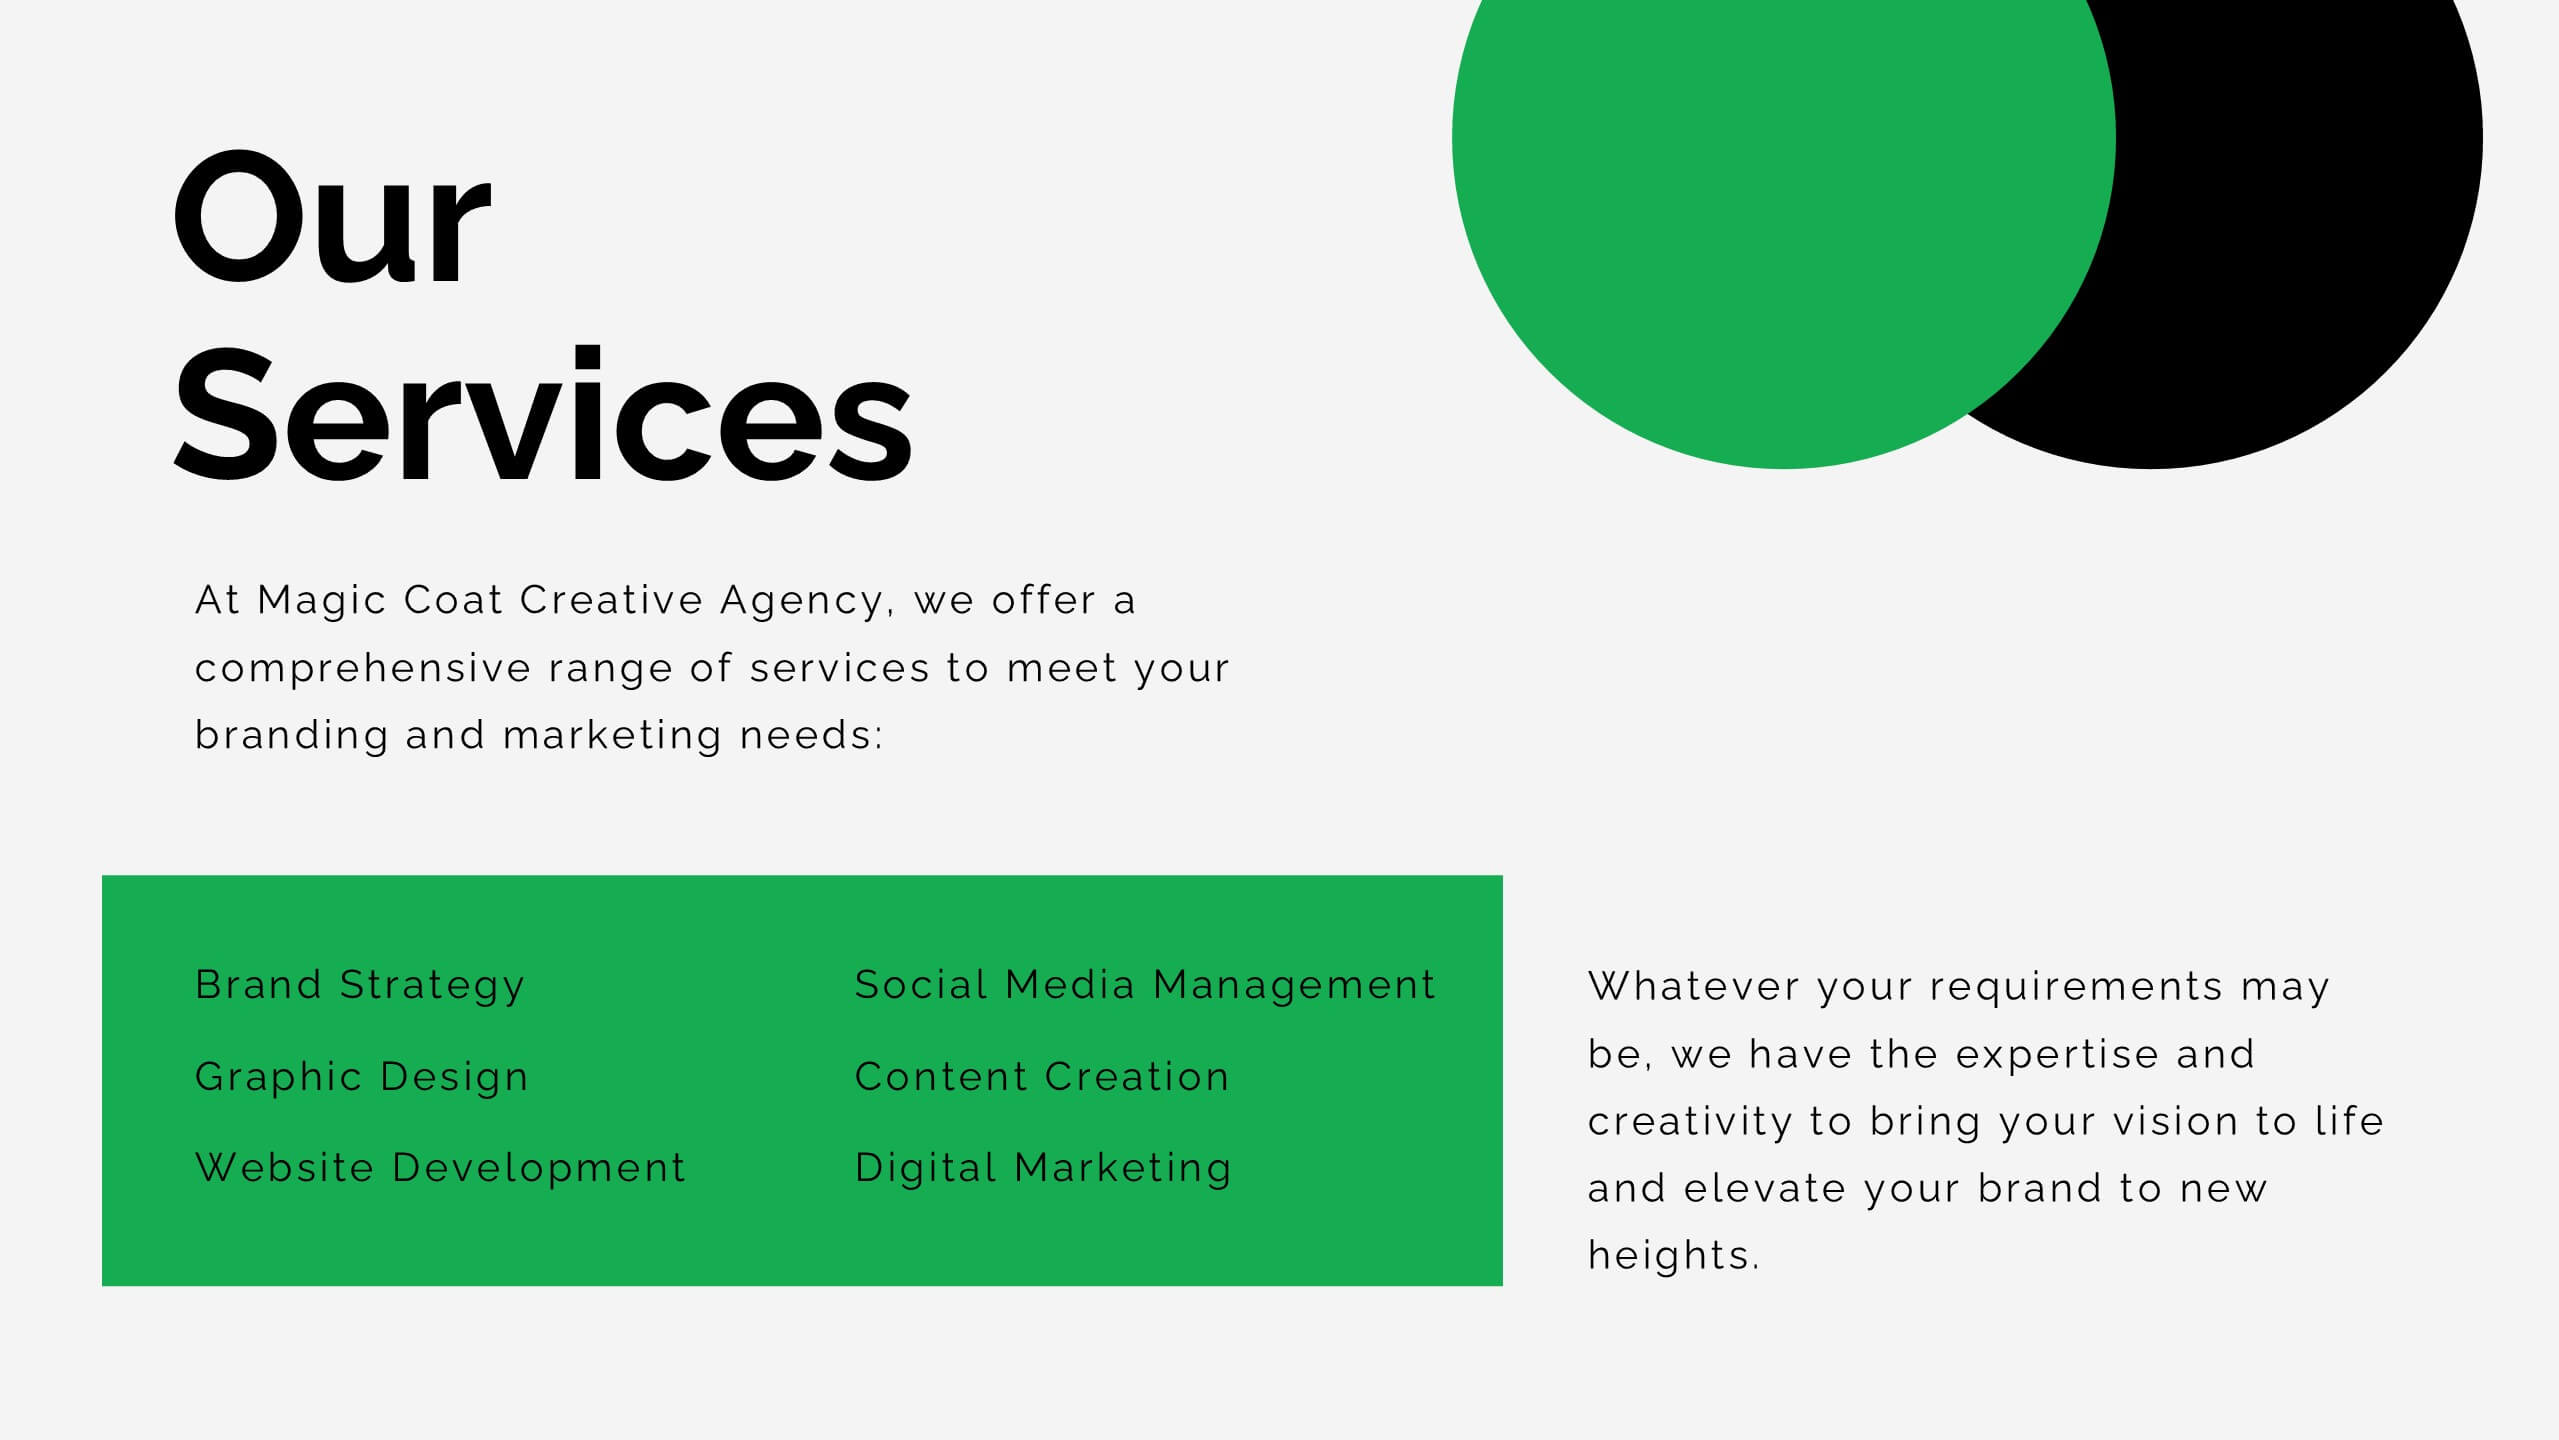
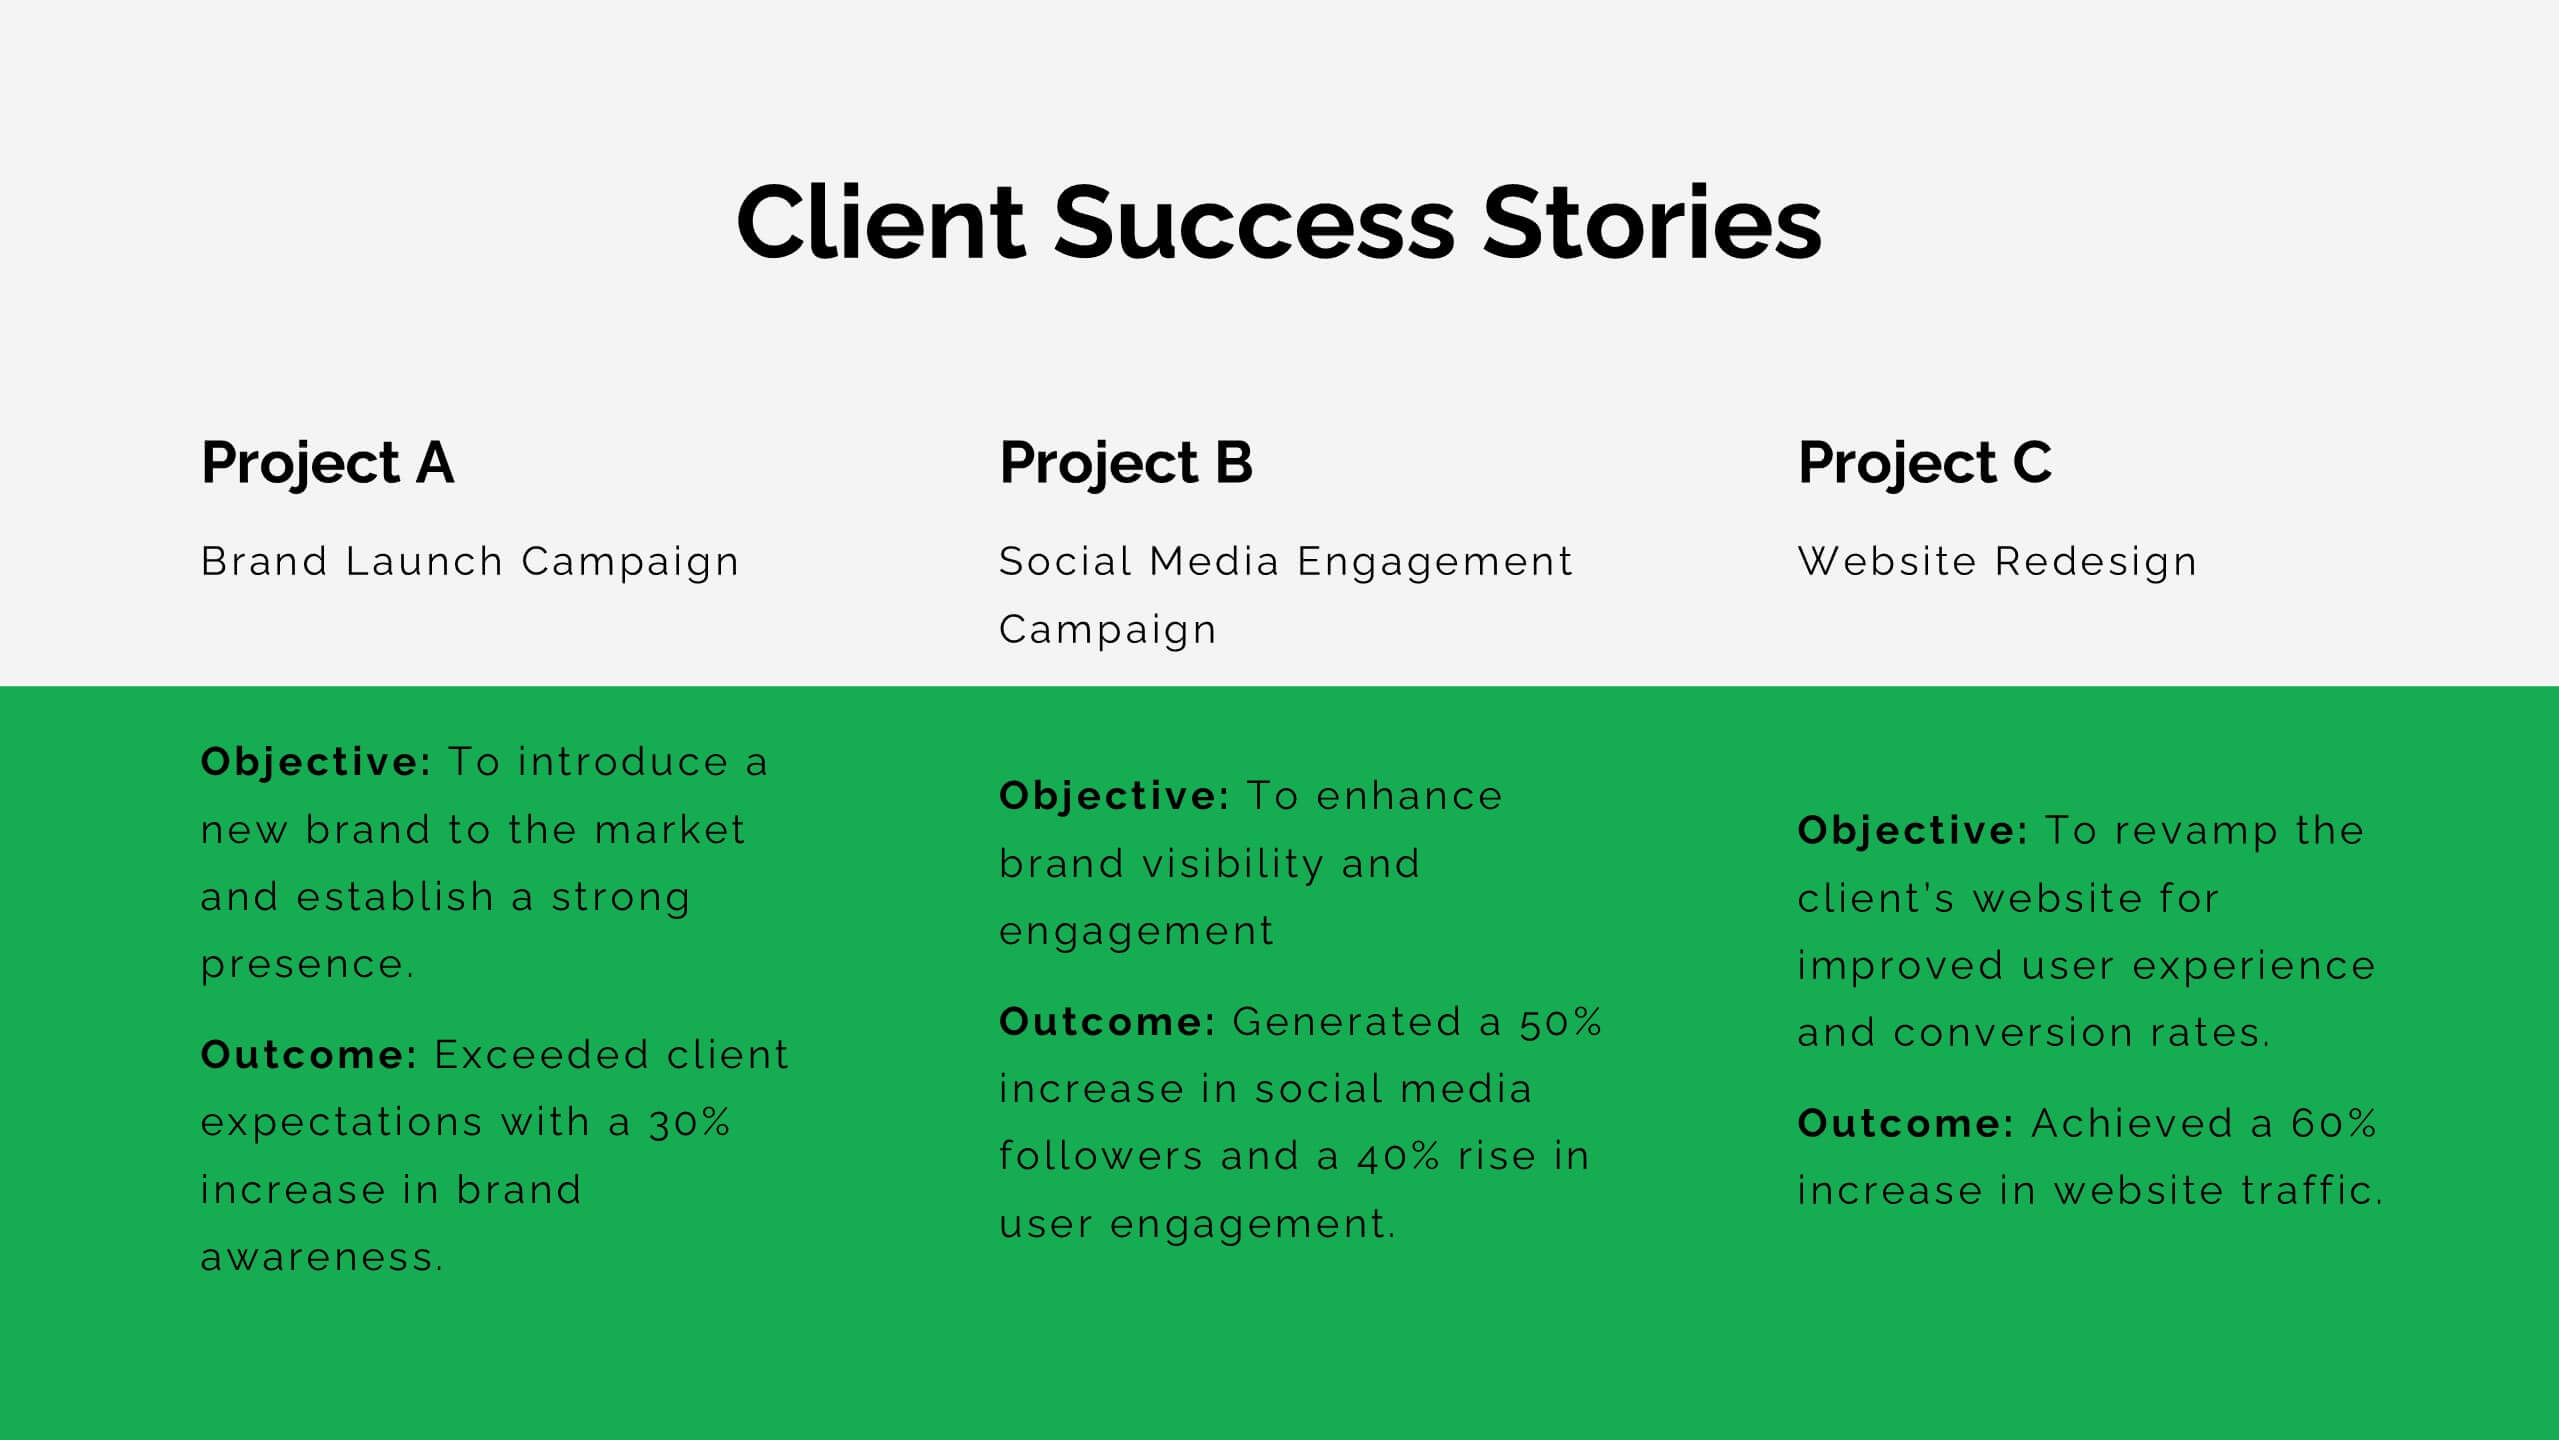
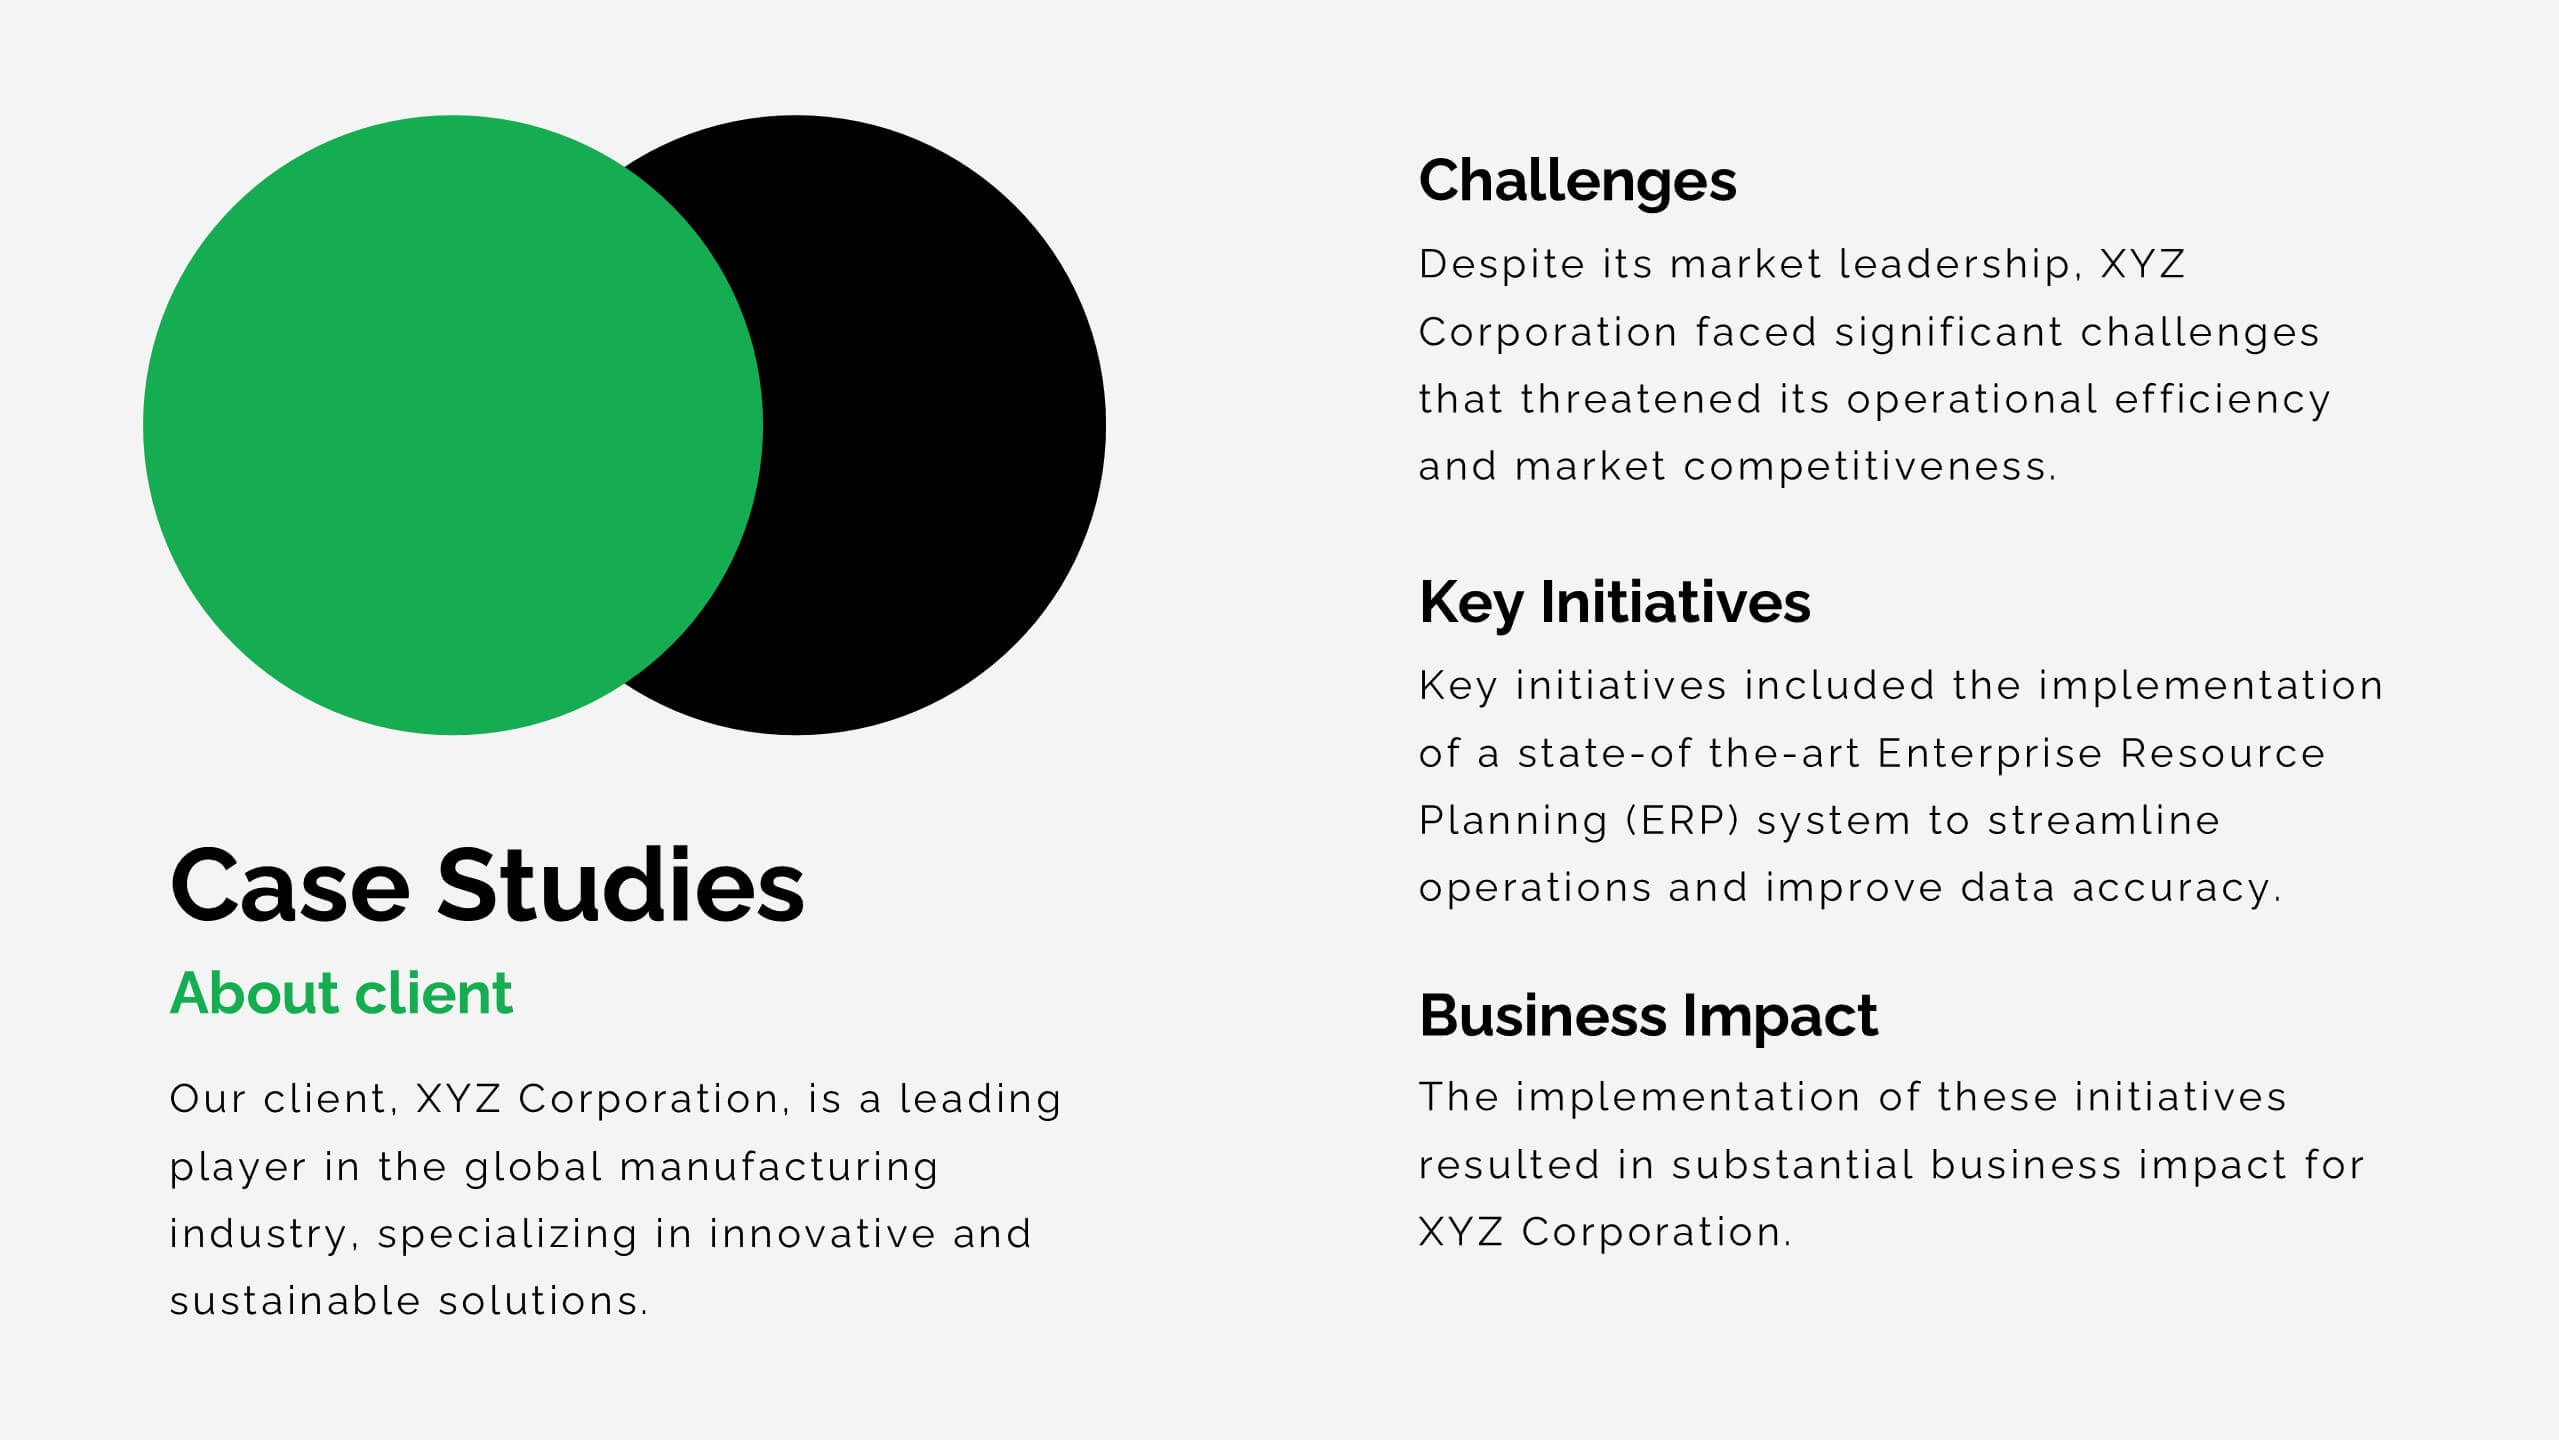
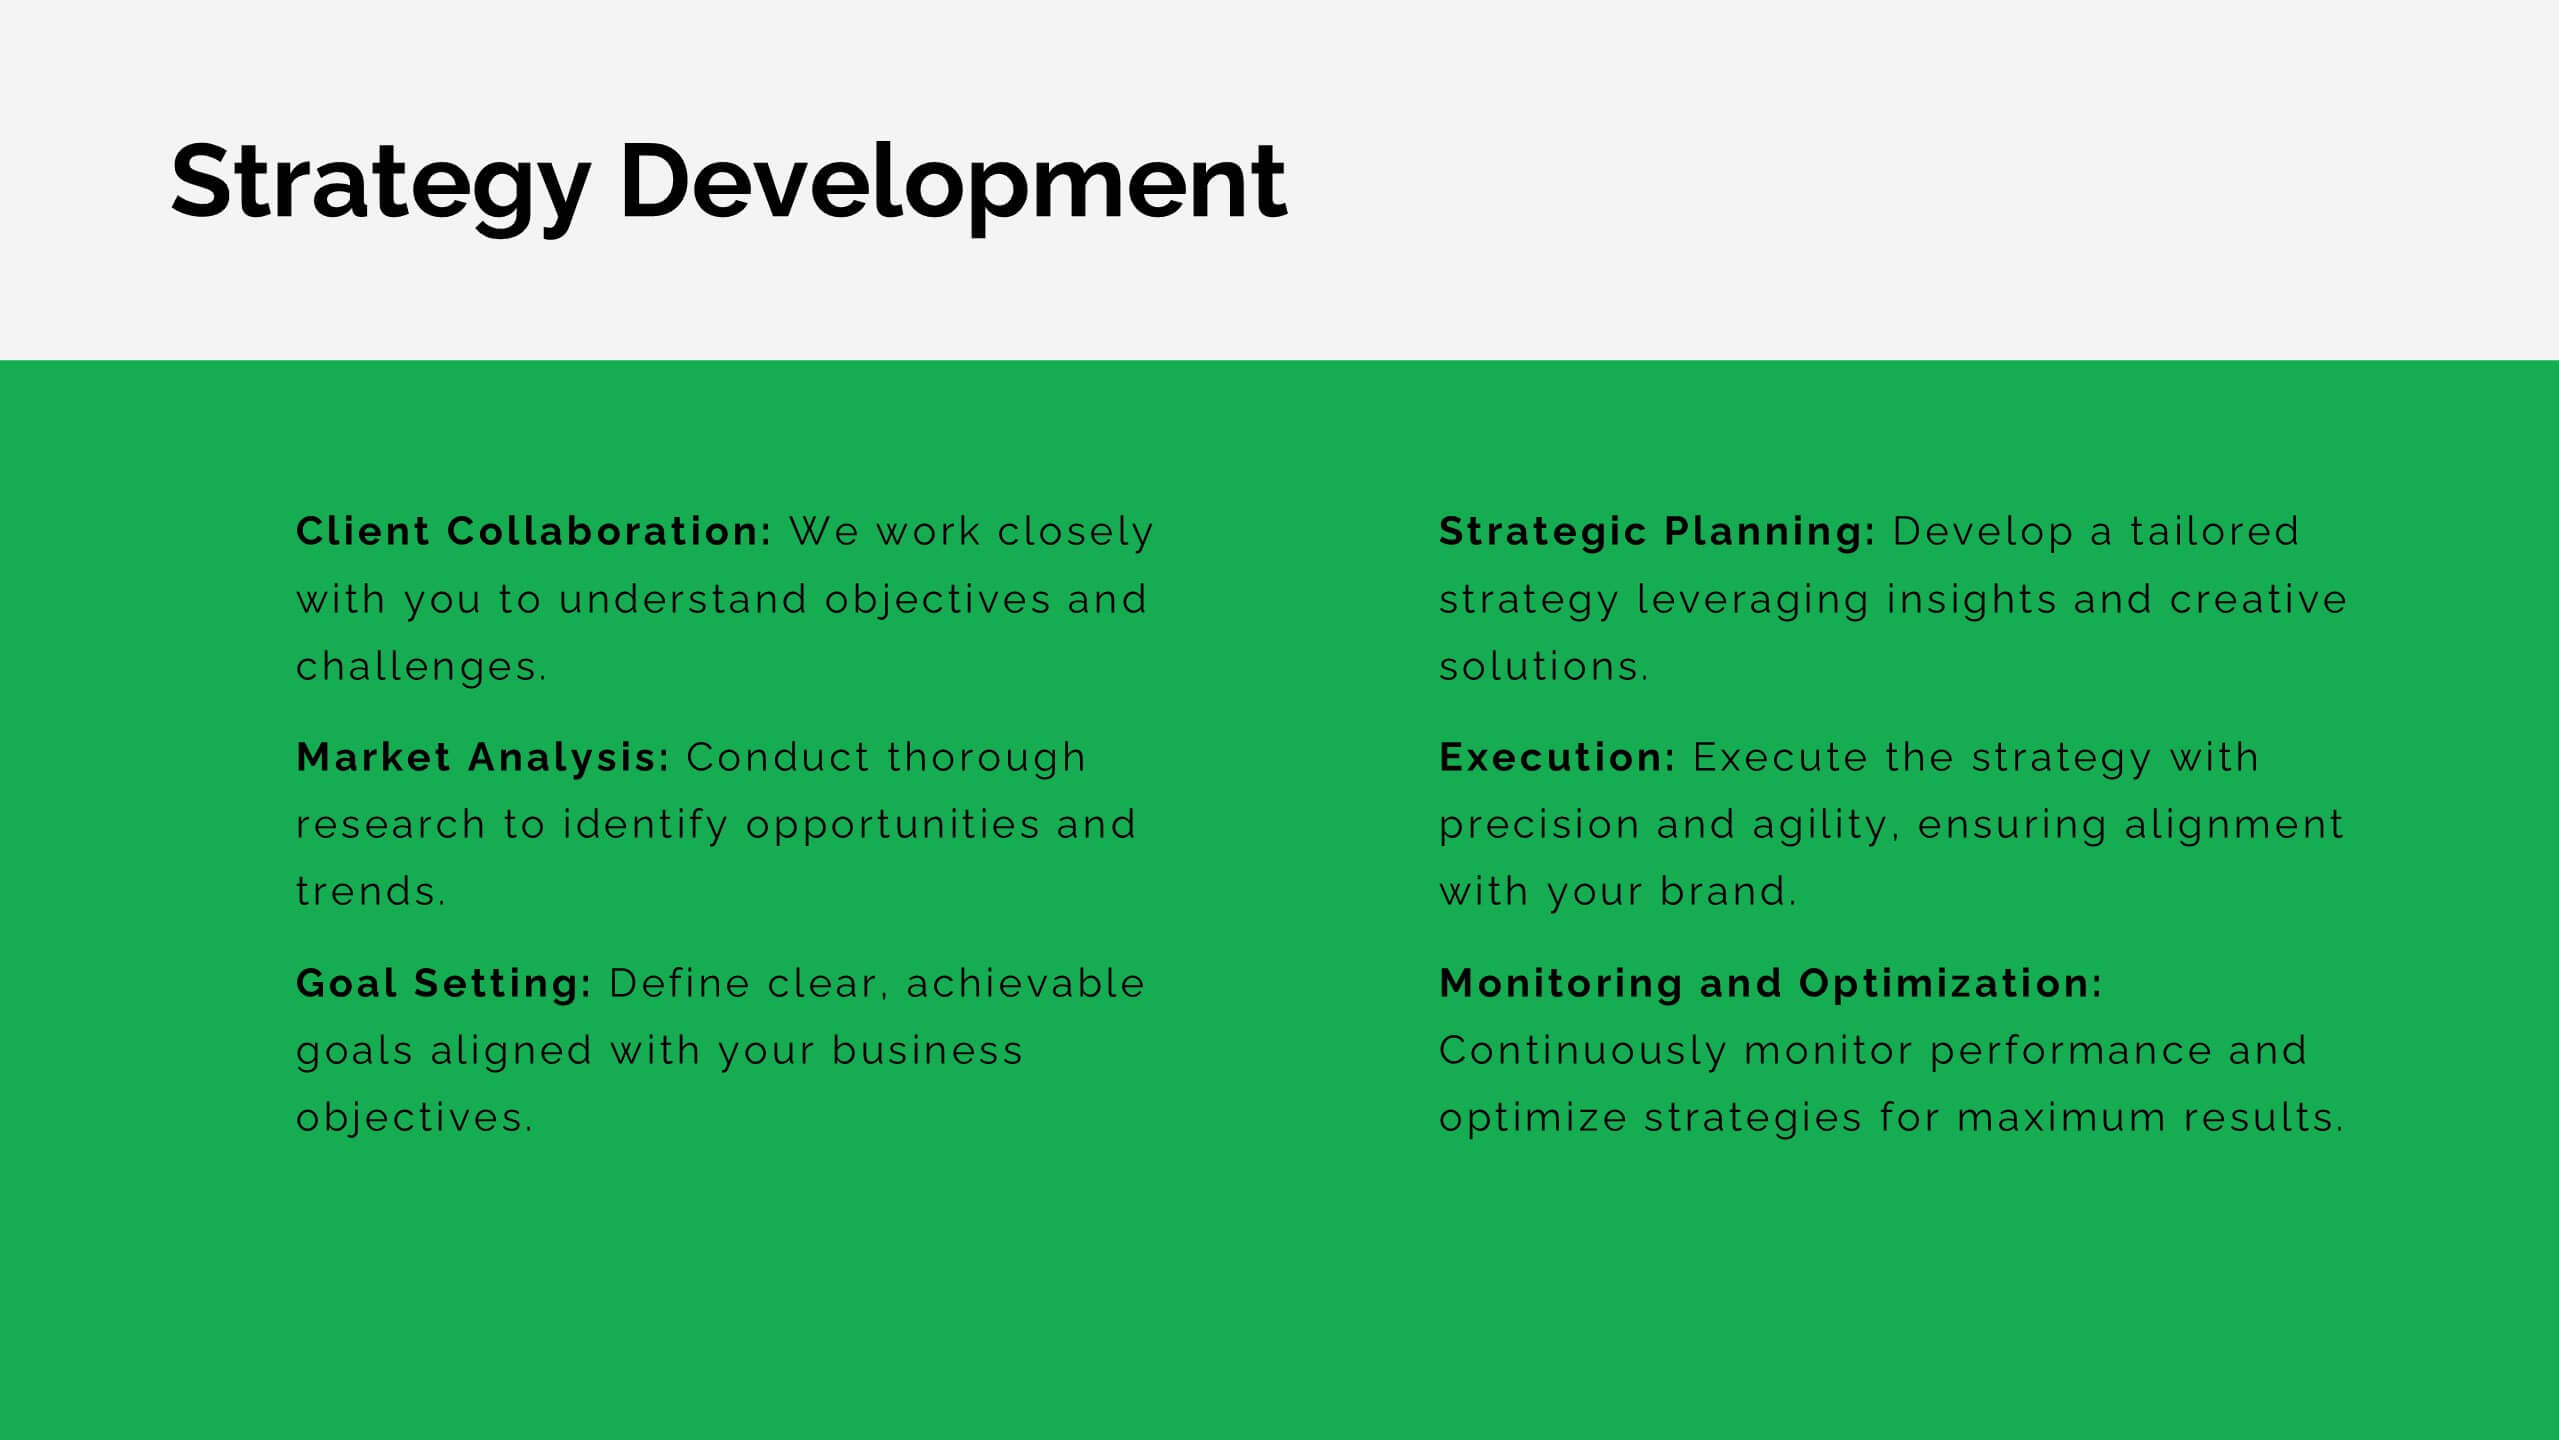
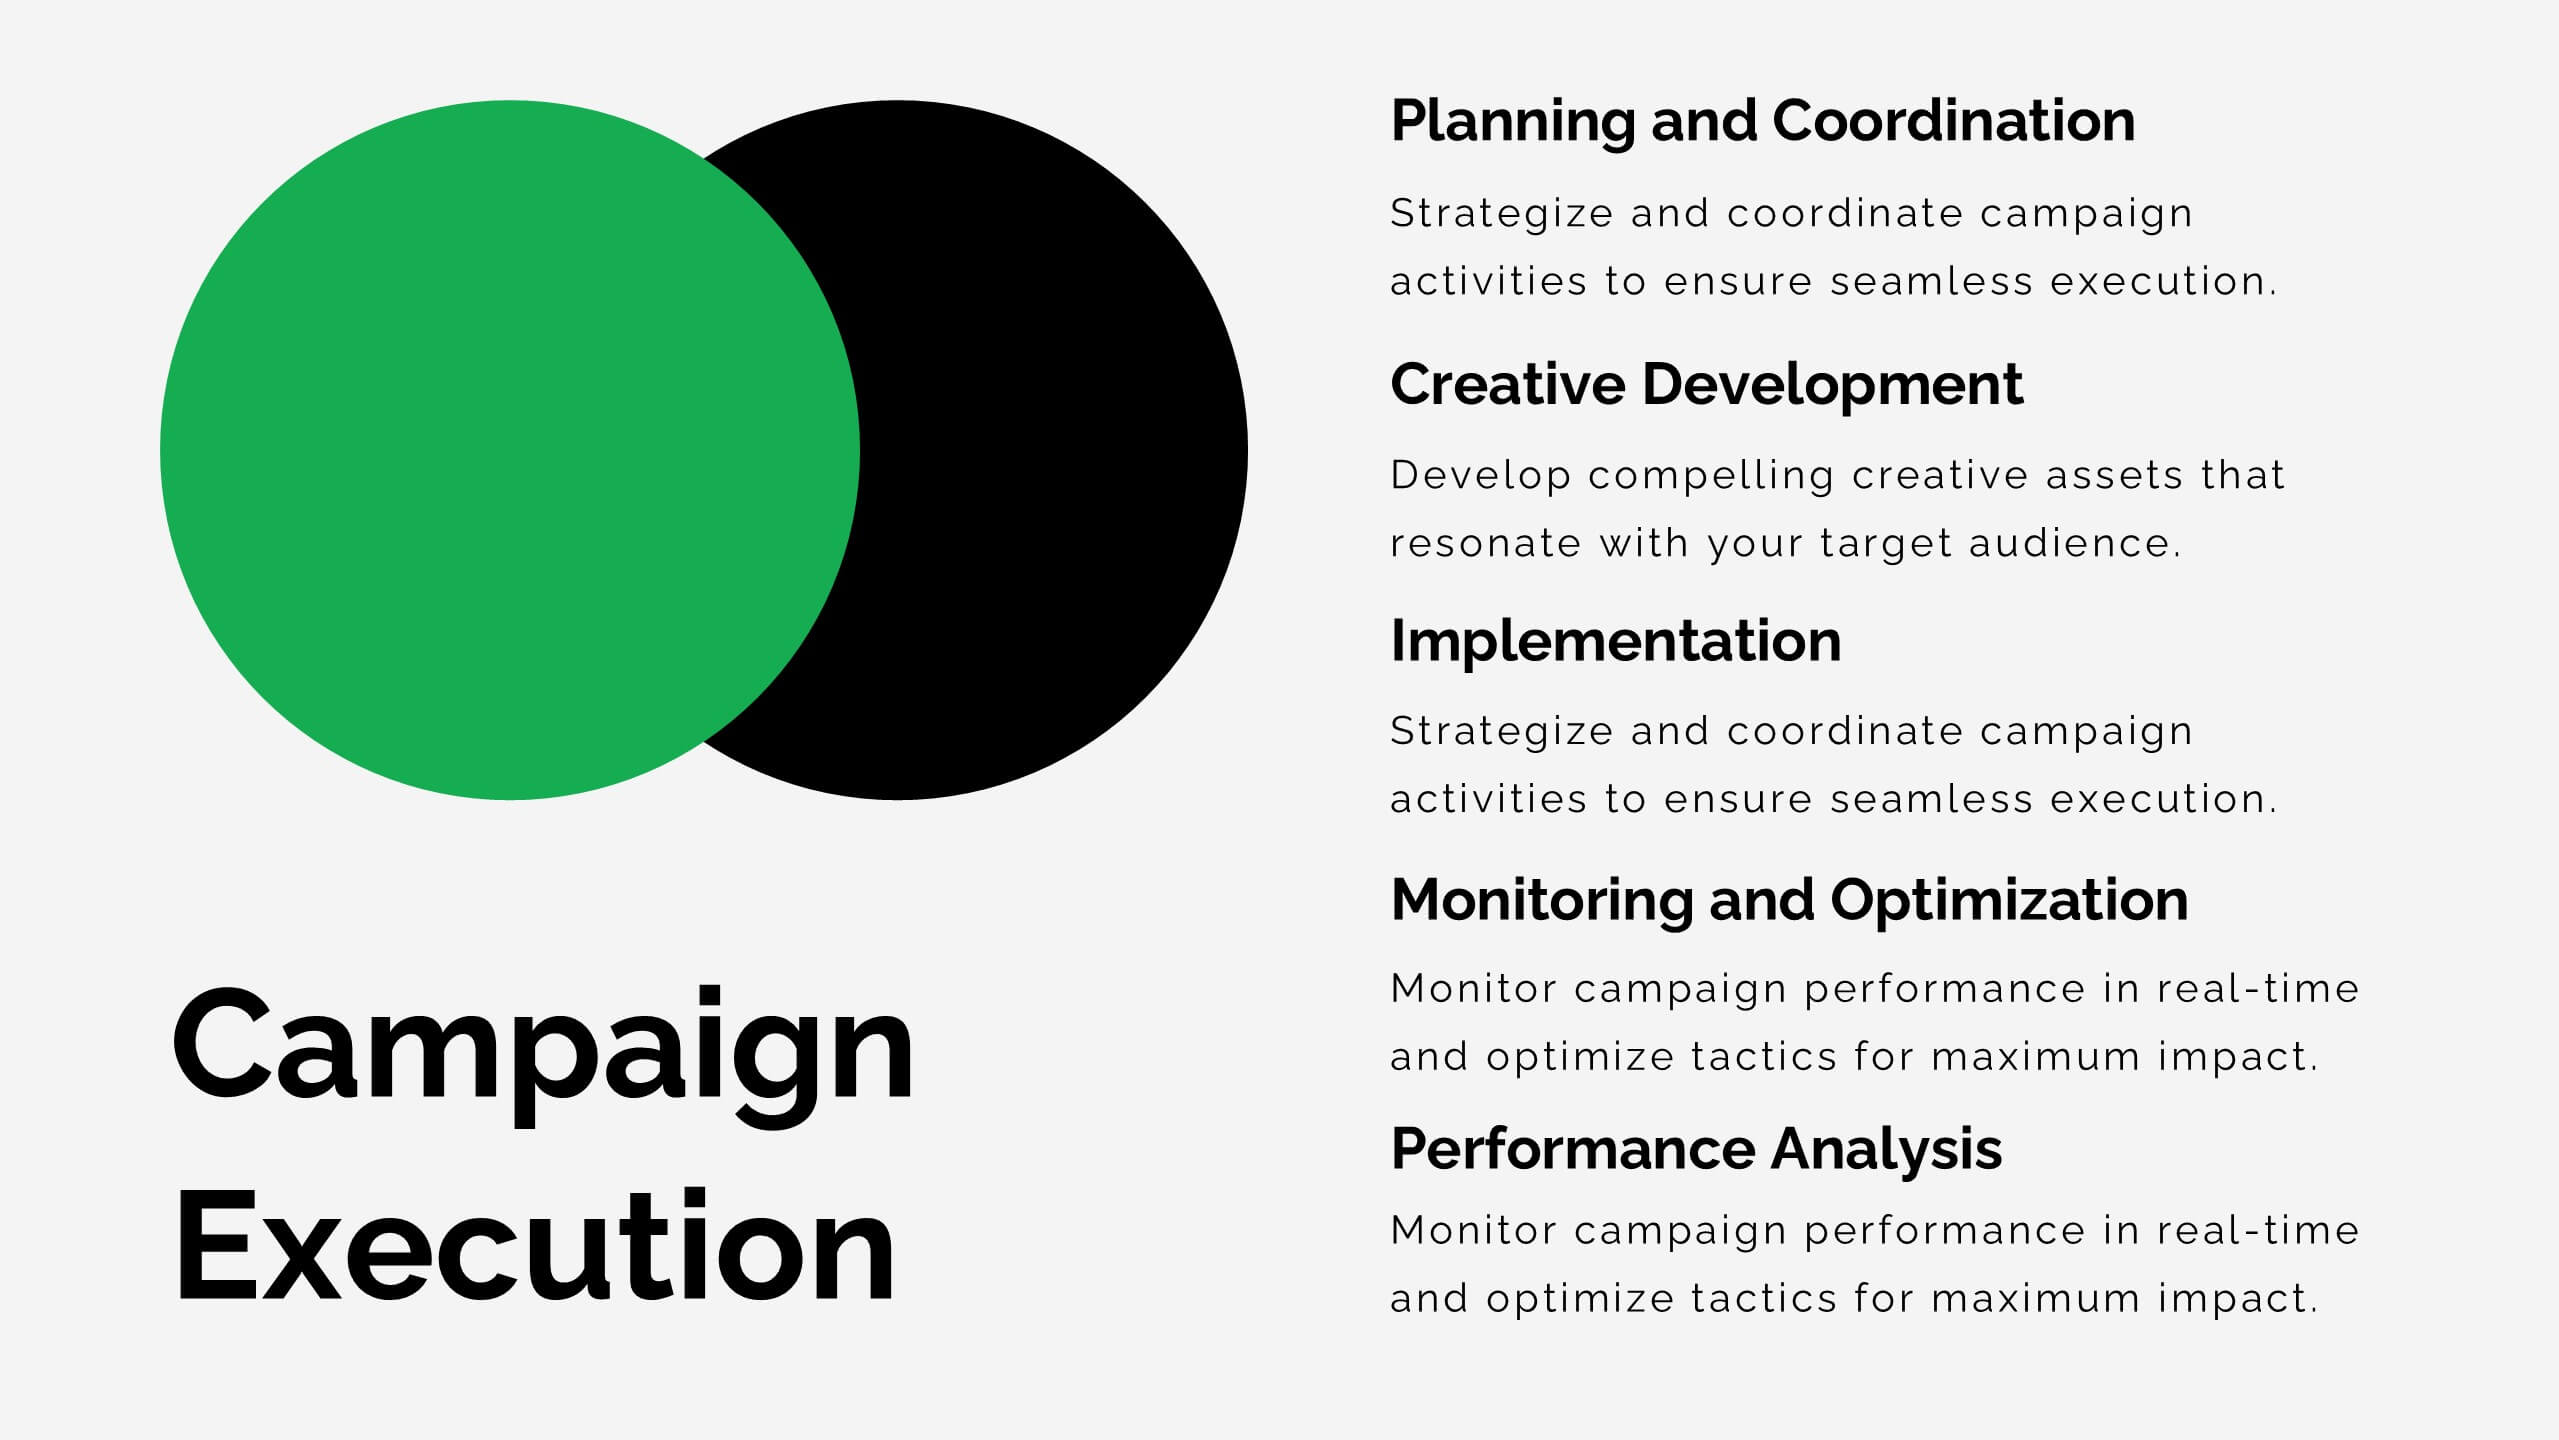
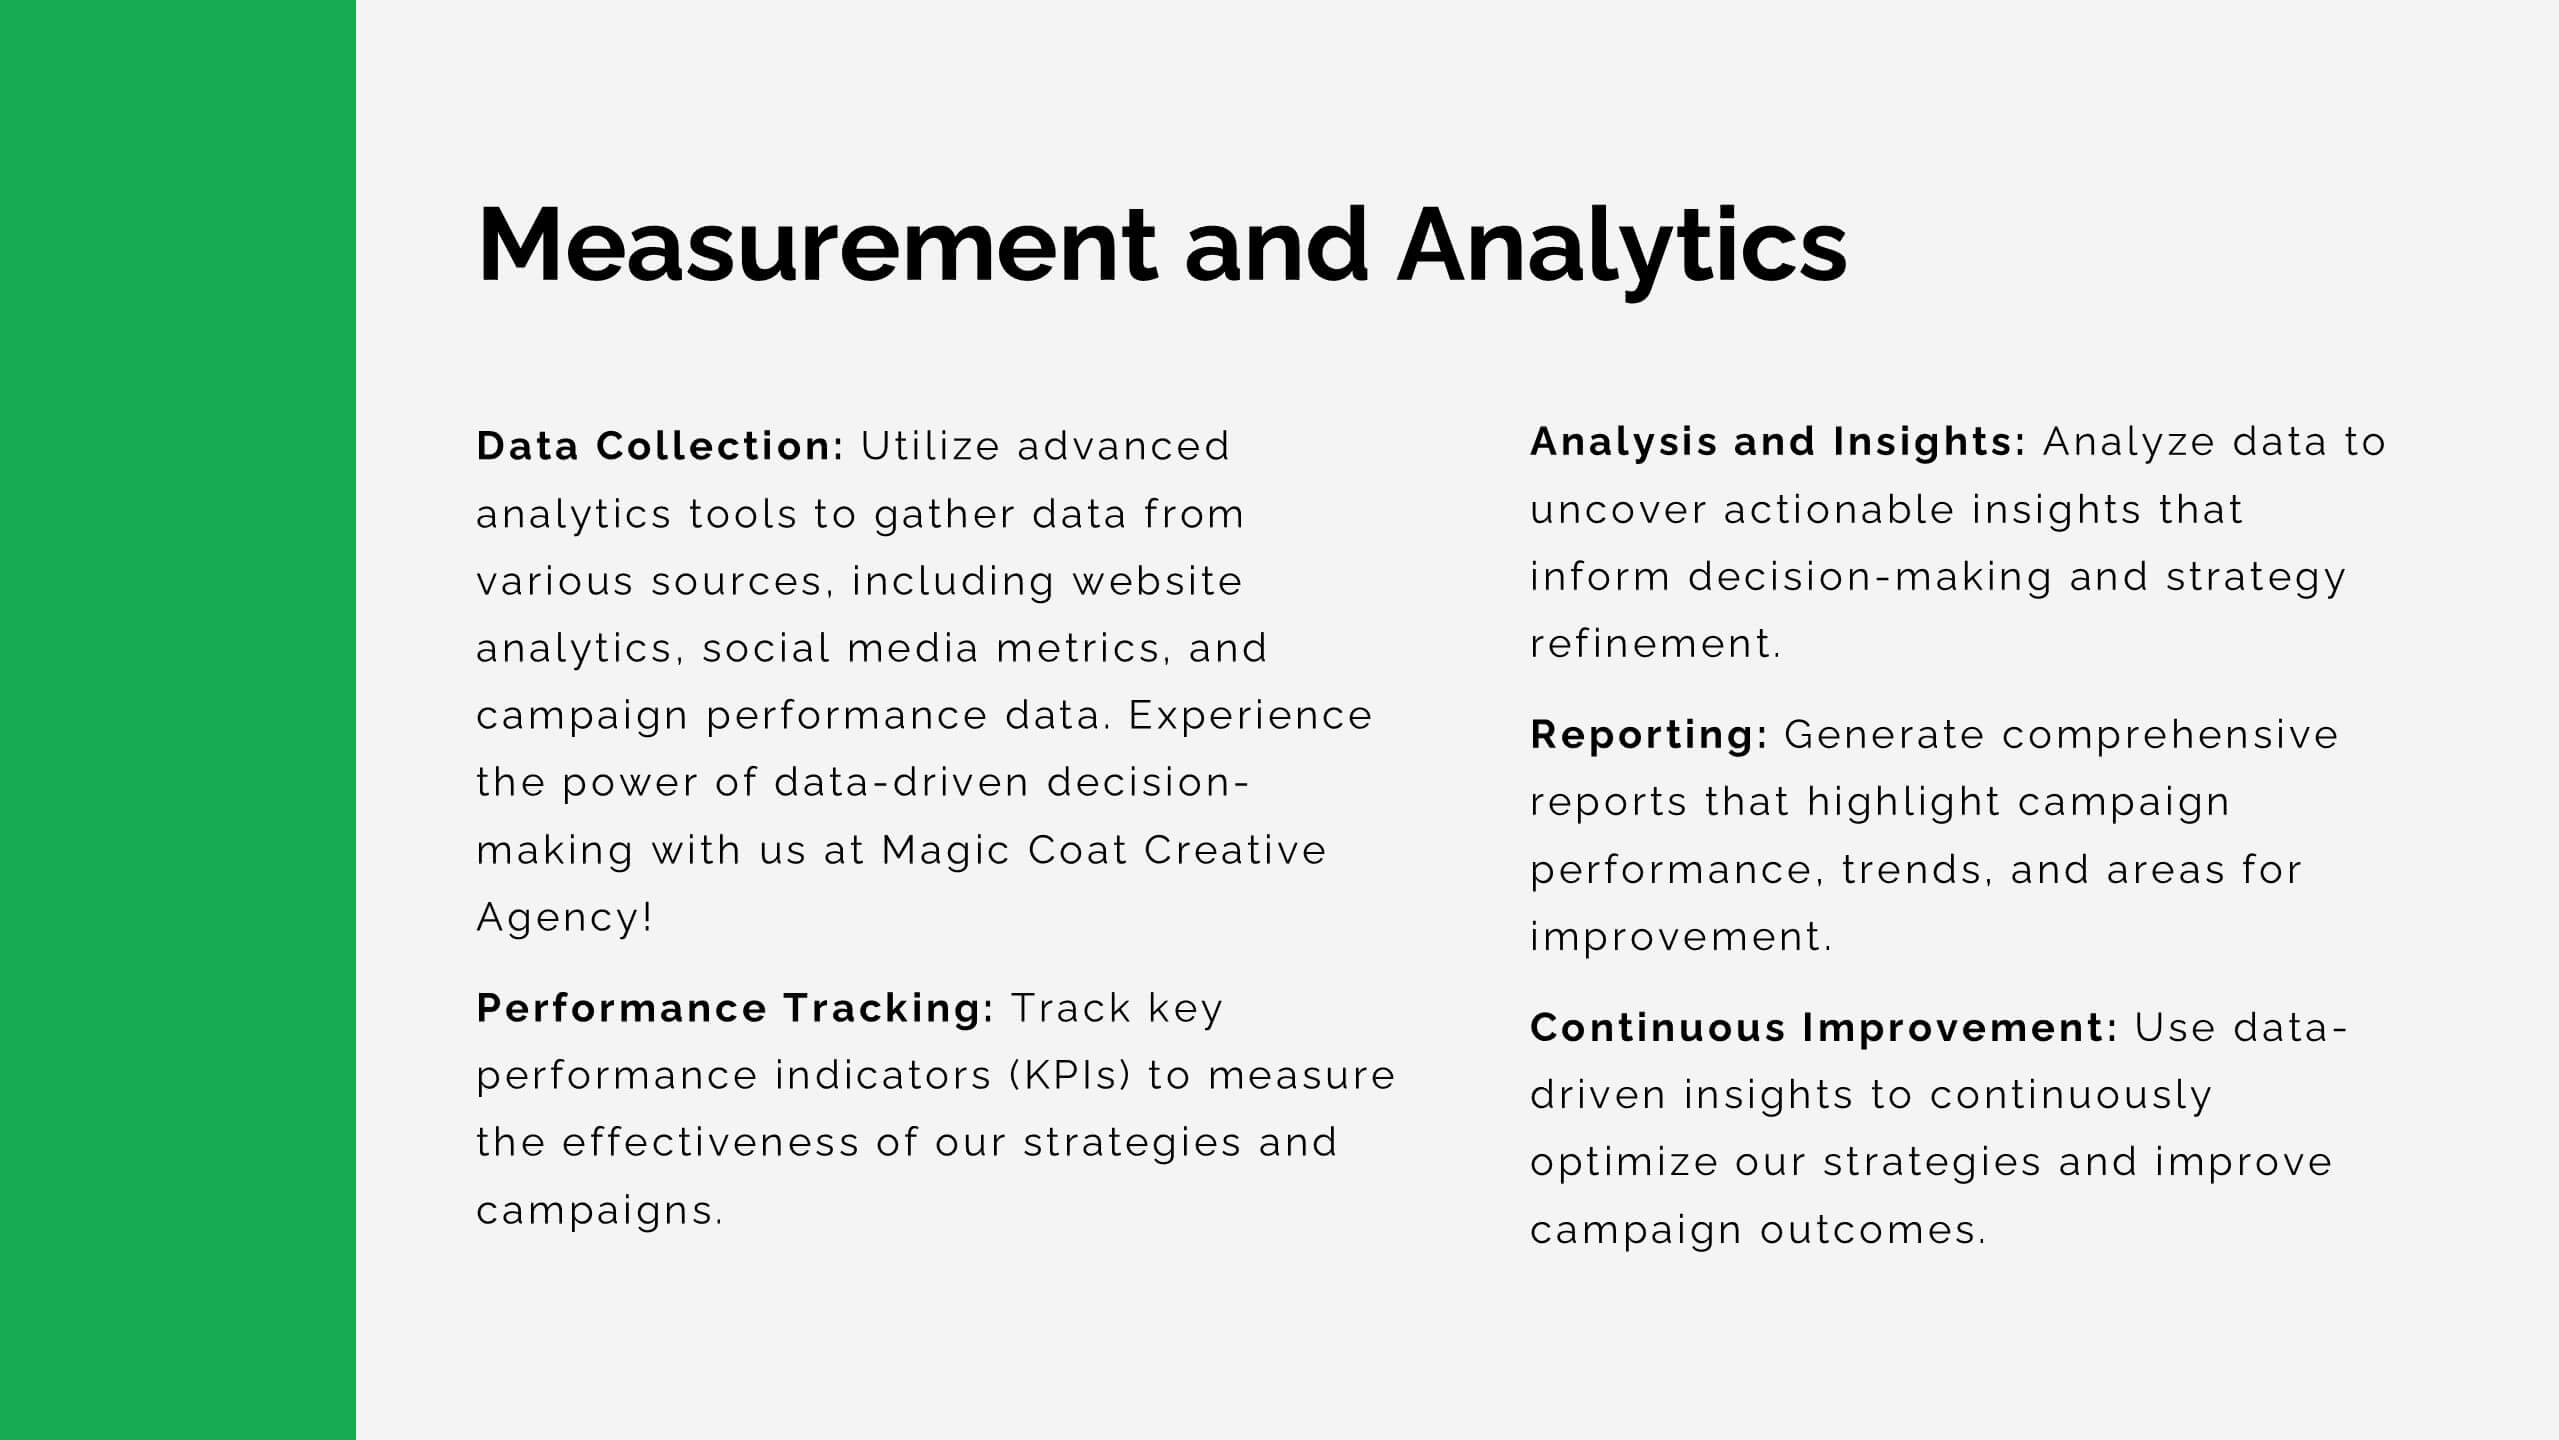
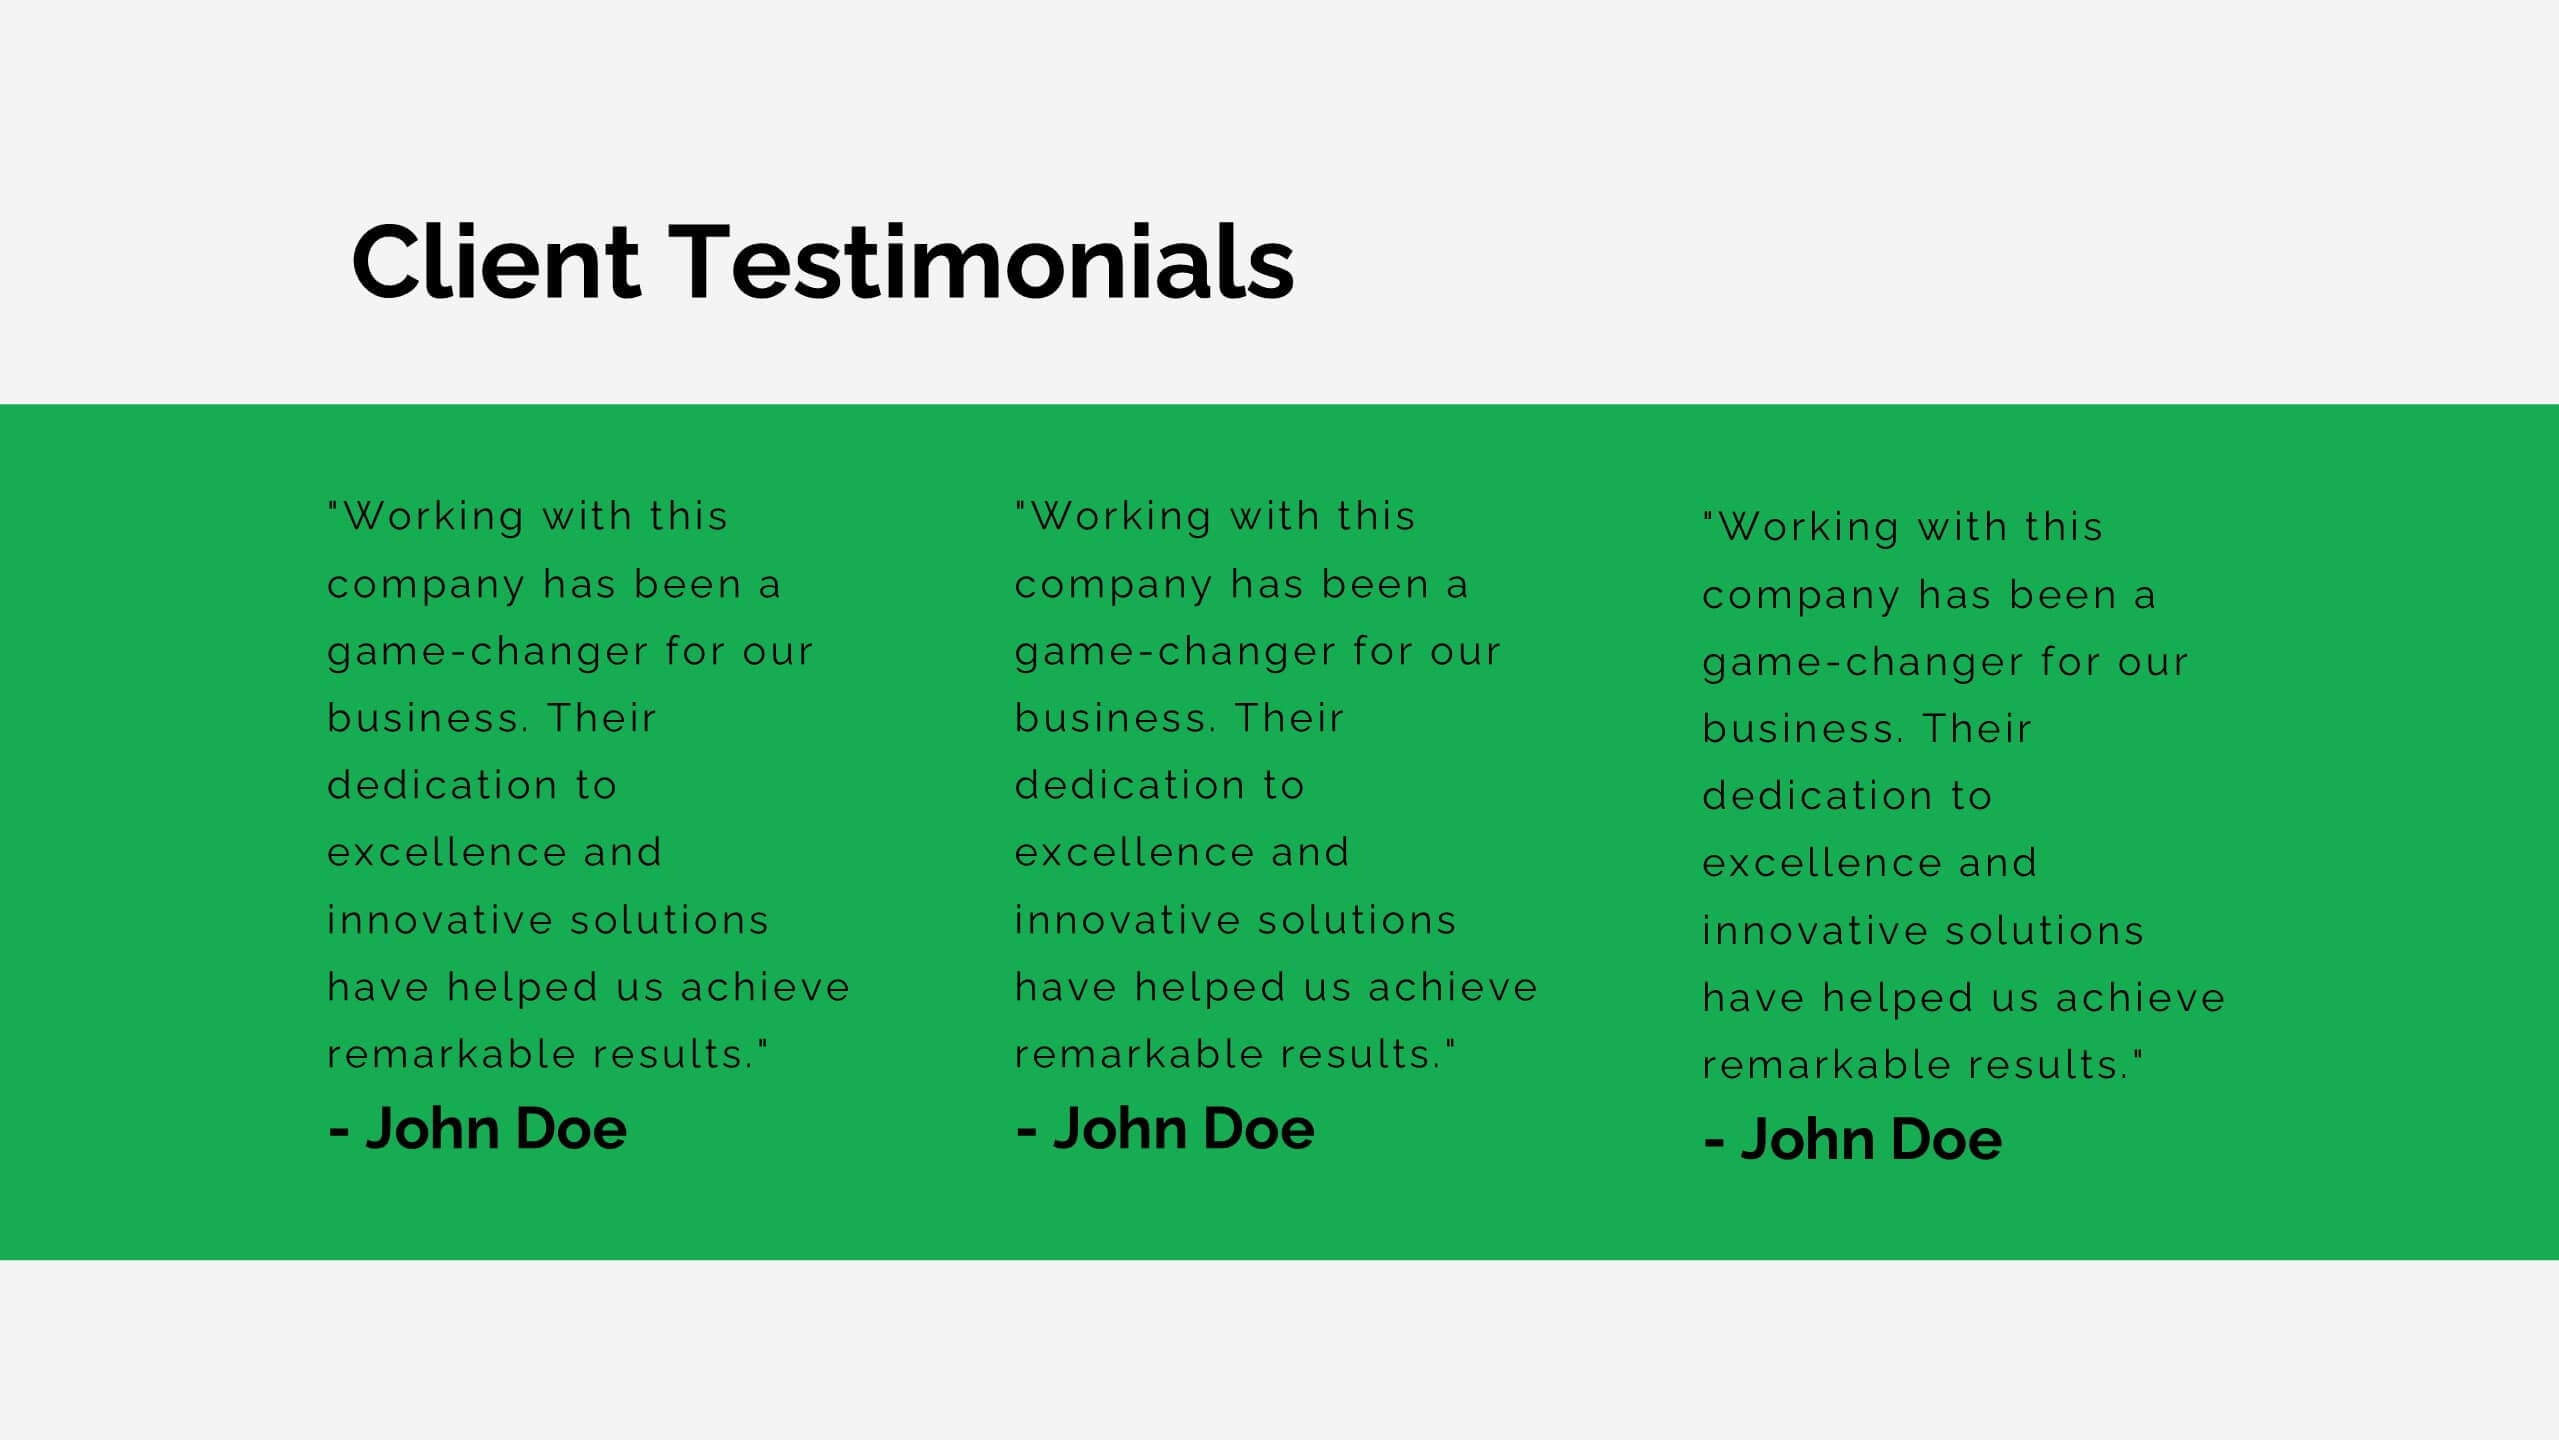
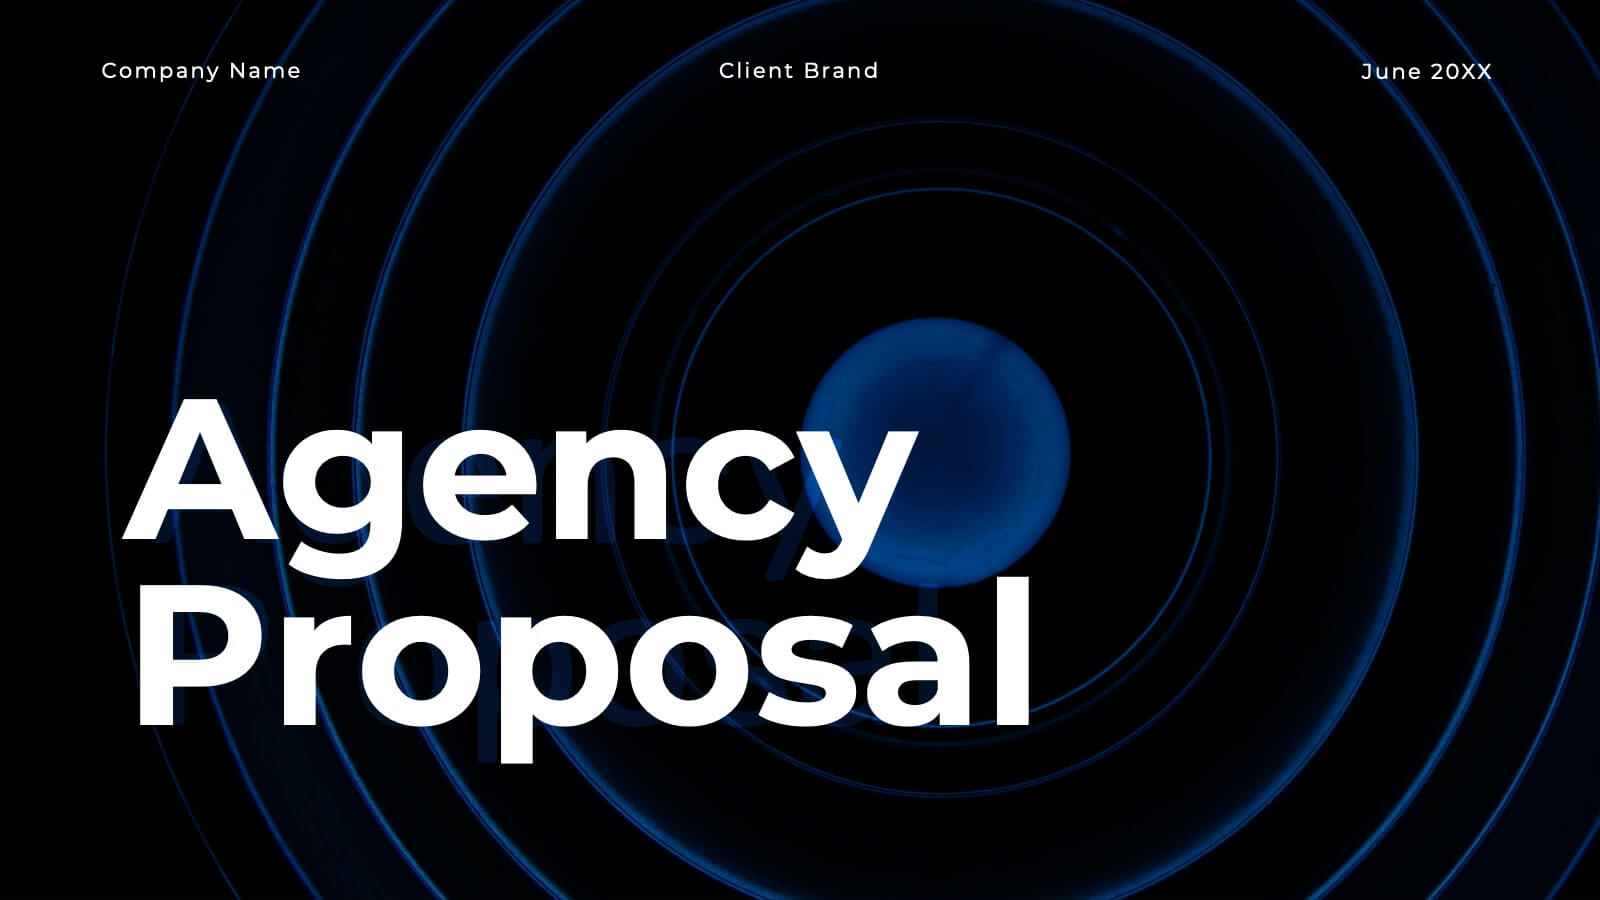
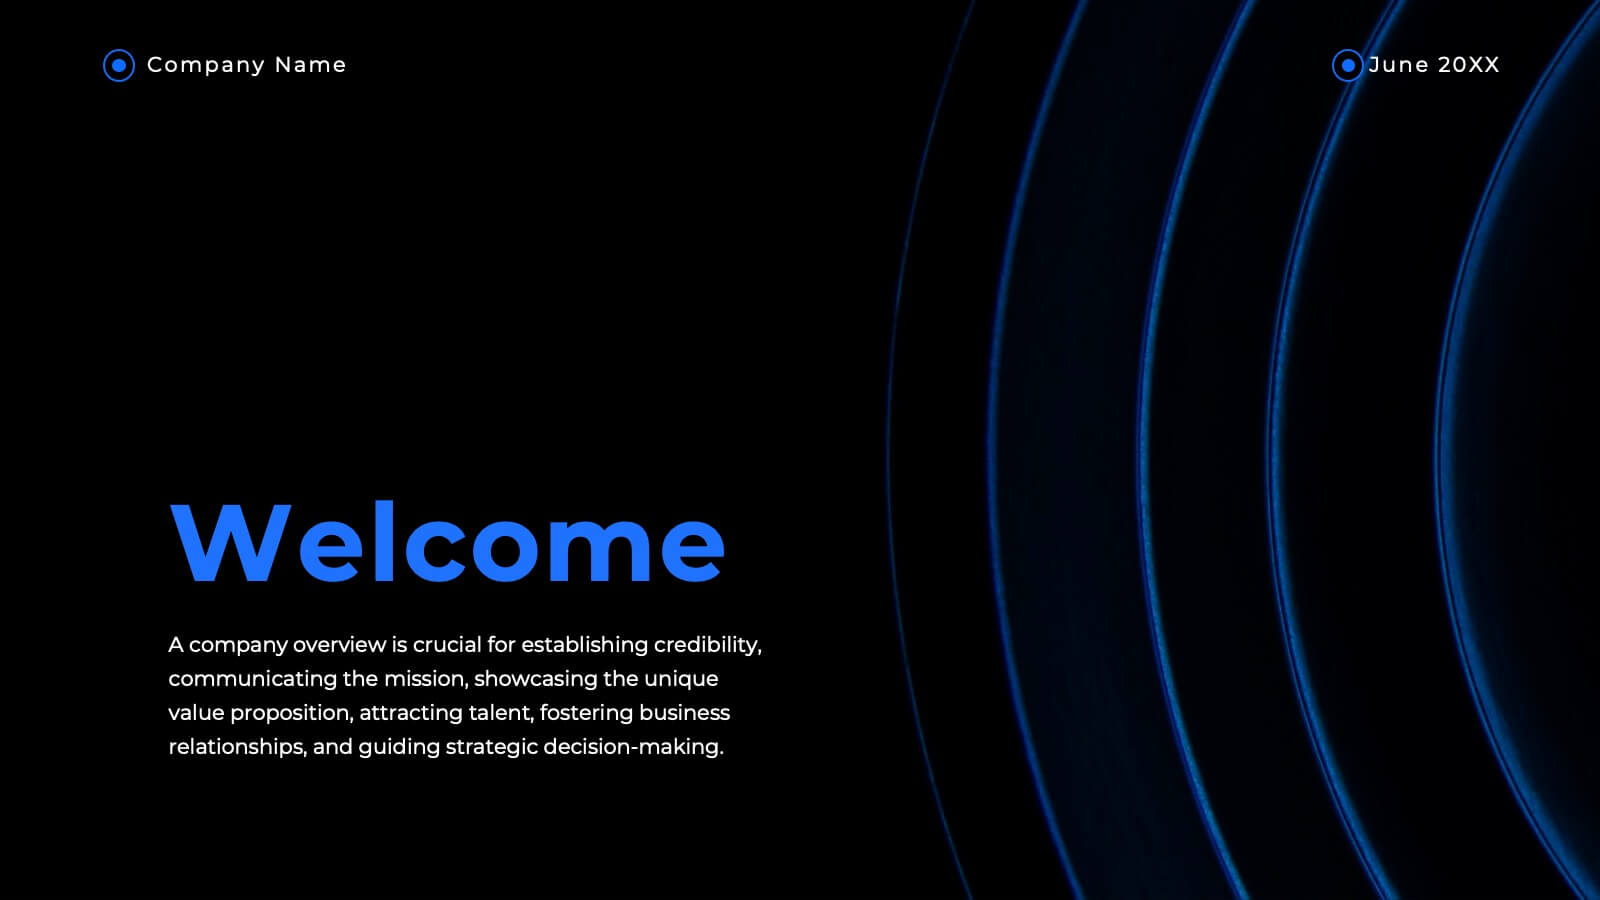
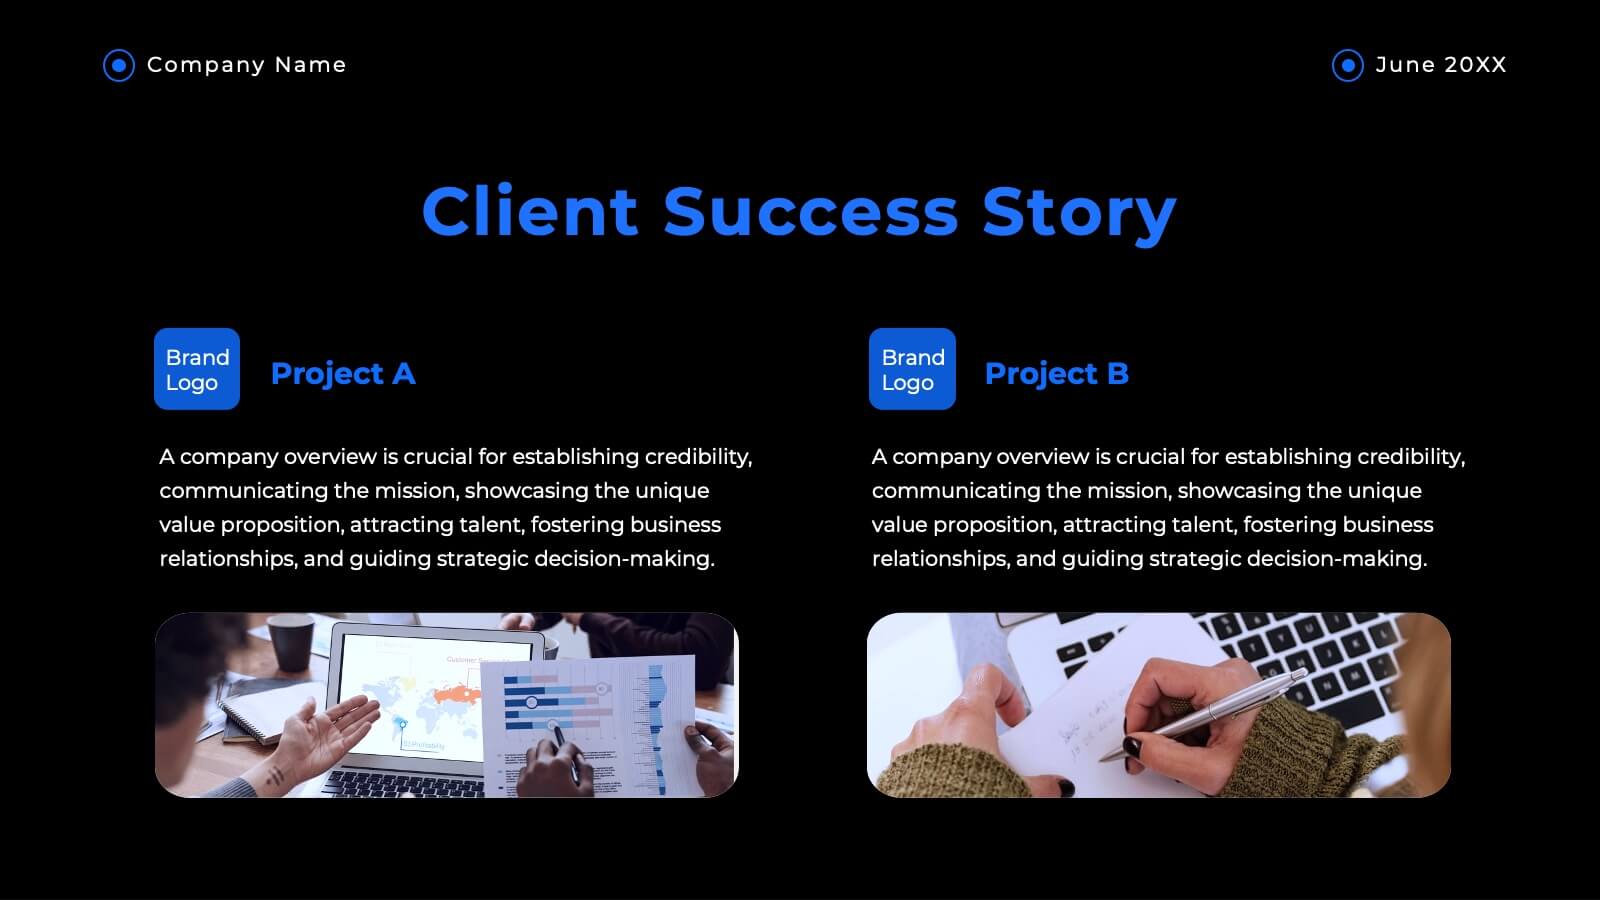
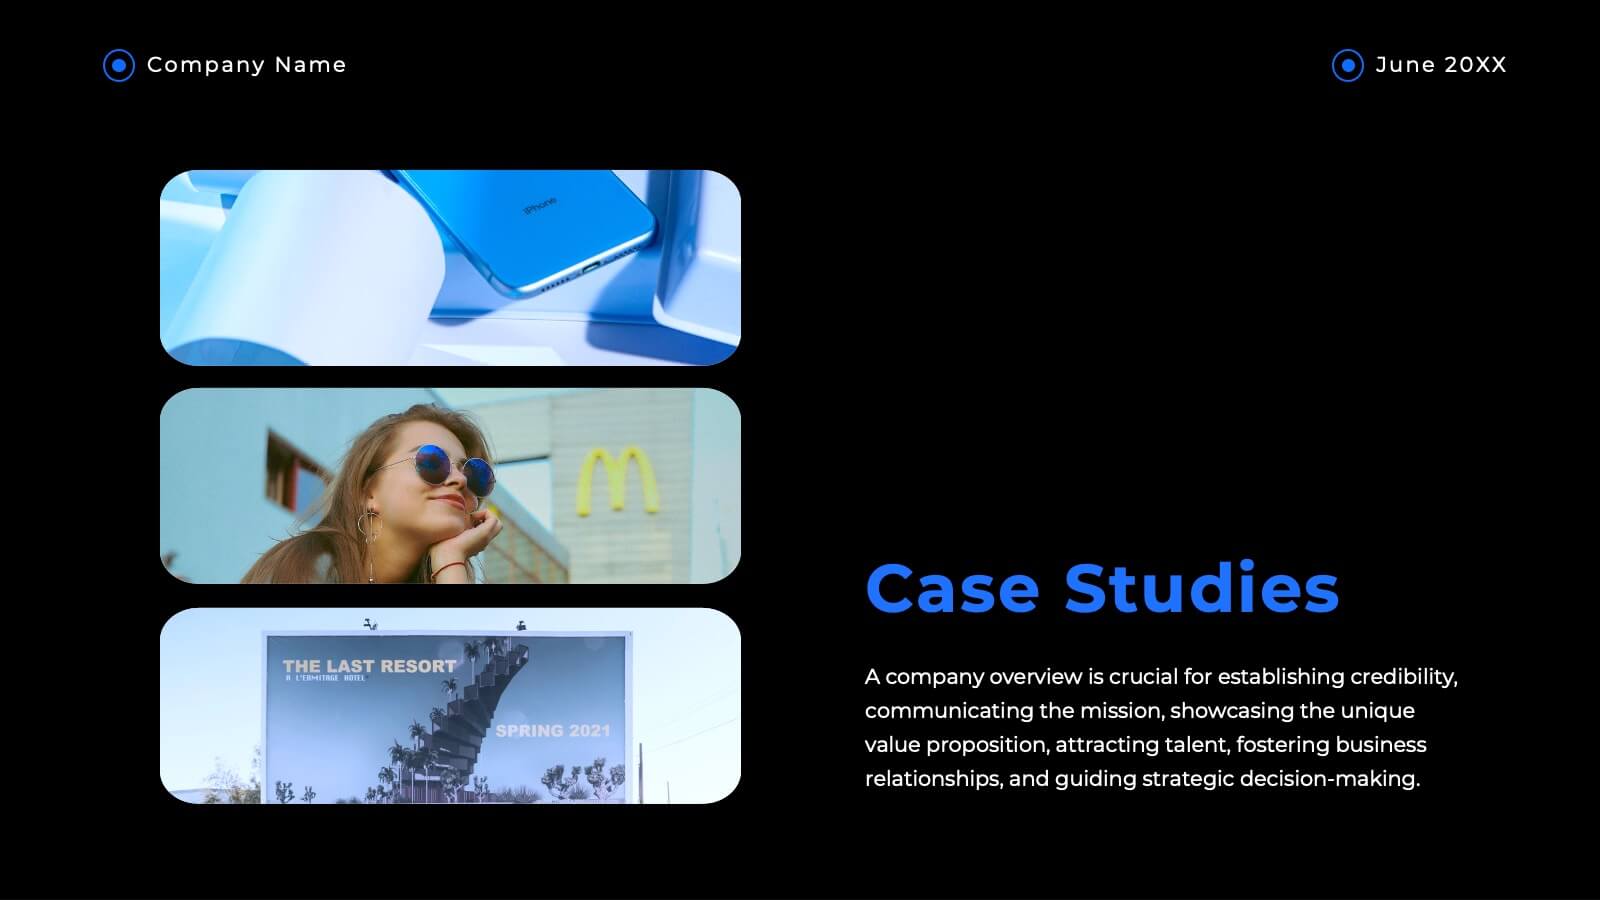
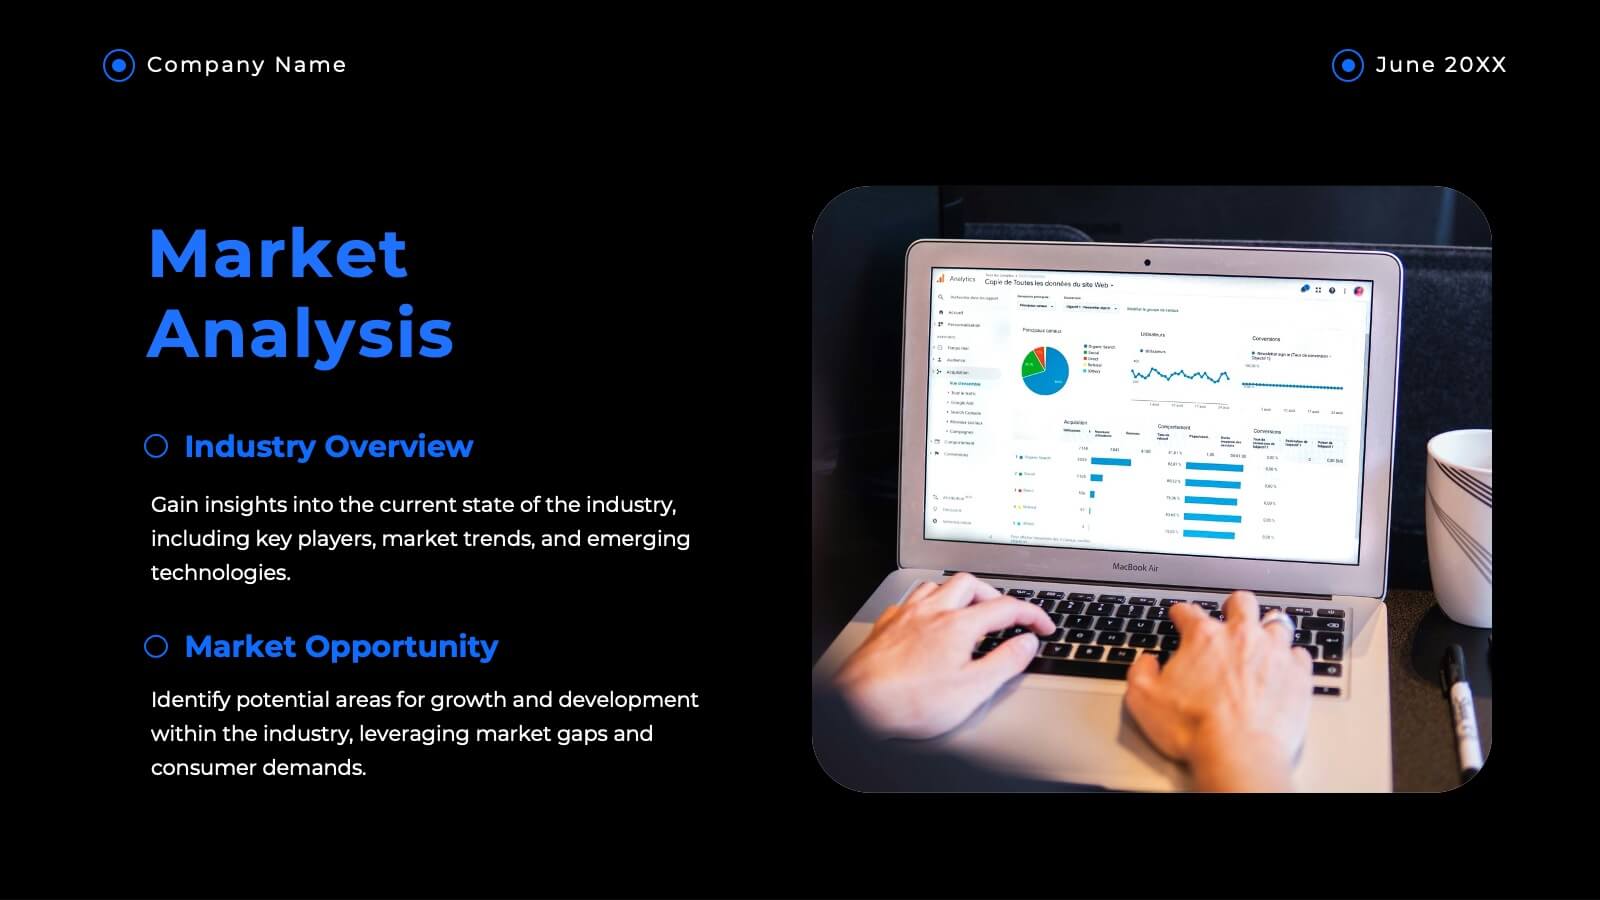
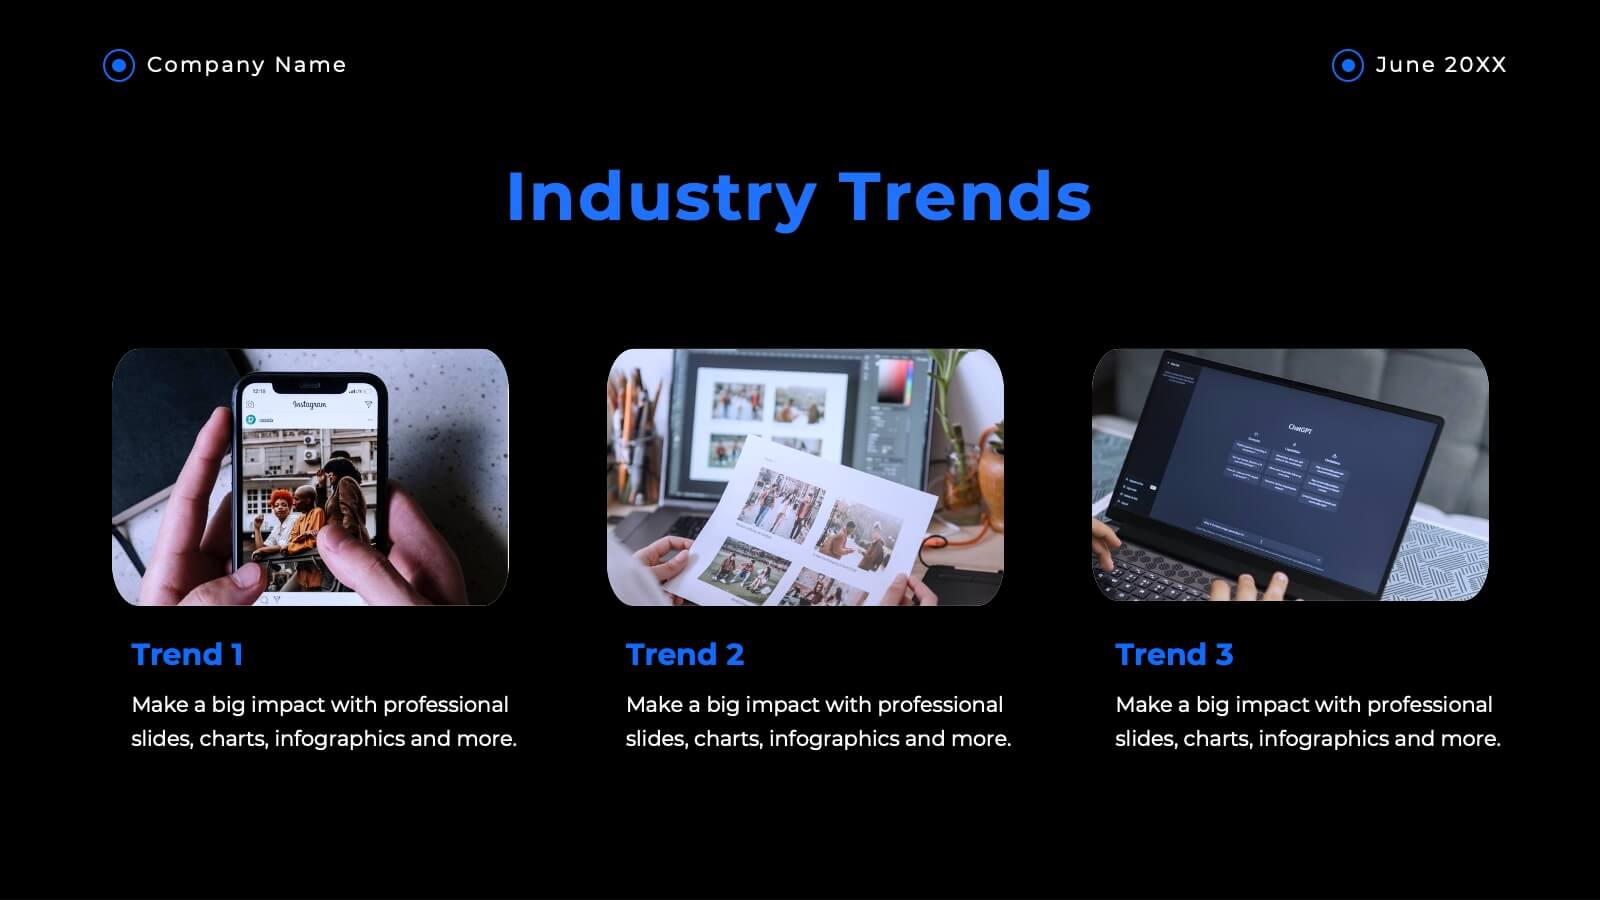
Elevate your advertising agency’s proposals with this sleek and modern template! It covers key areas like market analysis, case studies, client success stories, and campaign execution. Fully customizable, this template is perfect for presenting your agency’s services and strategies. Compatible with PowerPoint, Keynote, and Google Slides, it’s designed for impactful client presentations.


5 slides
Company Hierarchical Structure Presentation
Effectively illustrate your company's hierarchy with this Company Hierarchical Structure infographic template. Designed to clarify leadership and team roles, this slide is ideal for corporate presentations, HR onboarding, and management reports. Fully customizable in PowerPoint, Keynote, and Google Slides, ensuring seamless integration with your branding and content needs.


6 slides
Change Management Plan and Timeline Presentation
Bring your strategy to life with a clean, visual roadmap that connects goals to real timelines. A team performance improvement plan helps identify areas needing support, establish measurable targets, and align team efforts across months. This editable presentation template works seamlessly in PowerPoint, Keynote, and Google Slides for flexible collaboration.


5 slides
Real-Time KPI's Monitoring Dashboard Presentation
Track performance at a glance with this Real-Time KPI Monitoring Dashboard Presentation. Featuring clean bar visuals, circular gauges, and a numeric display, this layout is ideal for presenting five key metrics and their progress. Perfect for executive updates, marketing reports, or business reviews. Fully editable in PowerPoint, Keynote, Google Slides, and Canva.
22 slides
Haven Advertising Agency Proposal Presentation
Wow your clients with this sophisticated agency presentation template! Perfect for showcasing your services, client success stories, and market analysis. Ideal for agencies looking to impress and secure new business. Compatible with PowerPoint, Keynote, and Google Slides, this template ensures your proposals stand out with professional elegance. Perfect for any pitch or proposal.


7 slides
Mental Agility Training Infographic
Embark on the enlightening path of training with our intricately designed mental agility training infographic. Illuminated by the motivation of yellow, the growth of green, and the depth of blue, our template effectively outlines training methodologies and outcomes. Adorned with precision-focused infographics, intuitive icons, and adaptable image placeholders, it renders complex training data into an easily digestible format. Expertly sculpted for Powerpoint, Keynote, or Google Slides. A quintessential tool for trainers, HR professionals, or any organization aiming to elevate its training regimen. Enlighten your audience; let every slide be a step towards mastery.


26 slides
Leyna Presentation Template
Leyna is an elegant and minimalist wedding planner presentation template. This wonderful presentation template will help couples know what all you’ll offer as a wedding planner. We have made it easy for you this this multipurpose template because you will be able to edit easily to make sure it fits what you need. We have built a clean, responsive and modern design for them to have a great experience on what they are looking for in the best way possible. This template provides a professional and clean design for your business or personal use. It's time to impress the potential clients!


7 slides
Supply Chain Process Mapping Presentation
Streamline your logistics and operations presentations with the Supply Chain Process Mapping Presentation. Featuring a linked-chain visual, this editable template is ideal for outlining each step in your supply flow—from sourcing to delivery. Highlight dependencies, bottlenecks, or key stages with customizable color coding. Fully compatible with PowerPoint, Keynote, and Google Slides.


12 slides
Visual Data Representation Bubble Map Presentation
Present complex data effectively with the Visual Data Representation Bubble Map presentation. This template organizes information into clear, interconnected segments, making it ideal for analytics, business insights, and strategic planning. Compatible with PowerPoint, Keynote, and Google Slides.


6 slides
Supply Chain and Logistics Strategy Presentation
Streamline complex logistics workflows with this bold, dual-loop arrow layout. Ideal for showcasing the full cycle of sourcing, distribution, warehousing, and returns, this diagram lets you visualize forward and reverse logistics processes side by side. Customizable icons, clear progression, and ample space for key data make this a must-have for operations managers, procurement teams, and logistics planners. Fully compatible with PowerPoint, Keynote, and Google Slides.


5 slides
Social Media Strategy Infographic
Social Media refers to digital platforms and websites that allow users to create and share content, engage with others, and participate in online communities. This presentation template is a powerful tool to help you create a comprehensive social media strategy. It provides a visually appealing and easy-to-understand overview of the key elements of a successful social media strategy. Use this template to plan and communicate your social media strategy effectively, ensuring that you make the most of your social media presence and engage your target audience efficiently. This template is compatible with Powerpoint, Keynote, and Google Slides.


6 slides
Asia Market Map Infographic
Asia is the largest and most populous continent on Earth, covering a vast area that includes diverse landscapes, cultures, and countries. This map infographic displays the countries, capitals, major cities, rivers, mountain ranges, and other Asia geographical features. This template can be used for various purposes, such as market research presentations, business reports, and marketing materials. This template showcases the business and economic landscape in the Asian market. This provides valuable insights into the economic landscape of various Asian countries and help businesses make informed decisions for market expansion and opportunities in the region.
8 slides
Creative Alphabet Visual Reference Presentation
This creative presentation uses a bold A–B–C visual structure to highlight key points in a clean, modern layout. Ideal for overviews, comparisons, or step-by-step frameworks. Fully customizable in Canva, it balances design and clarity—perfect for business strategies, education, or visual storytelling with strong alphabetical cues and icon integration.


8 slides
Concept Mapping with Bubble Map Presentation
Create a visually engaging Concept Mapping with Bubble Map presentation to organize ideas, processes, or strategies effectively. This customizable template enhances clarity in brainstorming sessions, strategic planning, and educational content. Compatible with PowerPoint, Keynote, and Google Slides.


6 slides
Remote Work Productivity Presentation
The "Remote Work Productivity" presentation template features a clean and modern design, ideal for showcasing strategies and statistics related to remote work efficiency. Each slide allows for the display of key data points and statistics, supported by visual elements like percentage indicators and progress bars that enhance the presentation’s readability and impact. This template is perfect for businesses looking to improve remote operations or present data-driven insights into remote work performance, making it easier for viewers to grasp the effectiveness of remote work policies and tools.