


Features
- 8 Unique slides
- Fully editable and easy to edit in Microsoft Powerpoint, Keynote and Google Slides
- 16:9 widescreen layout
- Clean and professional designs
- Export to JPG, PDF or send by email


Do you have any questions?
Recommend


5 slides
Annual Achievements and Highlights Presentation
Celebrate your progress with the Annual Achievements and Highlights Presentation. This timeline-style layout guides viewers along a visual path of milestones year by year. Each pin represents a key accomplishment, backed by icons and editable text for context. Perfect for end-of-year reviews or company retrospectives. Compatible with PowerPoint, Google Slides, and Canva.


5 slides
End-to-End Process Flow Framework Presentation
Visualize your operations from start to finish with the End-to-End Process Flow Framework Presentation. This clean, arrow-based layout is perfect for outlining workflows, project stages, or business processes step by step. Fully customizable in Canva, PowerPoint, and Google Slides to suit any team or strategic need.


4 slides
Marketing Campaign Action Plan Presentation
Drive impactful marketing results with the Marketing Campaign Action Plan presentation. This structured and visually engaging template helps you outline campaign objectives, key strategies, and execution steps in a clear, step-by-step format. Designed for marketers, strategists, and business teams, this fully editable slide ensures seamless planning and tracking of marketing initiatives. Compatible with PowerPoint, Keynote, and Google Slides.


20 slides
Sphene Sales Proposal Presentation
Take your sales pitch to the next level with this elegant and structured presentation template! Featuring sections on sales objectives, process, pricing strategies, and performance metrics, this template is ideal for impressing potential clients and closing deals. It’s easy to customize and works seamlessly with PowerPoint, Keynote, and Google Slides for hassle-free presentation creation.


7 slides
Problem Infographic
These slides focus on presenting problem statements and their contexts in a professional and accessible format. The use of a soft, consistent color palette helps to keep the presentation visually appealing while ensuring that the content remains the focal point. Each slide is designed with ample space for text and icons, which aids in breaking down complex issues into understandable segments. The variety of layouts ensures that you can tailor the presentation to the nature of the problem being addressed, whether it requires more textual explanations or benefits from the use of infographics and icons. These templates are well-suited for business meetings, academic presentations, or any scenario where clear communication of challenges is necessary. They can be effectively used to initiate discussions, brainstorm solutions, or simply to highlight issues that need attention in a structured and organized manner.


5 slides
Corporate Goal Alignment and Execution Presentation
Drive strategic clarity with this streamlined Corporate Goal Alignment and Execution slide. This template visually connects key initiatives with execution pathways and end goals, using a funnel-style layout that highlights the flow from strategic inputs to measurable outcomes. Perfect for aligning teams, reporting progress, or visualizing OKRs. Fully customizable in PowerPoint, Keynote, and Google Slides.


26 slides
Flyx Presentation Template
Flyx is a perfect modern template for you that is very easy to use. This template has a simple, clean, and basic design with high quality illustrations. It can be used for small businesses to large corporate companies and personal use as well. The design is minimal with white and different colors giving it a fresh look. Flyx is easy to edit and is perfect for branding presentations, you can change the colors with just one simple click. Pictures and charts are also made for easy editing as well as easy readability without too much confusion on reading. This template is easy to use and high quality making it suitable for all types of businesses. It is easy to create this modern and bold presentation that will deliver your message with an impact.


4 slides
Root Cause Analysis Fishbone Presentation
Pinpoint problems efficiently with this Root Cause Analysis Fishbone template. Designed to help you identify and visualize causes clearly, it’s perfect for process improvement and team brainstorming. Fully editable and easy to use in PowerPoint, Keynote, and Google Slides for maximum flexibility across your workflow.


6 slides
Ideas Connection Venn Presentation Design
Present interconnected ideas with creativity and impact using the Ideas Connection Venn Presentation Design. This colorful, lightbulb-themed 5-section layout helps you visualize related concepts or stages, ideal for brainstorming, innovation mapping, or content planning. Each segment includes icons, titles, and descriptions to showcase your thoughts clearly. Fully customizable in PowerPoint, Keynote, and Google Slides.


5 slides
Investor Pitch Slide Deck Presentation
Captivate investors from the first slide with a clean, modern design that showcases your business idea, traction, and vision with clarity. This presentation helps you structure key points effectively for funding discussions. Fully customizable and compatible with PowerPoint, Keynote, and Google Slides for a seamless pitching experience.


5 slides
Mental Health Disorders Infographics
Mental Health Disorder Infographics play a crucial role in raising awareness, combating misinformation, and advocating for better mental health support. These Infographics are visual representations of information about mental health disorders. They include statistics, images, and text to provide information on the prevalence of these disorders, common symptoms, risk factors, and available treatments. These infographics are designed with the goal to raise awareness about mental health disorders and to help people better understand and identify the signs and symptoms of these conditions.


6 slides
Market Structure Infographics
Explore market structure effectively with our Market Structure infographic template. This template is fully compatible with popular presentation software like PowerPoint, Keynote, and Google Slides, allowing you to easily customize it to illustrate and communicate various aspects of market structures. The Market Structure infographic template offers a visually engaging platform to explain different types of market structures, including perfect competition, monopolistic competition, oligopoly, and monopoly. Whether you're a student, economist, business professional, or anyone interested in economics and market dynamics, this template provides a user-friendly canvas to create informative presentations and educational materials. Deepen your understanding of market structure with this SEO-optimized infographic template, thoughtfully designed for clarity and ease of use. Customize it to showcase the characteristics, examples, and implications of each market structure, ensuring that your audience gains valuable insights into how markets function. Start crafting your personalized infographic today to explore the world of market structure in economics.


26 slides
Luxury Hotel Professional Company Profile Presentation
Step into the opulent embrace of luxury hospitality, where every detail whispers elegance and exclusivity. Cast in a sophisticated palette of rich brown and pristine white, our template exudes the bold allure of luxe. Adorned with high-end graphics, elite icons, and evocative image placeholders, it's the embodiment of grandeur and comfort. Flawlessly tailored for Powerpoint, Keynote, or Google Slides. A prime choice for luxury hoteliers, event planners, hospitality consultants, or any brand aiming to showcase their exquisite offerings. Elevate your narrative; immerse your audience in the world of premium hospitality.


7 slides
Sales Infographic Presentation Template
A Sales Infographic is a visual representation of data or information related to sales. They can include charts, graphs, and diagrams that show how much money a company has made, how many products they have sold, and what their best-selling products are. This template is perfect for anyone who wants to show off their sale numbers in a fun and easy-to-understand way. This template has colorful pictures and charts that make it easy to see how much you've sold and how well your sales are doing. This template is a perfect way to help a company make decisions and track progress.


7 slides
Asia Countries Map Infographic
This Asia Countries Map infographic template is ideal for presentations requiring a detailed breakdown of geographic and statistical data across Asia. Compatible with PowerPoint, Google Slides, and Keynote, it features a collection of map styles and data visualization tools including icons, bar charts, and color-coded points for easy data comparison and interpretation. The template is perfect for visualizing diverse metrics such as demographic details or social statistics, with each slide tailored to display information in a clear, engaging manner. This tool is exceptionally suited for educators, and business professionals who need to convey complex data about Asian countries.


10 slides
4-Step Business Process Presentation
Present your ideas with clarity and impact using this clean, structured layout made for professionals who value organization and design. Perfect for outlining strategies, steps, or lists, it keeps your message focused and engaging. Easily customizable and fully compatible with PowerPoint, Keynote, and Google Slides for polished results.

23 slides
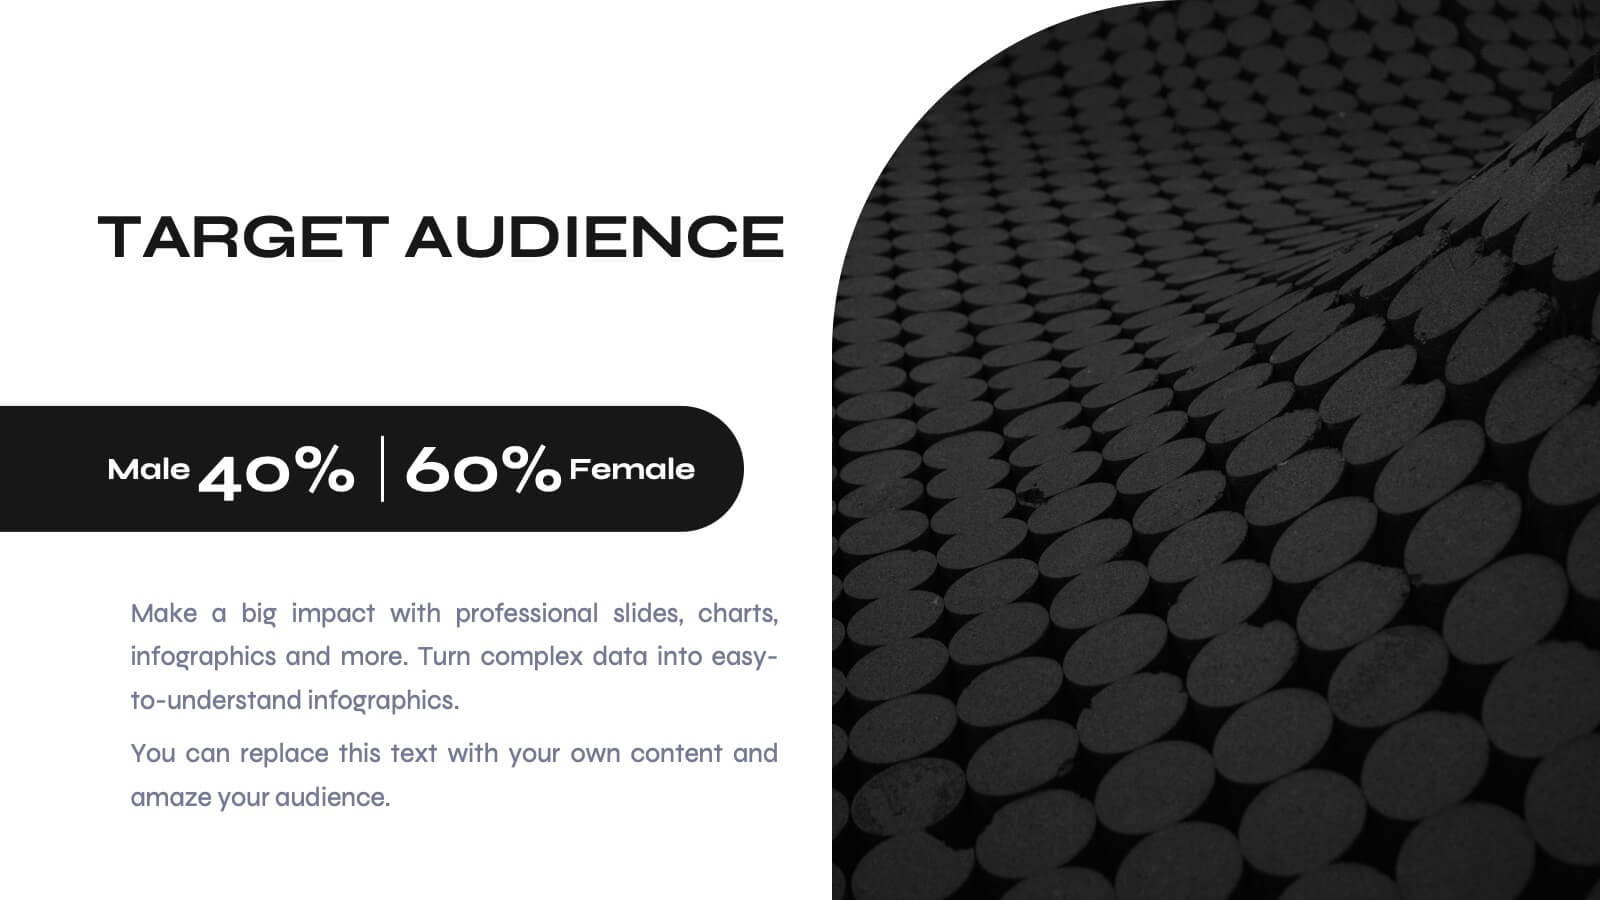
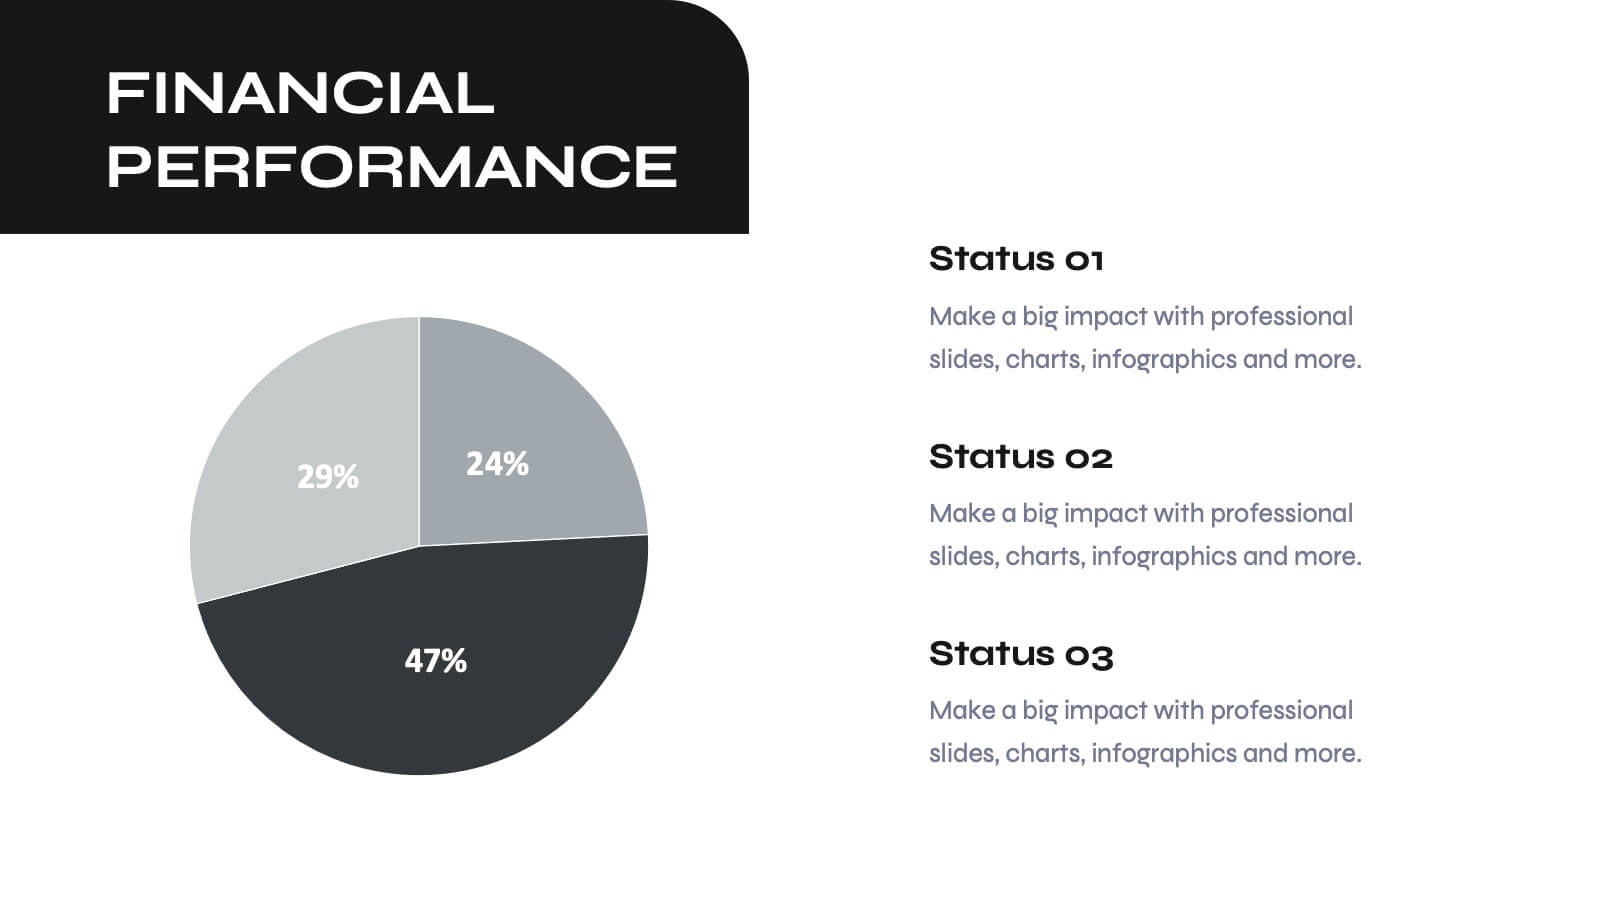
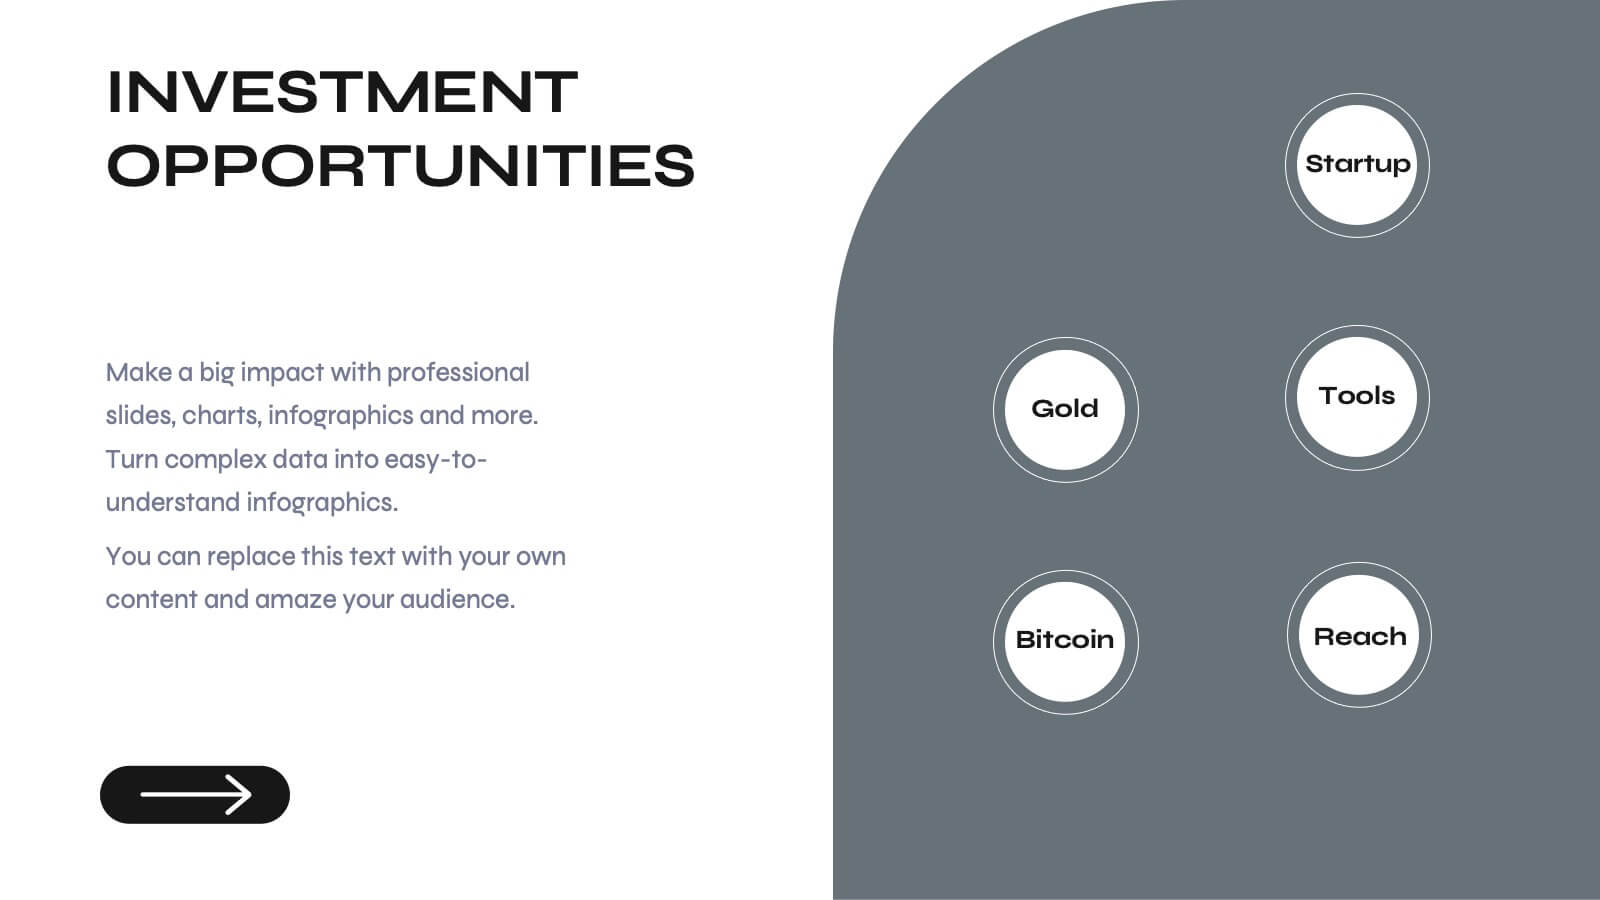
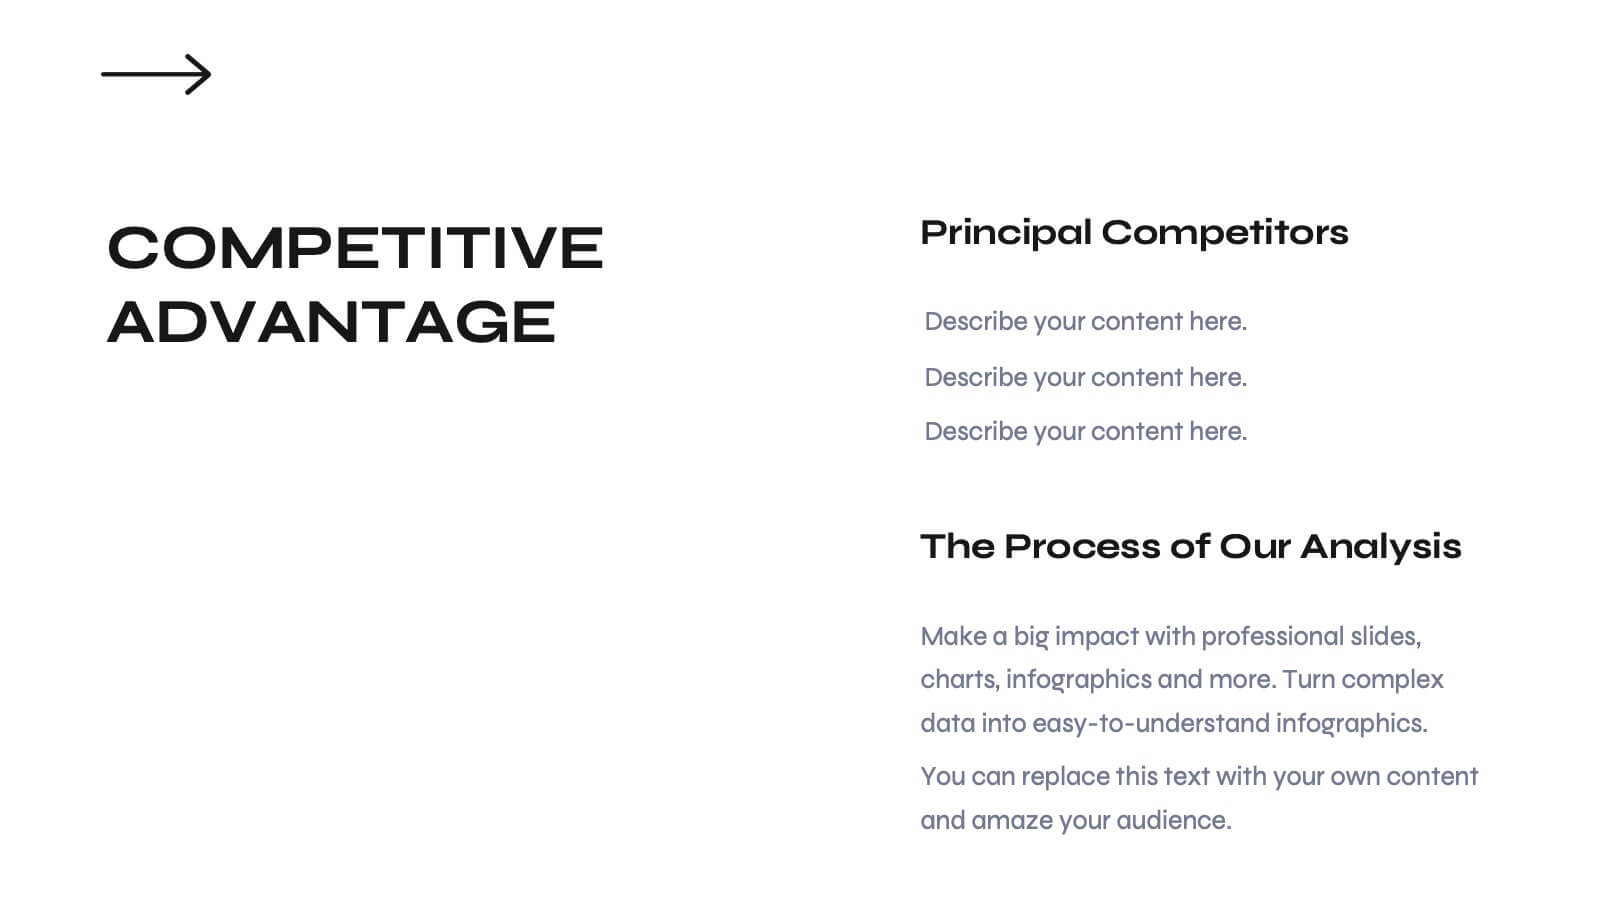
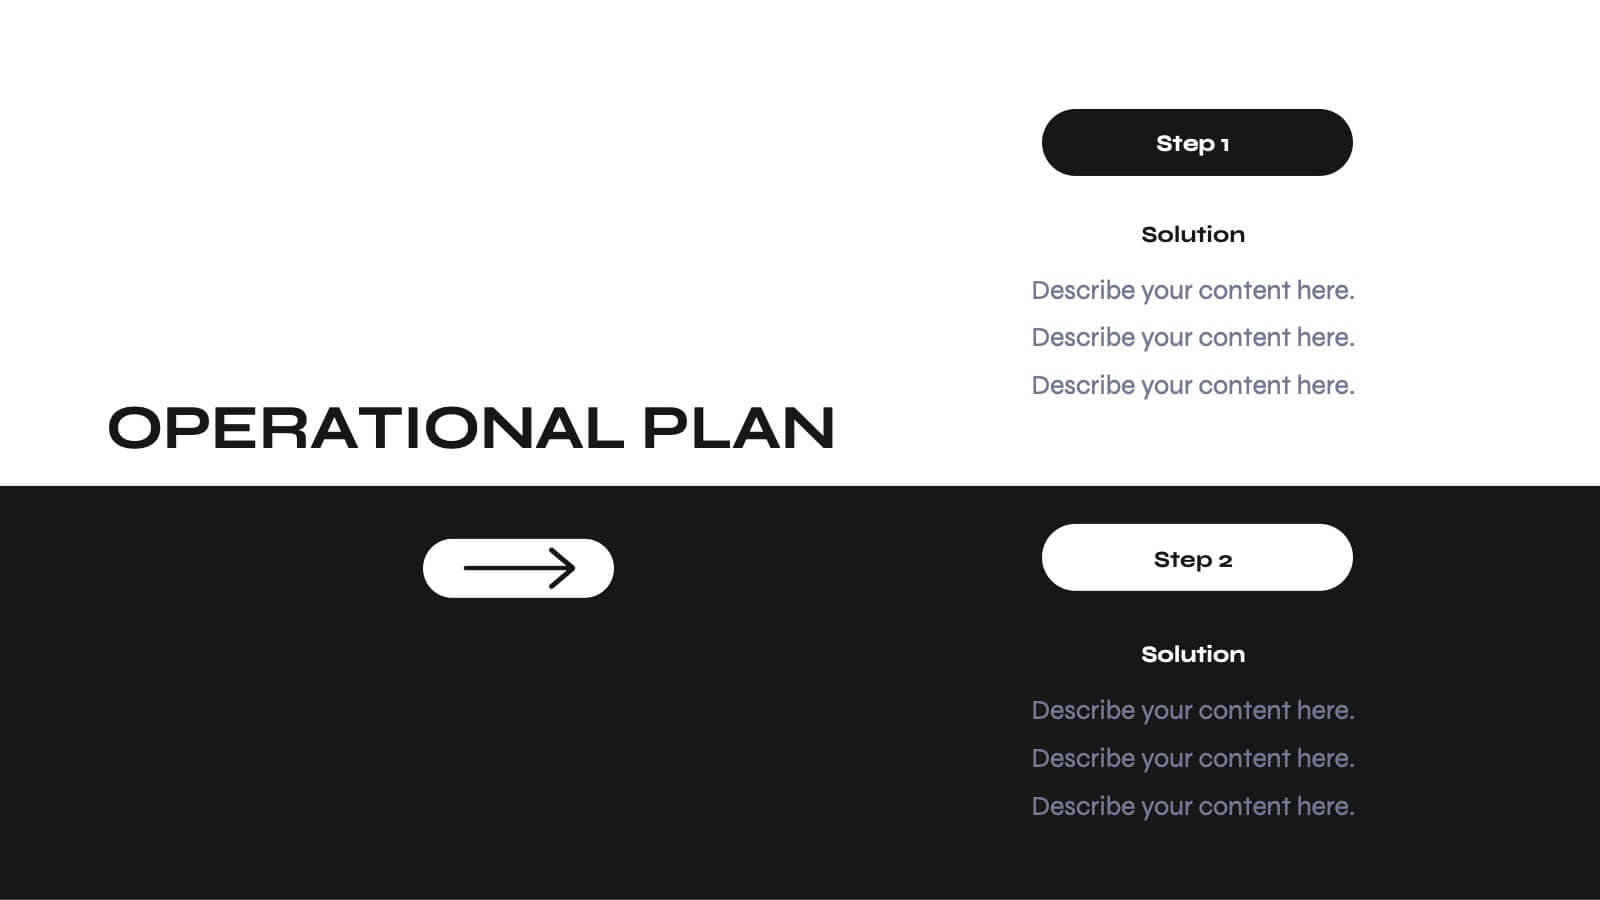
Odyssey Small Business Pitch Deck Presentation
Elevate your business pitch with this sleek, monochrome presentation template. Perfect for presenting company backgrounds, market opportunities, and financial performance, it features a minimalist design that enhances clarity and impact. Highlight your value proposition and strategic plans to captivate investors. Compatible with PowerPoint, Keynote, and Google Slides, it ensures seamless presentations on any platform.