


Features
- 6 Unique slides
- Fully editable and easy to edit in Microsoft Powerpoint, Keynote and Google Slides
- 16:9 widescreen layout
- Clean and professional designs
- Export to JPG, PDF or send by email


Do you have any questions?
Recommend


26 slides
Protecting Your Digital Assets with Cybersecurity Presentation Template
Safeguard your digital world with this sleek and professional presentation on protecting your digital assets with cybersecurity! This template is designed to simplify complex concepts while showcasing the importance of online safety, data protection, and risk management. Featuring modern layouts, detailed infographics, and customizable charts, it’s ideal for exploring cybersecurity strategies, emerging threats, or best practices for organizations and individuals. The polished design, complete with high-tech visuals and a calming color palette, ensures your audience stays engaged while absorbing critical information. Perfect for IT professionals, educators, or businesses, this template is fully compatible with PowerPoint, Keynote, and Google Slides, making it an essential tool for impactful presentations.


4 slides
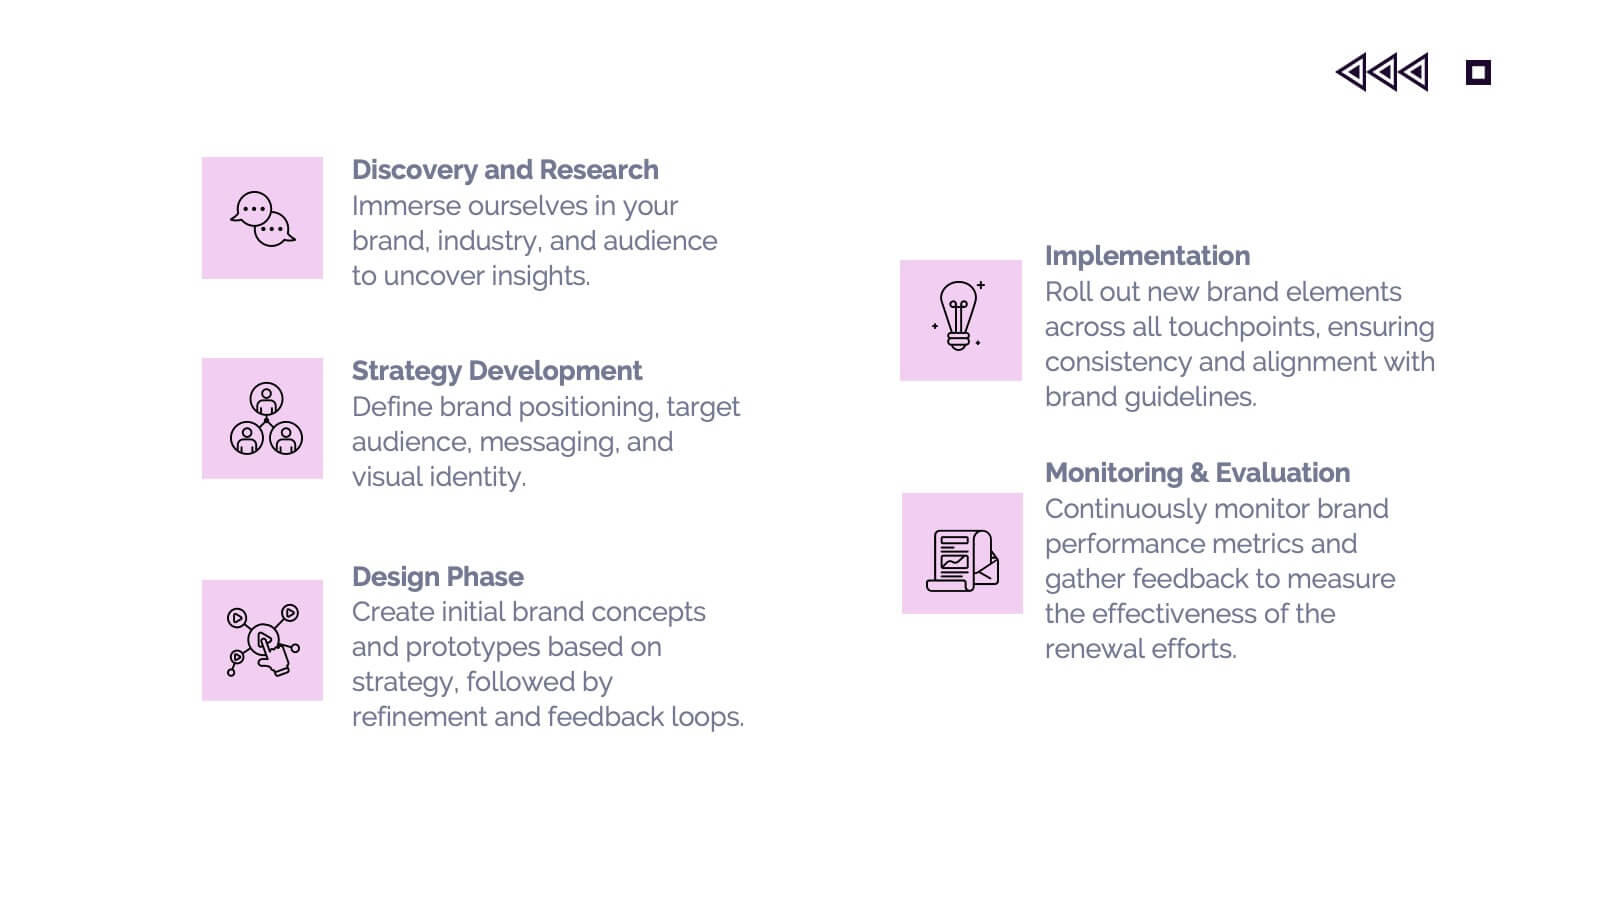
Operational Flow Mapping and Control Presentation
Streamline complex processes with the Operational Flow Mapping and Control Presentation. This template uses a clear, hierarchical layout to visualize workflows, decision points, and operational branches. Ideal for SOPs, business systems, or process improvement plans. Fully editable in Canva, PowerPoint, and Google Slides to fit any project or team need.


6 slides
McKinsey 7S Framework
Visualize the interdependent elements of organizational success with this professional McKinsey 7S Framework template. Ideal for strategic planning, change management, or internal assessments, this editable slide highlights structure, systems, style, staff, skills, strategy, and shared values. Fully compatible with PowerPoint, Keynote, and Google Slides.


19 slides
Prism Design Strategy Proposal Presentation
Bring your design strategy to life with this modern and stylish presentation template! Perfect for showcasing your design concepts, processes, and elements, this template ensures that your ideas are communicated effectively. With a sleek layout for design briefs, mood boards, prototypes, and project timelines, it's the ideal tool for creative professionals. Customize it easily in PowerPoint, Keynote, or Google Slides to make a lasting impression on your audience.


22 slides
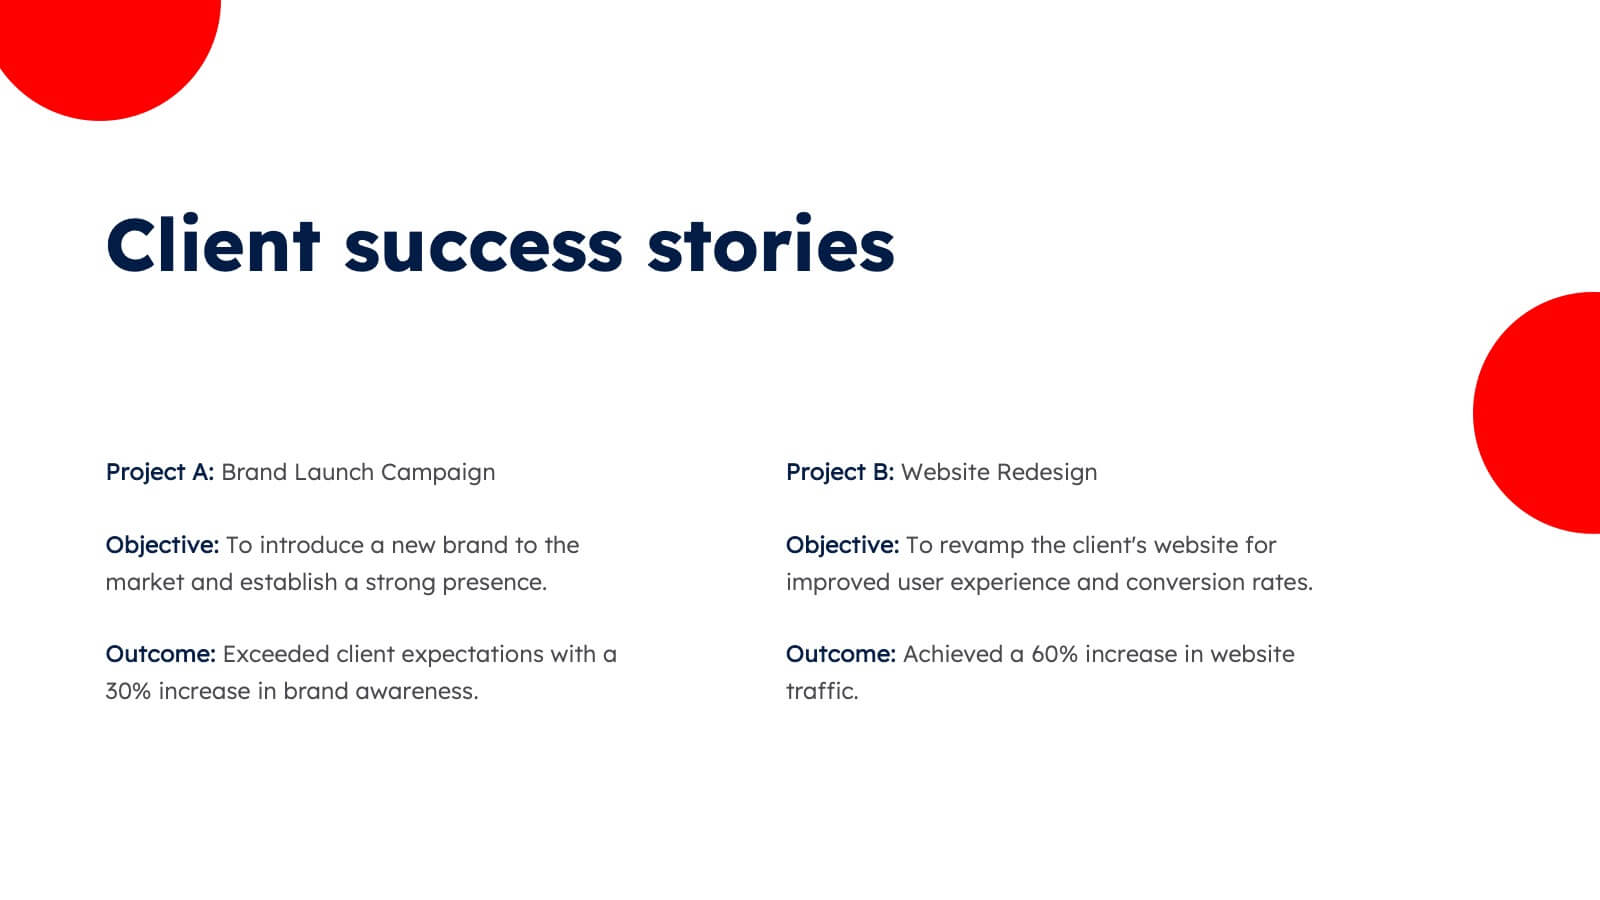
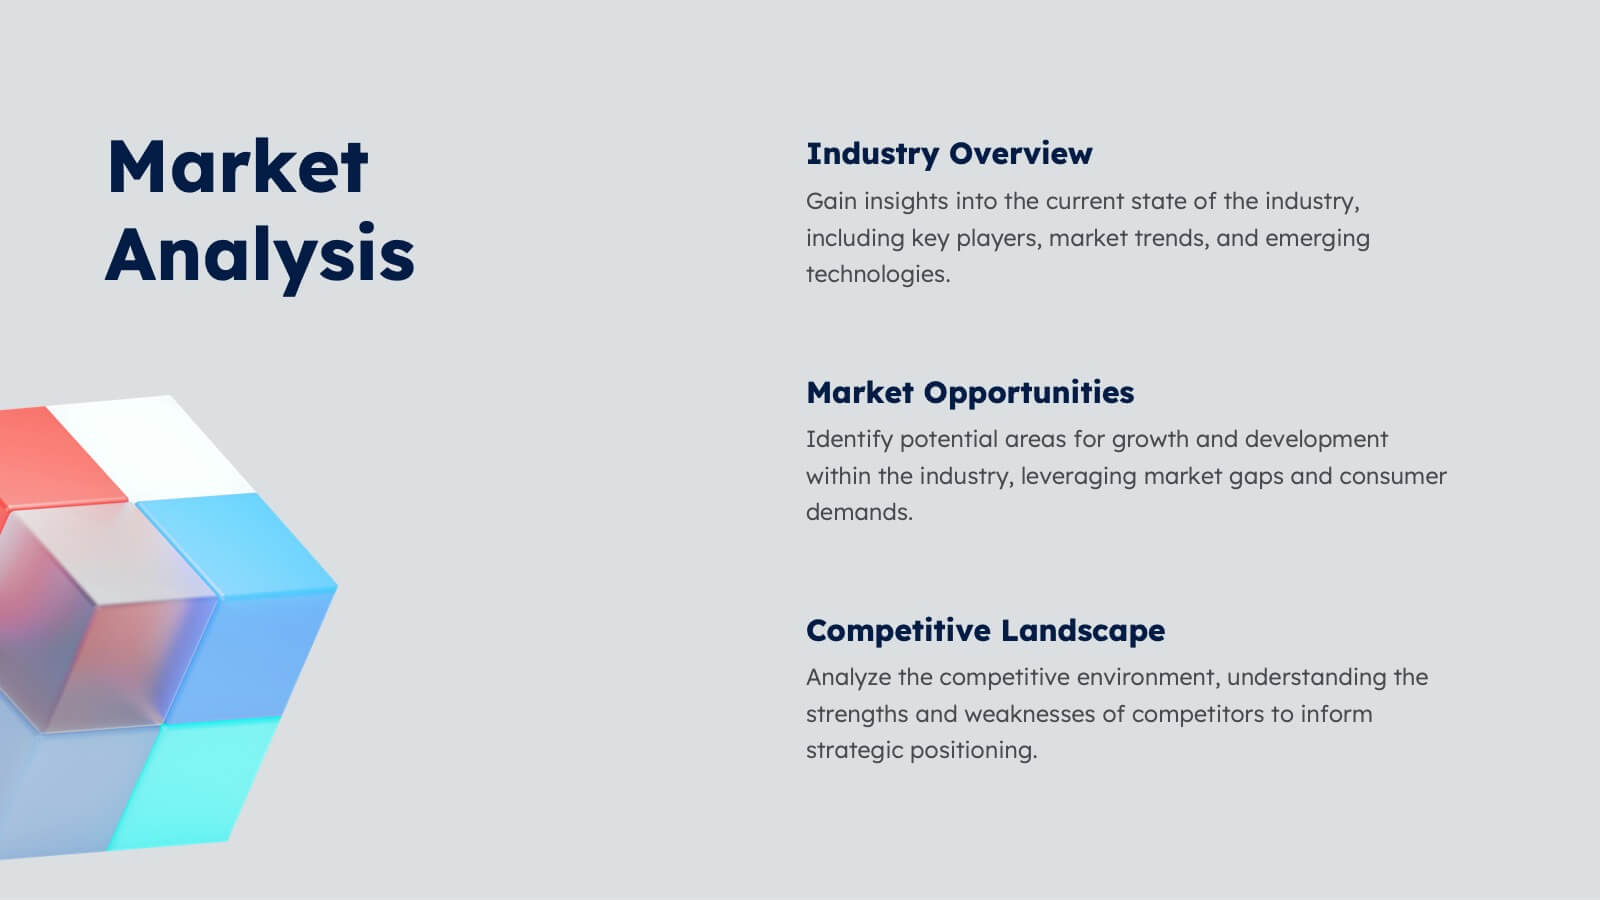
Aura Agency Portfolio Presentation
Showcase your agency's brilliance with this vibrant portfolio presentation template! Ideal for highlighting your mission, vision, case studies, and market analysis, it brings your achievements to life with colorful, engaging slides. Impress clients and partners with a well-structured, visually appealing narrative. Compatible with PowerPoint, Keynote, and Google Slides for easy use on any platform.


6 slides
Security Strategy and Risk Management Presentation
Keep your data safe and your strategy sharp with this modern, professional template built to explain protection frameworks, risk mitigation, and security planning. Its clean visuals make complex concepts easy to understand for teams and clients alike. Fully compatible with PowerPoint, Keynote, and Google Slides for effortless editing and presentation.


5 slides
Startup Growth Roadmap and Milestones Presentation
Present your startup journey clearly with the Startup Growth Roadmap and Milestones Presentation. This timeline-style layout breaks down your key phases, from initial concept to market traction. Ideal for investor decks, pitch presentations, or internal planning. Fully editable in PowerPoint, Canva, and Google Slides for seamless customization.


6 slides
Pillar Foundation Infographics
Gain insights into Pillar Foundation construction with our customizable infographic template. This template is fully compatible with popular presentation software like PowerPoint, Keynote, and Google Slides, allowing you to easily customize it to illustrate and communicate the key aspects and principles of pillar foundation construction. The Pillar Foundation infographic template offers a visually engaging platform to explore and explain the construction process, types of pillars, materials used, and the significance of pillars in building stability. Whether you're a construction professional, architect, engineer, or simply interested in construction techniques, this template provides a user-friendly canvas to create informative presentations and educational materials. Deepen your knowledge of Pillar Foundation construction with this SEO-optimized infographic template, thoughtfully designed for clarity and ease of use. Customize it to showcase foundation types, construction steps, reinforcement methods, and the role of pillars in supporting structures, ensuring that your audience gains valuable insights into this crucial aspect of construction. Start crafting your personalized infographic today to delve into the world of Pillar Foundation construction.


4 slides
Insurance Business Overview Presentation
Bring clarity and professionalism to your financial presentations with this sleek and modern design. Ideal for outlining key insights, policies, or service breakdowns, it visually communicates business protection and stability. Fully customizable and compatible with PowerPoint, Keynote, and Google Slides for an engaging and polished presentation experience.


23 slides
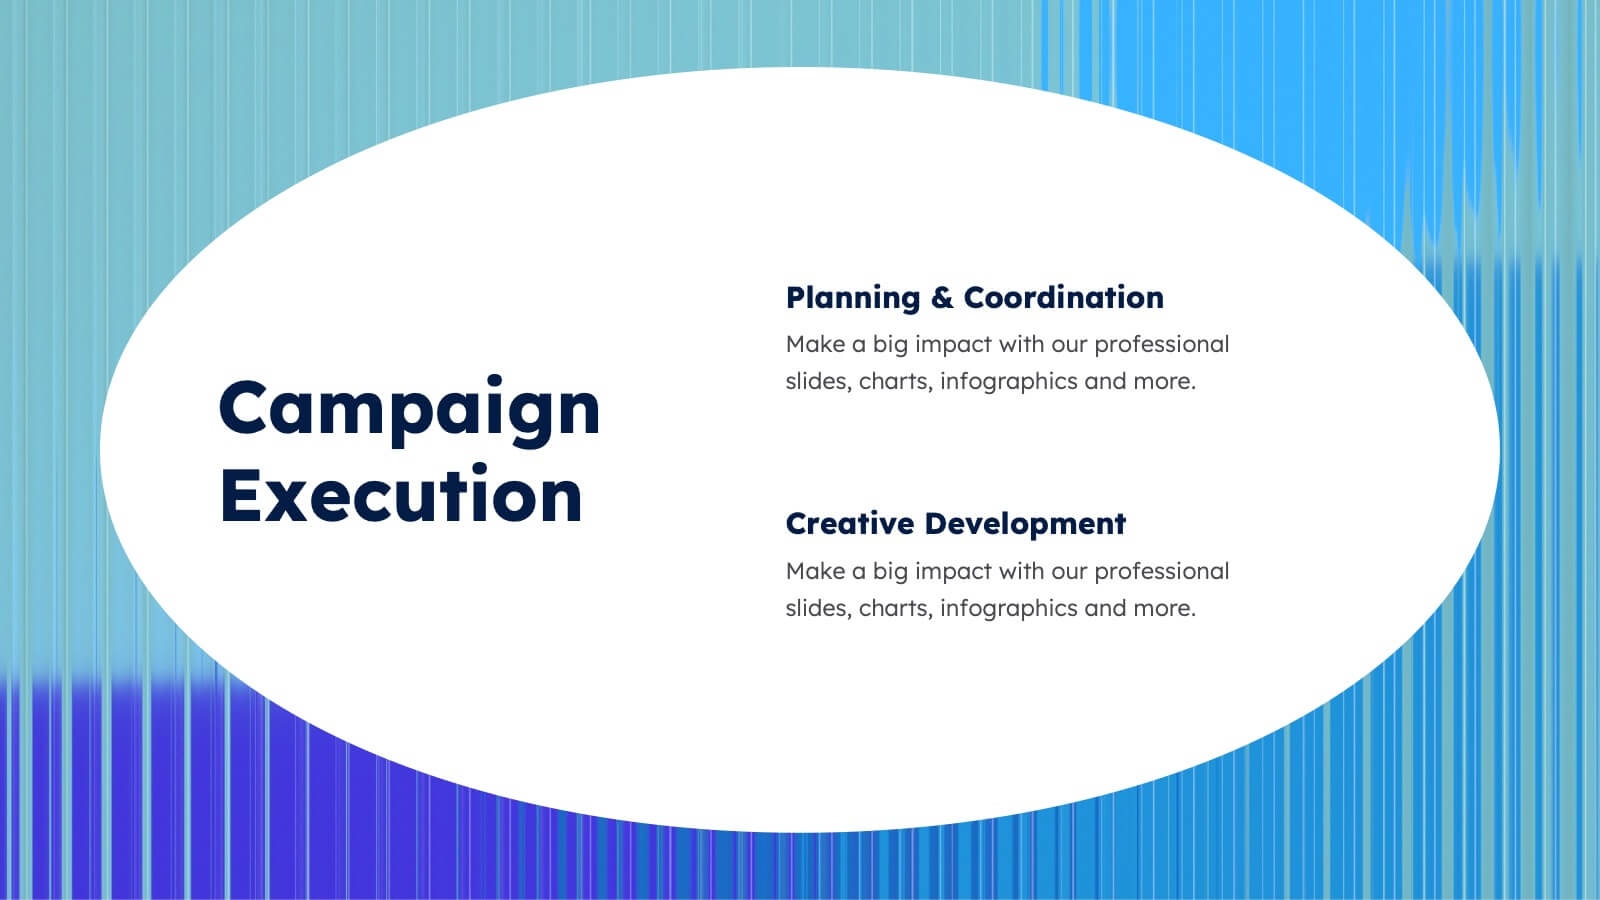
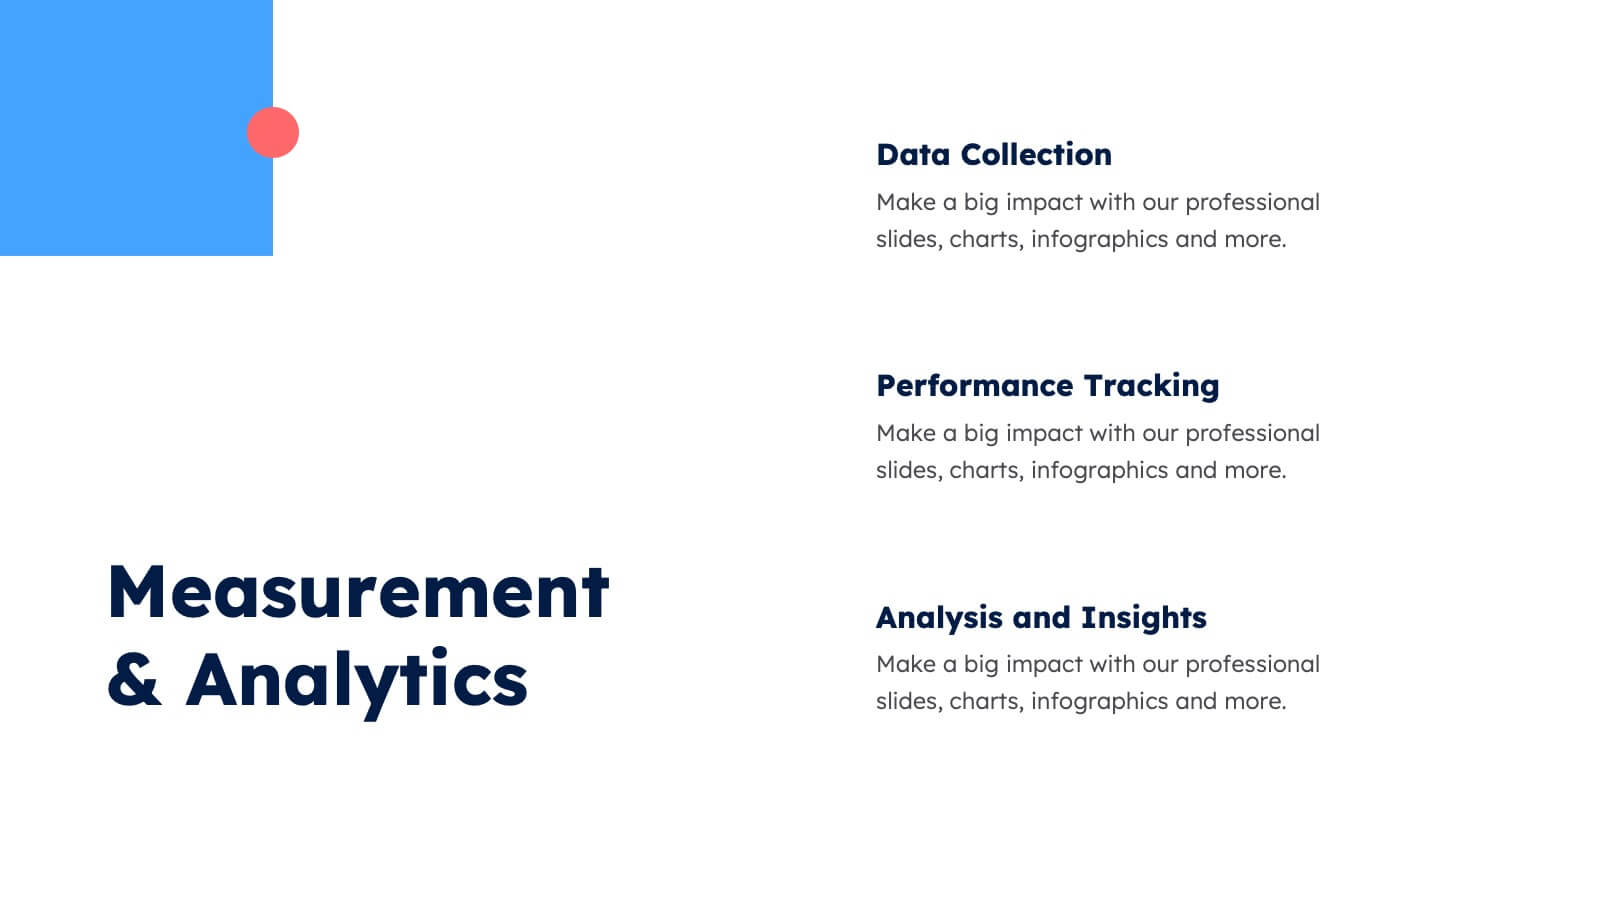
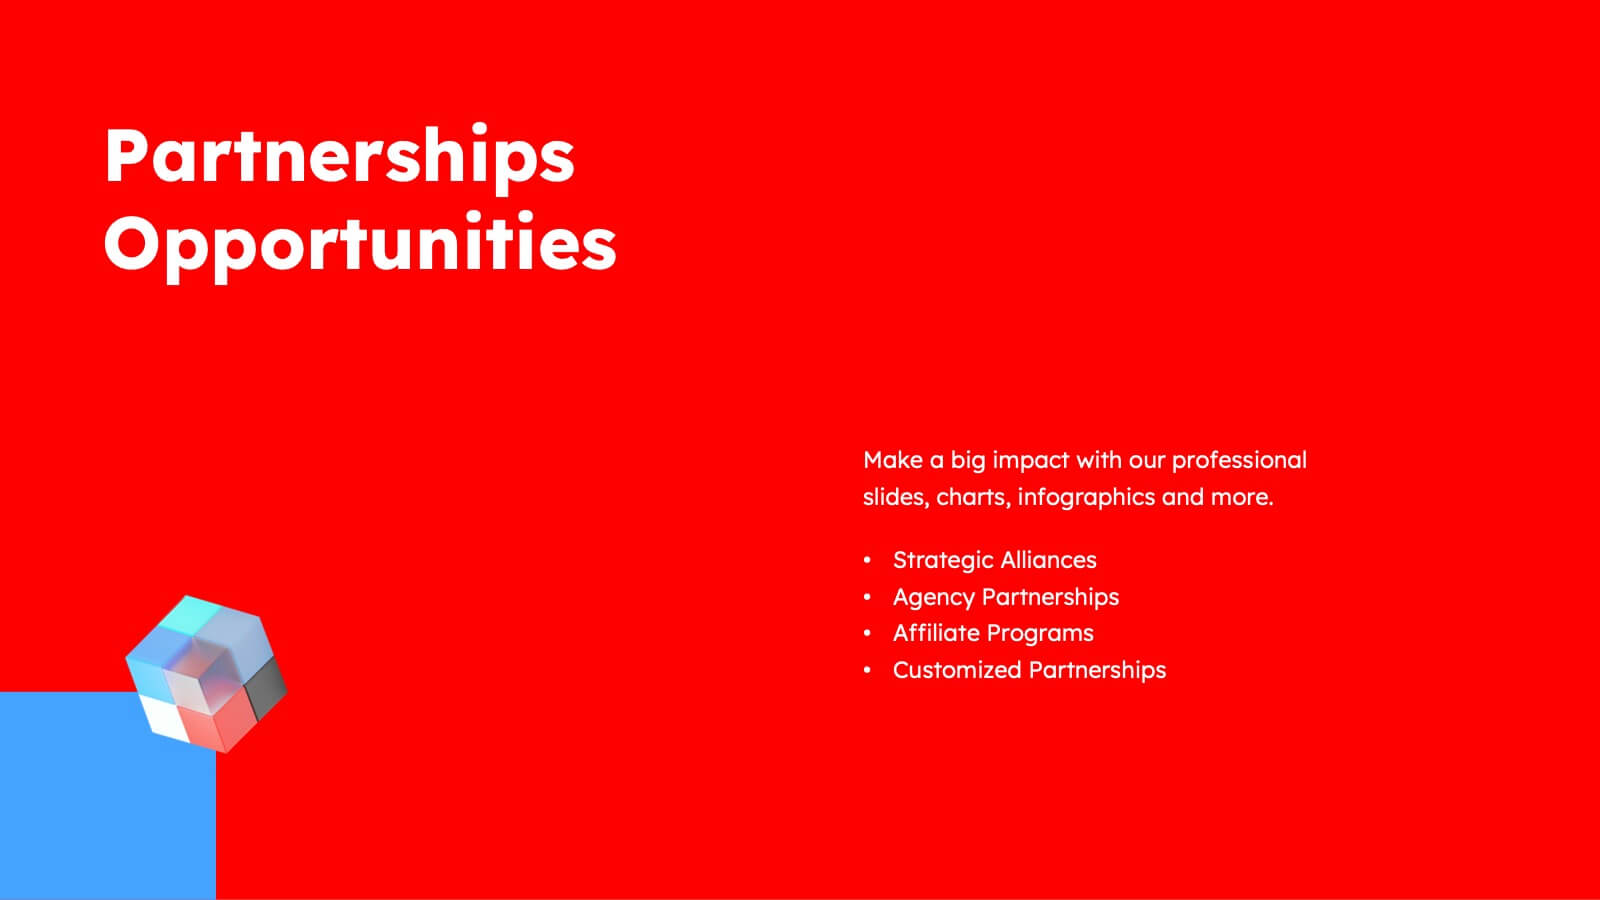
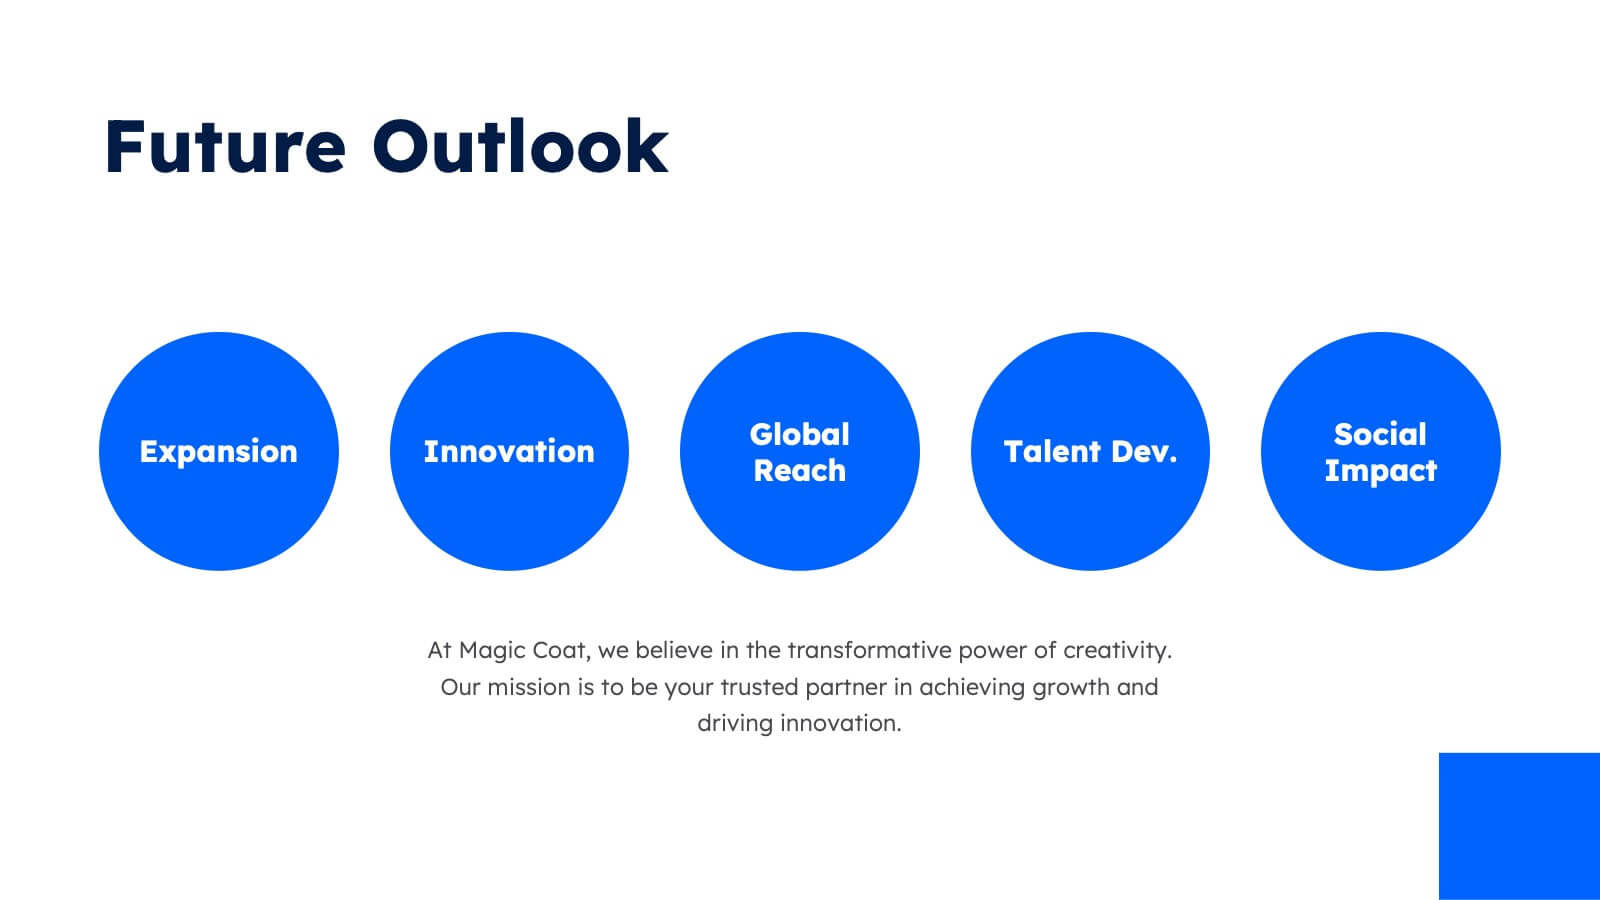
Wendigo Agency Portfolio Presentation
This sleek agency portfolio template showcases your mission, services, and success stories with modern flair. From case studies and strategy development to campaign execution and client testimonials, it’s designed to highlight your agency’s strengths. Perfect for agency presentations across PowerPoint, Keynote, and Google Slides, this template makes your content shine effortlessly.


7 slides
Investment Bank Infographic Presentation
An investment infographic helps investors understand complex investment concepts by presenting information in a clear and concise manner. This is a professional Investment template with all the elements you need to make a great impact. Use this presentation to help you explain a new investment opportunity, or show the benefits of your product or service. Designed for use in PowerPoint, Keynote and Google Slides, it is easy to customize and fully editable, making it a perfect starting point for any investor or financial pitch. You can change the texts, image and shapes as you wish!


5 slides
Marketing Wheel Strategy Presentation
Enhance your marketing presentations with our "Marketing Wheel Strategy Presentation" template. This infographic is designed to visually represent the interconnected components of a marketing strategy, organized in a wheel format for clarity. Each segment, color-coded for distinction, covers different aspects such as planning, execution, analysis, and optimization, demonstrating their interdependence. This layout is perfect for illustrating how each part contributes to the overall effectiveness of a marketing plan. Ideal for marketing professionals and strategists, it facilitates detailed strategy discussions and comprehensive planning sessions. Fully compatible with PowerPoint, Keynote, and Google Slides, this template is essential for delivering clear and effective marketing presentations.


6 slides
Social Science Infographics
The "Social Science" infographic template is an intellectually stimulating and visually engaging tool, thoughtfully designed for PowerPoint, Keynote, and Google Slides. This template is a brilliant resource for educators, researchers, and students who seek to present the multifaceted aspects of social sciences in a clear and compelling manner. This template skillfully encompasses various disciplines within social science, such as anthropology, sociology, psychology, and political science. It presents key theories, methodologies, and findings in an organized and digestible format. This makes it an invaluable aid for academic presentations, research proposals, or educational discussions, facilitating a deeper understanding of human society and social relationships. The design is as thought-provoking as the subject it represents, with a color scheme that stimulates intellectual curiosity while maintaining clarity and focus. This not only enhances the visual appeal of the presentation but also complements the analytical and reflective nature of social science. Whether used in a lecture hall, a conference, or a study group, this template ensures that the complex world of "Social Science" is presented in an engaging, informative, and visually captivating manner.
7 slides
Arrow Heads Infographic
Navigate your concepts and strategies with precision using our arrow heads infographic template. This visually appealing and versatile template enables you to represent ideas, processes, or strategies in a clear and impactful way. Utilize the arrows to depict the flow of ideas, processes, or steps, making complex concepts easy to follow. Compatible with Powerpoint, Keynote, and Google Slides. Include vibrant colors and shades to categorize or differentiate segments of your information, enhancing clarity and visual appeal. This infographic is the ideal tool to visually communicate your ideas, allowing your audience to follow along with ease.


4 slides
Data Table Infographic Presentation
Organize complex information clearly with the Data Table Infographic Presentation. This slide design features a structured table layout paired with icon-labeled column headers for visual clarity. Ideal for presenting statistics, performance metrics, survey data, or structured comparisons. Highlighted headers draw attention to key sections, making your data easy to digest. Fully editable in PowerPoint, Keynote, and Google Slides.


8 slides
2x2 Matrix Chart Presentation
Bring clarity to complex decisions with this clean, visually engaging layout designed for comparing four key factors at a glance. This presentation makes it easy to highlight priorities, map insights, and explain strategic choices with confidence. Fully customizable and compatible with PowerPoint, Keynote, and Google Slides.


7 slides
Timeline Schedule Infographics
A Timeline Schedule is an effective way to communicate complex schedules or timelines. It's a constructive tool for coordinating work and managing projects. This template can help you build a timeline, show the overview and present your value proposition. This timeline Infographic can be used for any business, personal, or academic project. This is a fully editable template so you can change the color, size and everything as per your needs. The timeline charts have been designed with various categories and time range pattern through which you can plan your projects in an effective way!