


Features
- 5 Unique slides
- Fully editable and easy to edit in Microsoft Powerpoint, Keynote and Google Slides
- 16:9 widescreen layout
- Clean and professional designs
- Export to JPG, PDF or send by email


Do you have any questions?
Recommend


20 slides
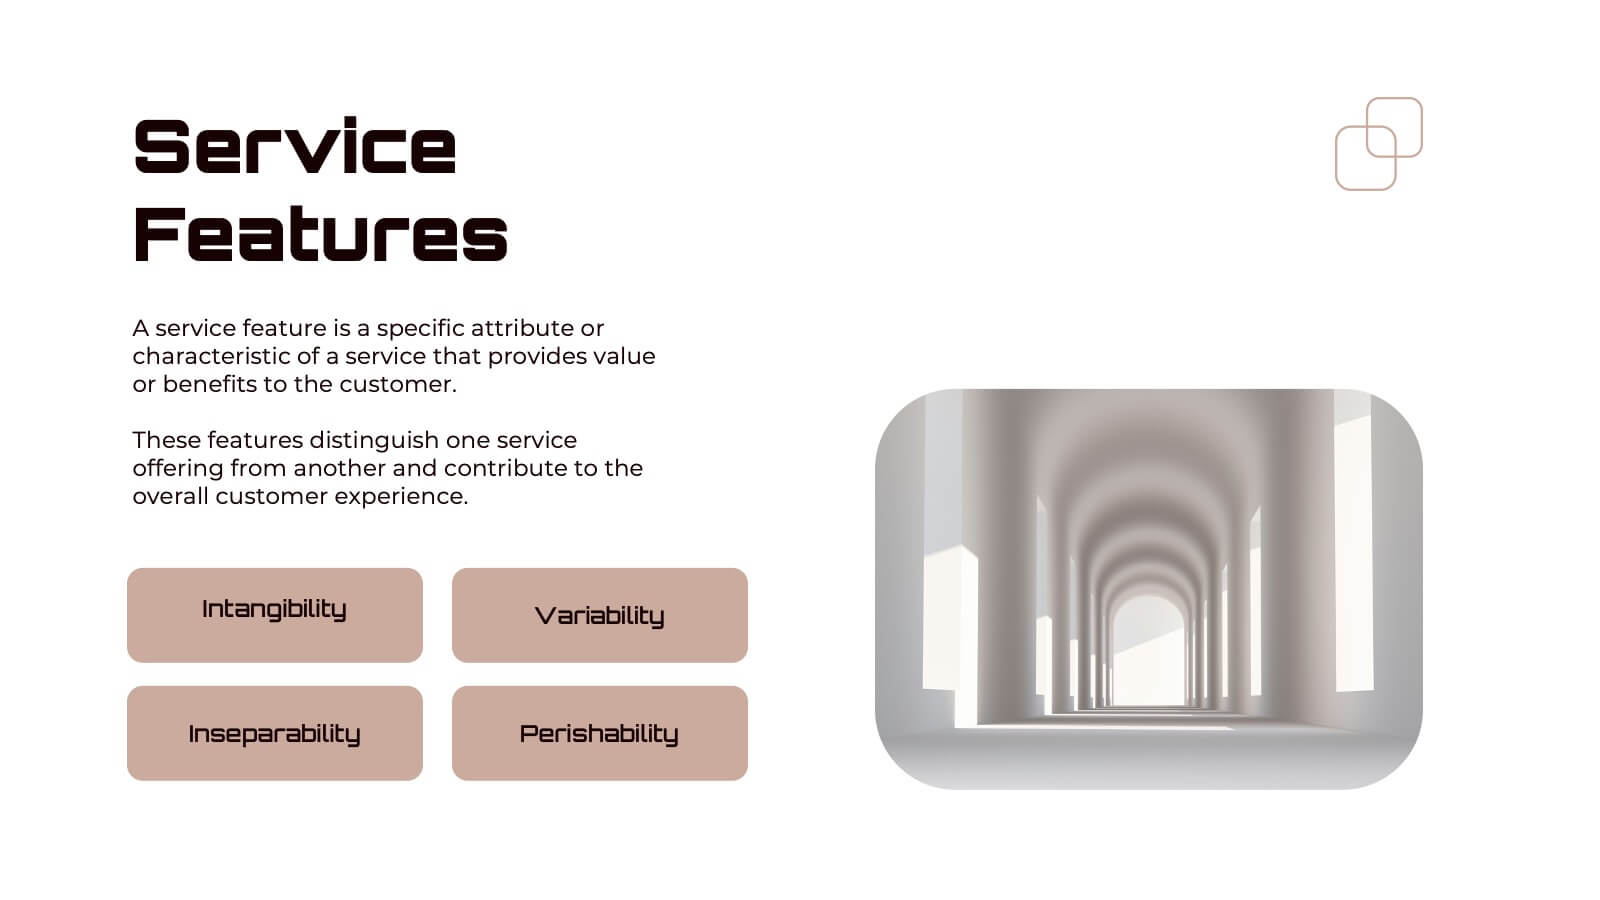
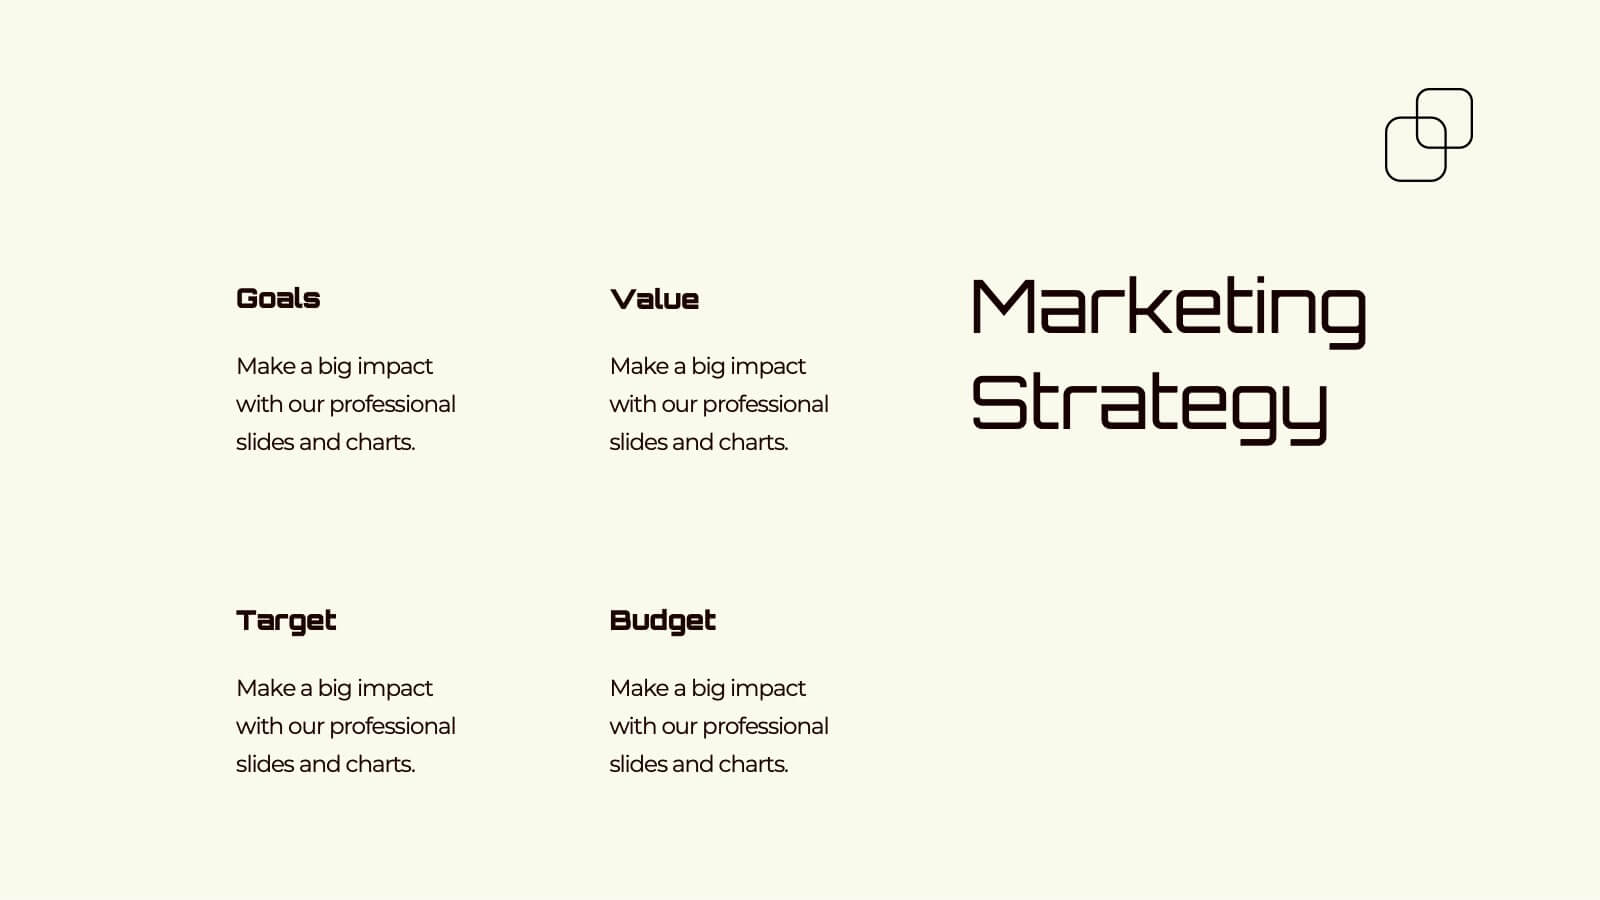
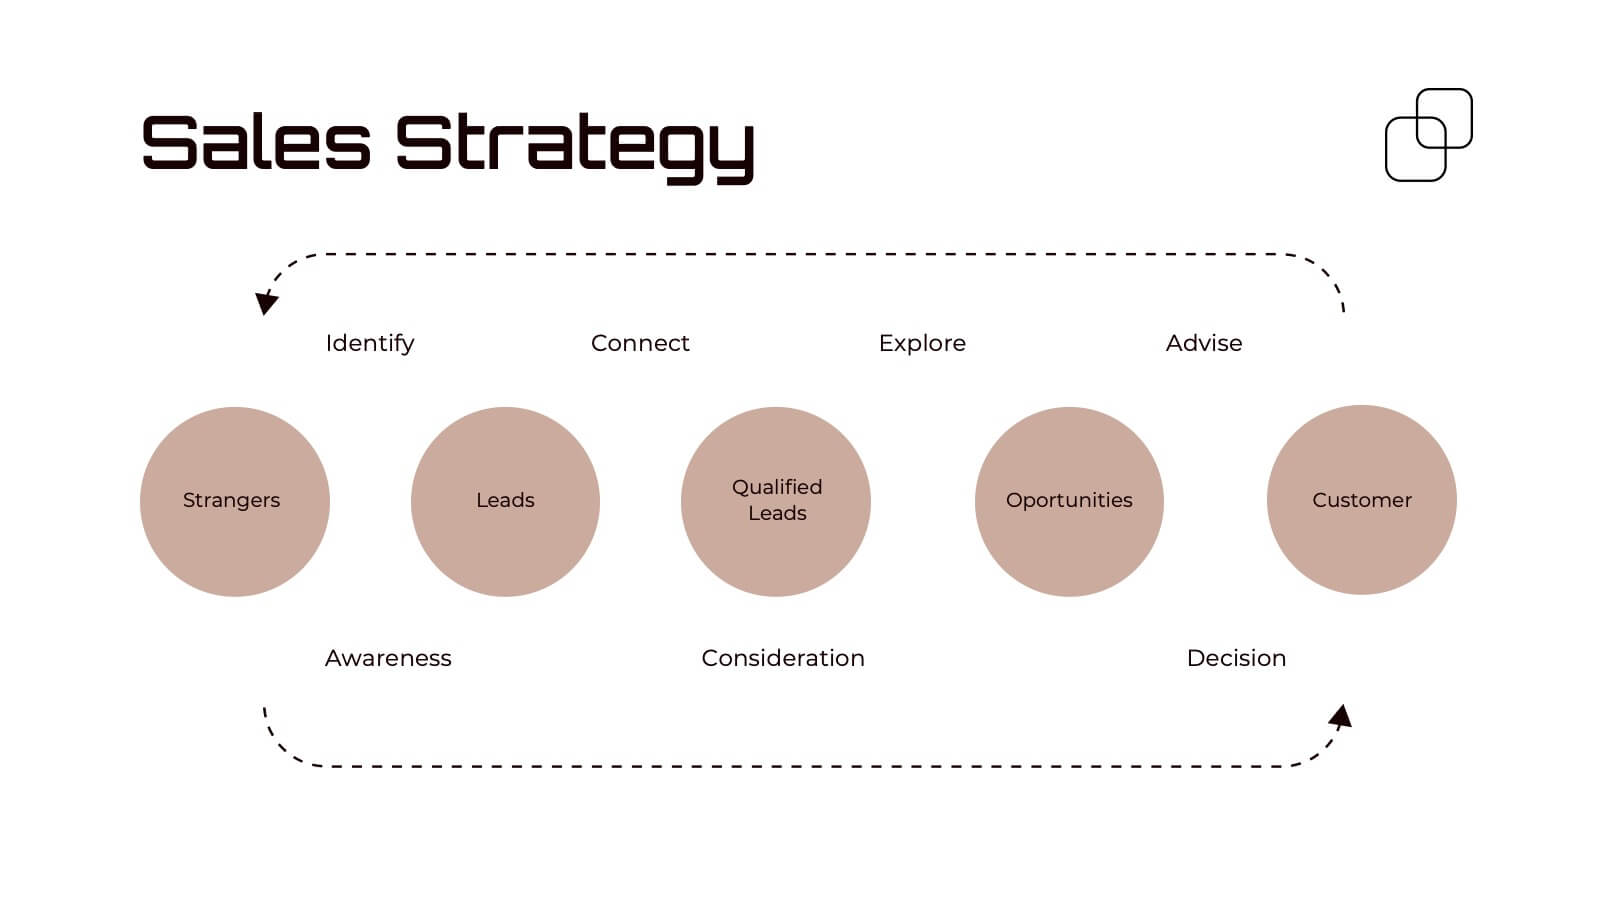
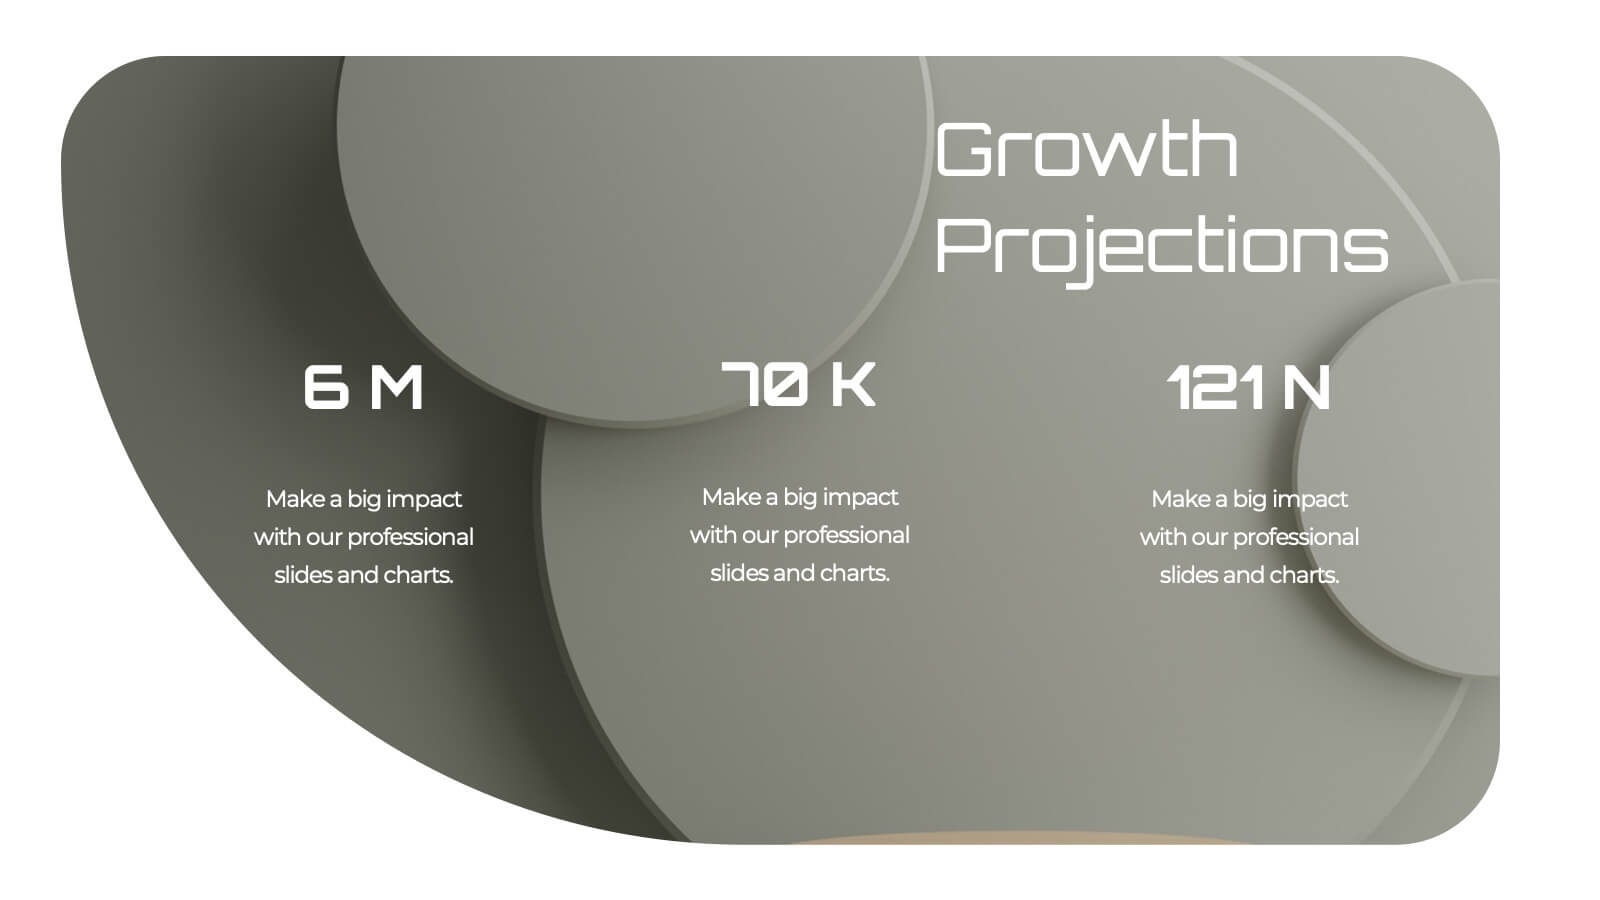
Pulsebeat Sales Proposal Presentation
Seal the deal with this compelling sales proposal template, crafted to showcase your offerings, customer value, and competitive edge with clarity. Including slides for sales objectives, process, pricing strategy, and performance metrics, it’s perfect for sales teams aiming to impress. Compatible with PowerPoint, Keynote, and Google Slides for effortless presentation.


4 slides
Crypto Investment Strategies Presentation
Dive into the dynamic world of cryptocurrency with our "Crypto Investment Strategies" presentation templates. These templates provide a structured approach to exploring various investment strategies, perfect for financial advisors and crypto enthusiasts. Easily editable and visually engaging, they're designed to help you present complex information in a clear manner. Compatible with PowerPoint, Keynote, and Google Slides, they offer flexibility across different platforms, ensuring your presentation looks great no matter where you show it.


4 slides
E-Learning Course Design Overview Presentation
Spark curiosity from the very first slide with a clean, modern layout that explains how effective online learning experiences are planned and delivered. This presentation walks through key elements of course structure, content flow, and learner engagement in a simple, visual way. Fully compatible with PowerPoint, Keynote, and Google Slides.


7 slides
Digital Marketing Services Infographic
A Digital Marketing Services Infographic is a visual representation of information and data related to digital marketing services. This template is a type of graphic design that presents complex or large amounts of information in a simple and informative way. This infographic includes statistics, charts, graphs, and other visual elements to convey your information about various aspects of digital marketing, such as social media marketing, content marketing, search engine optimization, email marketing, and paid advertising. Compatible with Powerpoint, Keynote and Google Slides.


7 slides
Supply Chain Infographic Presentation Template
A Supply Chain is a strategic business process that can help organizations improve capacity, reduce cost and risk, attain growth potential and create value. A supply chain consists of these activity points: Suppliers, Manufacturing, Distribution, retailer, Customers. This template will help you to create a supply chain that meets your needs. It includes six clear steps, fill each box with details about what you want in each part of the supply chain. With this template, you’ll get a clear picture of what’s working in your supply chain and where there are opportunities for improvement.


10 slides
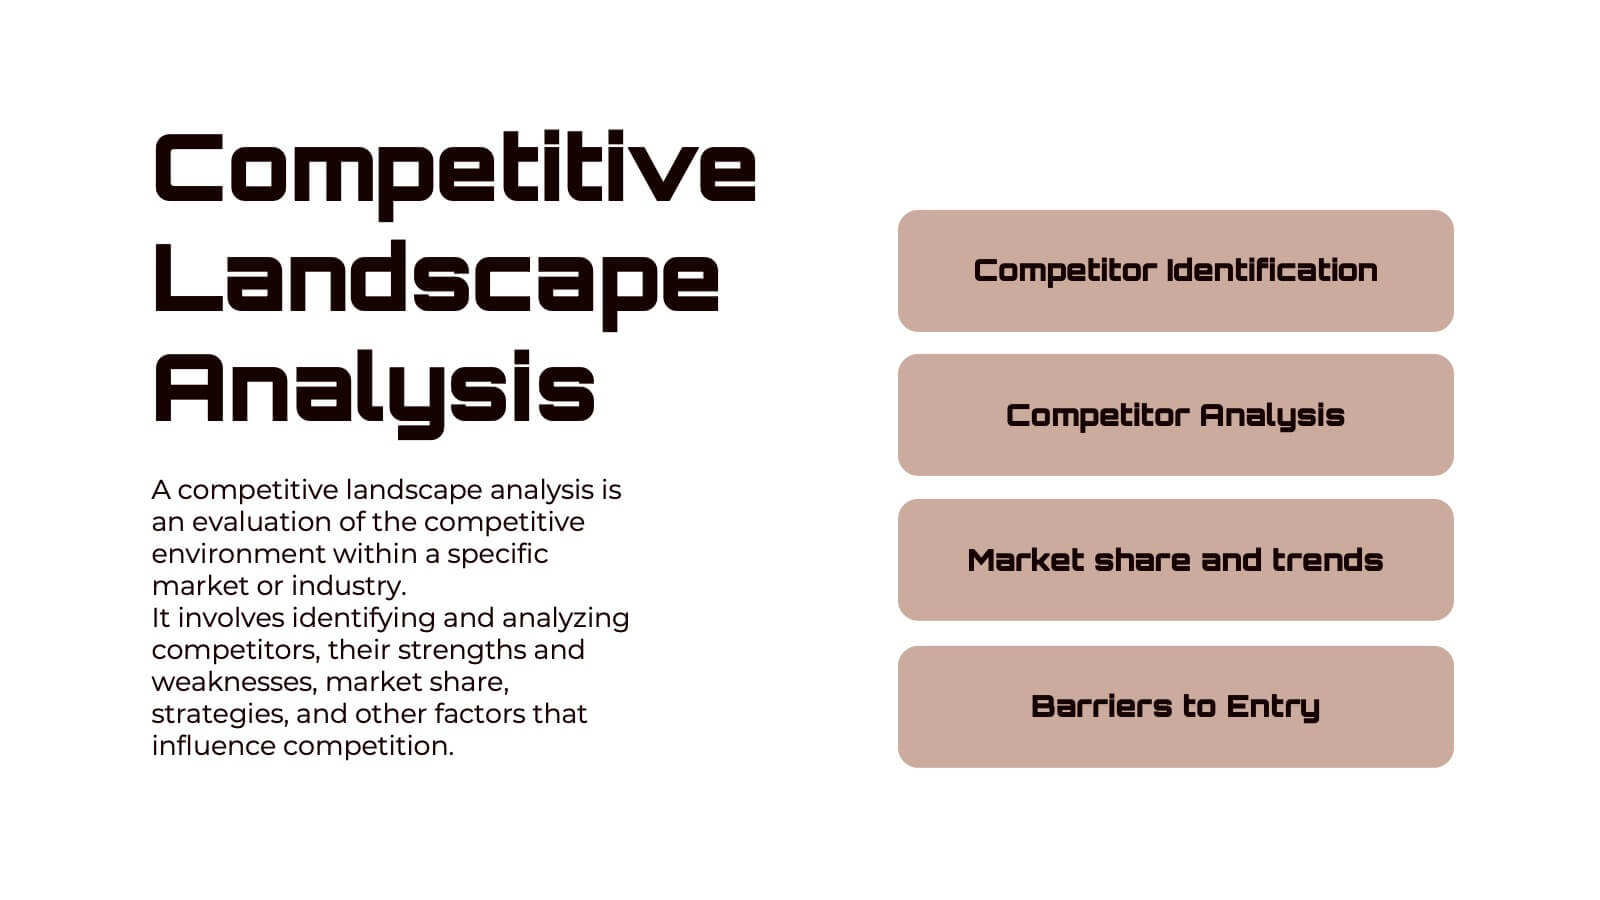
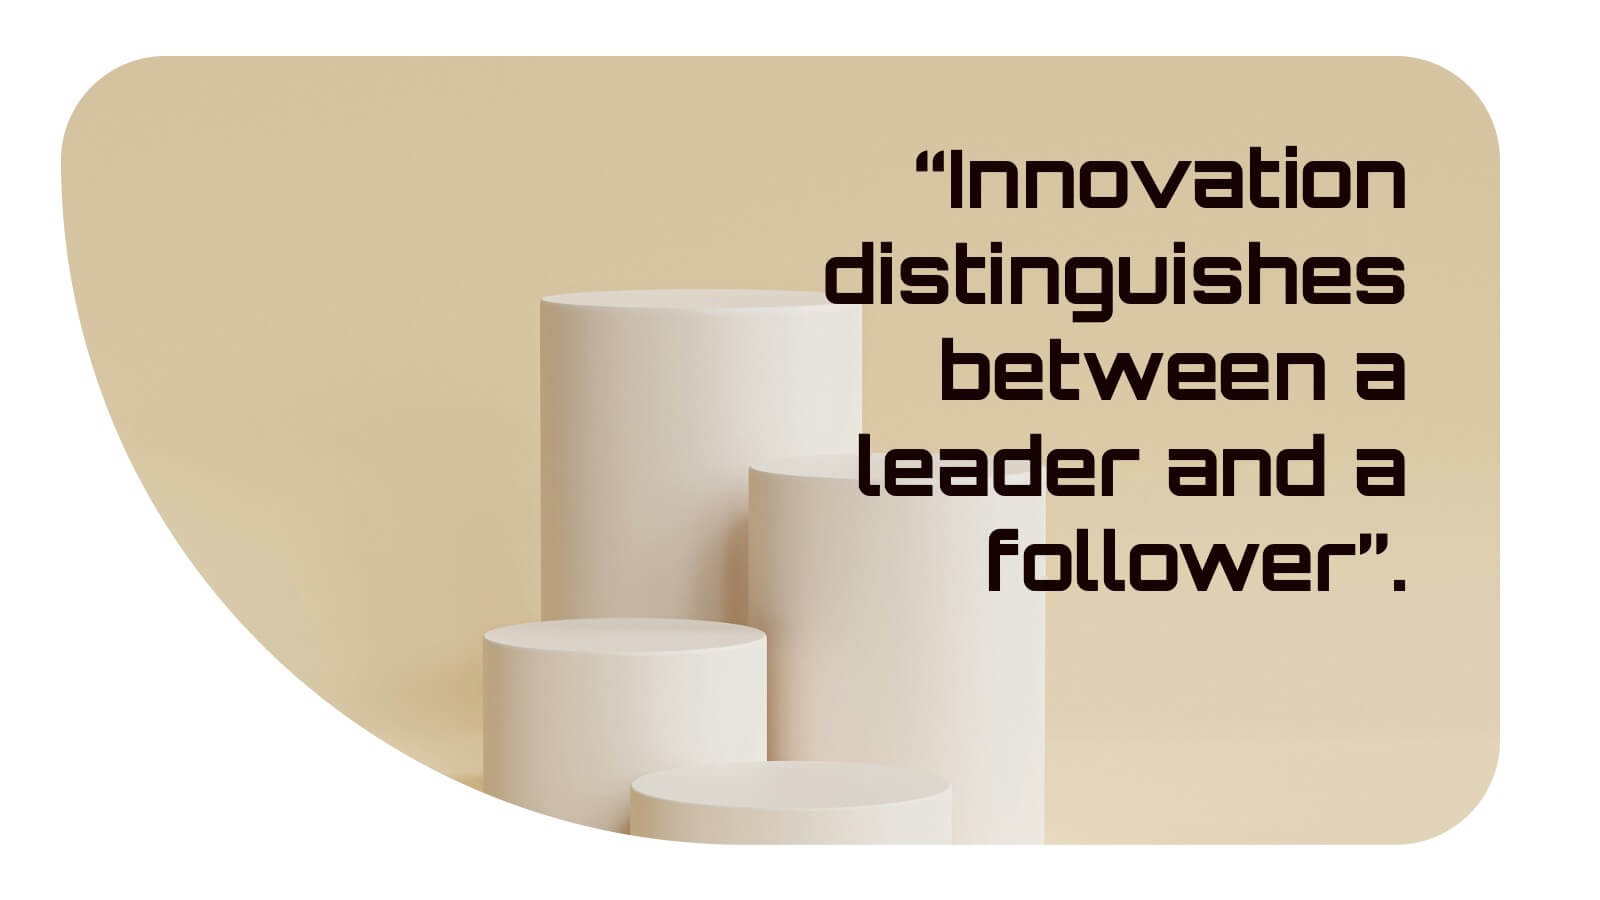
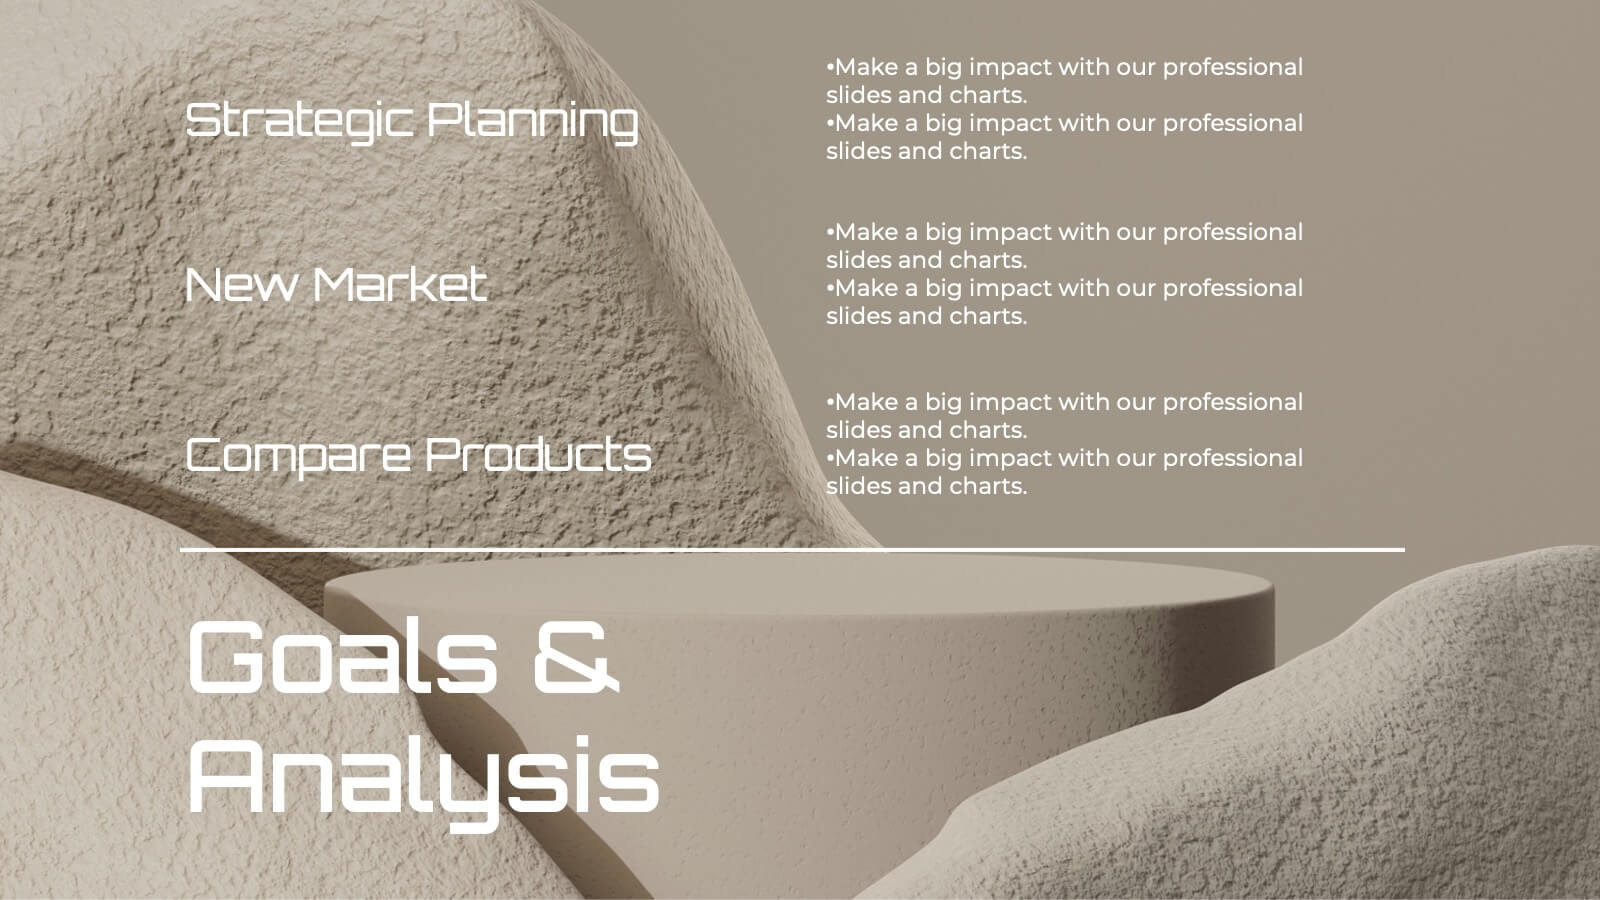
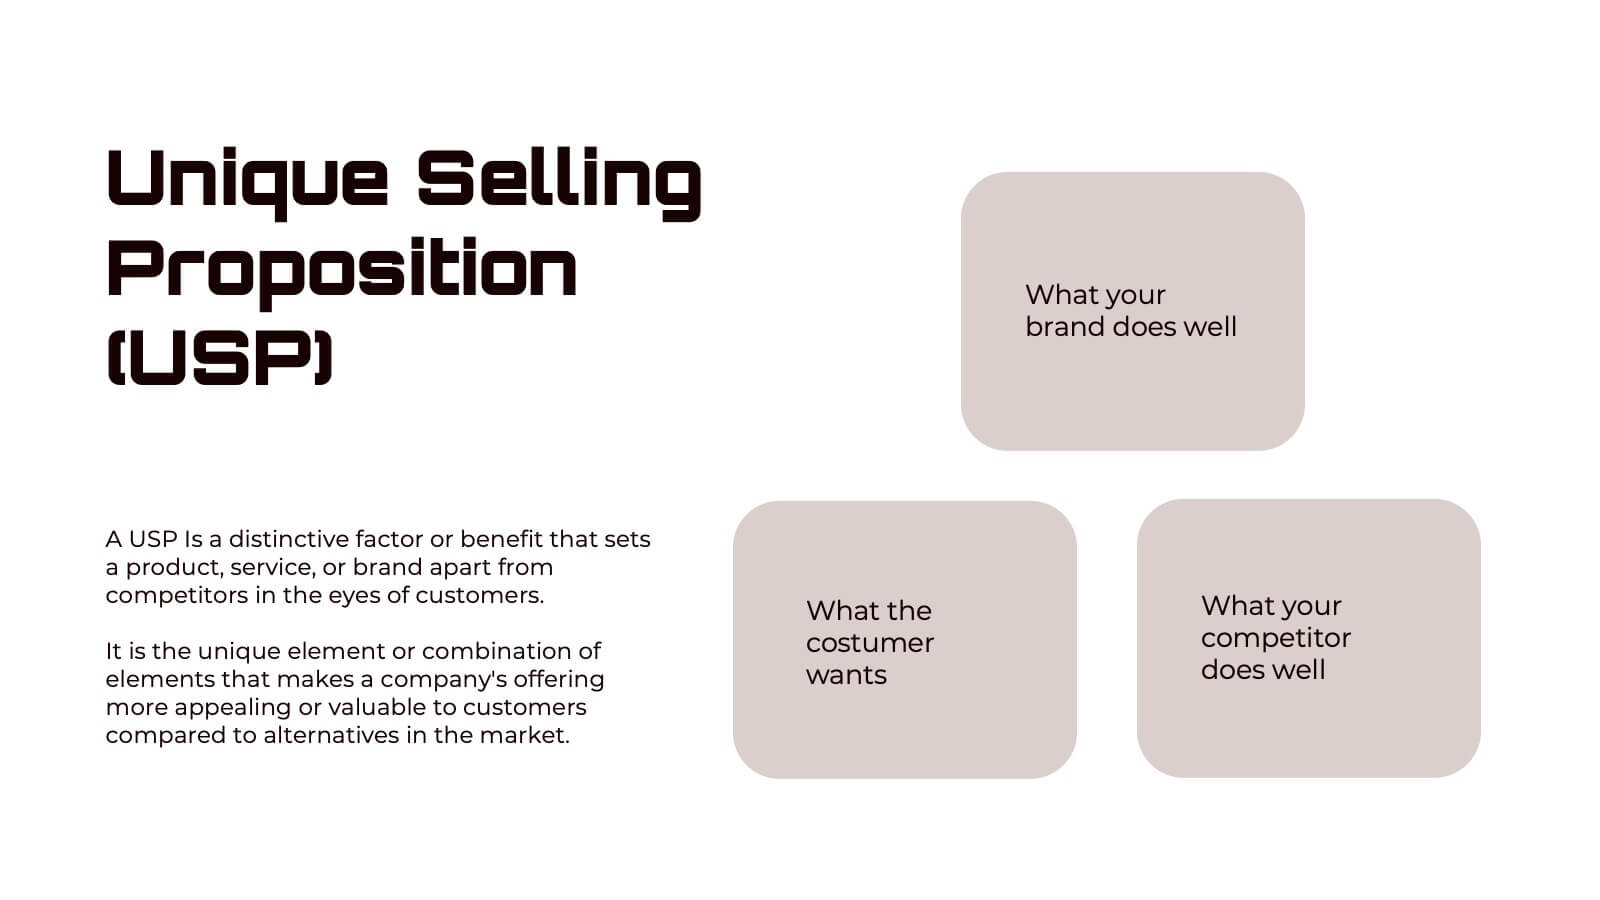
Depth-Based Visual Charts in 3D Presentation
Elevate your data storytelling with the Depth-Based Visual Charts in 3D Presentation. This slide set transforms layered information into eye-catching 3D stack visuals—perfect for showcasing rankings, workflows, or strategic hierarchies. Fully editable in PowerPoint, Keynote, and Google Slides for seamless customization.


4 slides
Comparison Tables Slide Presentation
Make your insights instantly comparable with a clean layout designed to highlight differences and advantages with ease. This presentation helps you break down options, features, or plans in a clear visual table your audience can understand at a glance. Fully compatible with PowerPoint, Keynote, and Google Slides.


4 slides
Global Business Distribution Layout Presentation
Visualize your company’s international footprint with this Global Business Distribution Layout. Perfect for showcasing market reach, branch networks, or regional performance. Features a clean world map design with customizable highlight zones. Fully editable in PowerPoint, Keynote, and Google Slides—ideal for corporate overviews, investor decks, and business expansion presentations.


4 slides
IT Operations Management Presentation
Enhance your IT strategy with the IT Operations Management Presentation template. This clean, modern slide layout helps illustrate key operational processes, performance metrics, and strategic improvements with an easy-to-follow, upward trajectory design. Ideal for IT managers and business leaders looking to showcase efficiency, scalability, and innovation. Fully editable in PowerPoint, Keynote, and Google Slides for seamless customization.


6 slides
Risk Management Strategies Infographic
Risk management is the process of identifying, assessing, prioritizing, and mitigating risks in order to minimize their impact on an organization's objectives and projects. This infographic template is designed to convey important information about identifying, assessing, and mitigating risks in various contexts. The icons and symbols are added to represent different stages of risk management, such as identification, assessment, mitigation, and monitoring. This Infographic can effectively communicate the importance of risk management and provide insights into the strategies used to mitigate potential risks in various contexts.


6 slides
Next-Gen Wireless Solutions Overview Presentation
Give your wireless solutions pitch a sleek, professional edge with this futuristic globe-style layout. Perfect for tech-driven topics, this infographic highlights six key areas in a clear, visually engaging format. Fully customizable and easy to use in PowerPoint, Keynote, and Google Slides—ideal for product overviews, innovation briefings, or strategy updates.


4 slides
Company Vision and Long-Term Goals Presentation
Present your company’s future with clarity and impact using this Company Vision and Long-Term Goals slide. Featuring a bar chart-style graphic with ascending growth stages, this template allows you to showcase strategic milestones, business values, or development phases. Each bar is paired with icons and editable text to highlight specific goals, making it ideal for leadership meetings, strategic planning, or investor pitches. Clean, modern, and customizable in PowerPoint, Keynote, and Google Slides.

22 slides
Pearl Product Launch Pitch Deck Presentation
Make your product launch shine with this sleek, pearl-inspired presentation! Perfect for pitching your product’s unique value, market positioning, and growth potential, this template is designed to captivate investors and stakeholders. Its elegant, minimalist layout keeps your message front and center. Compatible with PowerPoint, Keynote, and Google Slides.


20 slides
Nightshade Design Portfolio Presentation
The Design Portfolio Presentation Template offers 20 slides to showcase your creative work, including design briefs, elements, processes, and feedback. Perfect for professionals to highlight projects with a modern, vibrant layout. Fully editable and compatible with PowerPoint, Keynote, and Google Slides.


2 slides
App Interface Device Preview Presentation
Display your mobile app design with this sleek interface preview layout. Centered around a realistic smartphone mockup, this template includes four surrounding sections for text or key features. Ideal for pitch decks or product demos, it's fully editable in PowerPoint, Keynote, or Google Slides to match your brand.


6 slides
Defined Company Objectives Breakdown
Break down your company’s key priorities using this Defined Company Objectives slide. Featuring upward-pointing arrows from a central base, it visually maps out strategic goals in a clear, directional format. Fully customizable in PowerPoint, Keynote, and Google Slides.


7 slides
Project Status Report Infographic Presentation
The importance of project status is related to the ability to monitor and control a project effectively. Project status is essential for effective project management. This template has been designed to help professionals gain more control over their projects. Use this template to enable project stakeholders to communicate, monitor progress, manage risks, make informed decisions, and promote accountability and continuous improvement. You can use this to manage all your projects, tasks and team members effortlessly. This template is available in PowerPoint, Keynote and Google Slides.