


Features
- 5 Unique slides
- Fully editable and easy to edit in Microsoft Powerpoint, Keynote and Google Slides
- 16:9 widescreen layout
- Clean and professional designs
- Export to JPG, PDF or send by email


Do you have any questions?
Recommend


5 slides
Athletic Performance Stats Presentation
Experience a dynamic way to showcase progress with this clean, athlete-inspired presentation design. It helps simplify performance insights, highlight key metrics, and communicate training results with clarity and impact. Ideal for sports reports, fitness reviews, or coaching updates, this professional presentation is fully compatible with PowerPoint, Keynote, and Google Slides.


4 slides
Types of Cloud Services Presentation
Turn technical concepts into clear, engaging visuals with this sleek and modern template. Perfect for showcasing digital platforms, cloud solutions, and service models, it helps you simplify complex data while maintaining a professional tone. Fully editable and compatible with PowerPoint, Keynote, and Google Slides for easy customization.


5 slides
Concept Overlap with Venn Diagram Presentation
Visually map overlapping concepts and relationships with this four-circle Venn diagram slide. Perfect for presenting interdependencies, cross-functional insights, or product comparisons. Each section includes editable labels and icons to personalize your content. Compatible with PowerPoint, Keynote, and Google Slides—ideal for business strategies, brainstorming sessions, and collaborative team presentations.


5 slides
Operations Performance KPI Visual Layout Presentation
Visualize operational KPIs with this clean and modern layout. Highlight four key metrics using pie chart visuals, percentage headers, and customizable labels. Perfect for business operations reviews, performance tracking, or team updates. Fully editable and compatible with PowerPoint, Keynote, and Google Slides for seamless, data-driven presentations.


23 slides
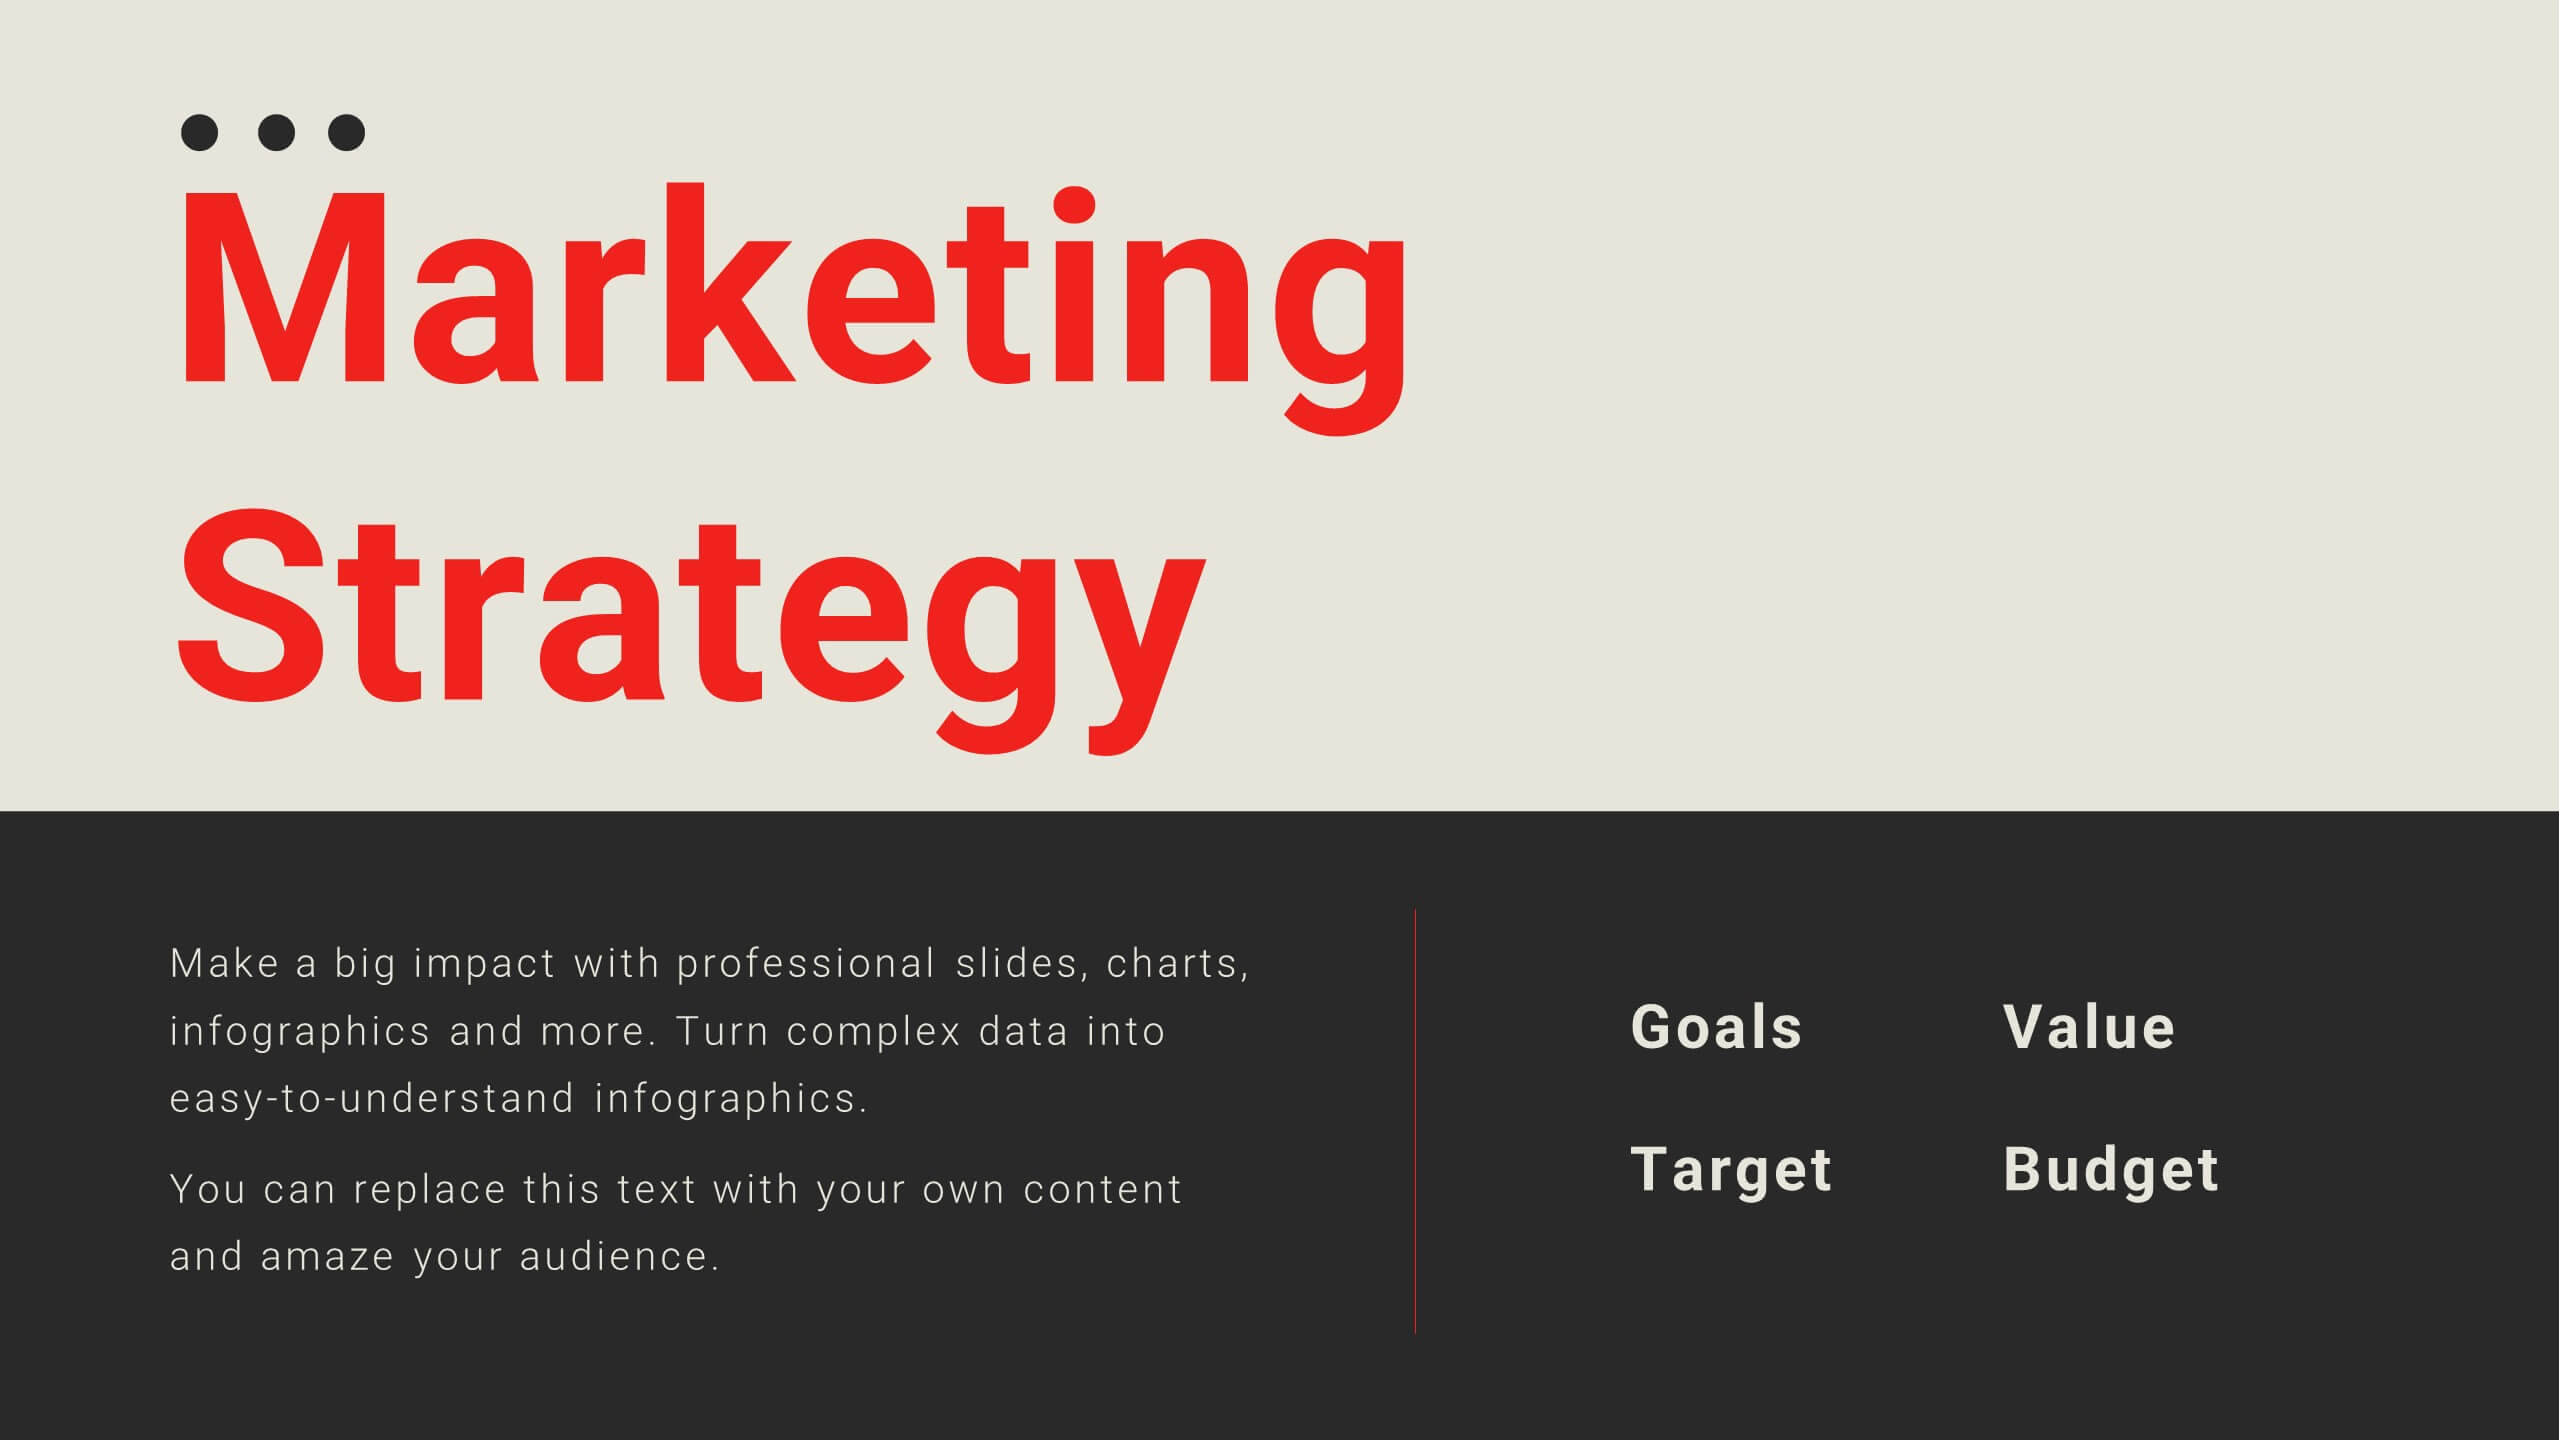
Halo Digital Strategy Presentation
Elevate your digital strategy presentations with this vibrant, professional template. Perfect for showcasing market trends, SWOT analysis, and strategic objectives, it features a modern layout with a cohesive color scheme. Highlight key elements like growth opportunities, value propositions, and performance metrics to captivate your audience. Compatible with PowerPoint, Keynote, and Google Slides, it ensures seamless presentations on any platform.


5 slides
Strategic Objectives and Goals Presentation
Bring your strategy to life with a clear, forward-moving layout that makes every milestone feel achievable. This presentation guides audiences through key objectives, breakthrough goals, and measurable progress, helping teams stay aligned and inspired. Fully editable and easy to adapt, it works seamlessly with PowerPoint, Keynote, and Google Slides.


5 slides
Managing Product Maturity and Decline
Effectively visualize each phase of a product’s lifecycle with this curve-style infographic—from introduction to decline. Ideal for business strategy, product development, or market lifecycle planning. Fully editable in PowerPoint, Keynote, or Google Slides for seamless customization.


6 slides
3D Diagram Slide Presentation
Bring your ideas to life with this modern 3D visual layout that adds depth and clarity to any concept. Ideal for breaking down complex information into four connected sections, it enhances understanding through visual hierarchy. Fully customizable and compatible with PowerPoint, Keynote, and Google Slides for effortless use.


4 slides
Funding and Investment Project Proposal Presentation
Unlock the potential of your next big venture with this vibrant and organized infographic presentation template! Perfect for outlining key stages from research to returns, this template makes complex investment strategies accessible and engaging. Tailor each segment to fit your project's unique needs. Compatible with PowerPoint, Keynote, and Google Slides, it's ideal for professionals looking to impress stakeholders and secure funding.


26 slides
Katlina Presentation Template
Everyone wants to be on top of their SEO game. This Katlina presentation template provides a way for you to teach your audience about the importance of Search Engine Optimization. Start creating your own slides with this template. With fun graphics that will also make the information more interesting and easy to understand charts and timelines.This presentation will help your audience see how they can increase their sites visibility in search results. It can also be use for your presentations at work or in class due to it's customizability. Get started today makeing an impact in your industry.


4 slides
Social Campaign Planning Presentation
Bring clarity to your outreach goals with a bold, funnel-style layout that makes every campaign step easy to visualize. This presentation helps you outline stages, objectives, and audience actions in a clean, structured format ideal for marketing teams. Fully editable and compatible with PowerPoint, Keynote, and Google Slides.


4 slides
Buyer Persona Research and Profile Map Presentation
Make your audience feel like they already know your ideal customer. This creative template helps you visually map out key buyer persona data, such as demographics, goals, behavior, and pain points. Perfect for marketing strategy and customer research presentations. Fully compatible with PowerPoint, Keynote, and Google Slides for seamless editing.


5 slides
How Alcohol Affects The Body Infographics
The effects of alcohol can vary depending on factors such as the amount consumed, frequency of consumption, individual tolerance, and overall health. These infographic templates can be used as informative resources that illustrate the impact of alcohol on the human body. This template is designed to help educate and raise awareness about the physiological and health effects of alcohol consumption. Compatible with Powerpoint, Keynote, and Google Slides. With its visually appealing design, organized sections, and clear information, this template will help create awareness and promote responsible alcohol consumption practices.


21 slides
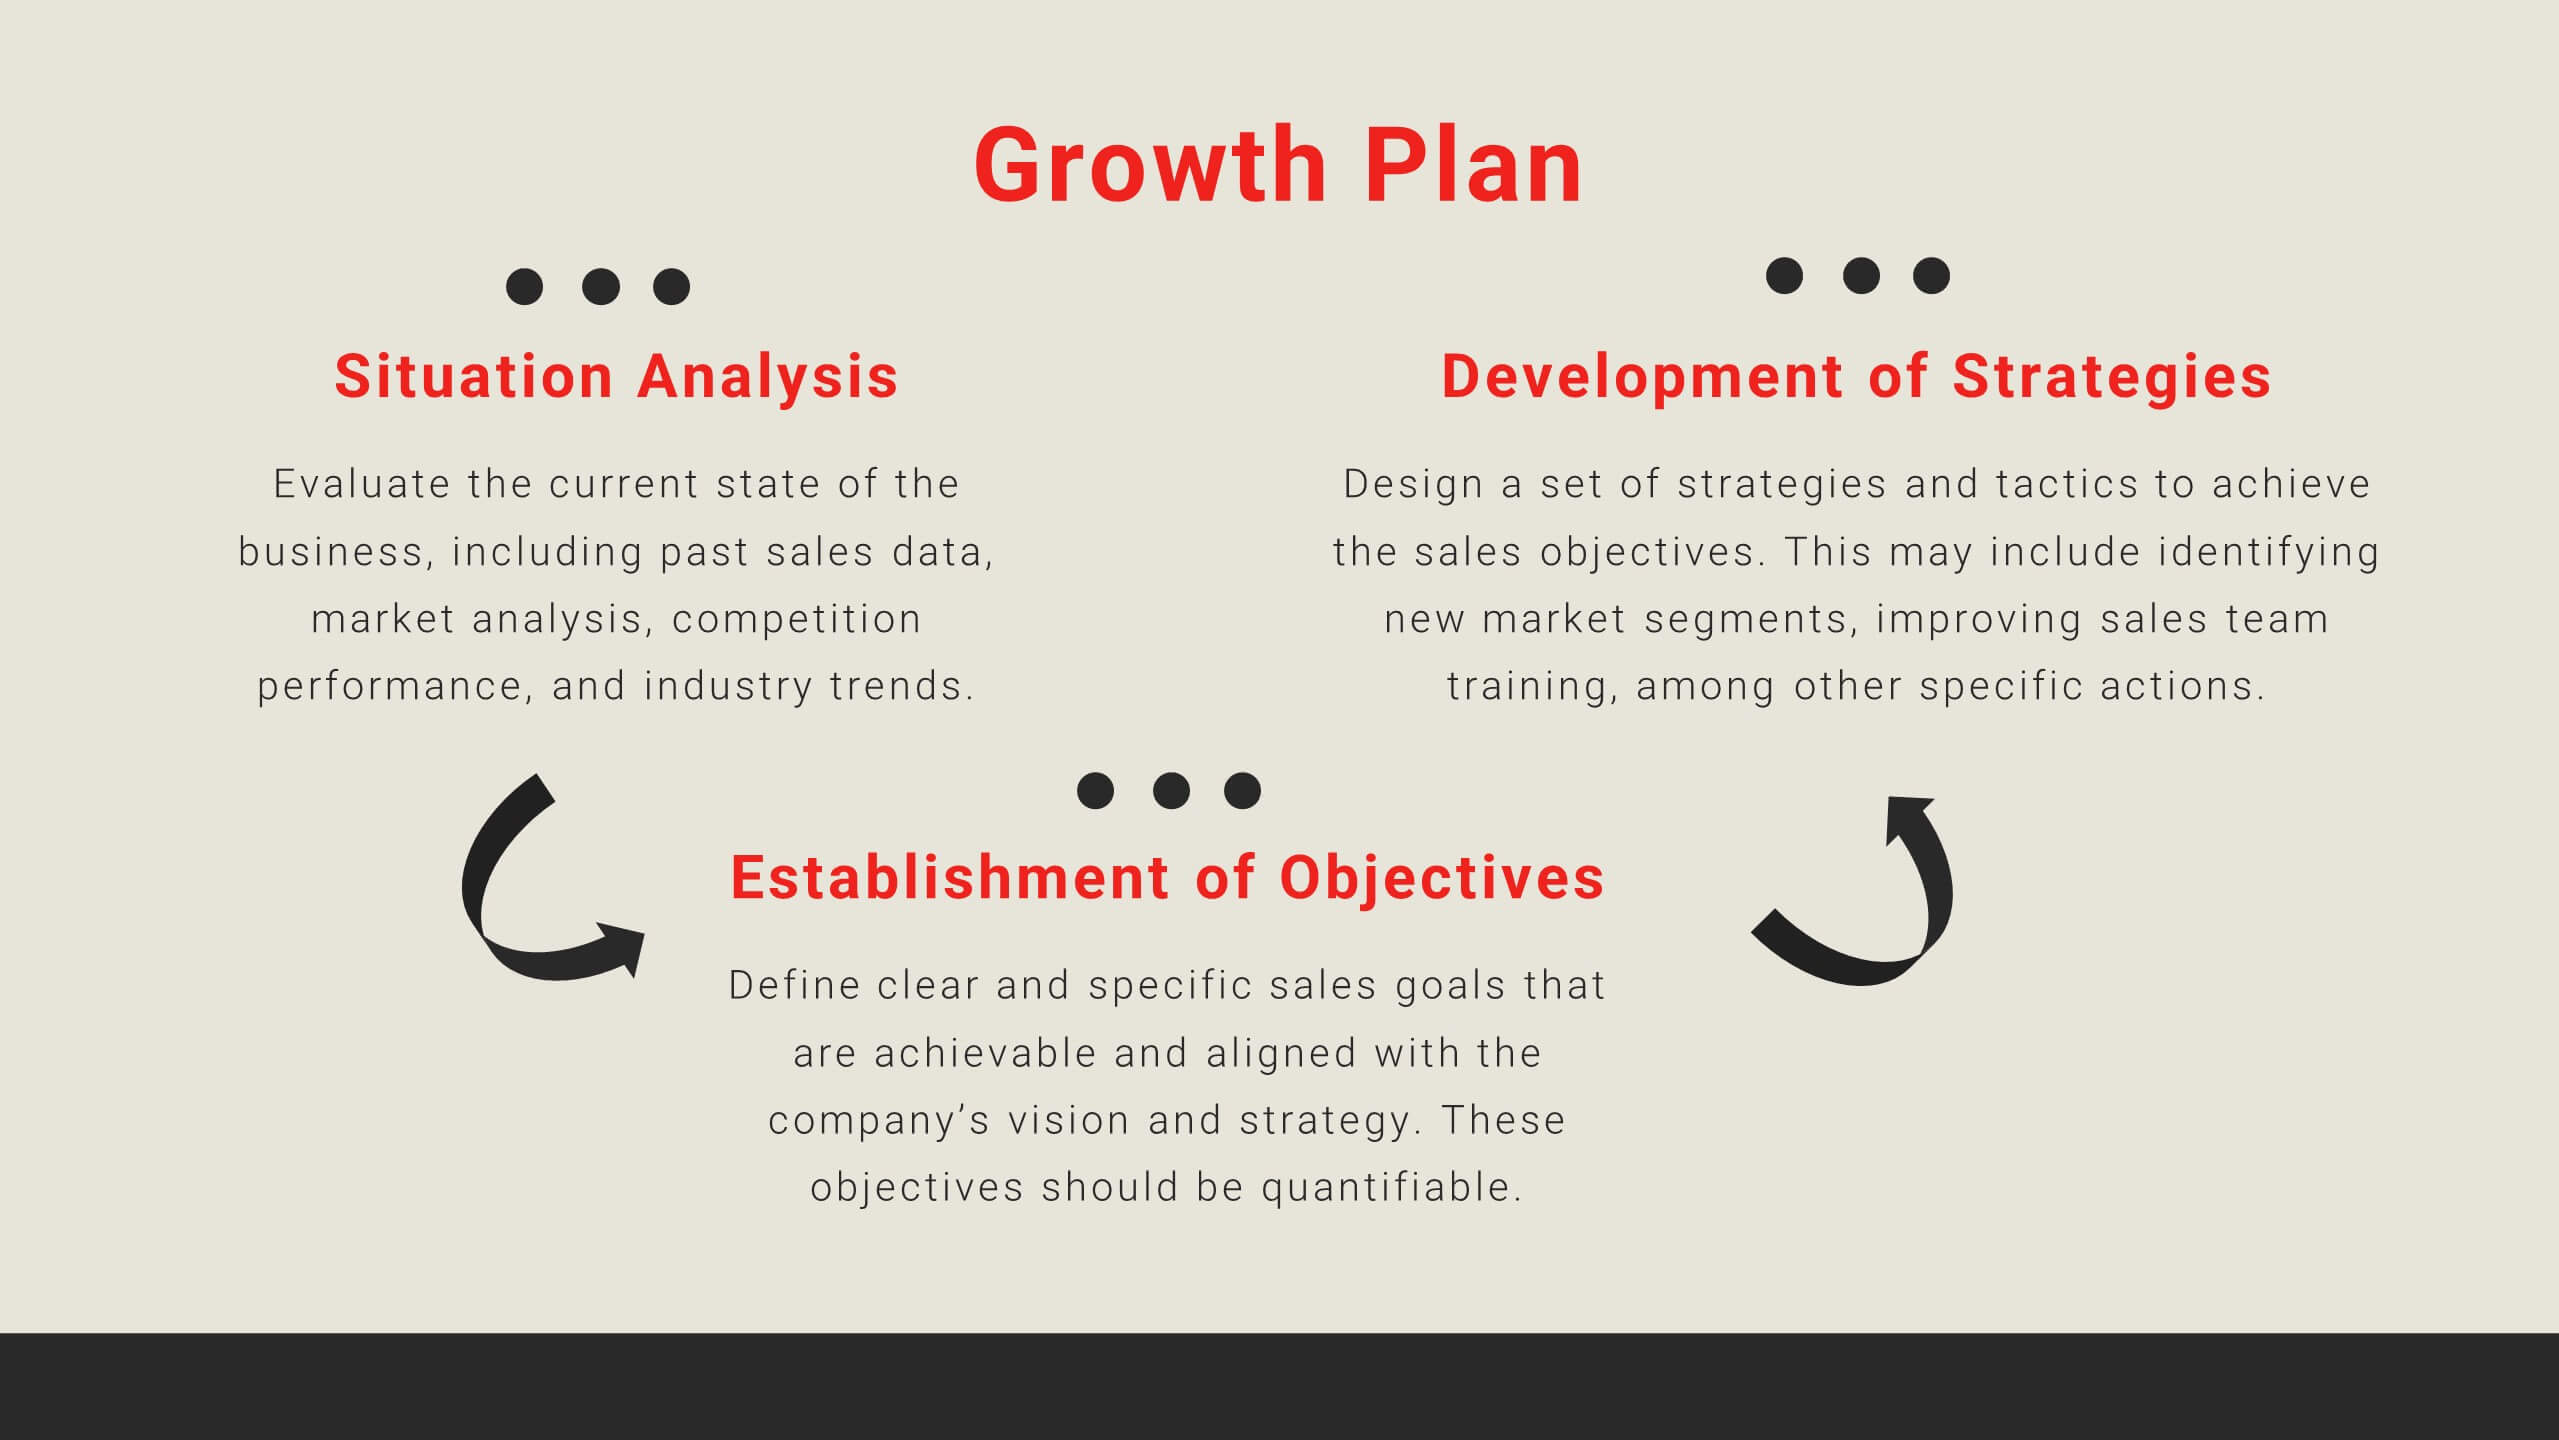
Velocity Startup Growth Plan Presentation
Accelerate your startup's growth with this dynamic plan template! Perfect for outlining your mission, vision, business model, and marketing strategy. Ideal for entrepreneurs aiming to secure funding and drive success. Compatible with PowerPoint, Keynote, and Google Slides, this template ensures your growth plan is clear, professional, and compelling. Achieve your startup goals today!


8 slides
Business Growth Strategies Presentation
Take your vision from concept to expansion with a sleek, modern presentation designed to highlight progress and future potential. Ideal for showcasing goals, performance metrics, and market strategies, it keeps your ideas structured and engaging. Fully compatible with PowerPoint, Keynote, and Google Slides for effortless customization and presentation delivery.


5 slides
Employee and Team Performance Analysis Presentation
Visualize individual and team contributions with this clear and structured performance analysis template. Showcase key metrics, employee growth, and team achievements using easy-to-read layouts and progress indicators. Ideal for HR reports, performance reviews, and team evaluations. Fully editable in PowerPoint, Keynote, and Google Slides.


24 slides
Djinn Brand Identity Presentation
Unleash the power of your brand with this sleek and modern presentation template! From brand identity components to target audience personas, this template covers everything you need to craft a cohesive and compelling brand strategy. Whether showcasing brand guidelines or success stories, it’s designed for maximum clarity and impact. Compatible with PowerPoint, Keynote, and Google Slides for effortless presentations.