


Features
- 6 Unique slides
- Fully editable and easy to edit in Microsoft Powerpoint, Keynote and Google Slides
- 16:9 widescreen layout
- Clean and professional designs
- Export to JPG, PDF or send by email


Do you have any questions?
Recommend


6 slides
Ideal Customer Profile Infographic
A customer profile, also known as a buyer persona, is a detailed and semi-fictional representation of your ideal customer. This infographic template can help businesses visualize and communicate their target audience characteristics and preferences. This template is a valuable tool for educating your team and clients about your ideal customer profile. This customer profile infographic can help your team align their efforts towards effectively targeting and engaging the right audience for your products or services. Compatible with Powerpoint, Keynote, and Google Slides. Incorporate your brand's logo and color scheme to maintain consistency.


5 slides
Cryptocurrency Scams Infographics
Navigate the intricate world of digital currency with our cryptocurrency scams infographics template. This essential tool, designed with an informative and vertical style, serves as a beacon for investors, financial advisors, and digital currency enthusiasts, providing safeguarding strategies against the rising tide of cryptocurrency scams. Set against a bold palette of purple, yellow, and green, the template employs crisp graphics, decipherable icons, and strategic image placeholders to break down complex scam methodologies and preventive measures. Compatible with Powerpoint, Keynote, and Google Slides. Promote informed decision-making in the volatile cryptocurrency market.


8 slides
Construction Project Planning Presentation
Streamline project timelines with the Construction Project Planning template. This visually structured design helps organize key phases, tasks, and milestones for efficient workflow management. Ideal for project managers and construction professionals, it enhances clarity in presentations. Fully customizable and compatible with PowerPoint, Keynote, and Google Slides for seamless integration.


6 slides
Market Structure Infographics
Explore market structure effectively with our Market Structure infographic template. This template is fully compatible with popular presentation software like PowerPoint, Keynote, and Google Slides, allowing you to easily customize it to illustrate and communicate various aspects of market structures. The Market Structure infographic template offers a visually engaging platform to explain different types of market structures, including perfect competition, monopolistic competition, oligopoly, and monopoly. Whether you're a student, economist, business professional, or anyone interested in economics and market dynamics, this template provides a user-friendly canvas to create informative presentations and educational materials. Deepen your understanding of market structure with this SEO-optimized infographic template, thoughtfully designed for clarity and ease of use. Customize it to showcase the characteristics, examples, and implications of each market structure, ensuring that your audience gains valuable insights into how markets function. Start crafting your personalized infographic today to explore the world of market structure in economics.


5 slides
Veterinary Research and Innovation Presentation
This slide blends a professional layout with a touch of charm using a magnifying glass and pet illustration to highlight four veterinary milestones. Ideal for research updates, innovation pathways, or veterinary breakthroughs. Easily editable in PowerPoint, Keynote, or Google Slides.


21 slides
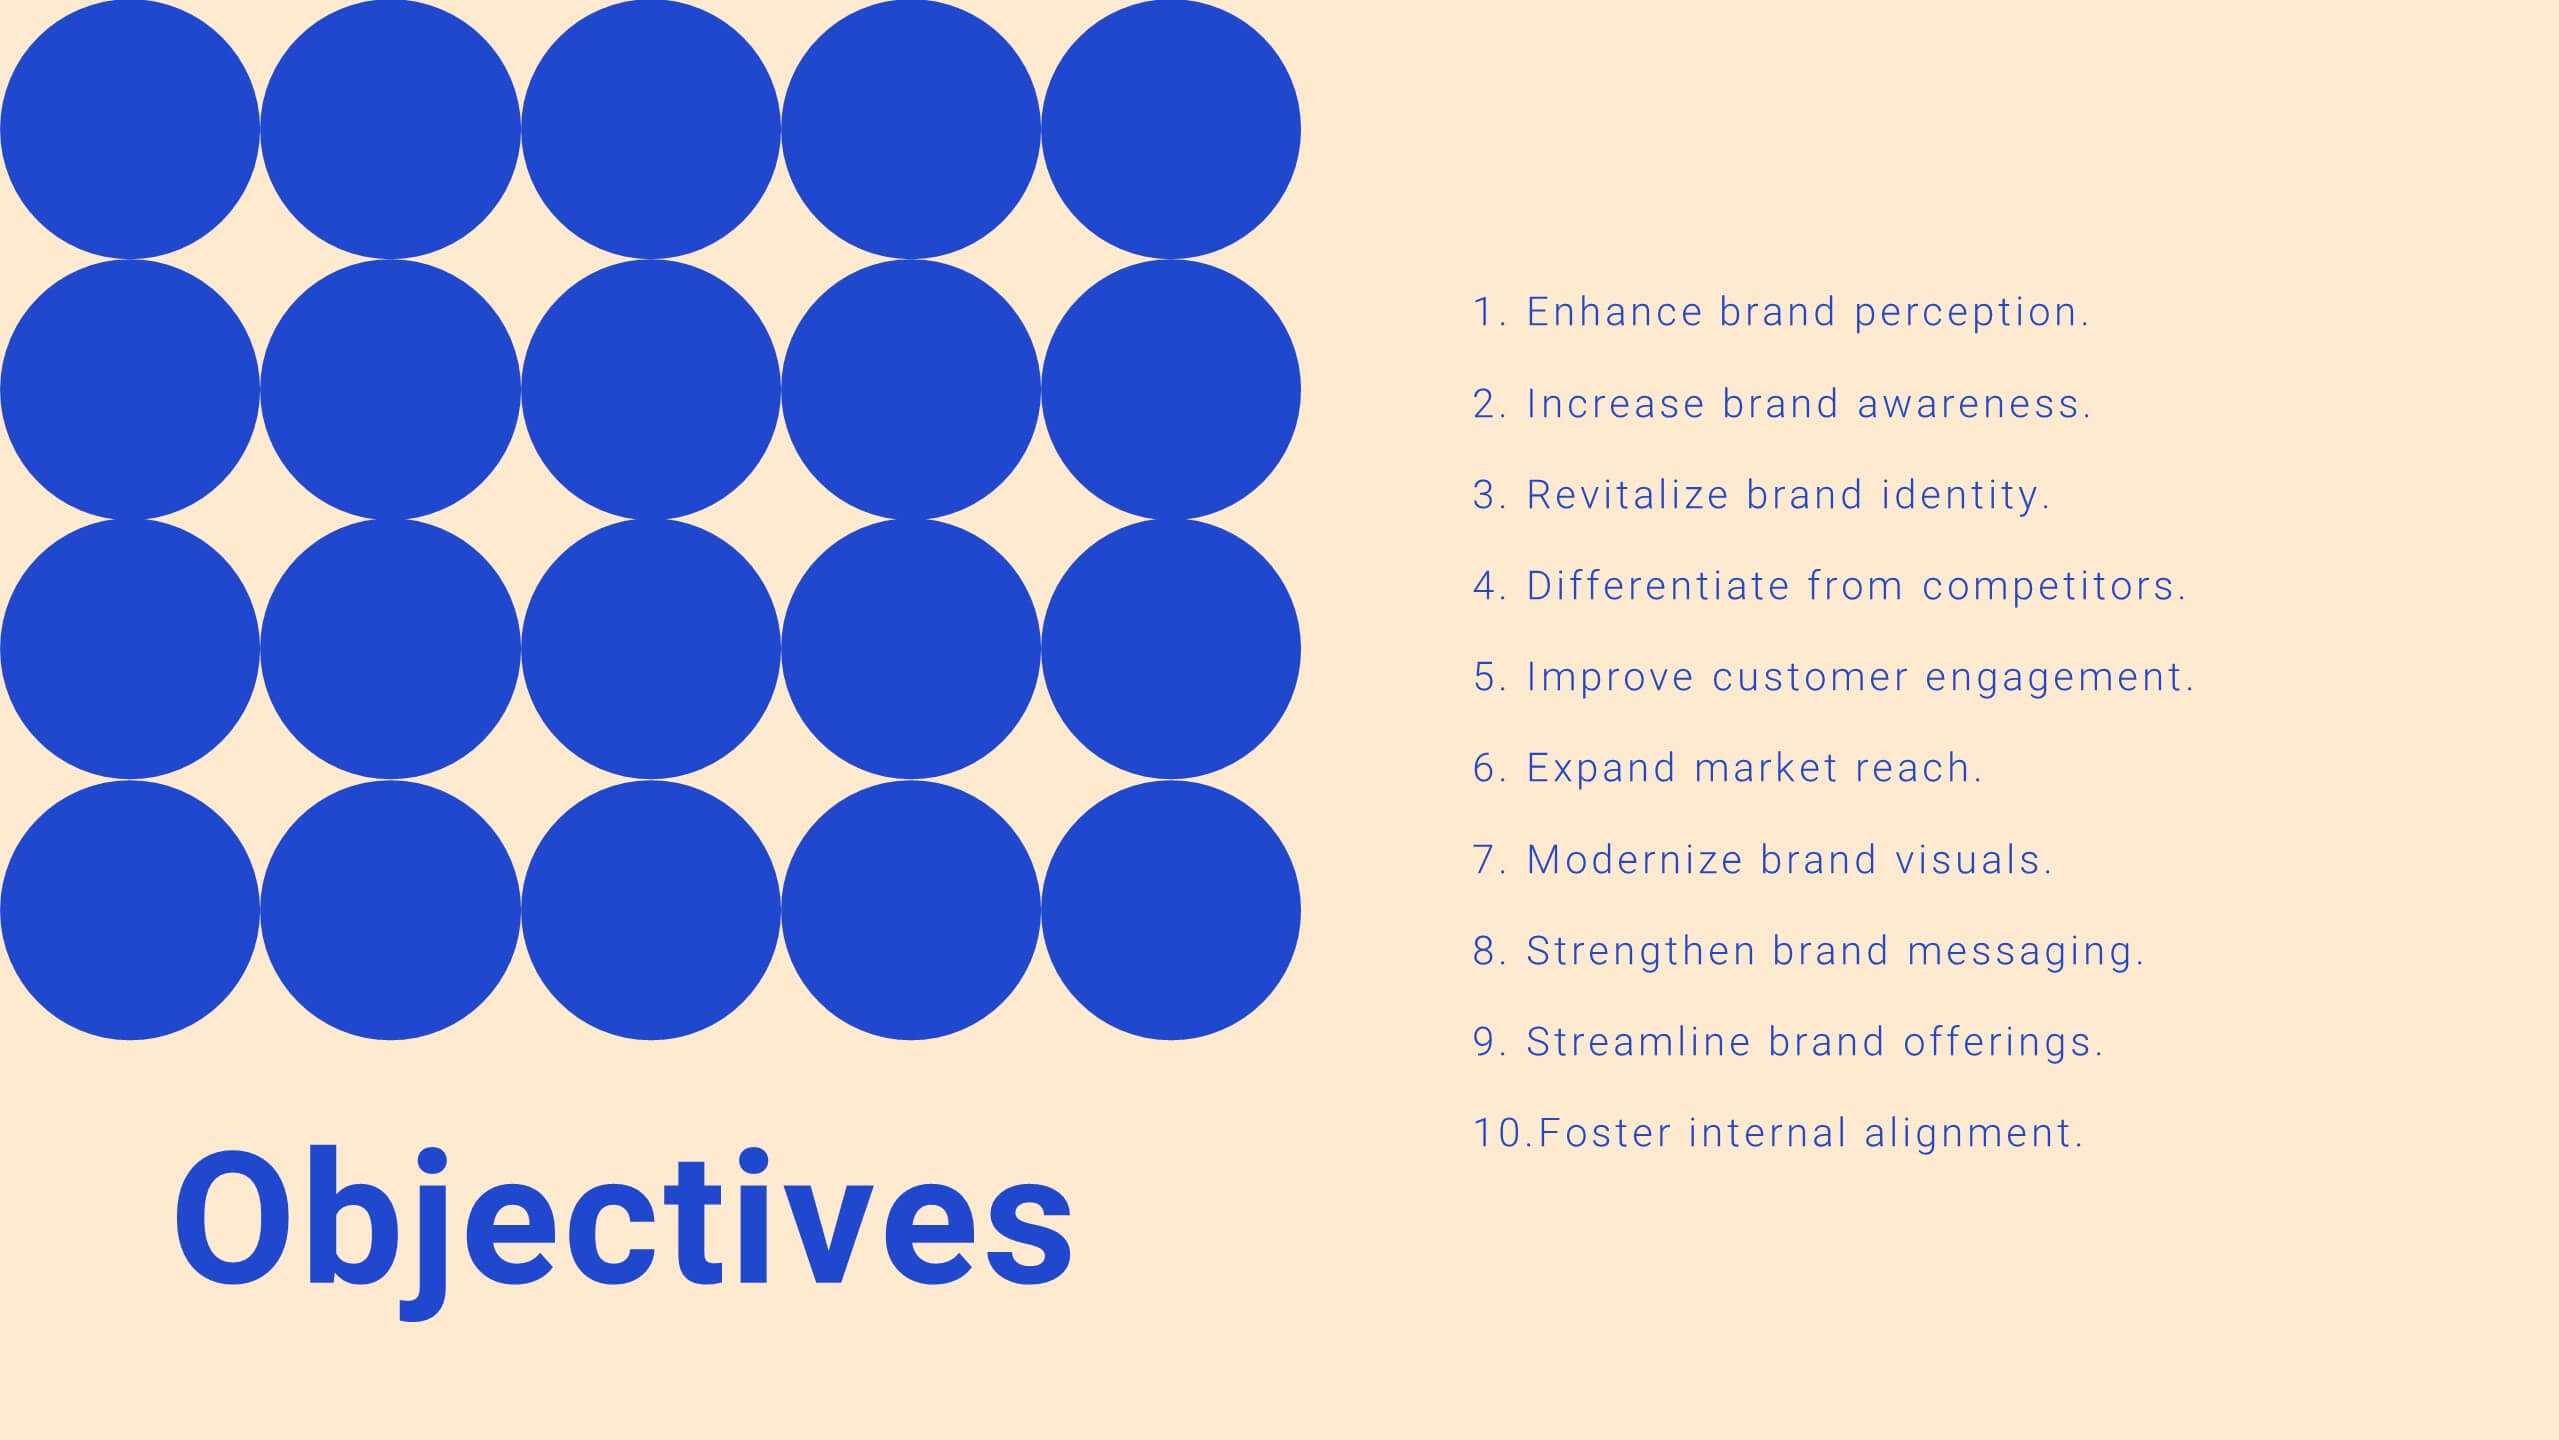
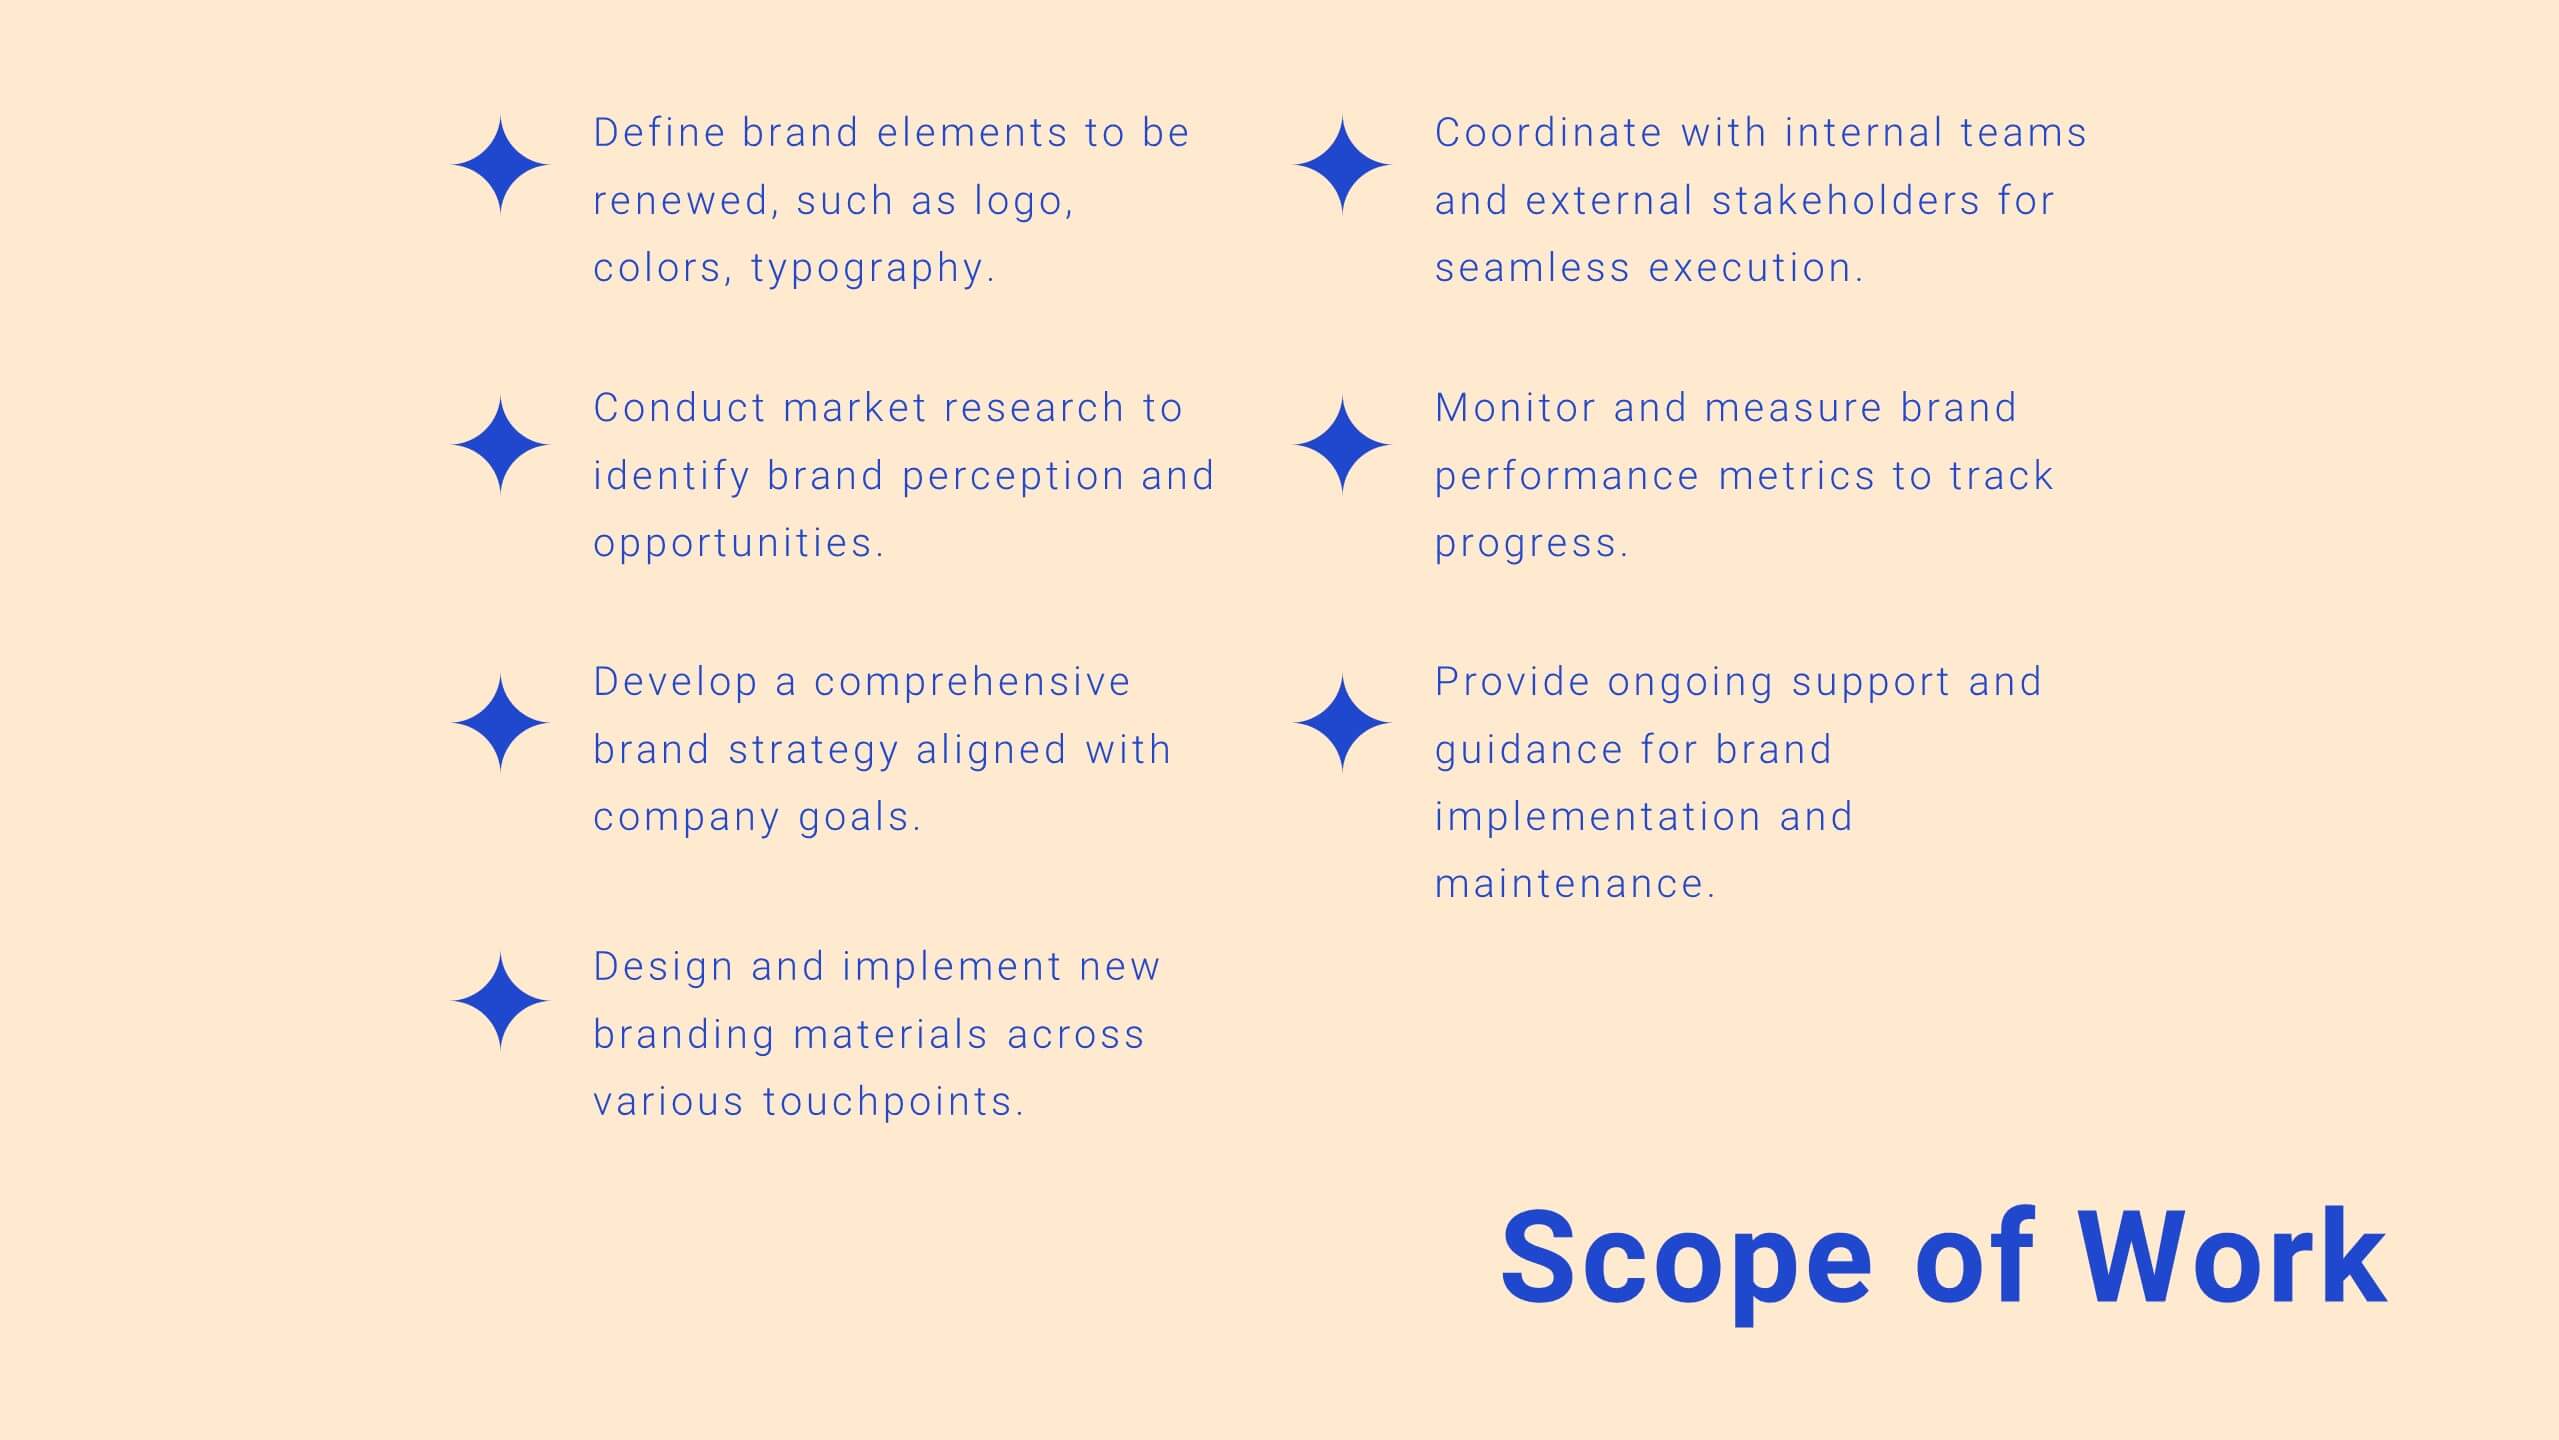
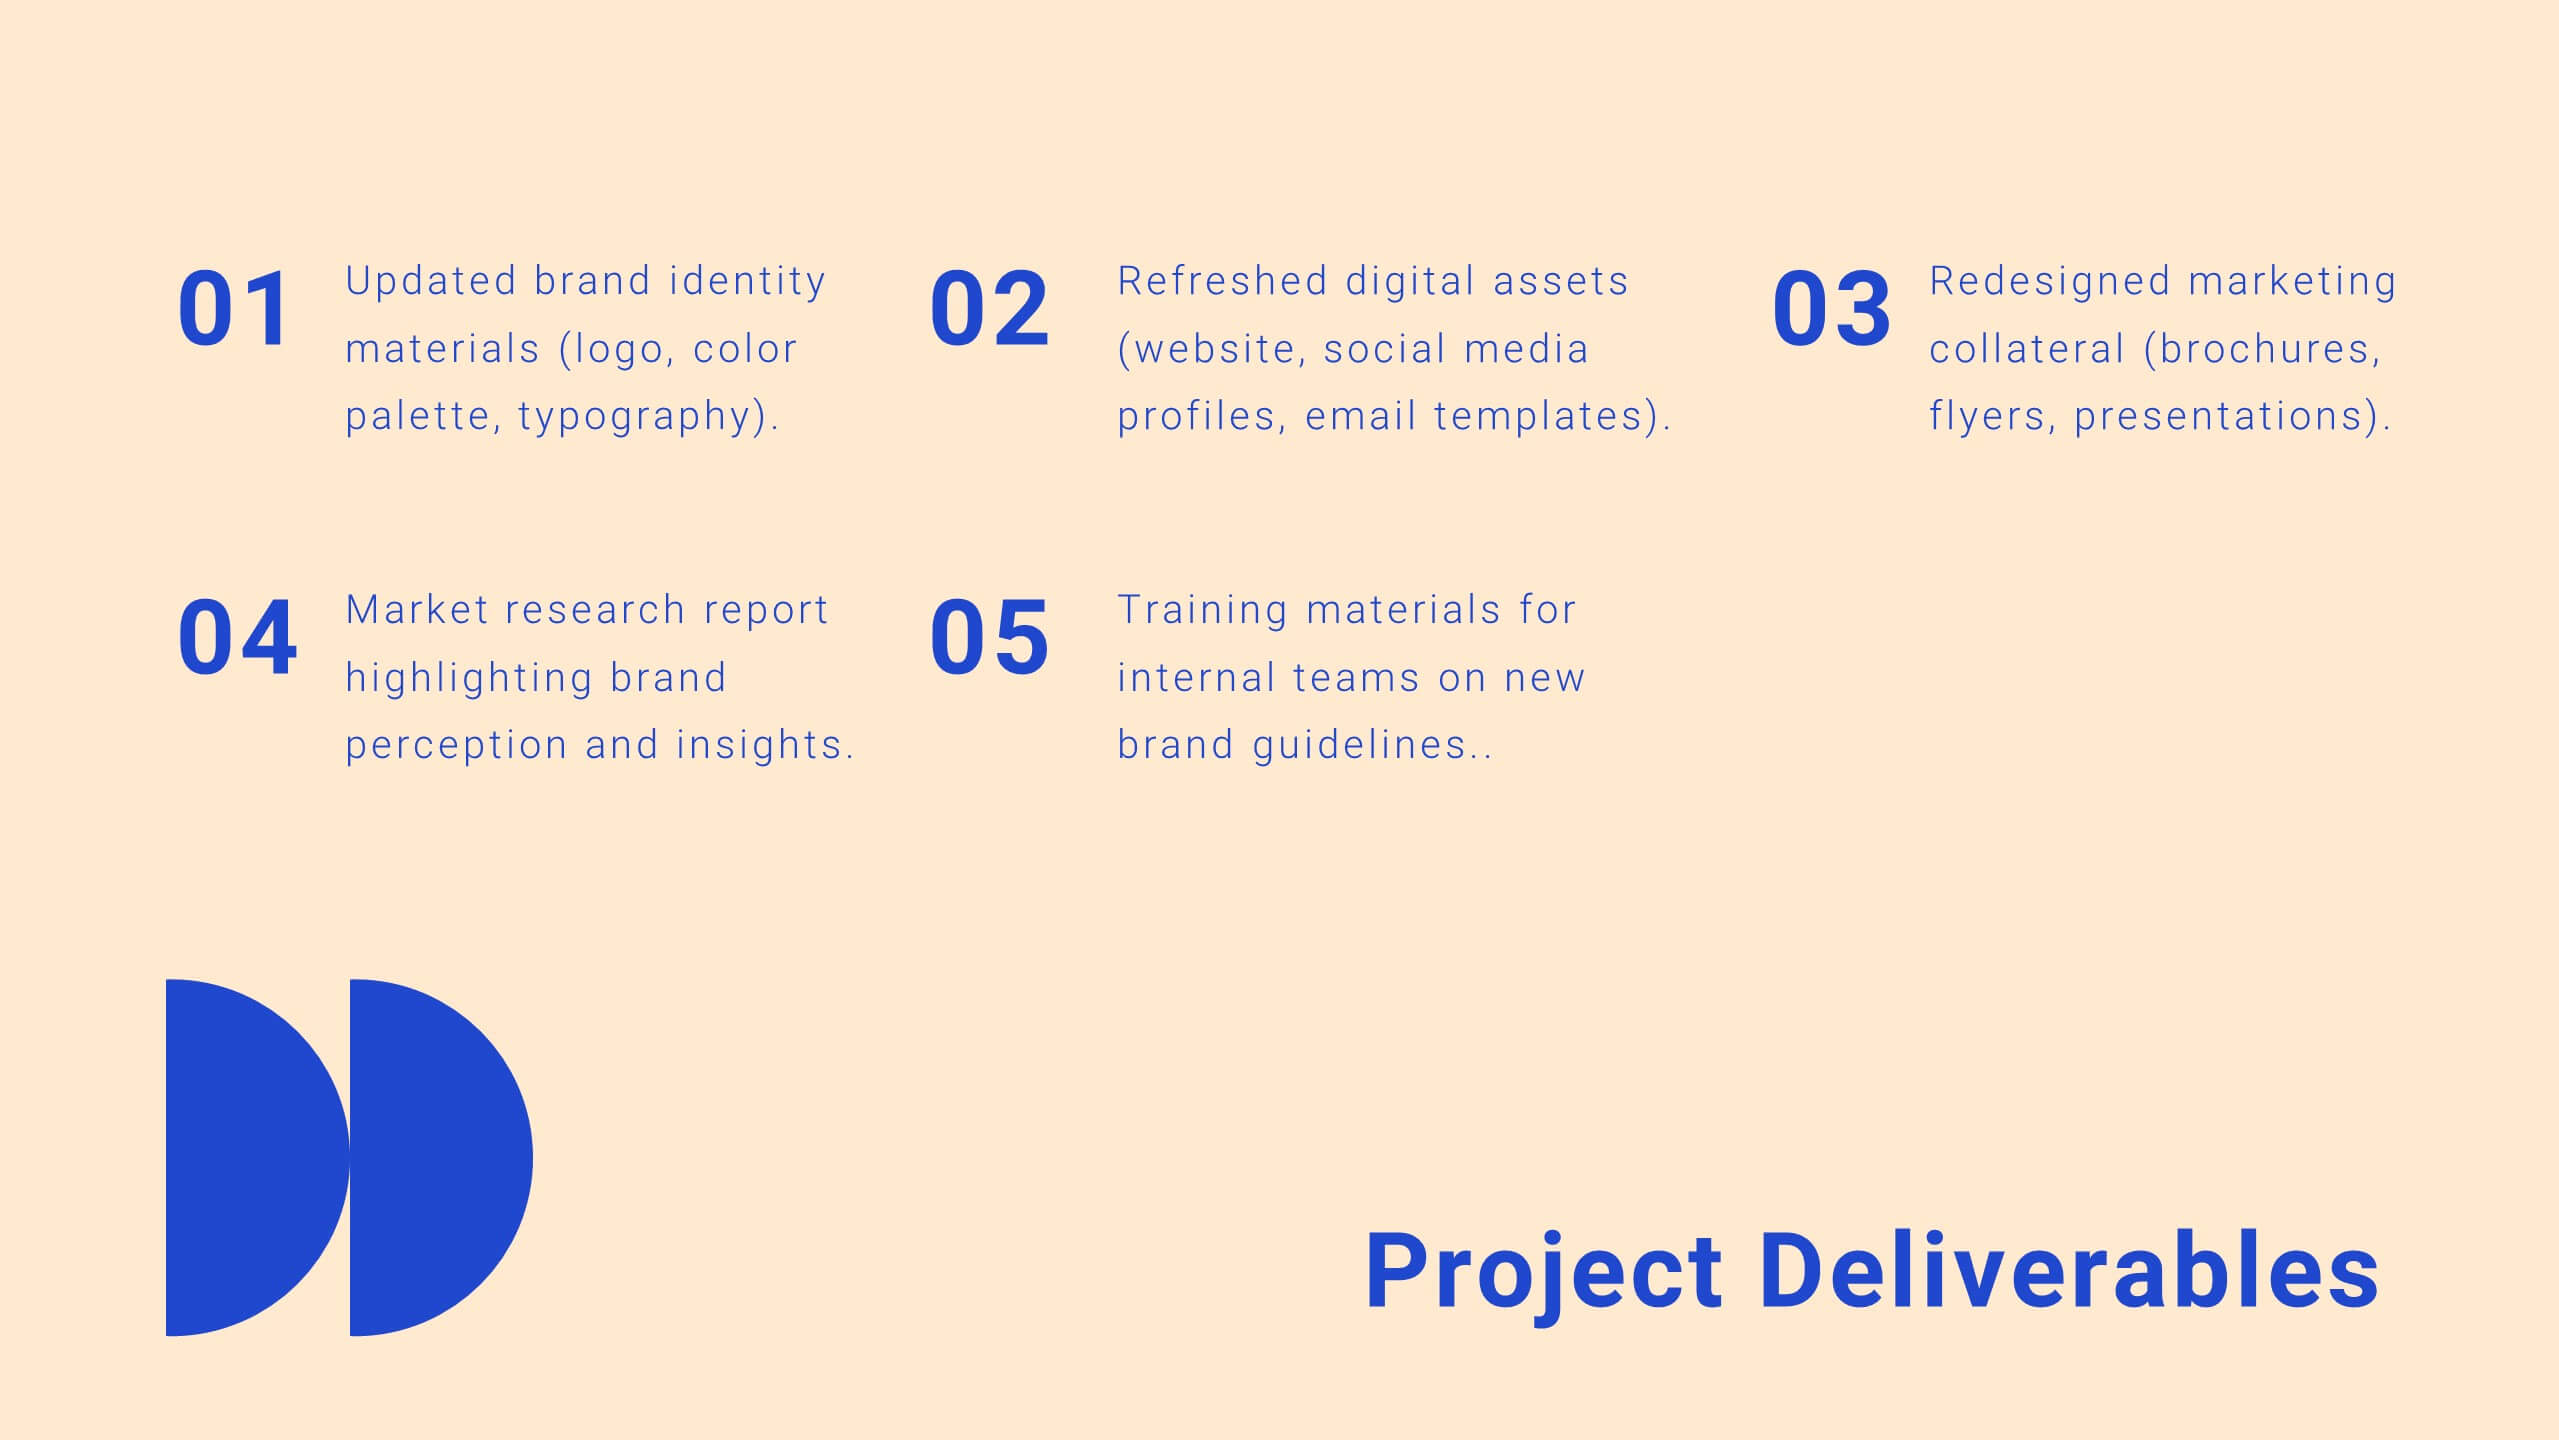
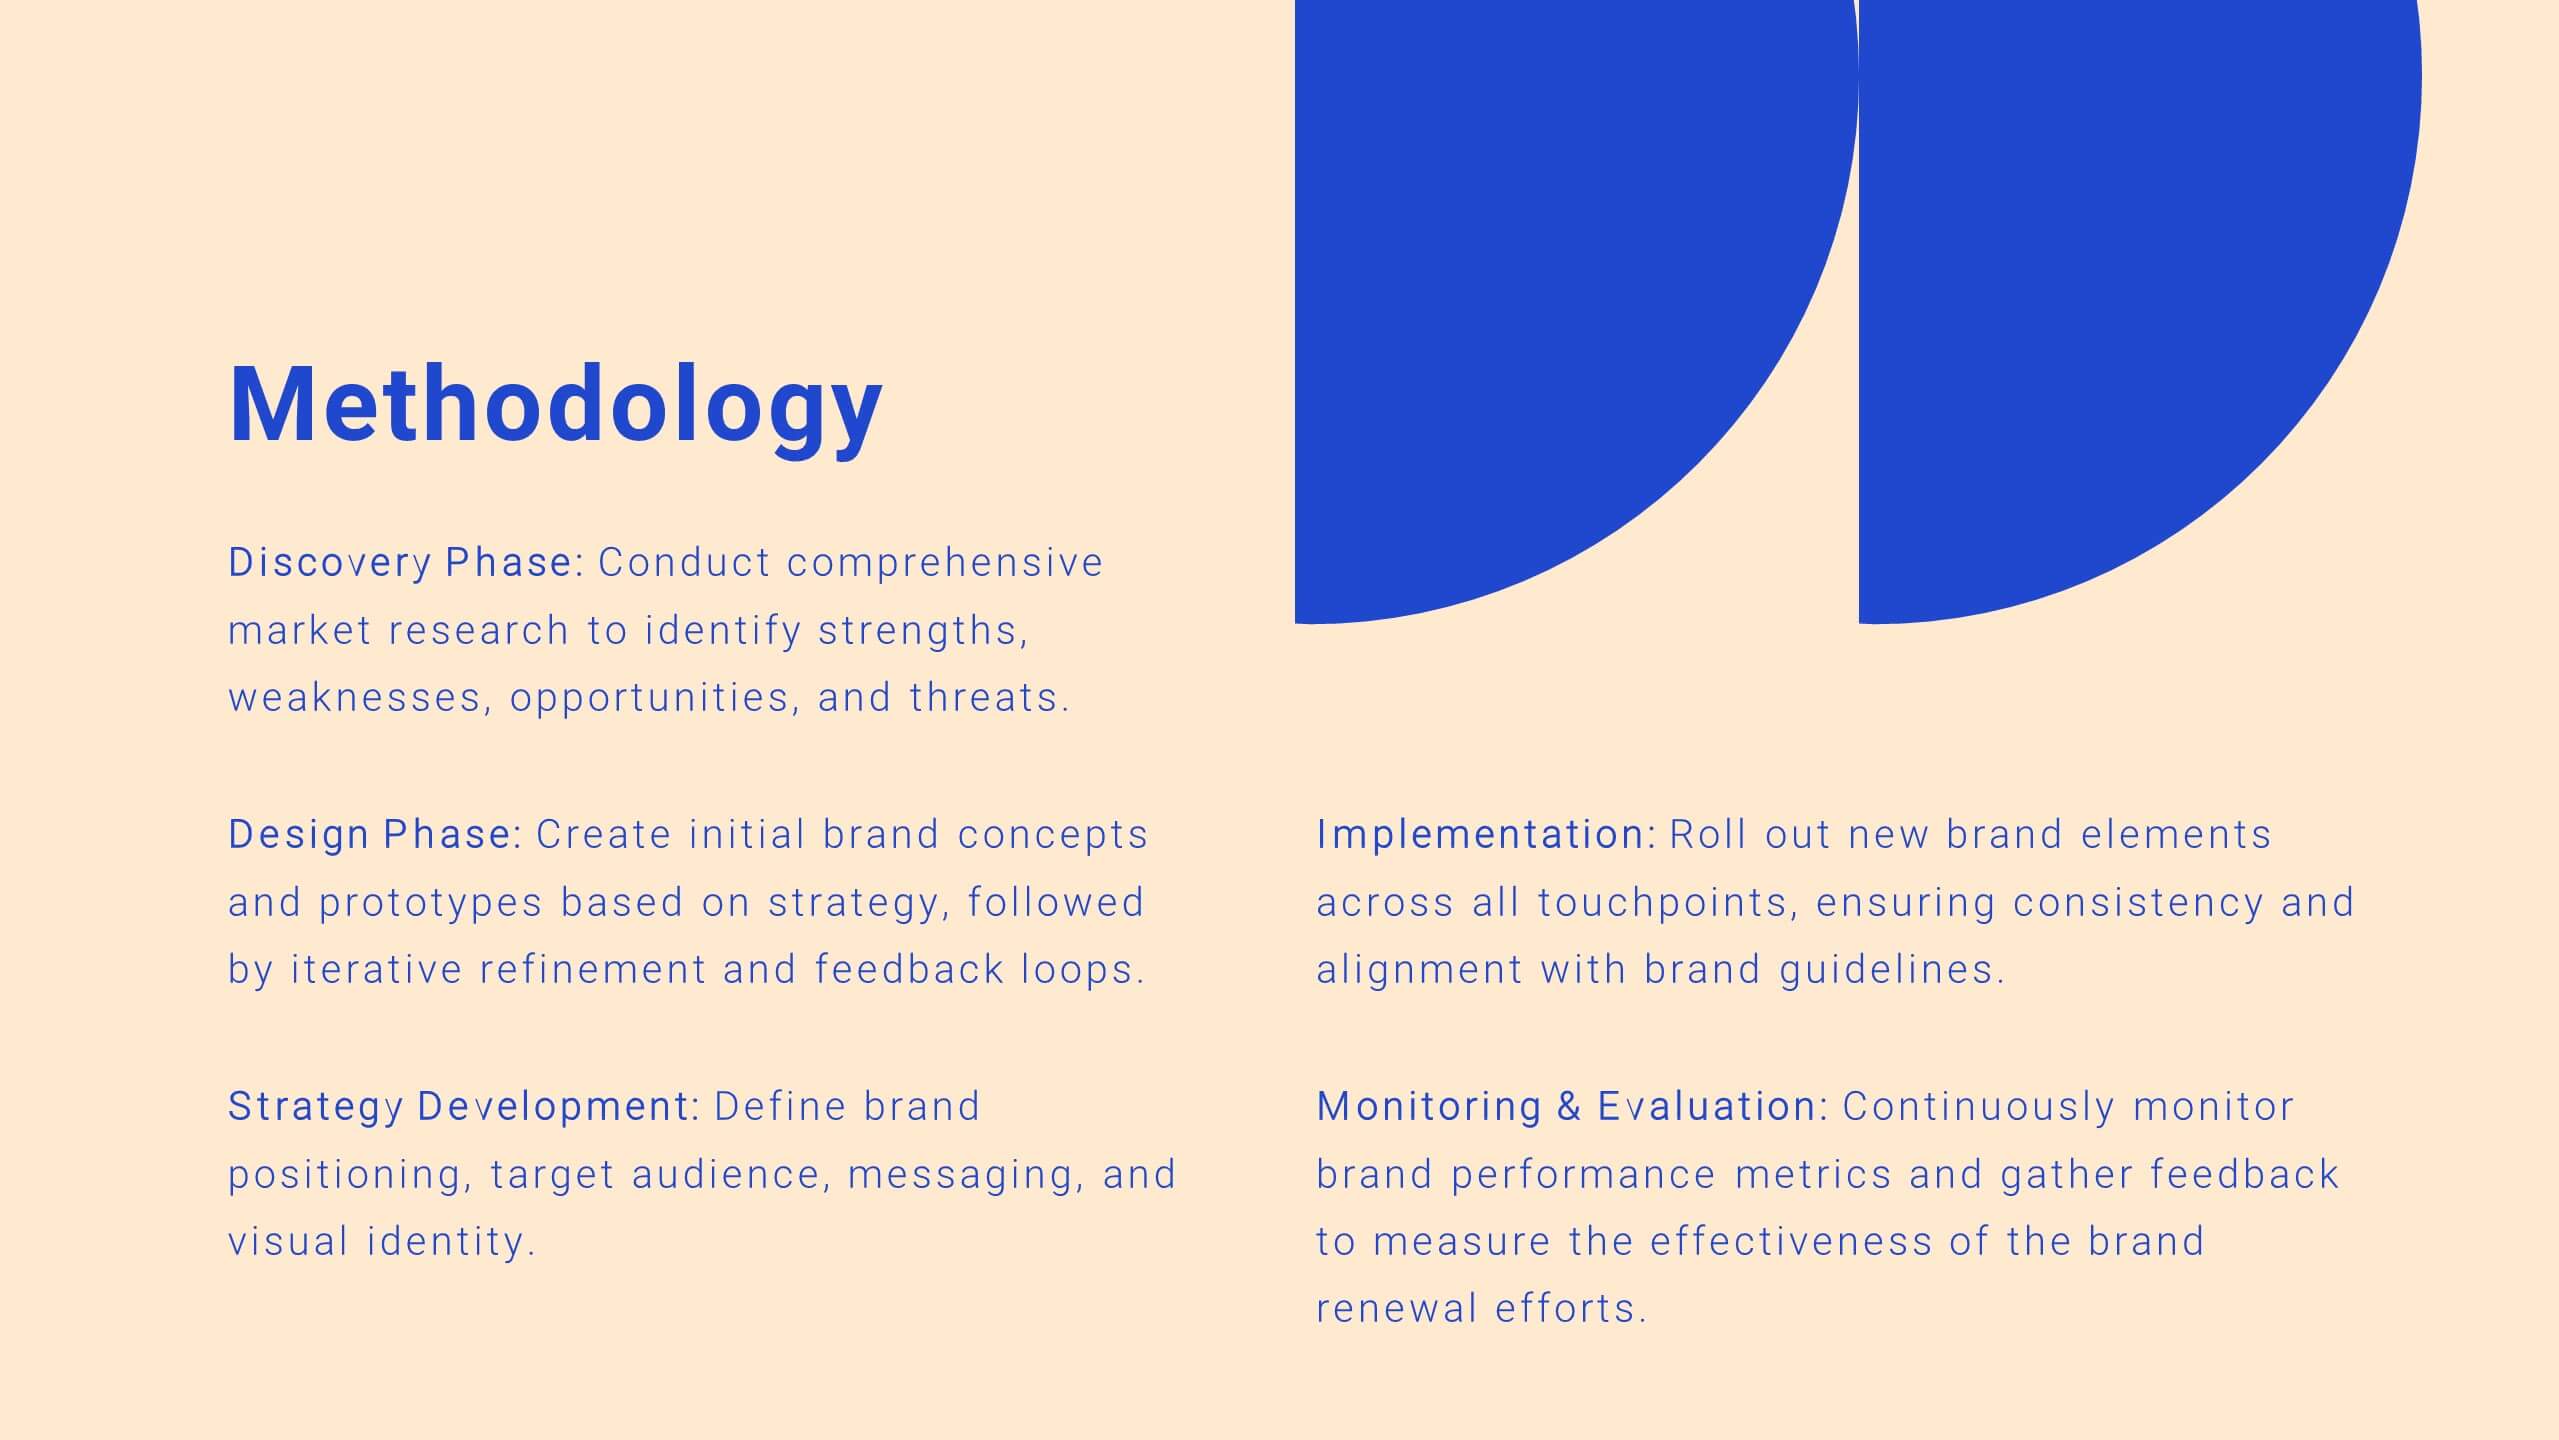
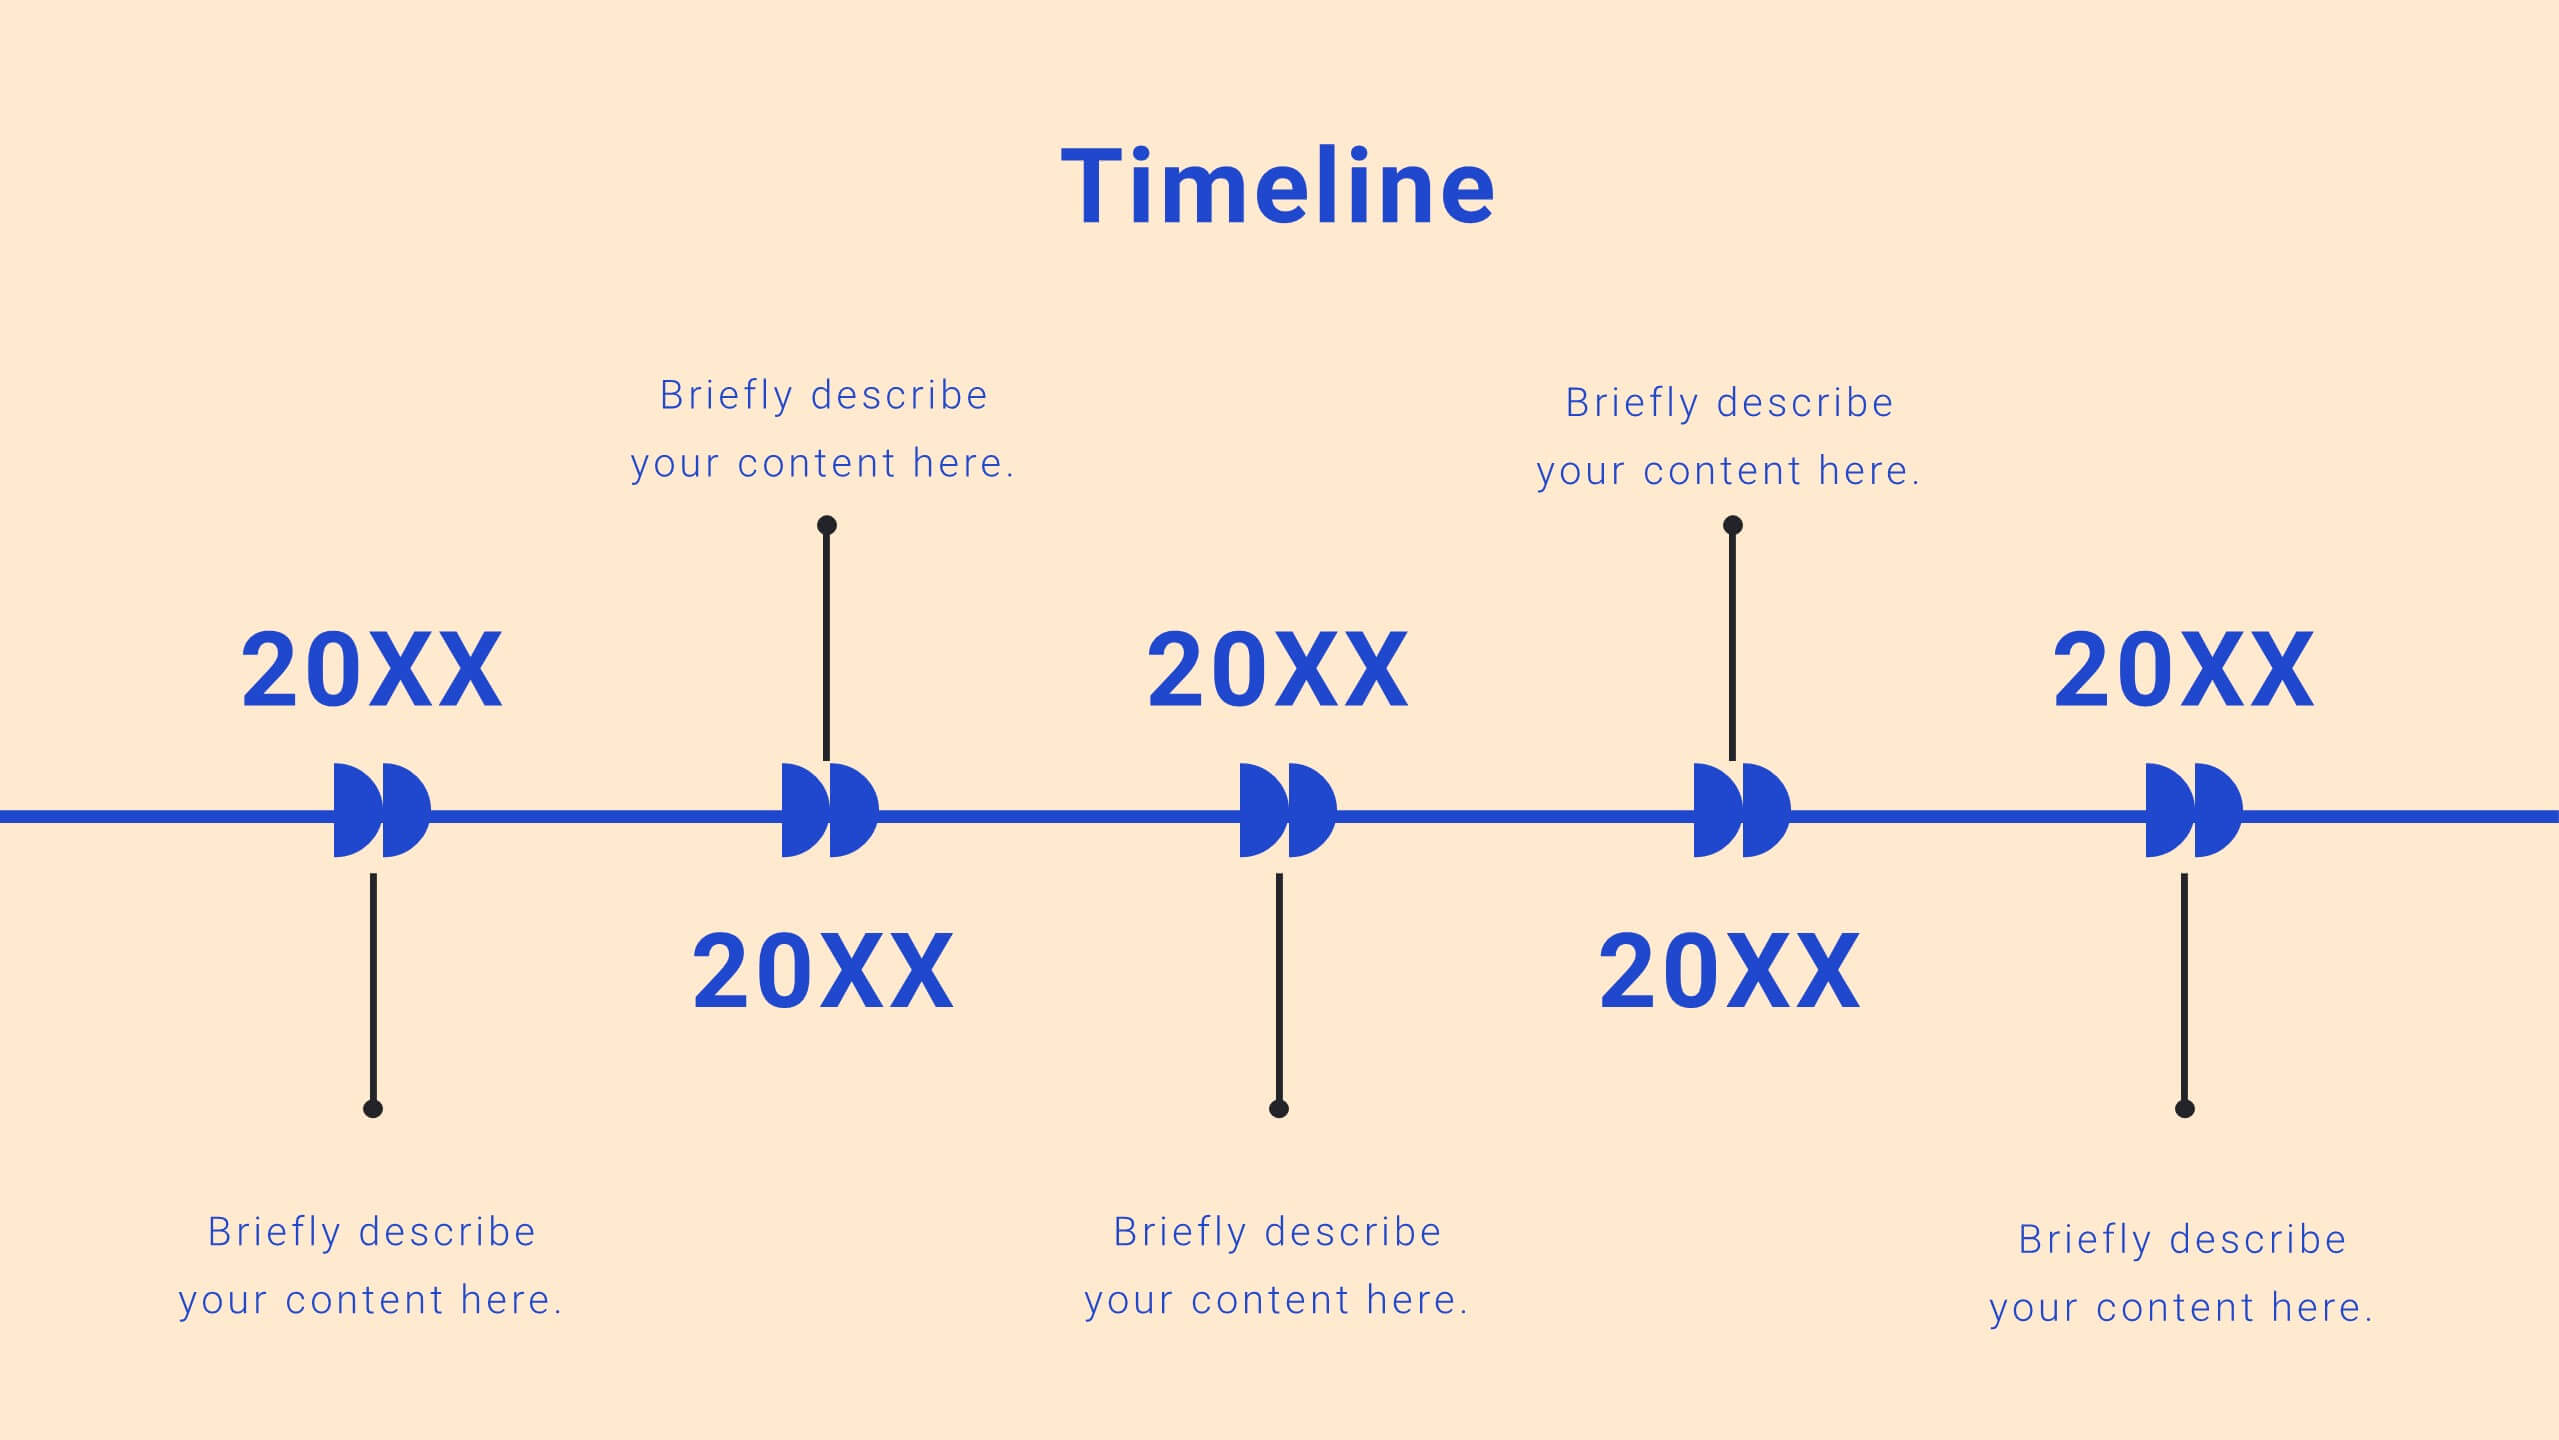
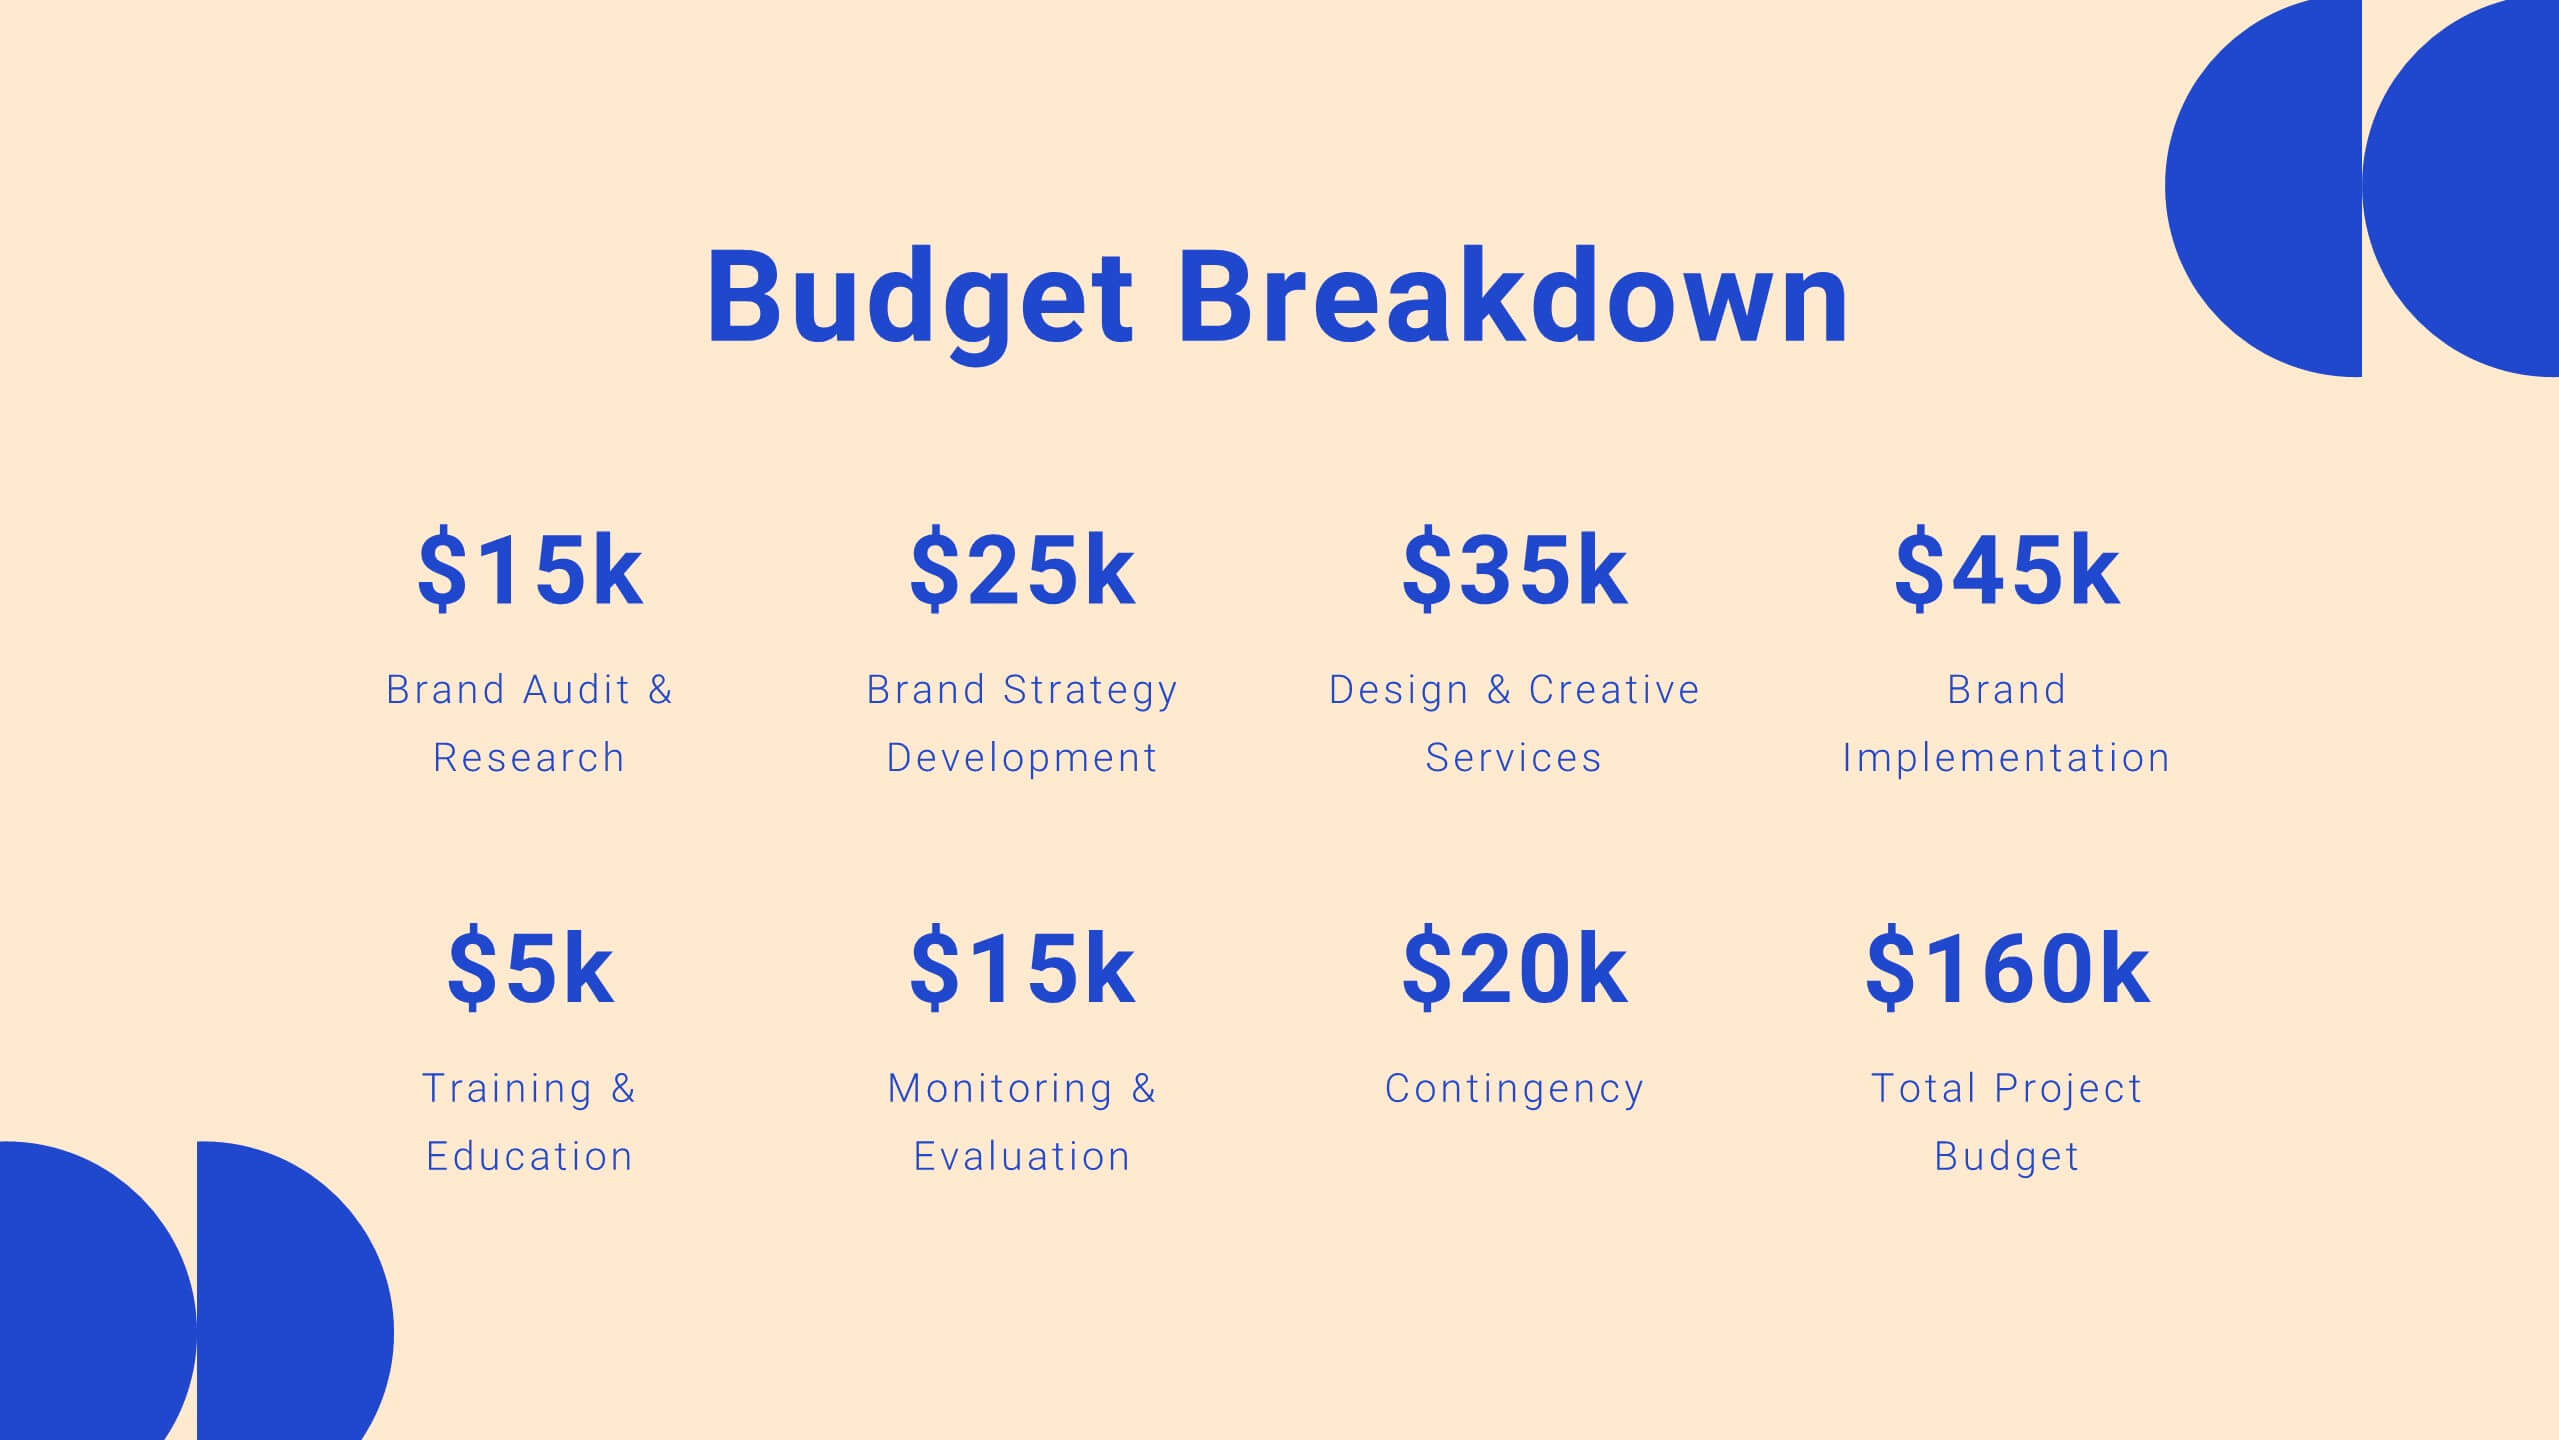
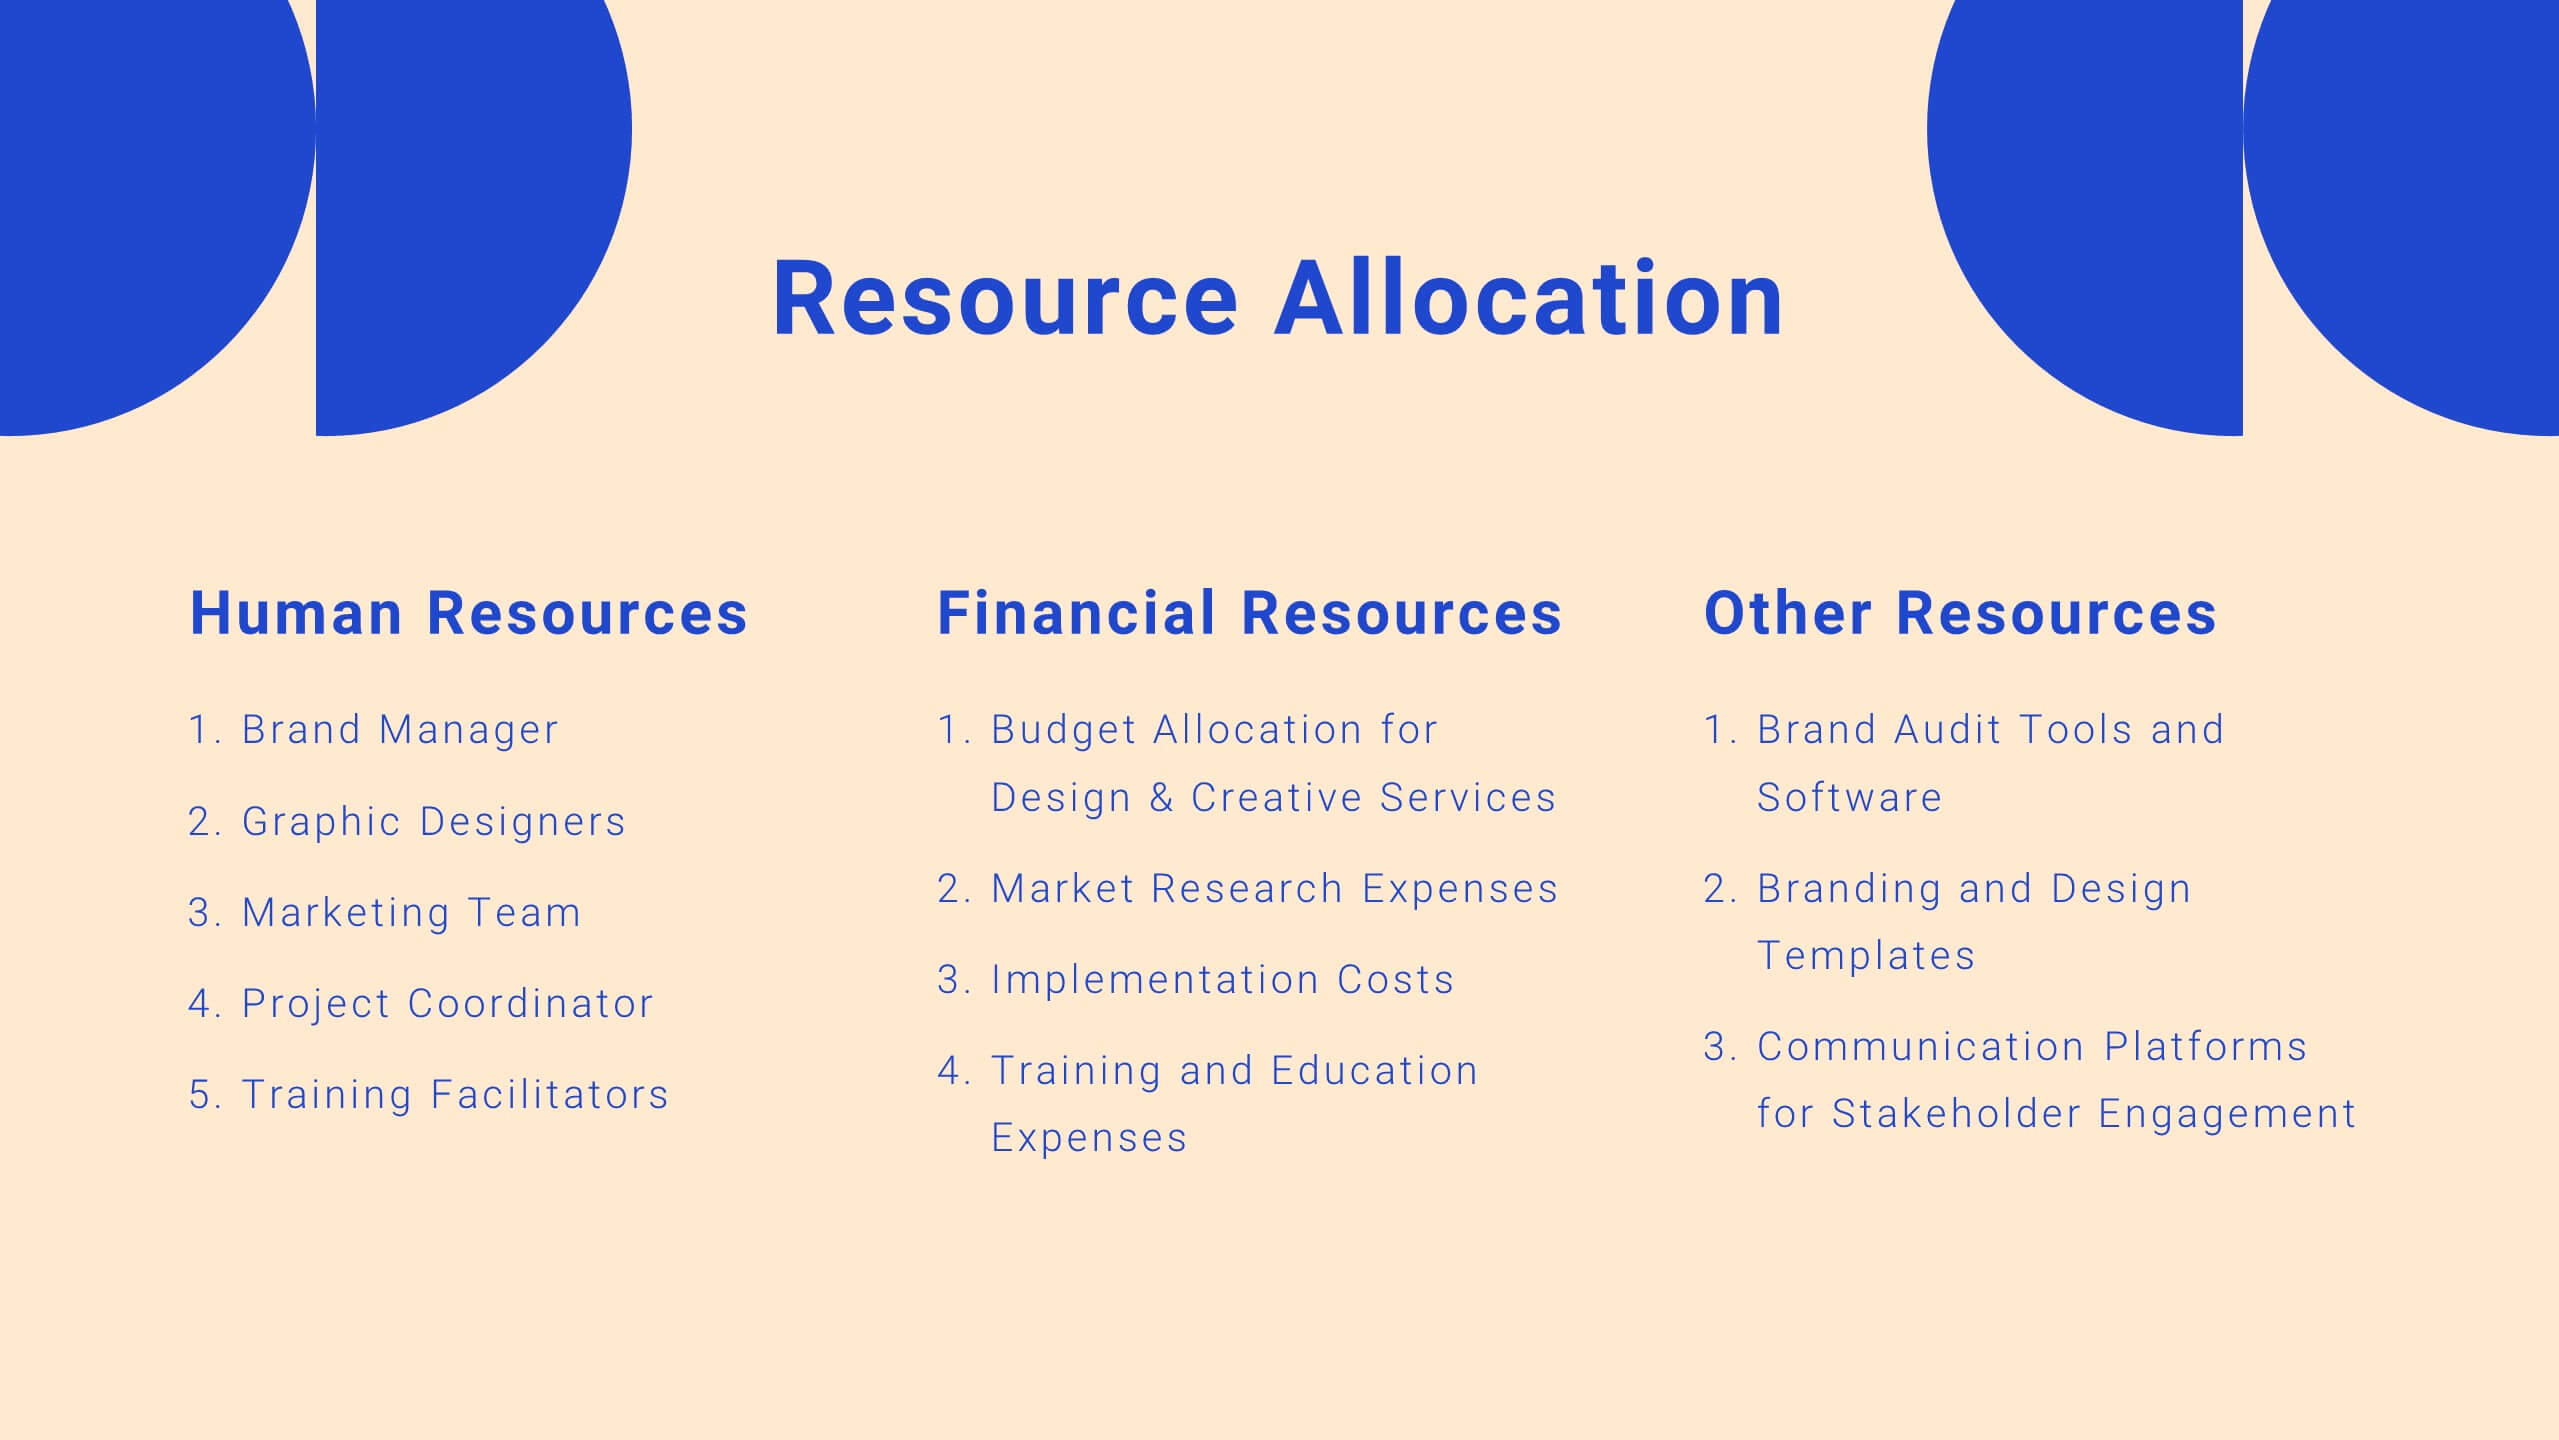
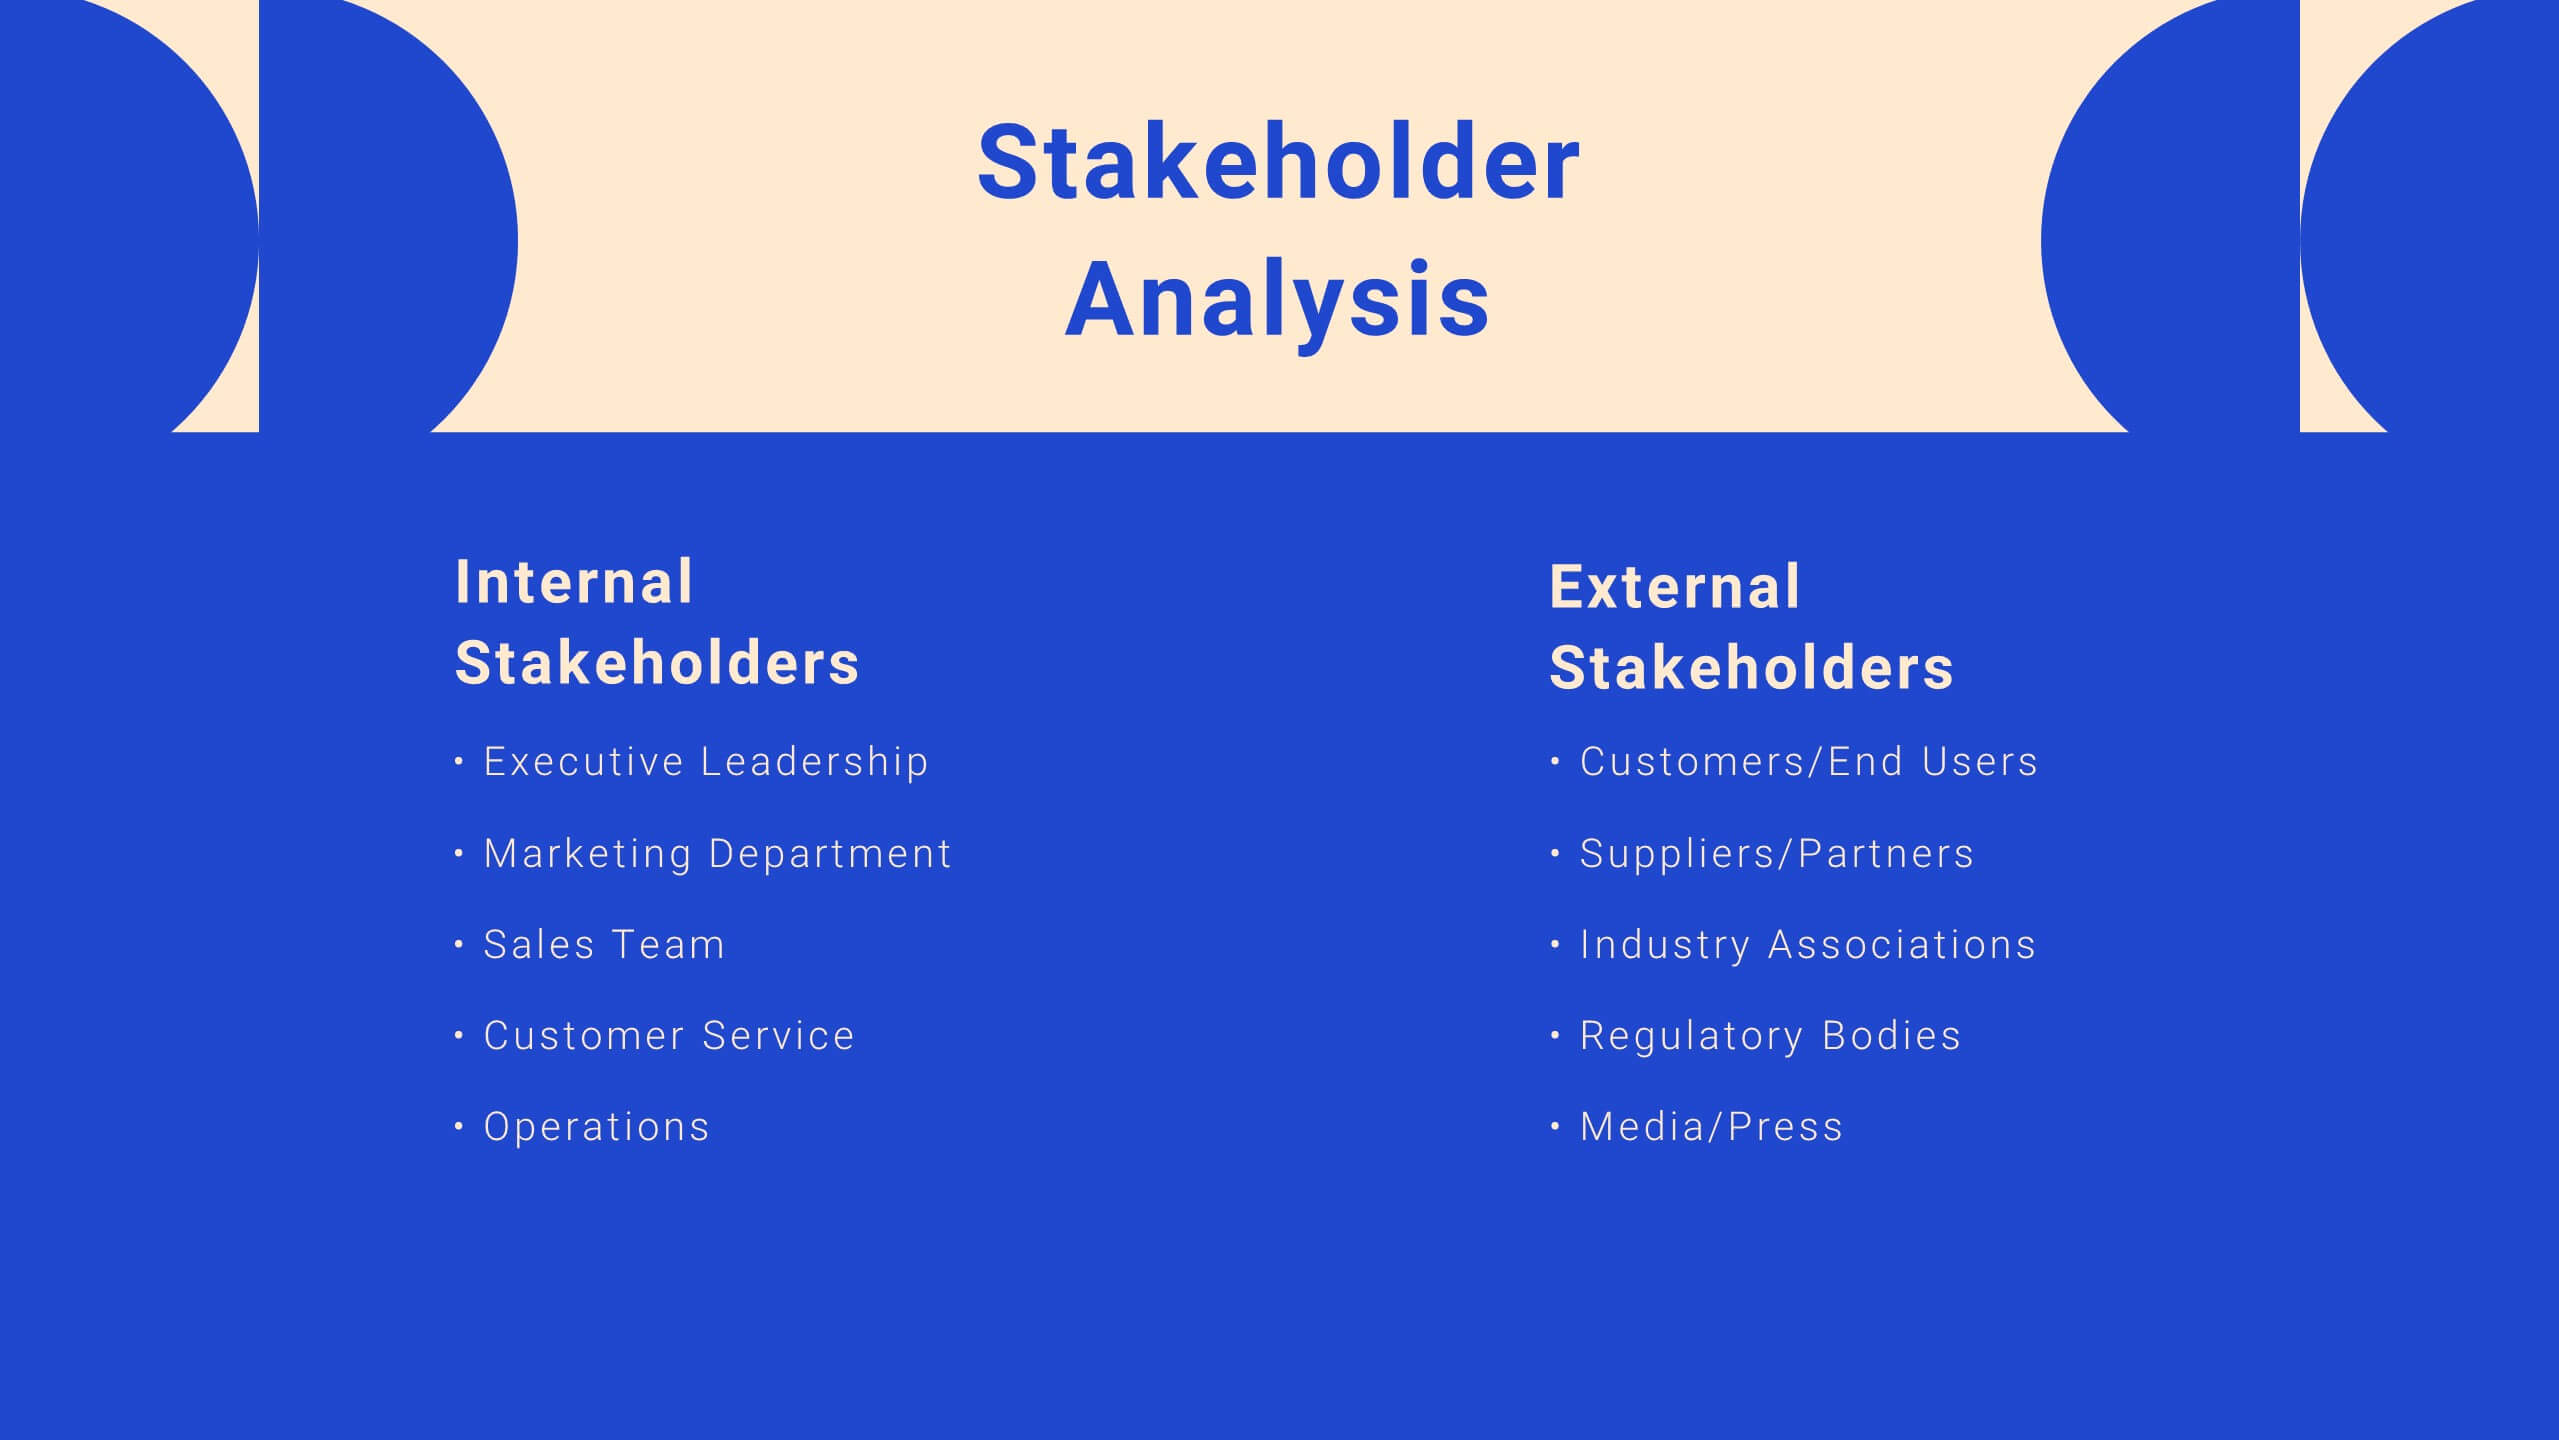
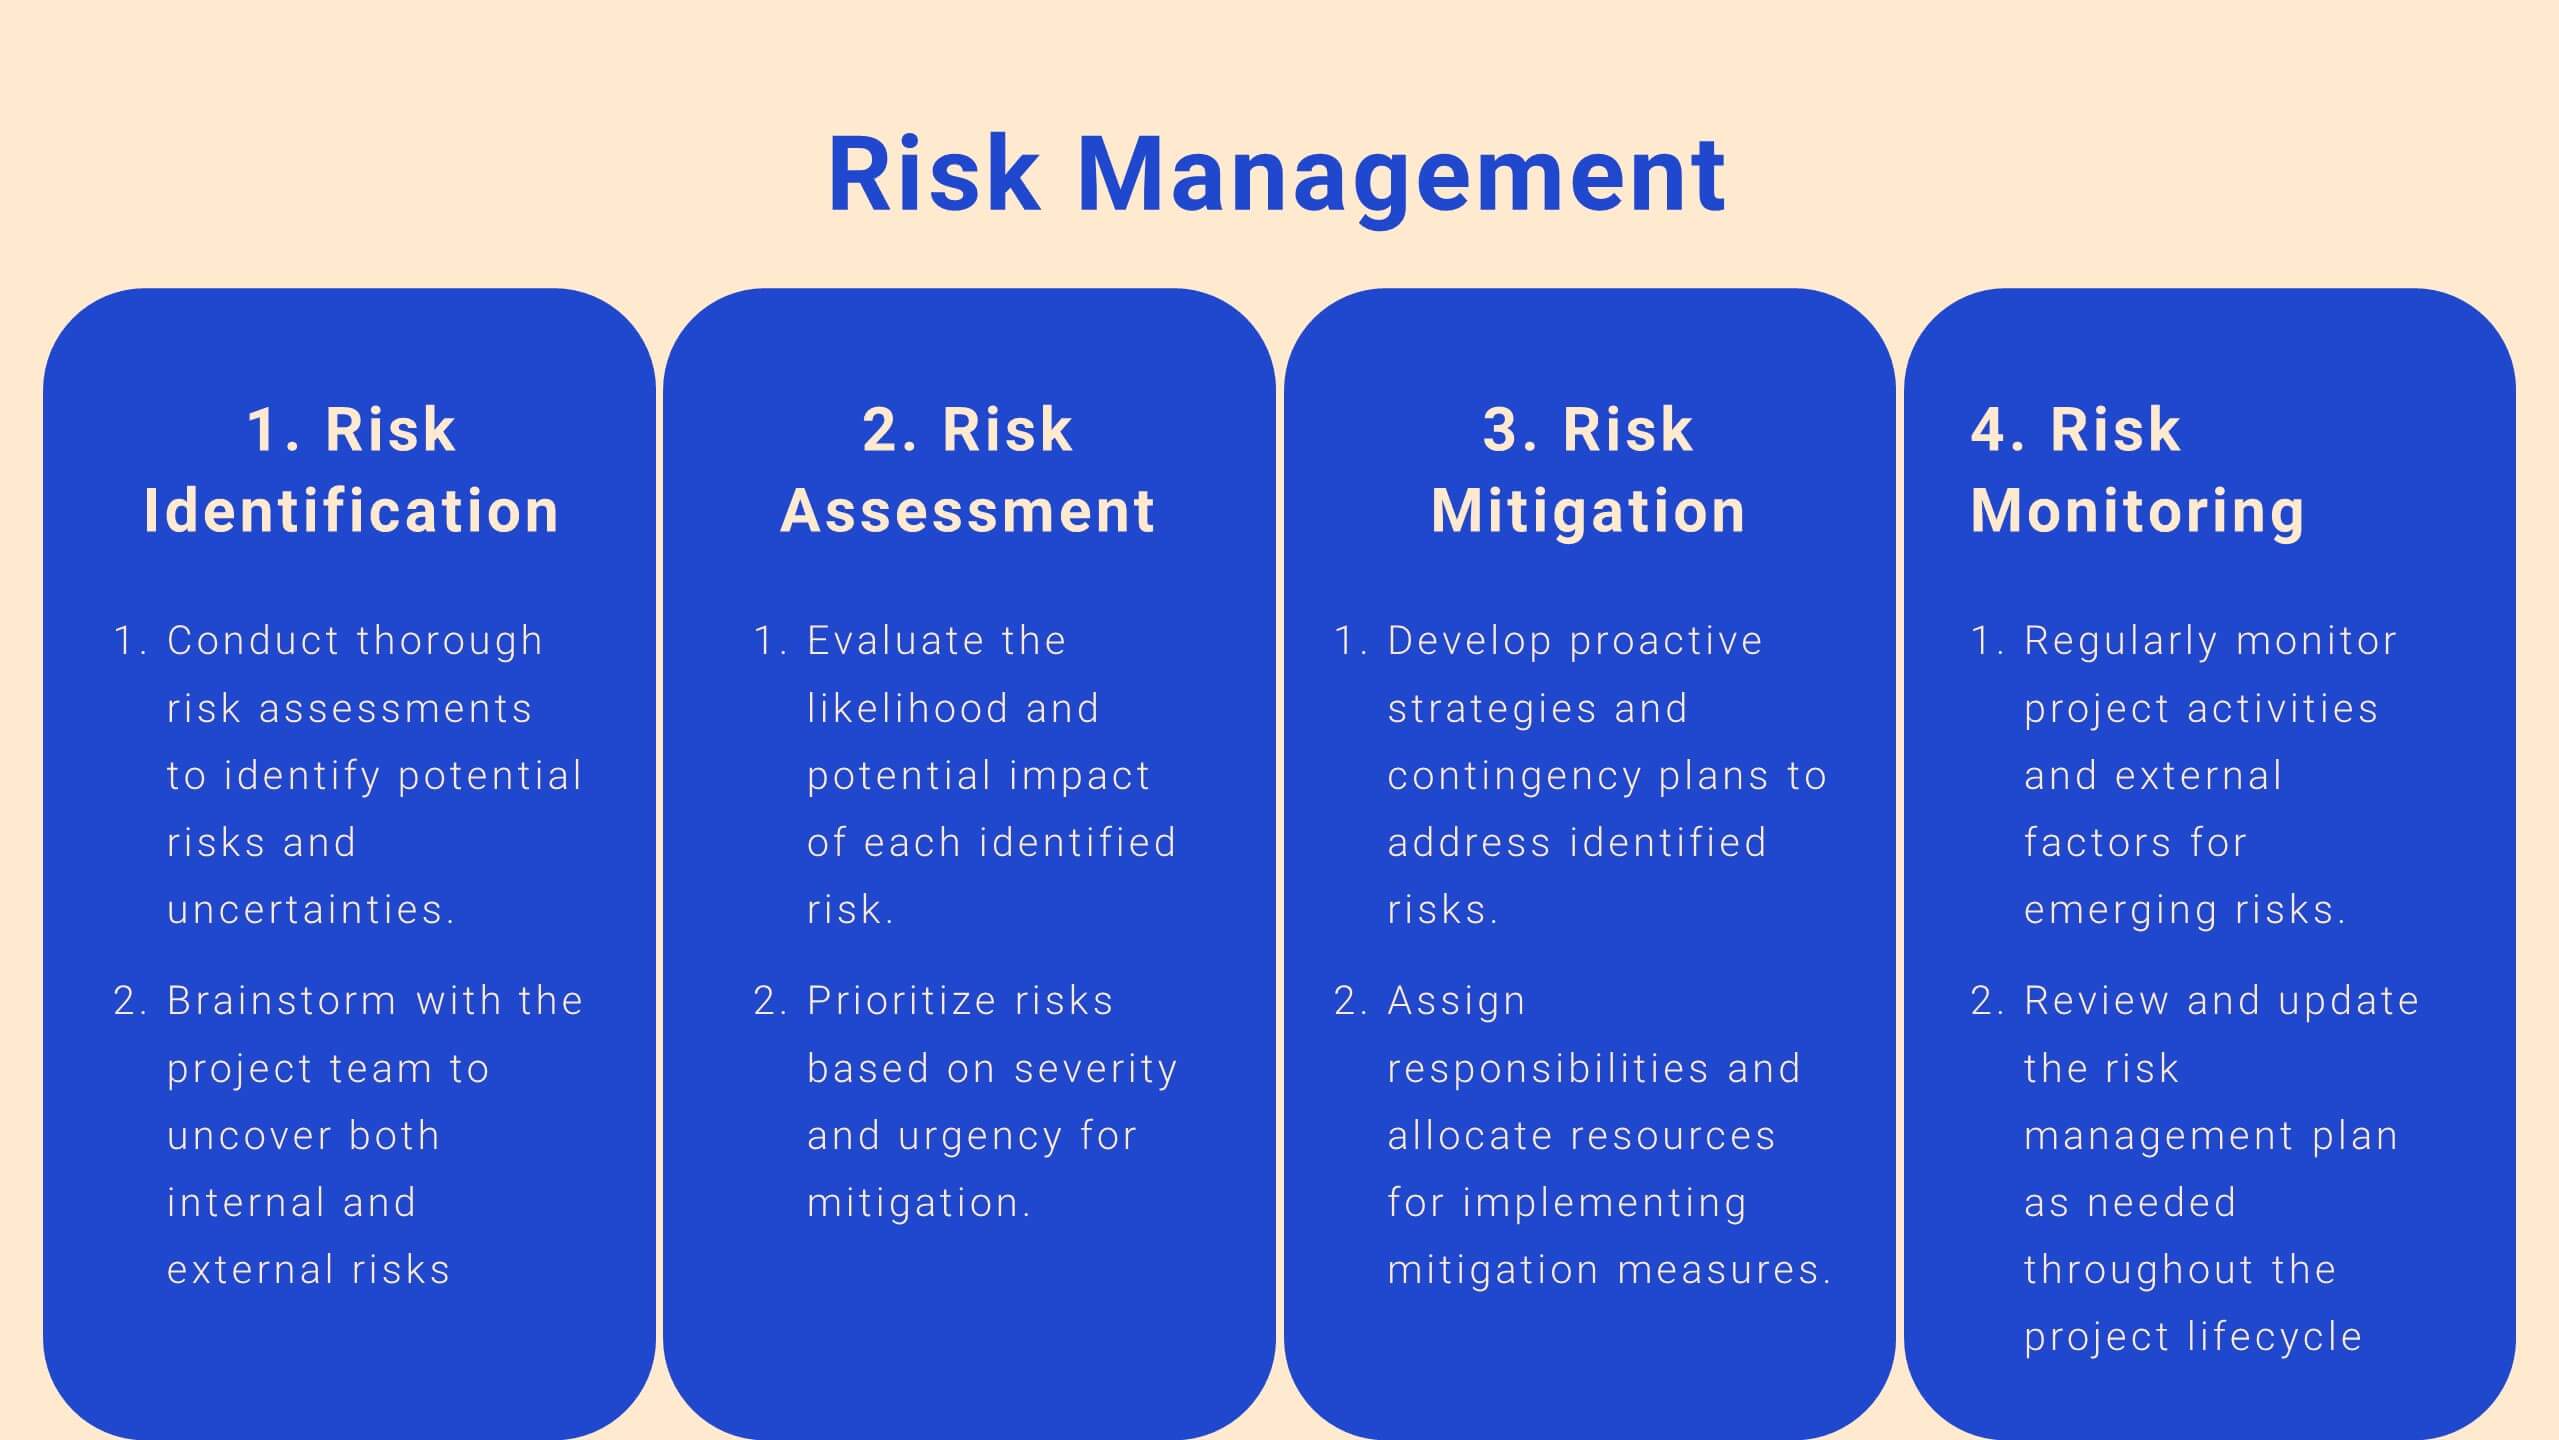
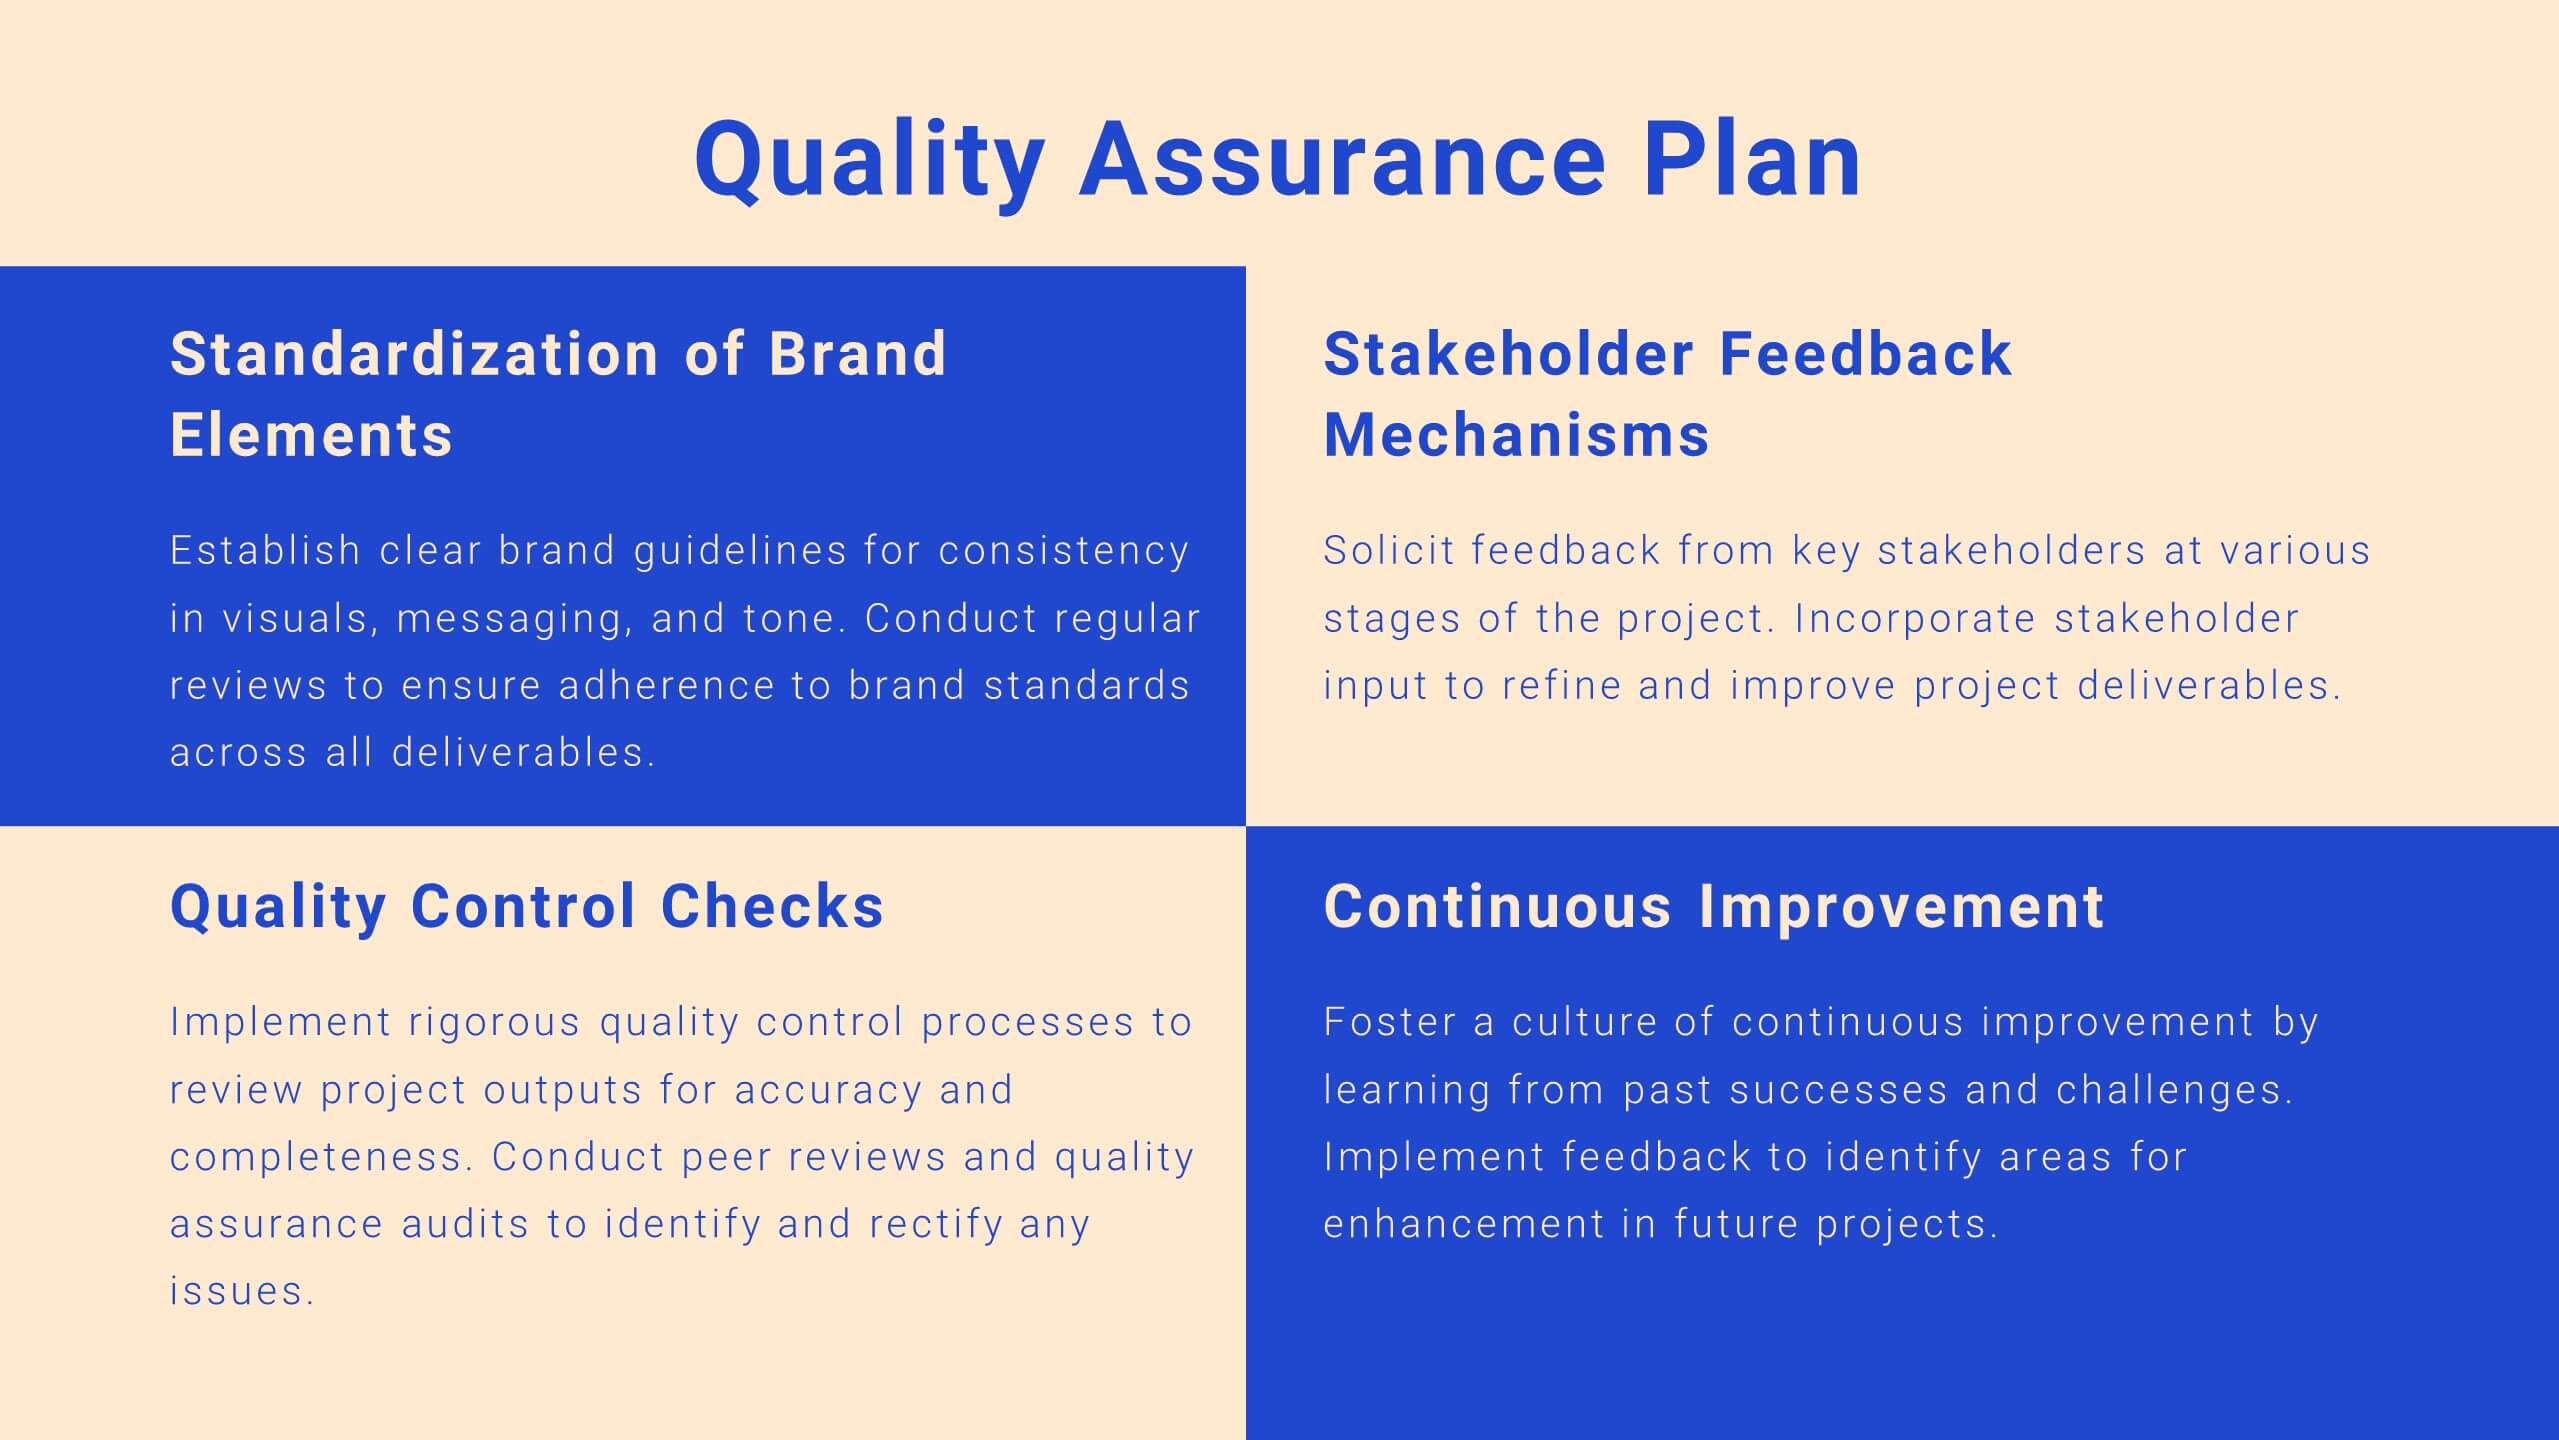
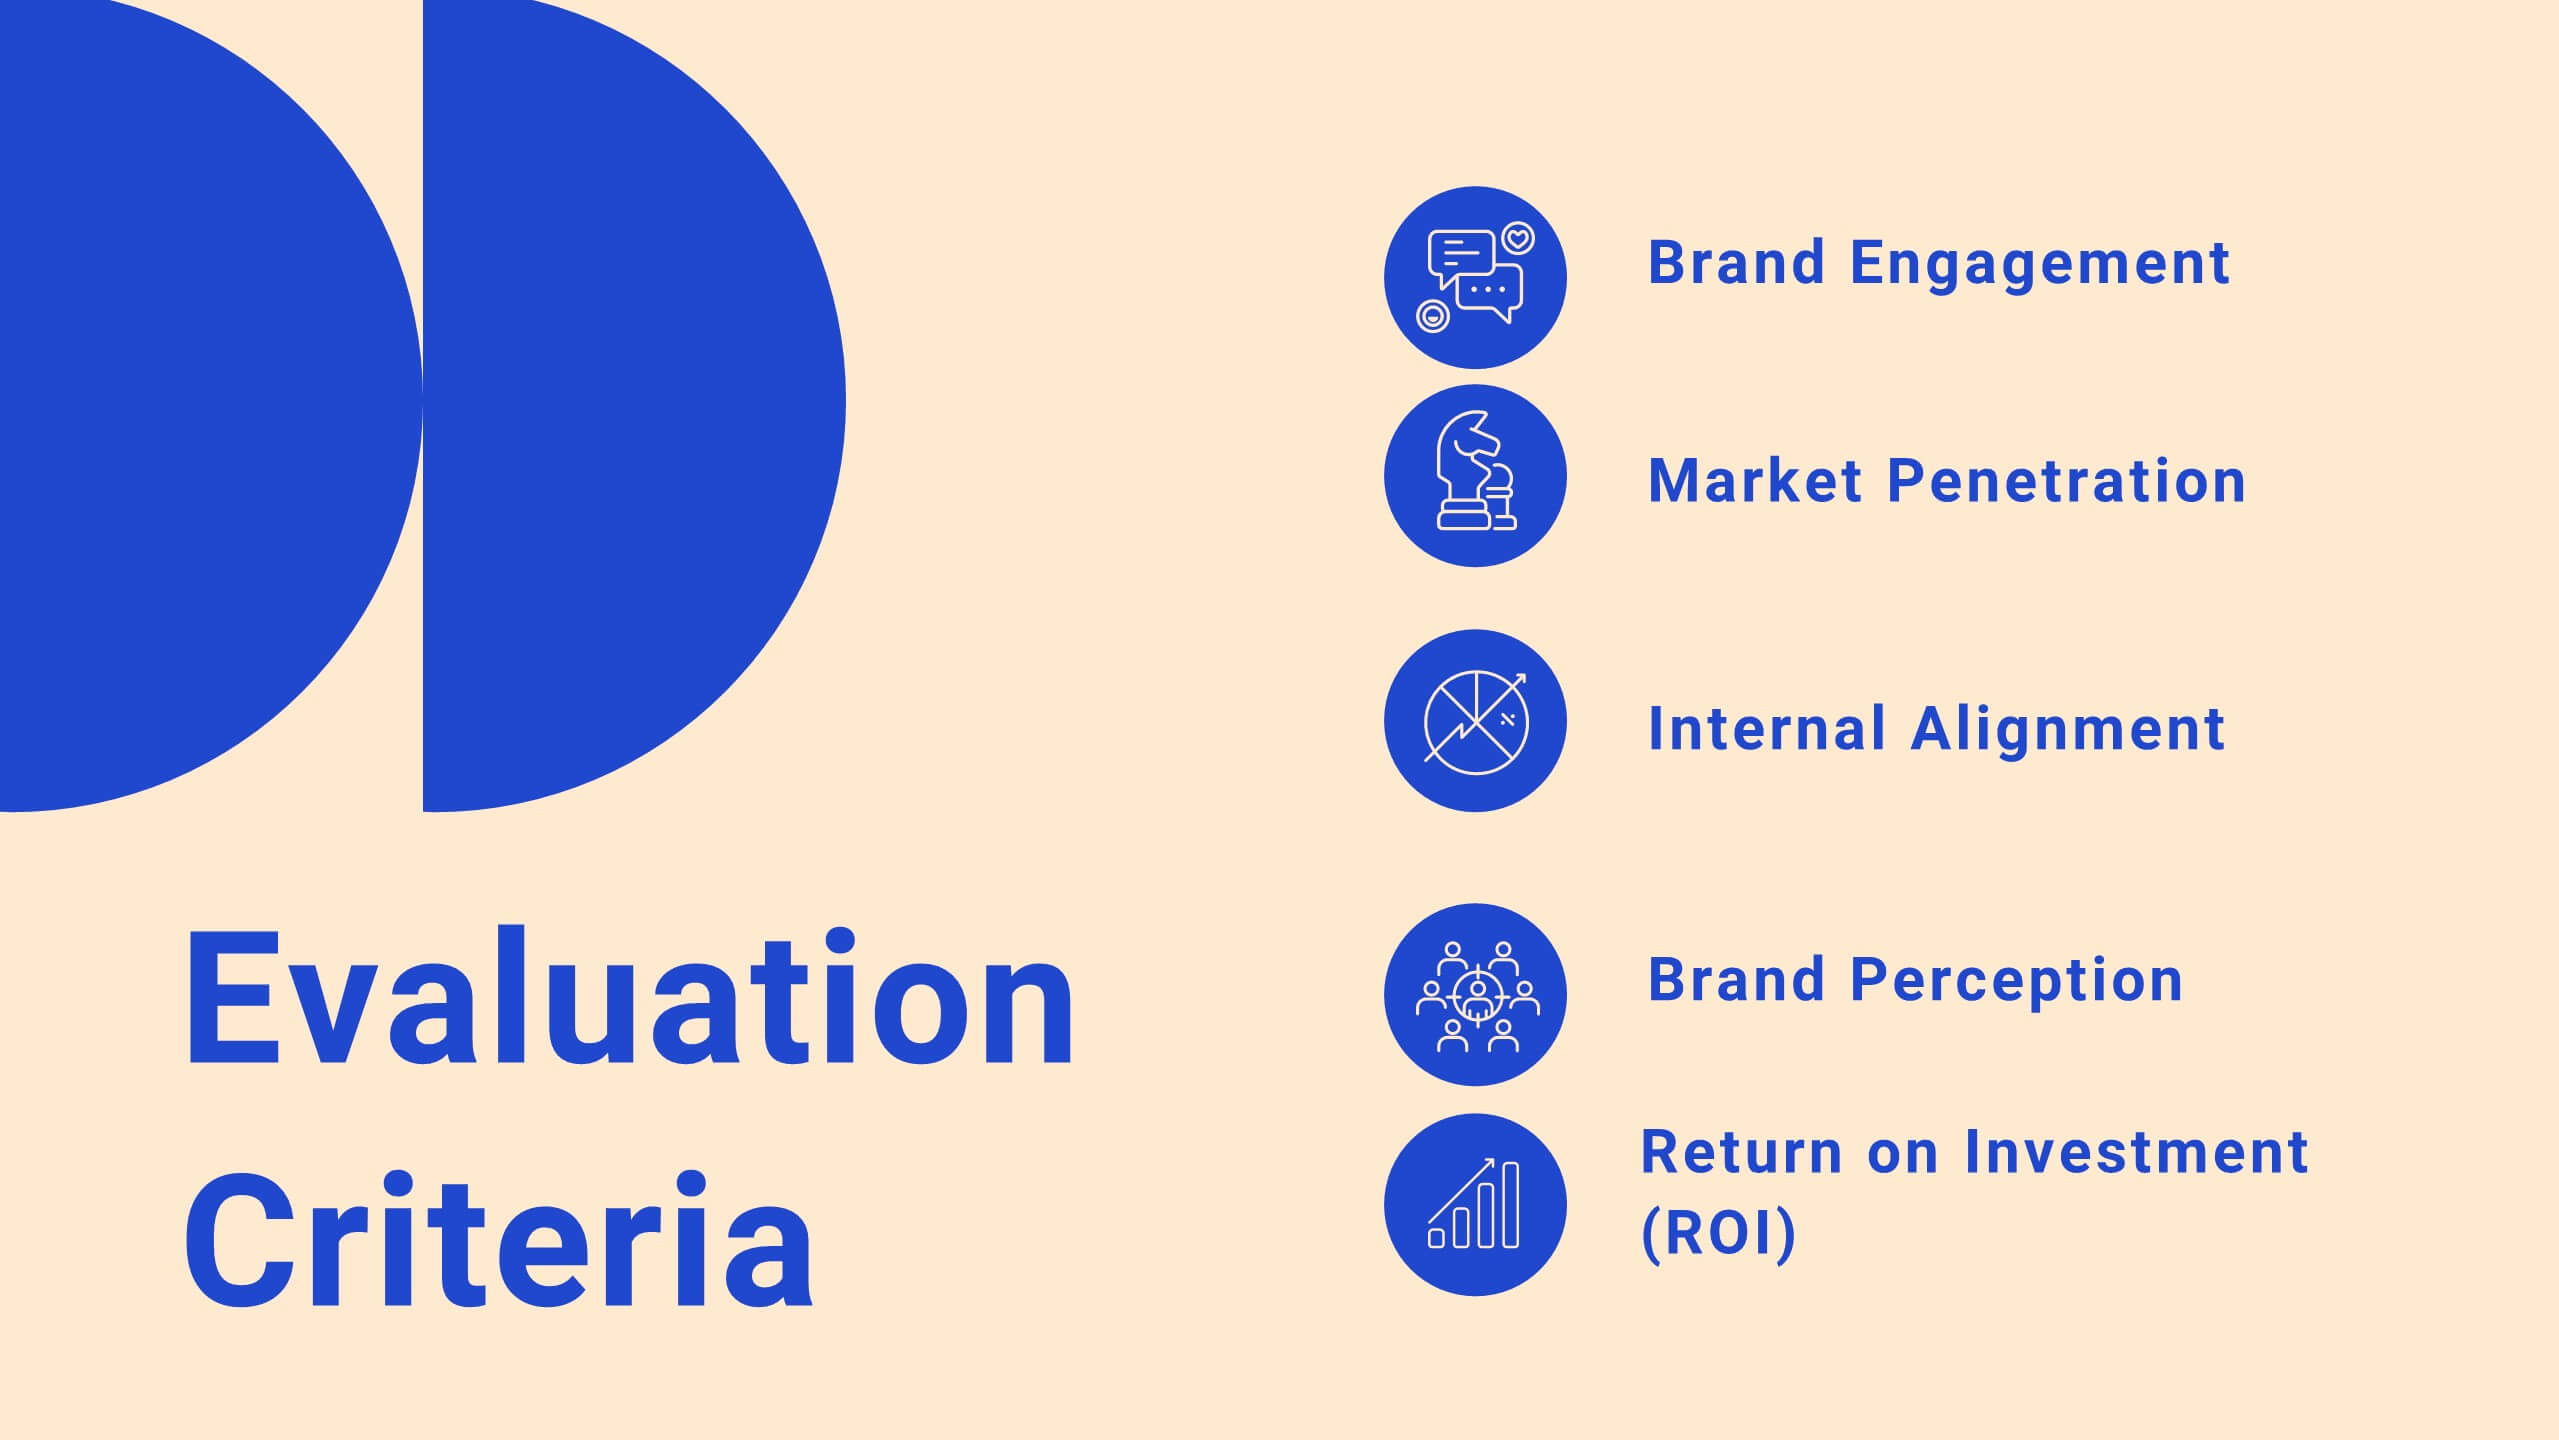
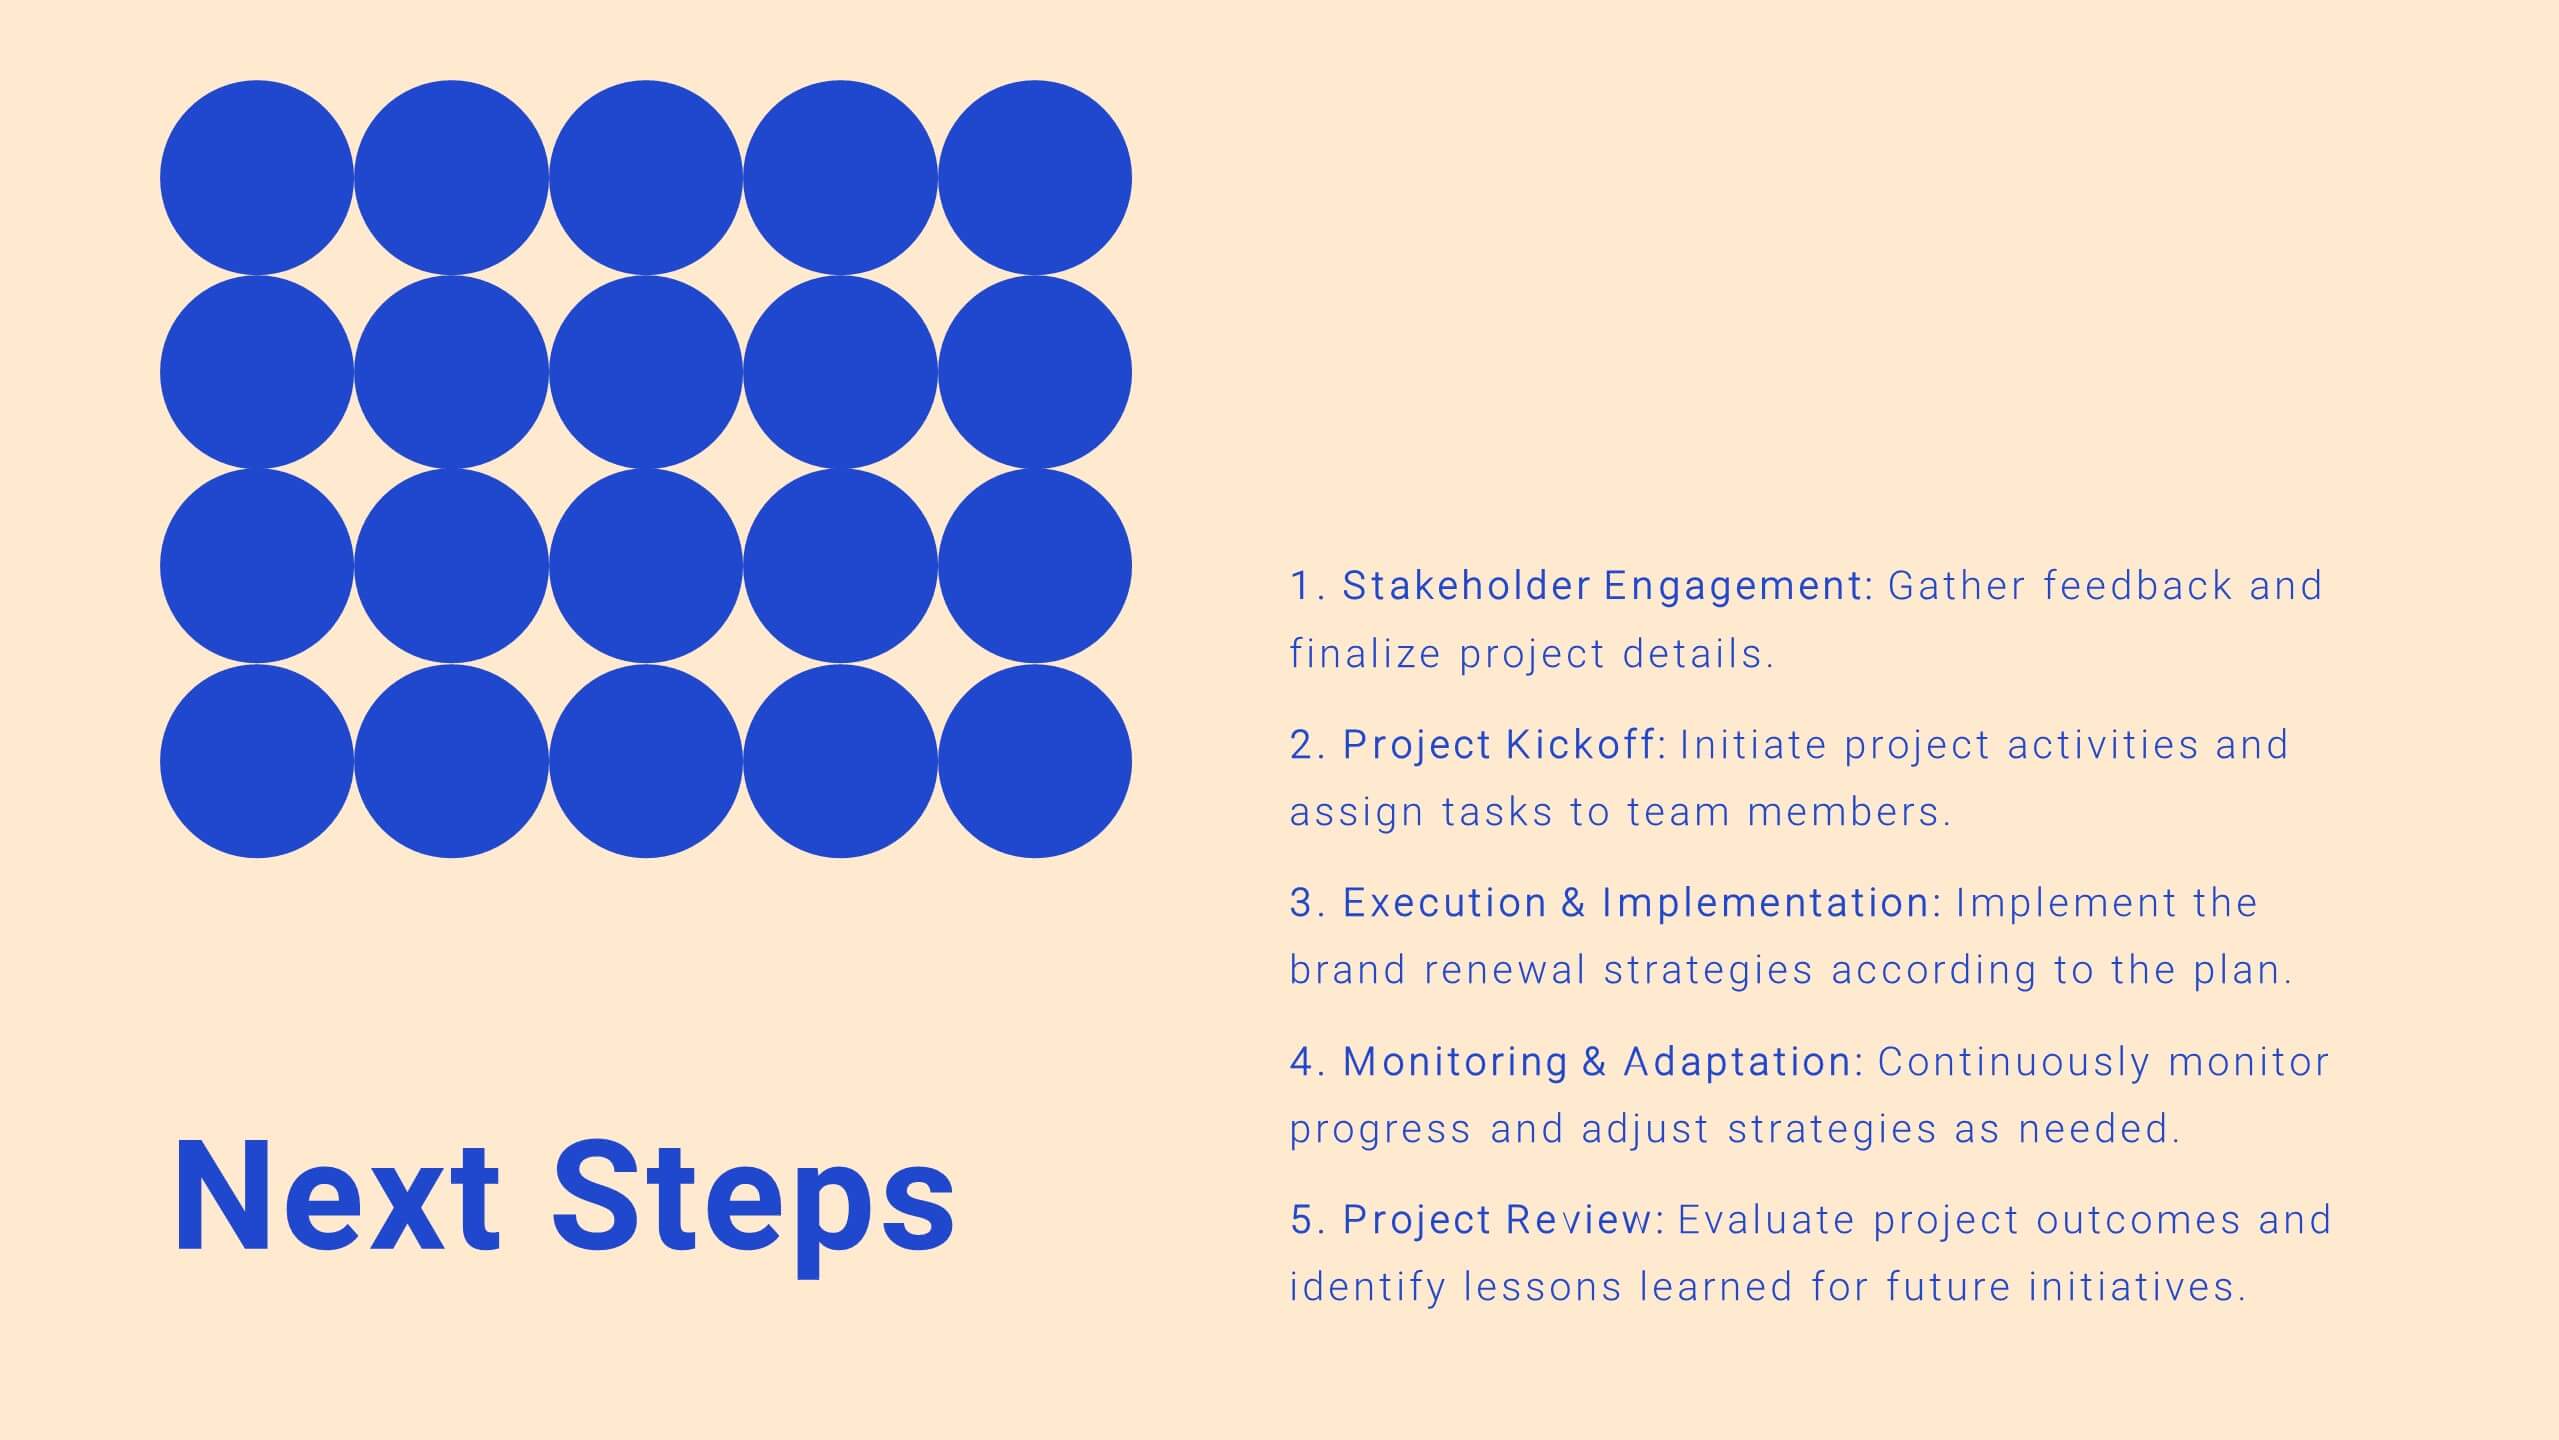
Drift Agile Project Plan Presentation
Take control of your projects with this comprehensive project plan template! From introductions to detailed objectives, this template covers scope of work, methodology, timelines, budget breakdowns, and risk management. Ideal for ensuring your project stays on track, it also includes stakeholder analysis and quality assurance plans. Compatible with PowerPoint, Keynote, and Google Slides.


4 slides
4-Level Funnel Analysis Diagram Presentation
Give your insights a clear path to follow with this clean, modern diagram built to simplify layered decision-making. This presentation breaks complex stages into four easy-to-read levels, helping you explain flow, priorities, and performance with confidence. Fully compatible with PowerPoint, Keynote, and Google Slides.


7 slides
Balance Sheet and Profit Overview Presentation
Give your financial summary a clean, modern look with the Balance Sheet and Profit Overview Presentation. This slide offers a dual-column layout with icons and space for six key financial metrics or business insights—ideal for summarizing assets, liabilities, profits, and more. Easily editable in Canva, PowerPoint, and Google Slides.


6 slides
Annual Scheduling with Calendar Milestones Presentation
Make your year feel like a well-oiled machine with this bold, color-coded visual layout. It helps you map out project phases, monthly milestones, and long-term plans with clarity and structure. Ideal for strategy meetings or annual reviews, this editable template works seamlessly in PowerPoint, Keynote, and Google Slides.


20 slides
Symphonix Marketing Campaign Presentation
The Marketing Campaign Presentation Template is designed for impactful storytelling and strategy. With 20 vibrant, customizable slides, it covers key topics like consumer behavior, emerging trends, data-driven strategies, and sustainability. Perfect for marketers and agencies, it’s fully compatible with PowerPoint, Keynote, and Google Slides for seamless presentations.


6 slides
Team Work Environment Infographic
A team work environment refers to the conditions and culture within a group of individuals who come together to work collaboratively on a common goal or project. This infographic template highlights the importance of teamwork and fosters a positive team-oriented workplace culture. The design emphasizes the key elements and benefits of a collaborative work environment, encouraging employees to work together effectively and efficiently. This infographic features illustrations that depict employees working together, collaborating, and supporting one another. This reinforces the idea of teamwork and unity within the organization.


2 slides
Designer Portfolio for Client Showcase Presentation
Showcase your creative work with the Designer Portfolio for Client Showcase Presentation. This sleek layout emphasizes visual storytelling, making it ideal for graphic designers, illustrators, and creatives presenting to potential clients. Highlight your projects in a clean, modern format. Compatible with Canva, PowerPoint, Keynote, and Google Slides for full customization.


21 slides
Eidora Qualitative Research Findings Presentation
Present your research findings with confidence using this professional and stylish presentation template. Covering key sections like objectives, methodology, data analysis, and recommendations, it helps you communicate complex information with clarity and impact. Perfect for academic or business use. Compatible with PowerPoint, Keynote, and Google Slides for easy customization.


5 slides
Water Industry Infographics
The Water Industry encompasses the management, treatment, distribution, and conservation of water resources. It plays a vital role in ensuring access to clean and safe water for various purposes. These infographic templates can serve as an effective educational tool for organizations, educational institutions, and environmental groups. This aims to inspire individuals and communities to make a positive impact by adopting sustainable water practices and contributing to the preservation of this vital resource. They are designed to inform about the importance of water conservation, sustainability, and efficient water management.


7 slides
Cryptocurrency Infographic Presentation Template
Cryptocurrency is a form of digital or virtual currency that uses cryptography (the conversion of data into an unreadable format) to secure transactions between two parties. Cryptocurrencies use decentralized control as opposed to centralized electronic money and central banking systems. This template is the perfect presentation for informing on the world of cryptocurrency. The decentralized control of each cryptocurrency works through a blockchain. It is an alternative currency brought on by the emergence of Internet. This template comes with appealing illustrations made for you to customize.


4 slides
Modern 3D Business Diagram Presentation
Bring your metrics to life with this sleek 3D chart that adds instant dimension to any business presentation. Designed to visualize comparisons or progress across three data sets, this diagram helps you communicate clearly without overloading the slide. Fully compatible with PowerPoint, Keynote, and Google Slides for a seamless workflow.


26 slides
Company Profile and Accomplishments Presentation
A company profile is a document that provides an overview of a business entity. This template serves as a company introduction, presenting essential information about company history, products or services, achievements, goals, and other relevant details. This template showcases the milestones and capabilities of a company. This presentation is perfect for businesses, startups, or organizations looking to highlight their success, growth, and overall expertise in their industry. The clean layout, engaging visuals, and comprehensive information, will help your presentation leave a lasting impression on your audience and enhance your company's reputation.