


Features
- 4 Unique slides
- Fully editable and easy to edit in Microsoft Powerpoint, Keynote and Google Slides
- 16:9 widescreen layout
- Clean and professional designs
- Export to JPG, PDF or send by email


Do you have any questions?
Recommend


6 slides
Root Cause Breakdown with Impact Lines Presentation
Visualize the path from causes to consequences with the Root Cause Breakdown with Impact Lines Presentation. Designed with a clear horizontal arrow flow and dual-level layout, this slide helps you dissect key issues and their cascading effects. Ideal for risk analysis, incident reviews, and operational strategy meetings. Fully customizable in PowerPoint, Keynote, and Google Slides.


21 slides
Frostfire Agile Project Plan Presentation
The Agile Project Plan Presentation Template features 21 cohesive slides including timelines, objectives, stakeholder analysis, and budget breakdowns. Its modern brown and lavender design ensures clarity and professionalism. Perfect for project managers and teams, it’s fully customizable and compatible with PowerPoint, Keynote, and Google Slides for seamless collaboration and presentations.


3 slides
Emerging Tech Innovations Deck Presentation
Present futuristic ideas with this Emerging Tech Innovations Deck. Perfect for tech leaders, startups, and educators, this slide set features modern visuals with robot illustrations and sleek layouts. Easily editable in PowerPoint, Keynote, or Google Slides. Ideal for showcasing cloud computing, automation, or AI-driven strategies in a compelling format.


7 slides
Short Term Goals Infographic Presentation
Short-term Goals are important because they provide a clear focus and direction for individuals or organizations to achieve their long-term objectives. Get started on your goals in no time with this template. It is professional, clean and has everything you need to create a presentation. It's a good choice for career advancement and pitches. This template is designed to help your audience visualize the impact of your goals. Use this template as a base to brainstorm your vision and objectives with your team. The goal-oriented design will bring awareness and create excitement about your goals.


8 slides
Architectural Design and Smart Home Trends Presentation
Showcase modern architecture insights and tech-savvy innovations with this layered home diagram slide. Ideal for real estate, construction, or smart home professionals, it highlights key features in a visually tiered format. Fully editable in PowerPoint, Keynote, and Google Slides—perfect for clean, tech-forward presentations with a sleek design.


21 slides
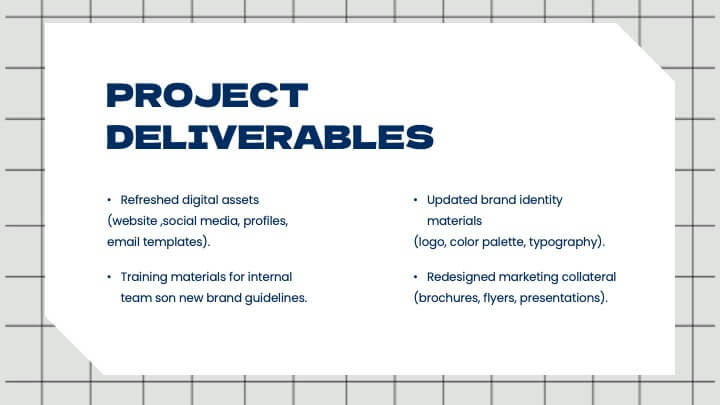
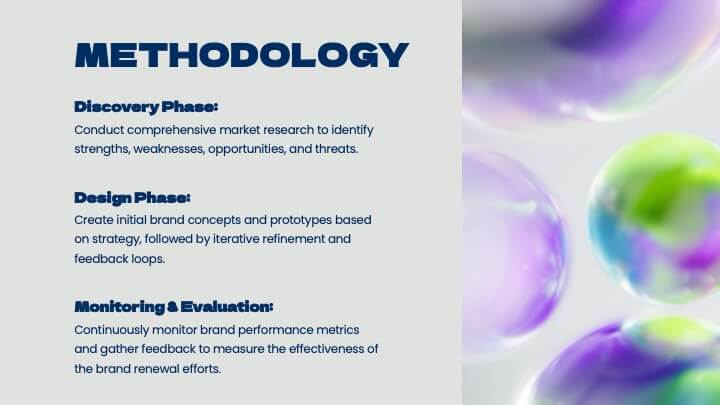
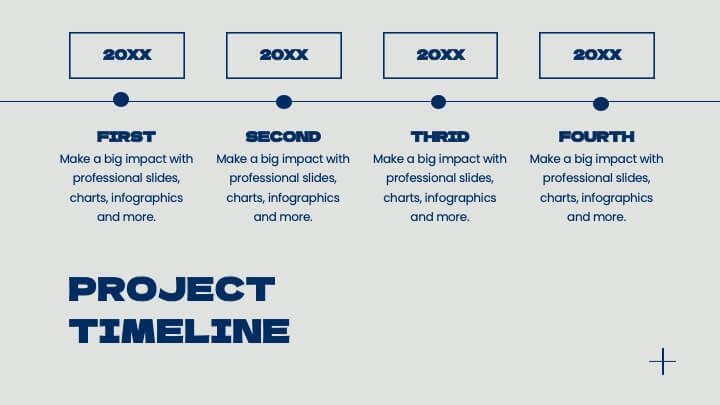
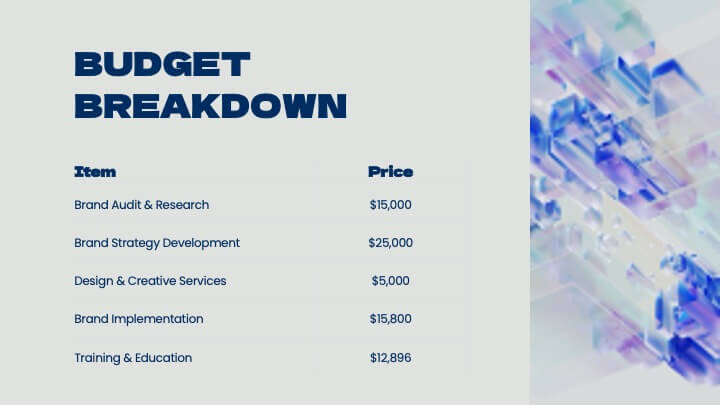
Design Creative Concept Presentation
Enhance your creative presentations with this Creative Concept template. It features slides for objectives, color palettes, typography options, and prototyping steps. Ideal for designers and creative teams, this template supports PowerPoint, Keynote, and Google Slides, facilitating a comprehensive and engaging presentation of creative projects.


4 slides
Frequently Asked Questions (FAQ) Presentation
Enhance your FAQ section with this modern and visually structured presentation slide. Featuring a bold question mark icon, this template allows you to clearly organize and present key questions and answers in a professional and engaging format. Perfect for customer service, business proposals, and informational presentations, this slide is fully customizable with editable text, colors, and layouts. Compatible with PowerPoint, Keynote, and Google Slides for easy integration.


7 slides
Mind Map Project Infographic
A mind map is a visual representation of information, ideas, or concepts arranged around a central topic or theme. This template is a powerful brainstorming and organizational tool that helps individuals or teams visually connect related ideas, explore new connections, and see the bigger picture. This diagram organizes information around a central theme or idea, with branches extending outwards to represent related concepts or tasks. This infographic is perfect for for capturing ideas, and presenting complex information in a structured and easily manner. This template is customizable and compatible with Powerpoint, Keynote, and Google Slides.


7 slides
Africa Colonization Map Infographic
Embark on a historical exploration with our meticulously designed Africa colonization map infographic. Colored with the earthy green, the profound blue, the intense red, and the radiant yellow, our template serves as a vivid chronicle of Africa's colonial past. Detailed with sharp infographics, emblematic icons, and region-specific image placeholders, it provides a comprehensive overview of colonial footprints across the continent. Expertly adapted for Powerpoint, Keynote, or Google Slides. An invaluable tool for historians, educators, or anyone delving into the complex colonial history of Africa. Traverse with understanding; let each slide unveil a chapter of Africa's storied past.


6 slides
Process Flow in Wheel Format Presentation
Showcase cyclical processes and step-by-step workflows with this Process Flow in Wheel Format. This dynamic, circular diagram is perfect for illustrating ongoing operations, development cycles, or organizational stages. Each section is clearly labeled and color-coded for easy customization. Fully editable in PowerPoint, Keynote, and Google Slides — ideal for operations managers, project leads, and consultants.


5 slides
Identifying and Mitigating Risks Presentation
Master risk management with the Identifying and Mitigating Risks template, designed to deliver clear and impactful presentations that outline key risk factors and mitigation strategies. It features easily customizable icons representing various aspects of risk assessment. This template allows professionals to effectively communicate risk mitigation strategies, ensuring essential information is concise and understandable. Additionally, it is compatible with PowerPoint, Keynote, and Google Slides.


21 slides
Minoan Project Timeline Presentation
Step back in time with this beautifully crafted Minoan-inspired presentation, perfect for outlining your project timeline! With an elegant design and clear structure, this template helps you showcase key milestones, deadlines, and deliverables in a visually stunning way. Keep your project on track. Compatible with PowerPoint, Keynote, and Google Slides.


6 slides
Risk Assessment Spider Chart Presentation
Clearly visualize risk exposure across multiple criteria with the Risk Assessment Spider Chart Presentation. This template is perfect for comparing key risk factors in a visual, easy-to-understand format. Ideal for project managers, risk analysts, and consultants. Fully customizable and works seamlessly with PowerPoint, Keynote, and Google Slides.


5 slides
Operational Planning in 5 Key Steps Presentation
Present your operational roadmap with this dynamic 5-step arrow diagram. Each line represents a strategic input streamlined toward a unified goal. Ideal for workflows, business processes, or implementation plans. Fully editable in PowerPoint, Keynote, and Google Slides—perfect for team planning, operations meetings, and project execution strategies.


6 slides
Hierarchical Pyramid Model Presentation
Break down organizational structures or business strategies effectively with the Hierarchical Pyramid Model Presentation. This slide features a five-tier pyramid design, perfect for representing levels of authority, team structures, or sequential priorities. Each layer includes matching labels and icons for added clarity. Fully editable and compatible with PowerPoint, Keynote, and Google Slides.


5 slides
Problem-Solving and Risk Navigation Presentation
Navigate uncertainty with clarity using the Problem-Solving and Risk Navigation presentation. This slide features a winding, color-coded path that visually represents each step in a complex decision-making process—from initial analysis to final action. Each of the five stages is marked with an arrow and an icon for intuitive storytelling. Ideal for strategy meetings, risk management workshops, or project reviews. Fully editable in PowerPoint, Keynote, and Google Slides.


15 slides
Business Roadmap Infographic
A business roadmap is a strategic plan that outlines the goals, milestones, and key initiatives a company intends to achieve over a specific period. This infographic template is designed to showcase the strategic journey and future goals of a business or organization. This infographic presents a clear and concise overview of the business's roadmap, highlighting key milestones, objectives, and action plans for achieving success. The infographic features a horizontal timeline that represents the business's journey from its inception to the envisioned future milestones. Each milestone is accompanied by a brief description or icon to provide context.