


Features
- 26 Unique slides
- Fully editable and easy to edit in Microsoft Powerpoint, Keynote and Google Slides
- 16:9 widescreen layout
- Clean and professional designs
- Export to JPG, PDF or send by email


Do you have any questions?
Recommend


21 slides
Somnara Full-Service Agency Project Plan Presentation
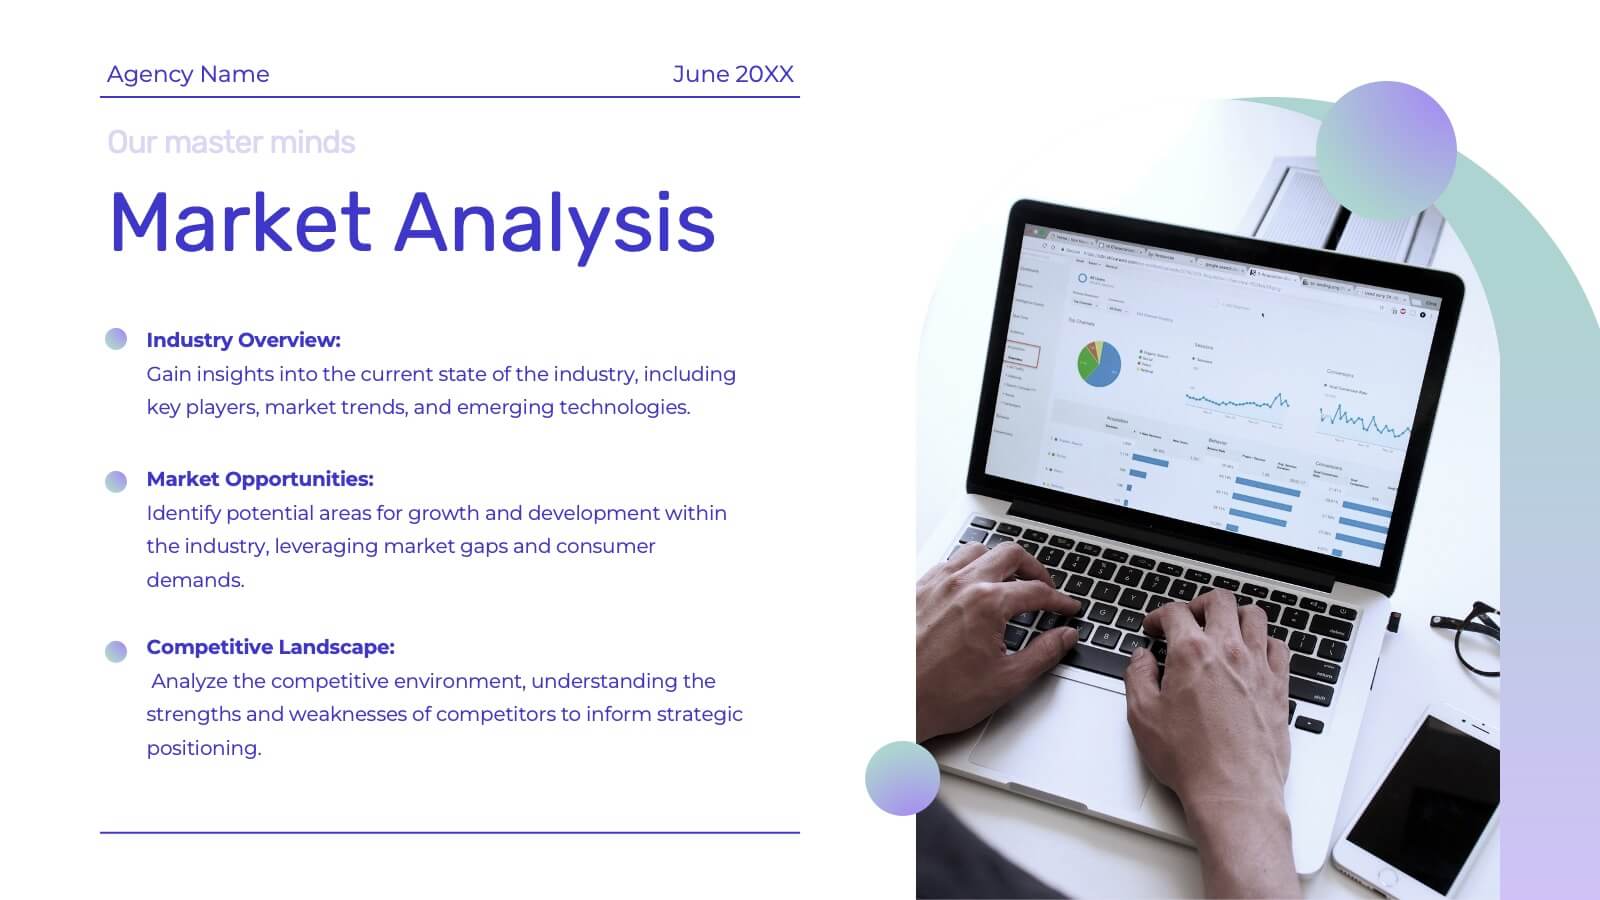
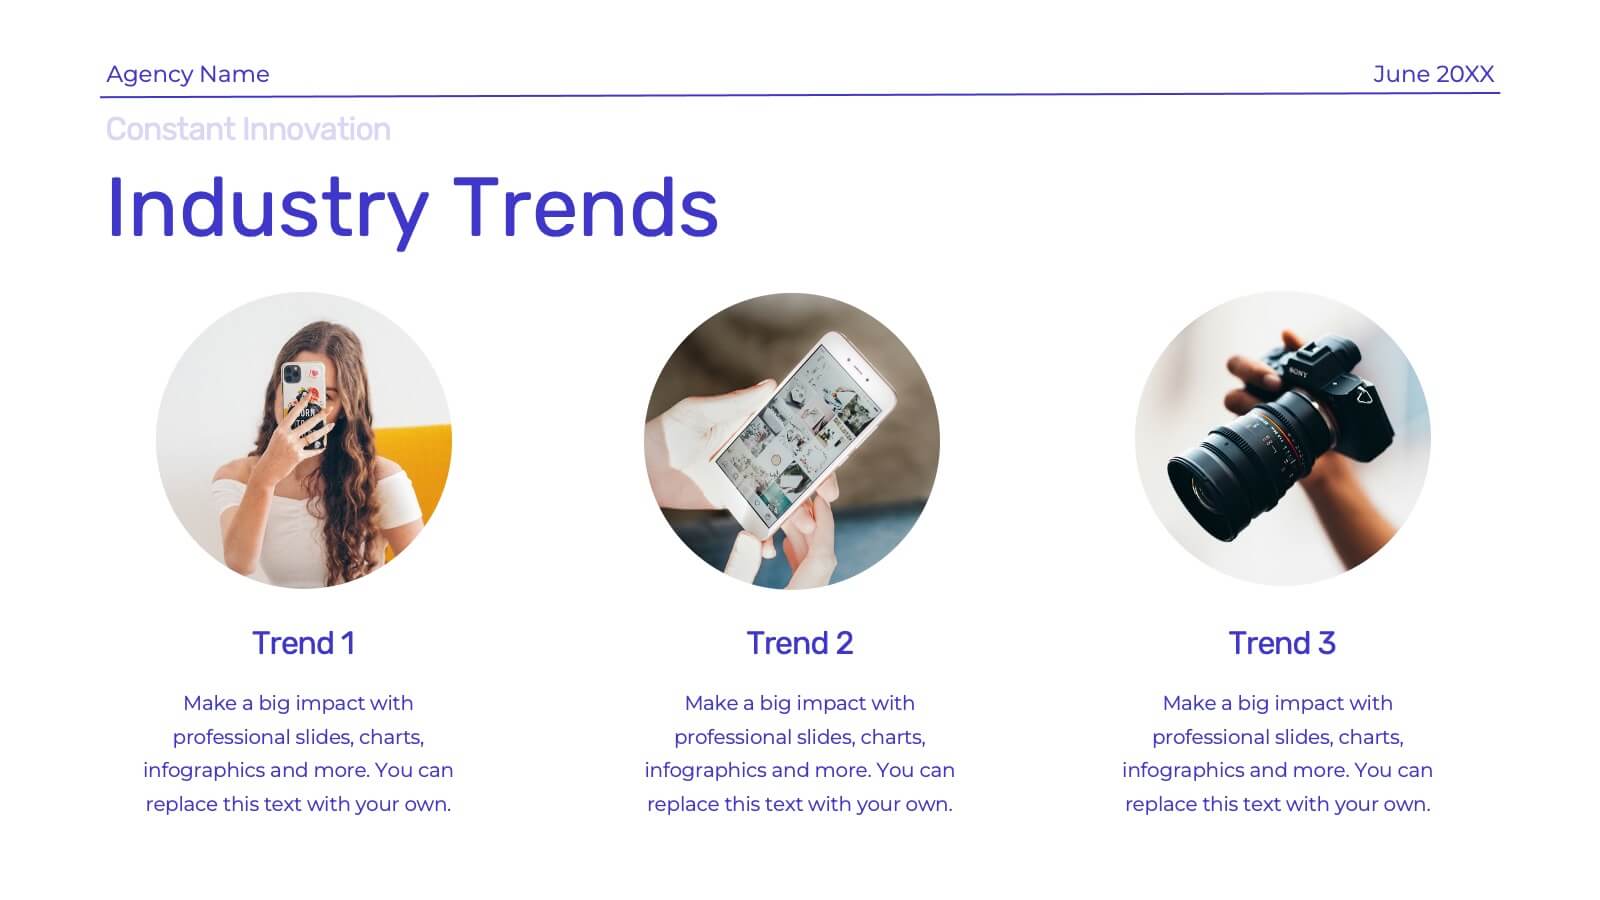
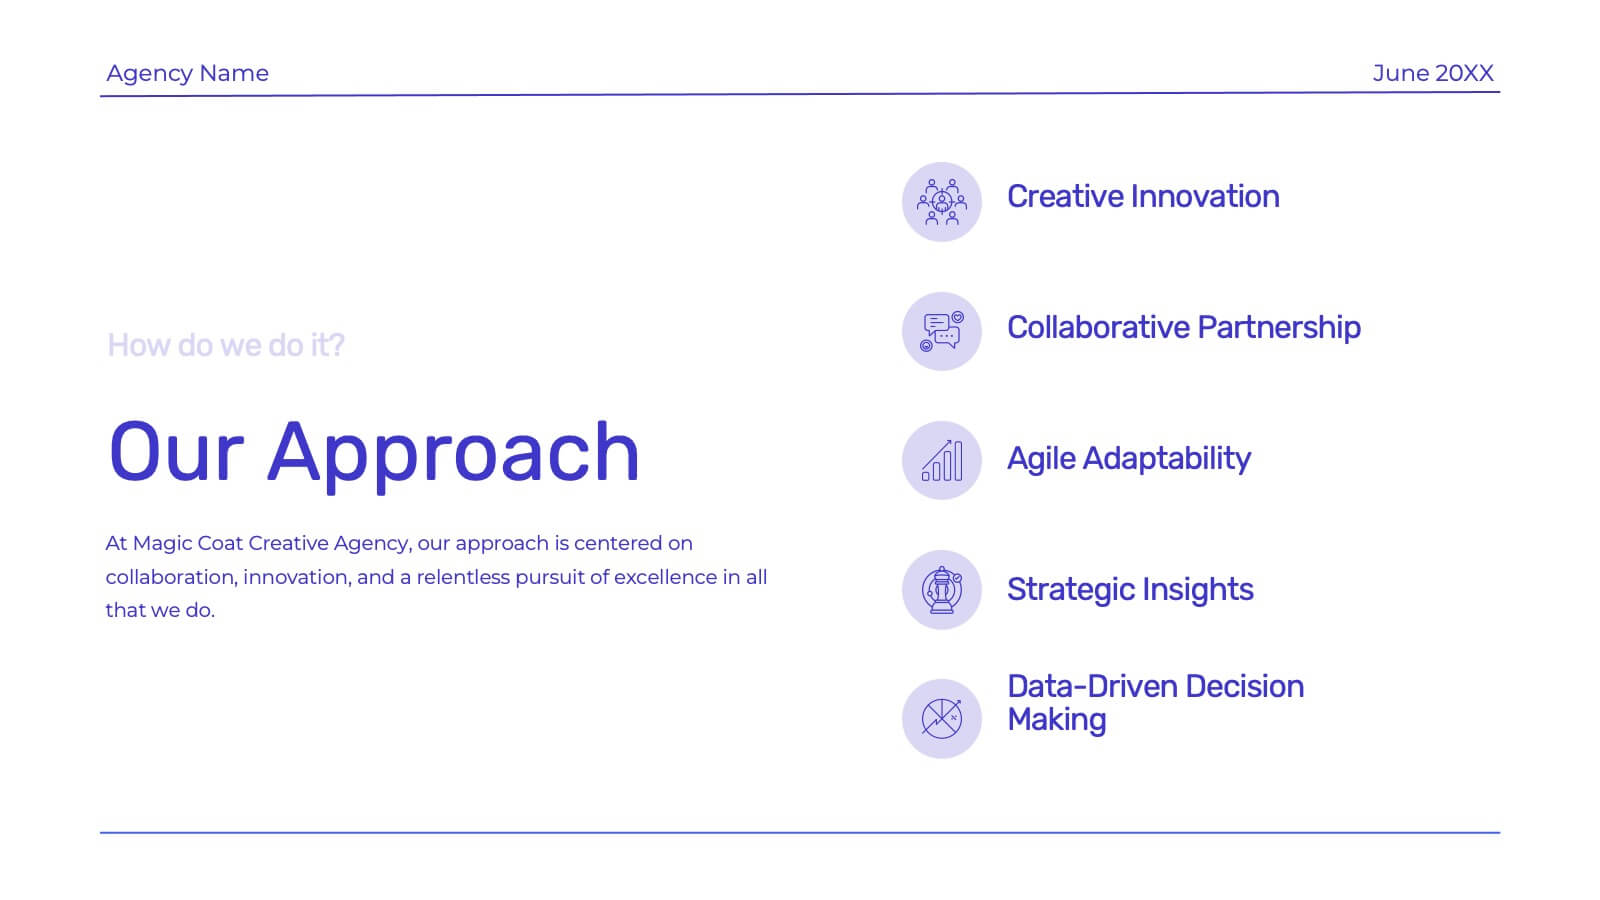
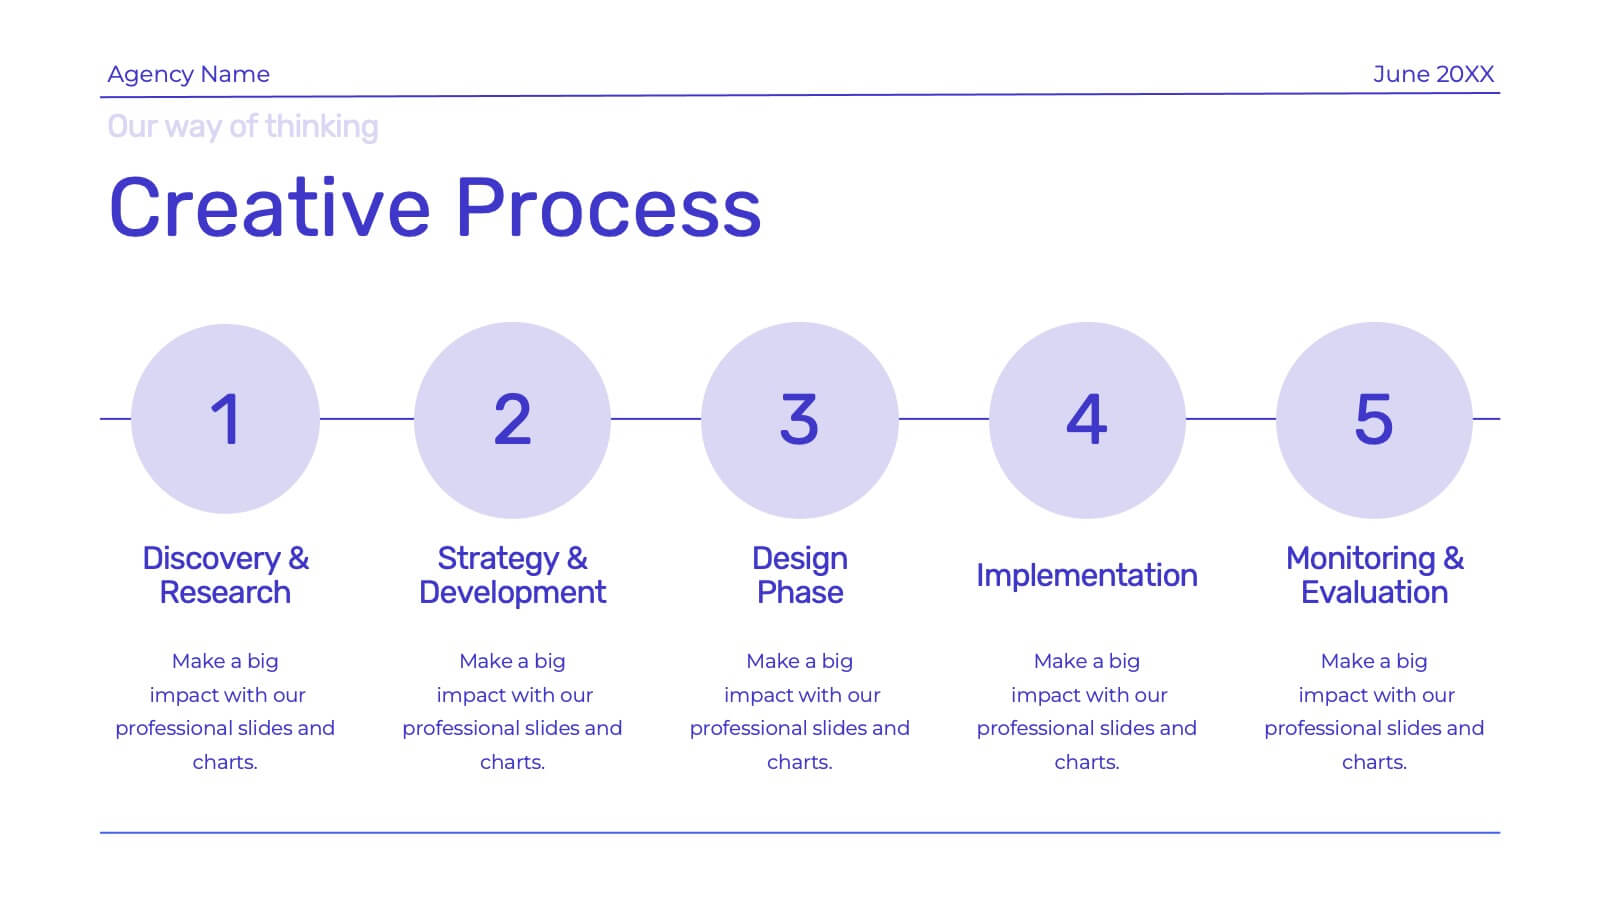
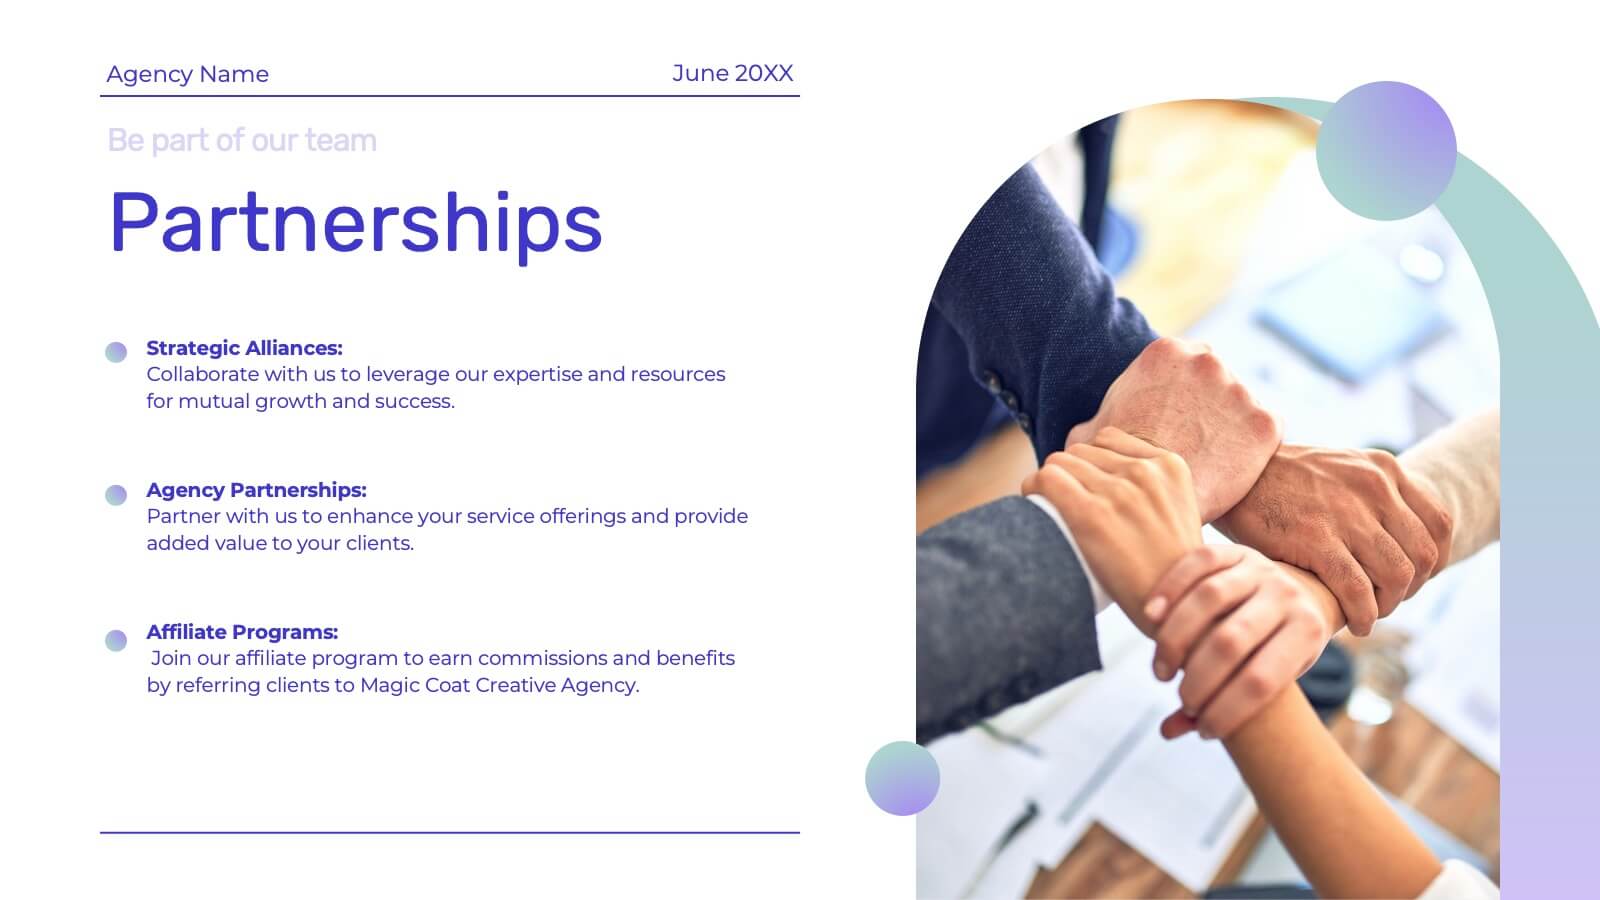
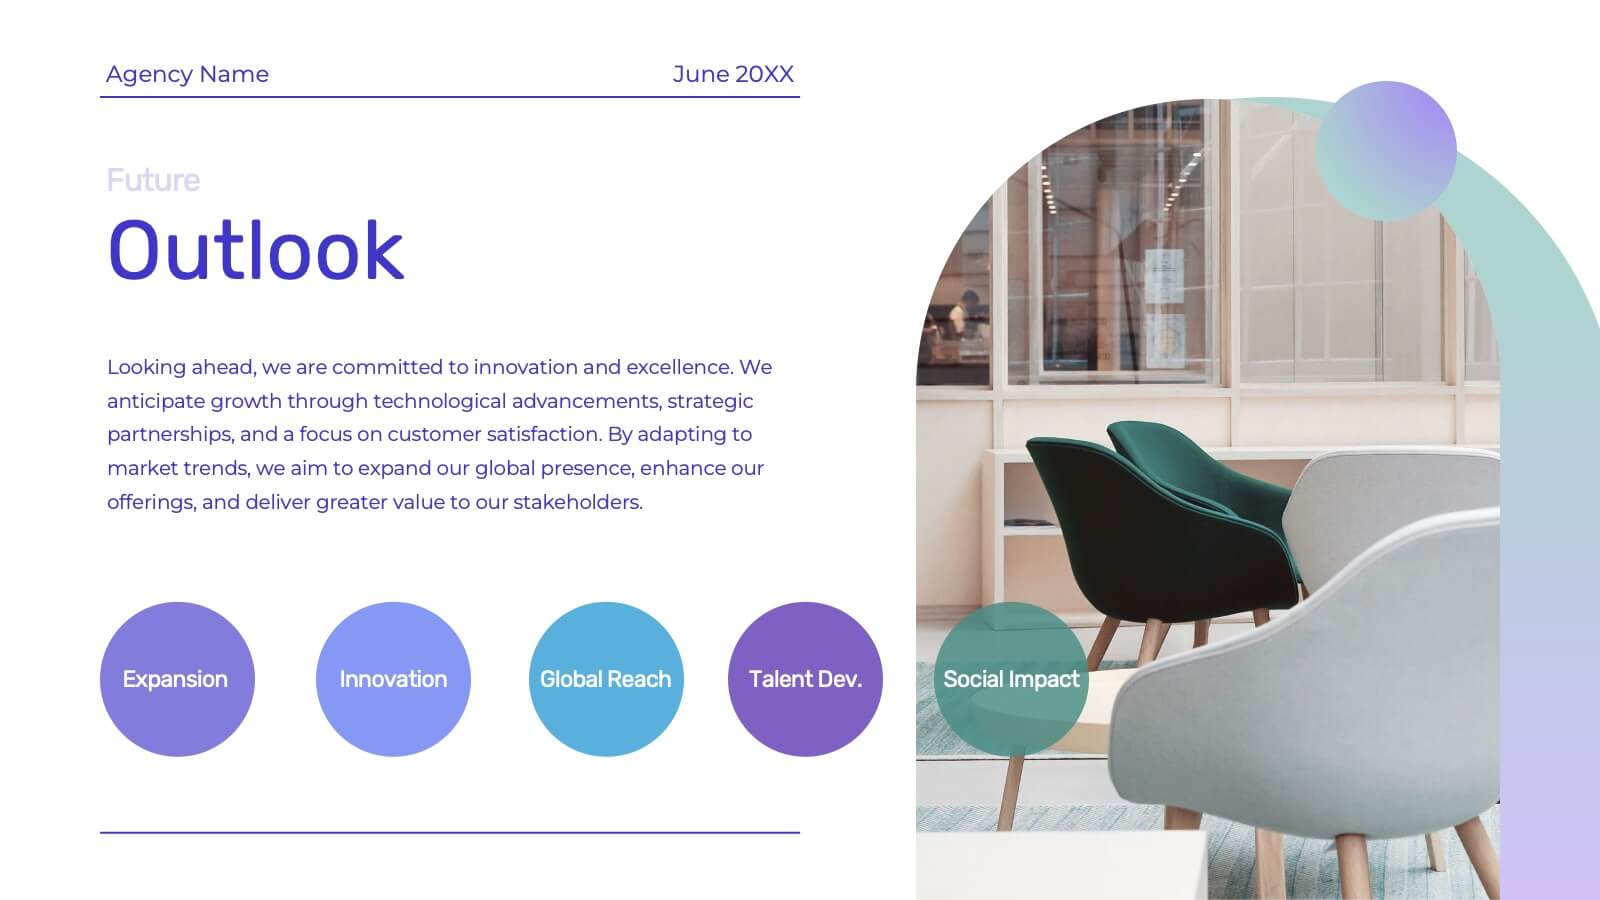
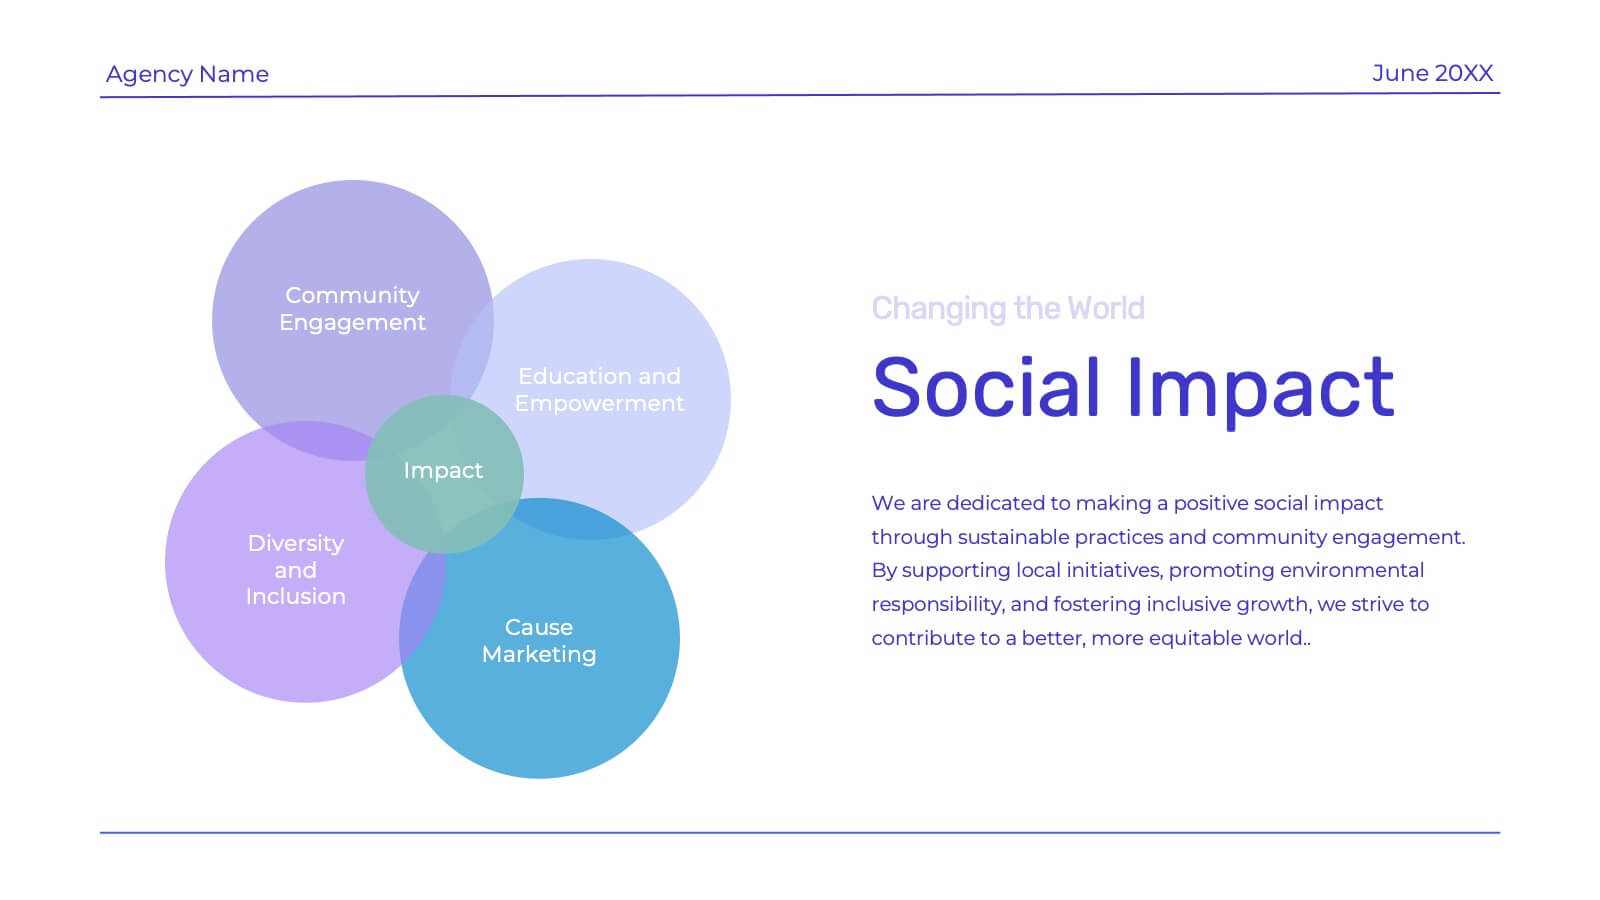
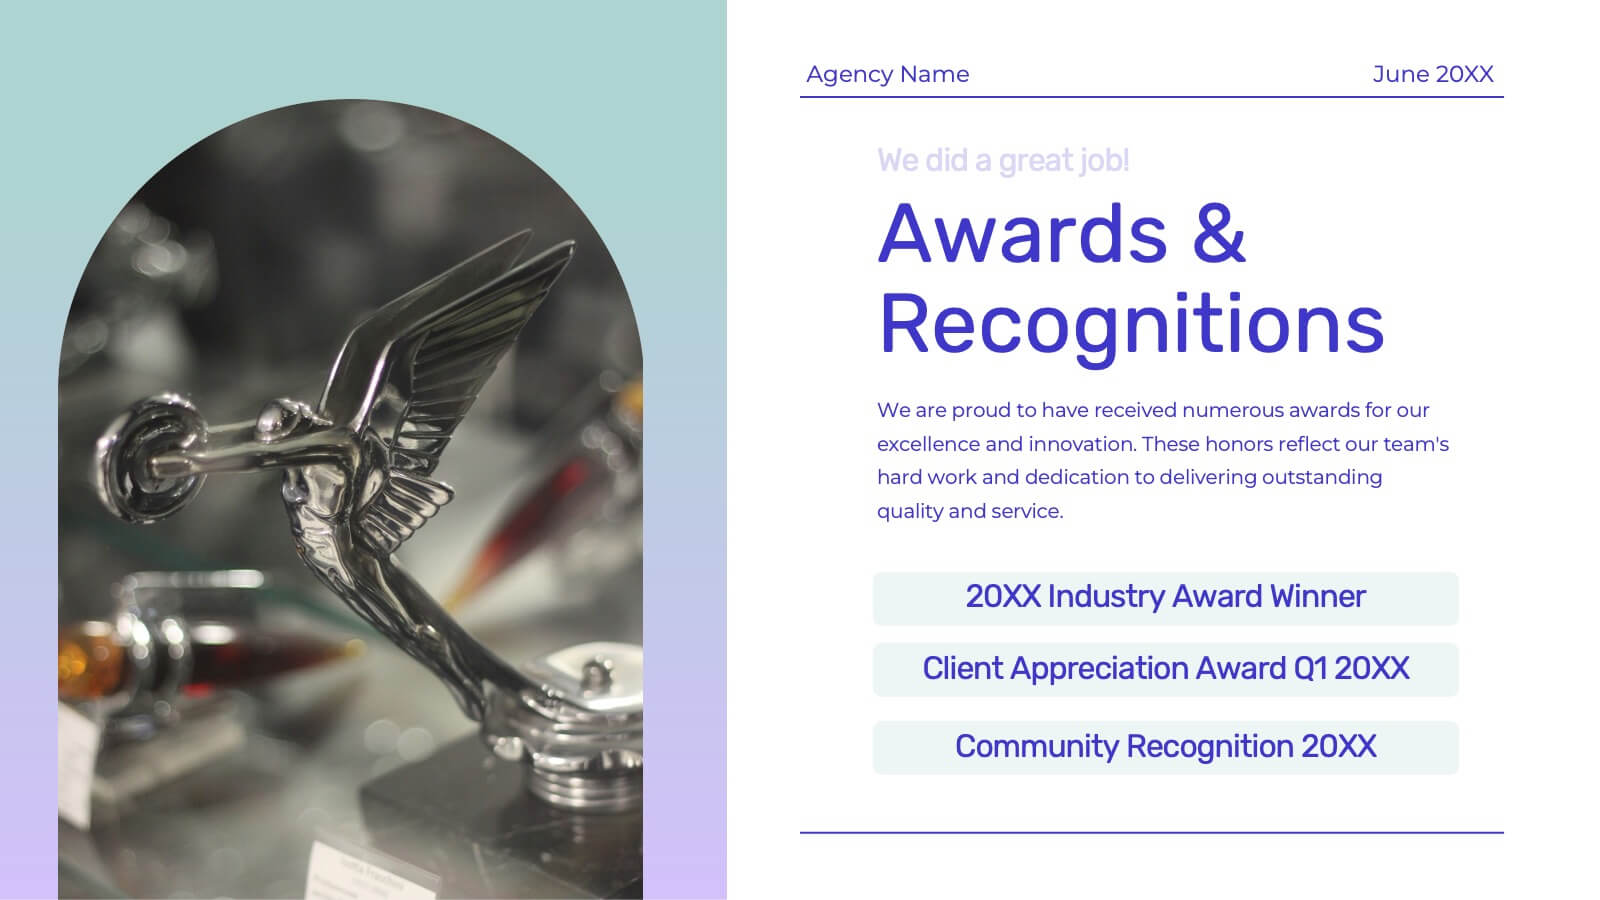
Present your agency’s expertise with a comprehensive project plan template designed to impress clients and stakeholders. This sleek and professional layout allows you to outline your mission and vision, highlight team strengths, and showcase core services with clarity. Use the client testimonials and case studies sections to establish credibility and trust. Visualize your strategic approach with dedicated slides for market analysis, creative process, and execution strategy. The template also includes detailed sections for partnership opportunities, social responsibility initiatives, and a future outlook, ensuring a holistic view of your agency’s capabilities and forward-thinking approach. Fully editable and compatible with PowerPoint, Google Slides, and Keynote, this template is perfect for full-service agencies seeking to elevate their presentations. Customize each slide to reflect your unique value and deliver impactful, results-oriented proposals.


23 slides
Lexicon Startup Pitch Deck Template Presentation
The Startup Pitch Deck Presentation Template provides a modern and professional design with 23 fully customizable slides, ideal for startups seeking funding or presenting their business idea. Key sections include company overview, problem statement, solution, market opportunity, business model, and unique selling proposition (USP). It also covers competitive landscape, product features, financials, milestones, and funding requirements, ensuring a comprehensive pitch. The vibrant orange and gray color scheme adds energy and creativity to the presentation. Compatible with PowerPoint, Keynote, and Google Slides, this template is perfect for impactful startup pitches.


5 slides
Porter's Five Forces Competitive Analysis Presentation
Illustrate market dynamics and industry competitiveness using Porter’s Five Forces. This template covers New Entrants, Buyer Power, Supplier Power, Substitutes, and Customer Power in a clean, letter-coded format. Fully editable in PowerPoint, Keynote, and Google Slides, it's perfect for strategic analysis and investor presentations. Clear, structured, and easy to customize.


6 slides
Prioritized Business List Format
Streamline your priorities with this clean and structured list layout, perfect for project steps, goals, or ranking business initiatives. Featuring five connected stages with icons, this editable design highlights key information in an easy-to-follow format. Fully customizable in PowerPoint, Keynote, and Google Slides.


19 slides
Kale Product Strategy Report Presentation
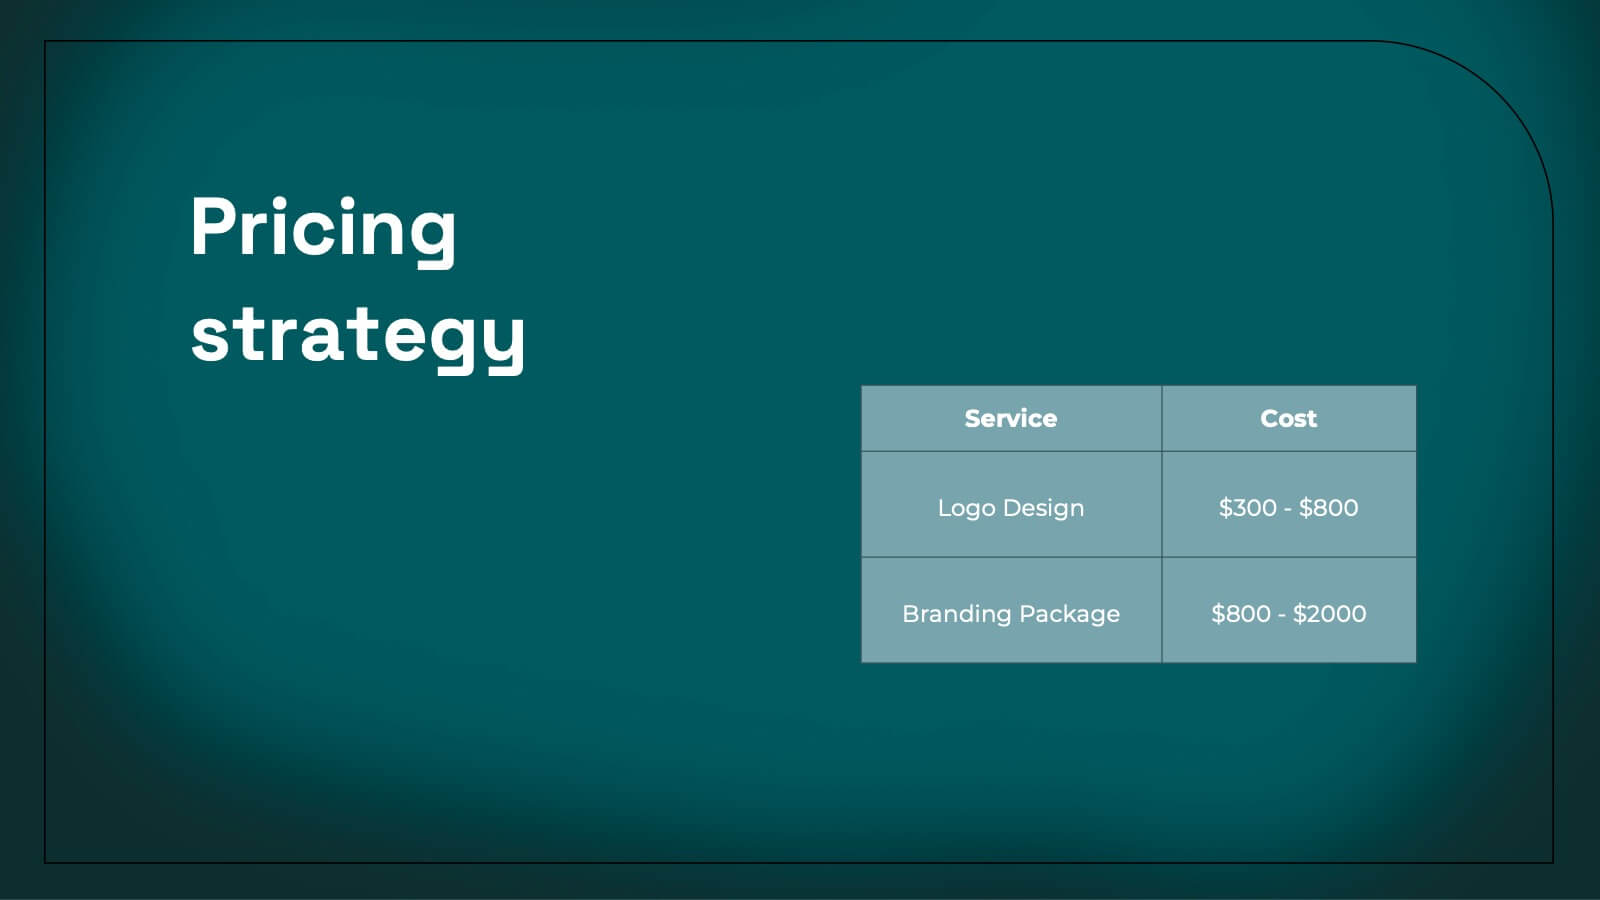
Unleash the power of your product with this bold and dynamic product strategy report template! Elevate your presentation with eye-catching designs that showcase product features, competitive analysis, and pricing strategies like never before. Captivate your audience from start to finish and leave a lasting impression. Fully compatible with PowerPoint, Keynote, and Google Slides!

22 slides
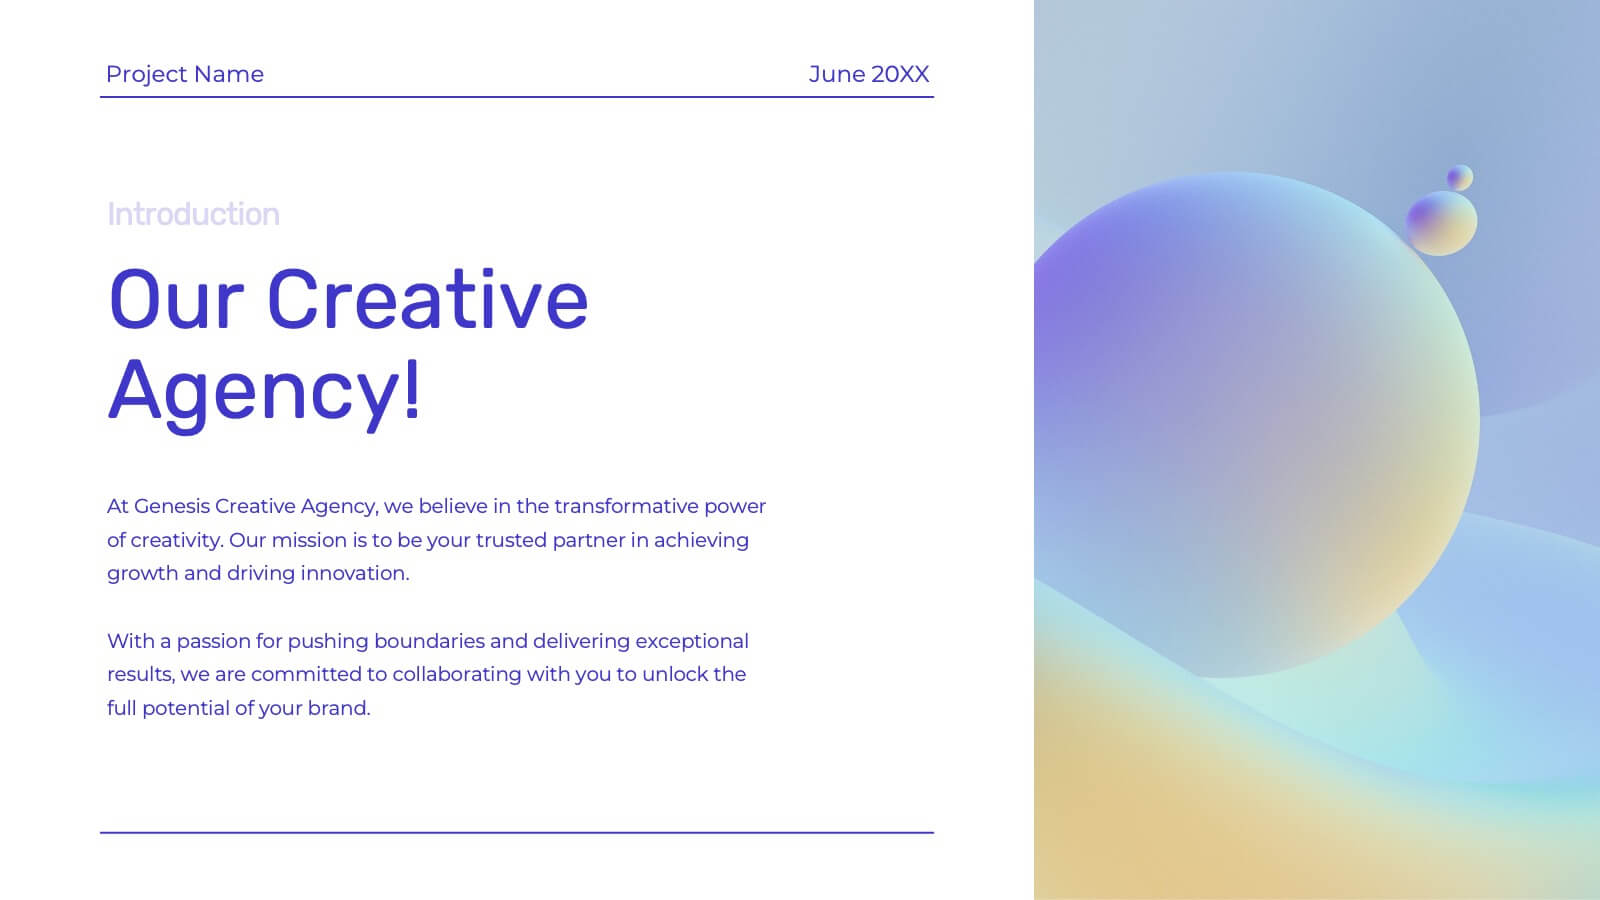
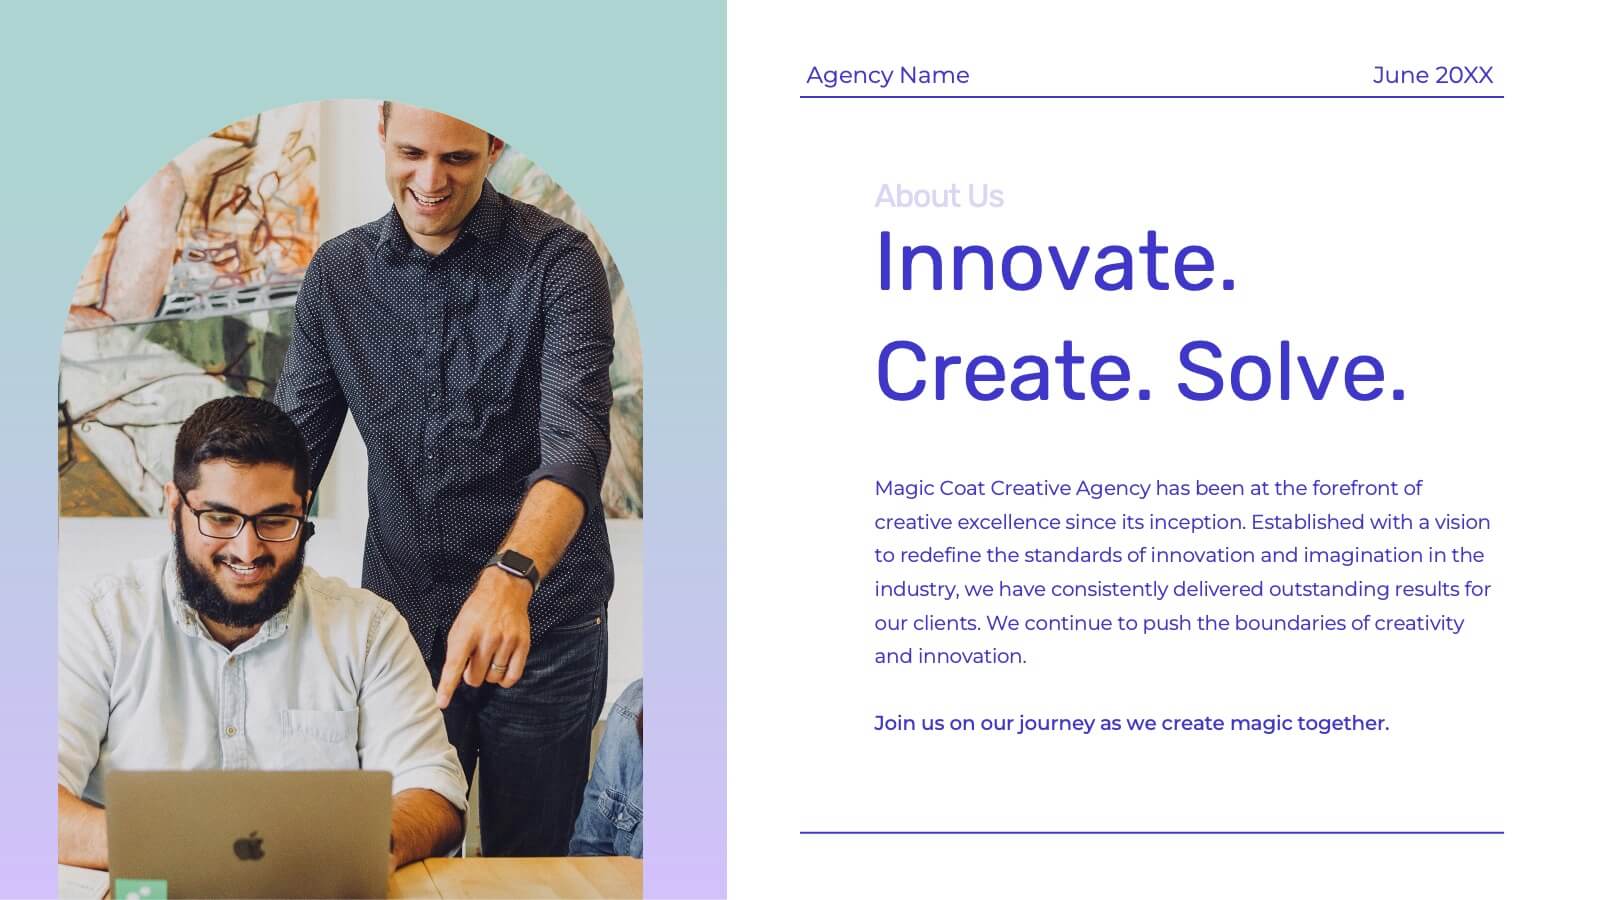
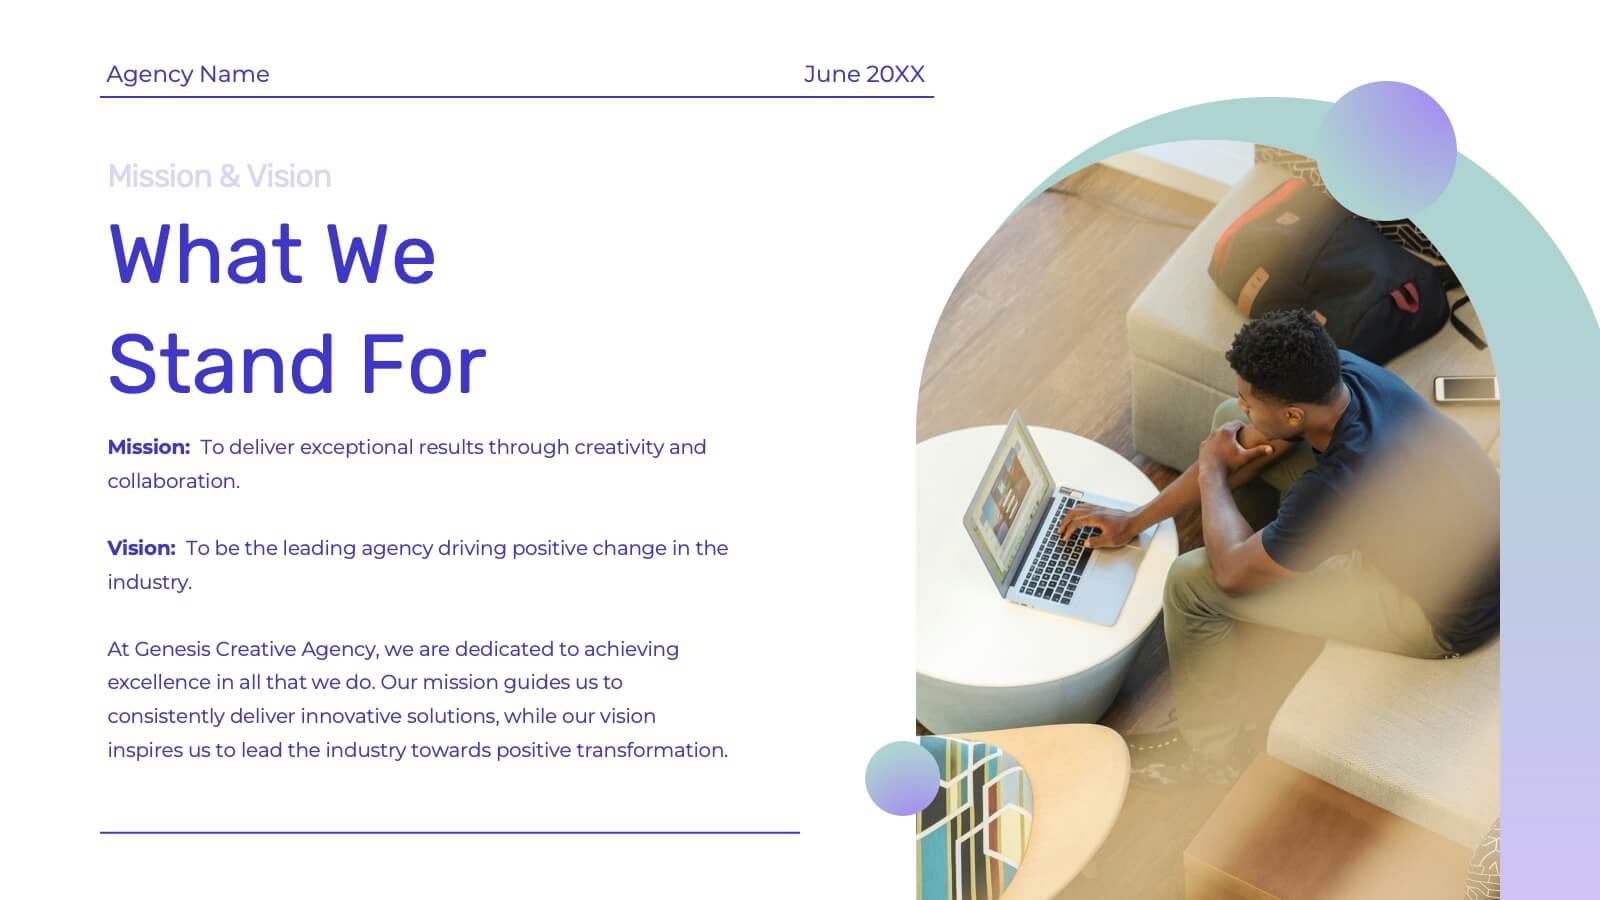
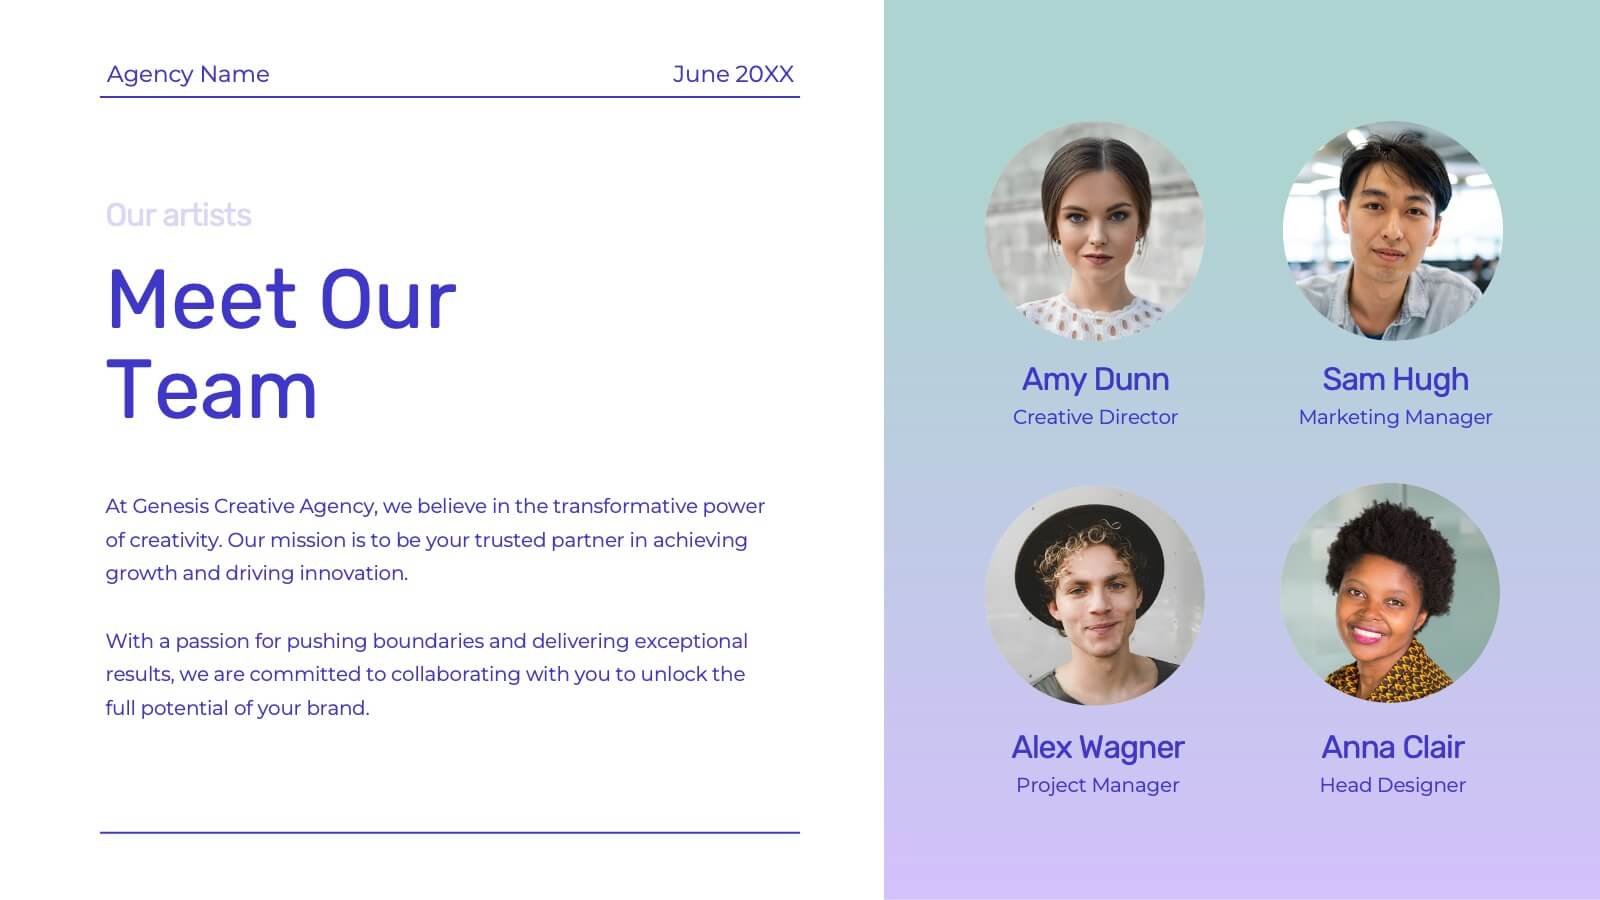
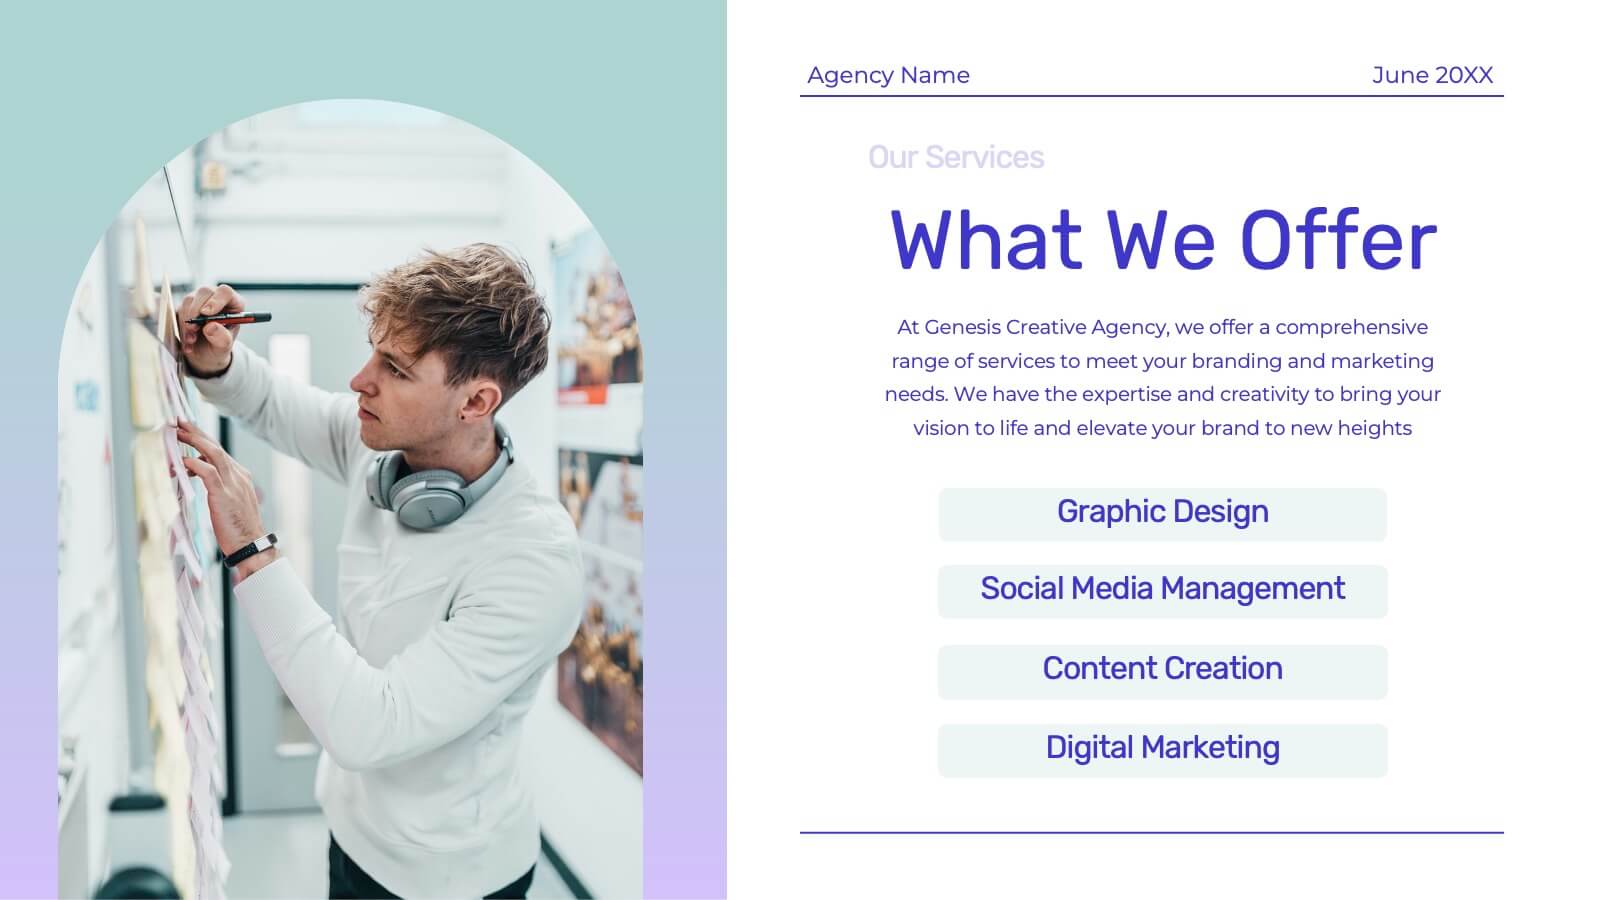
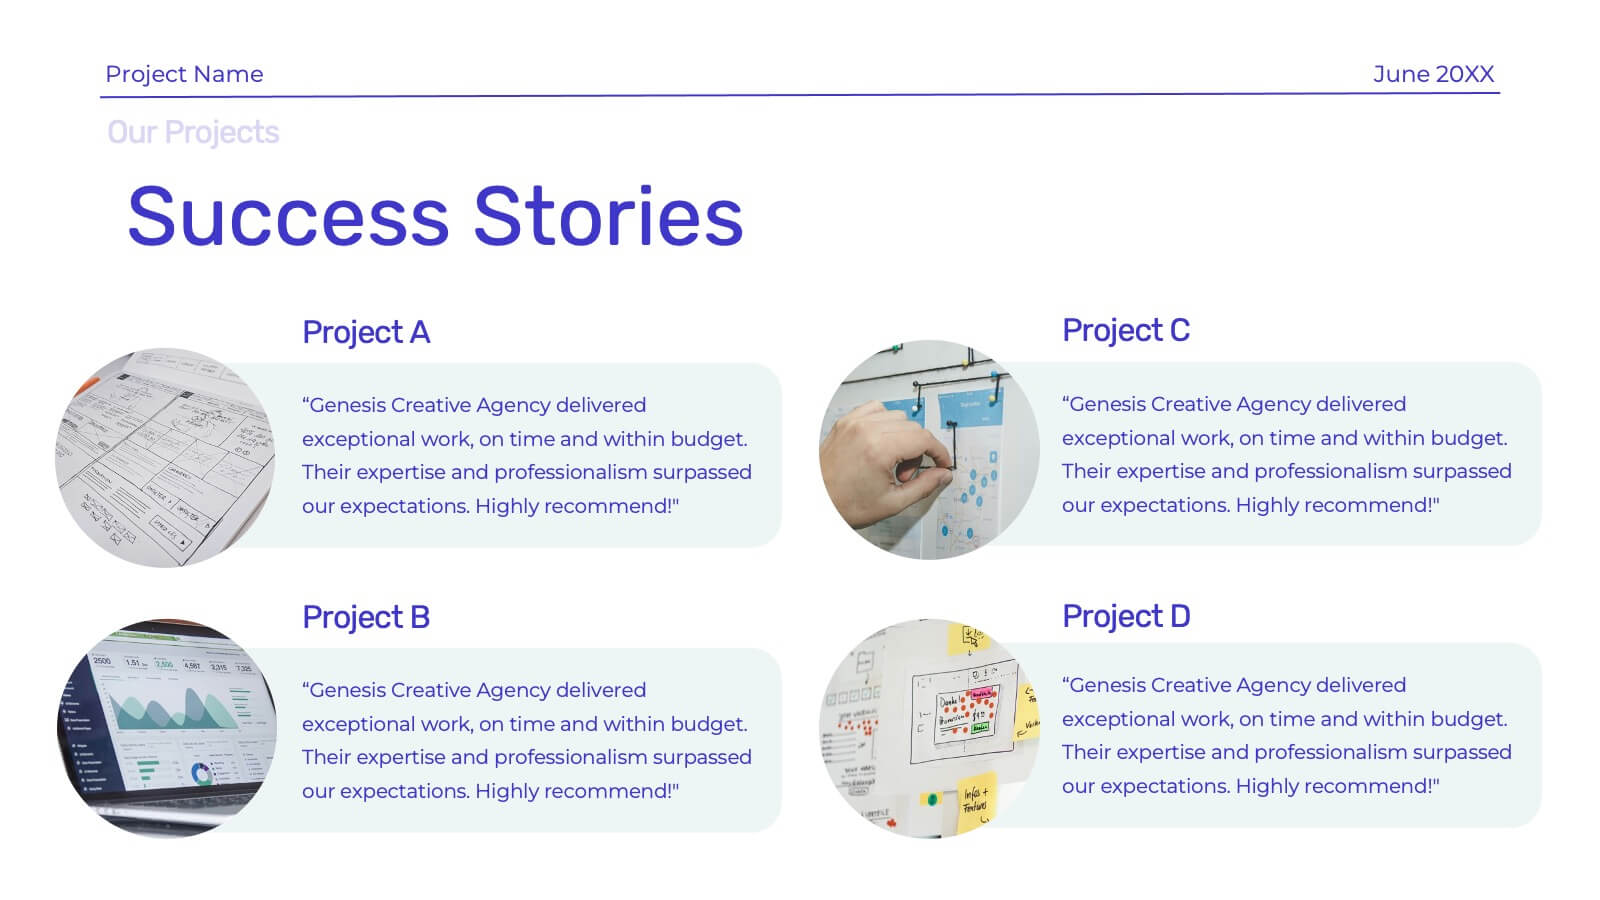
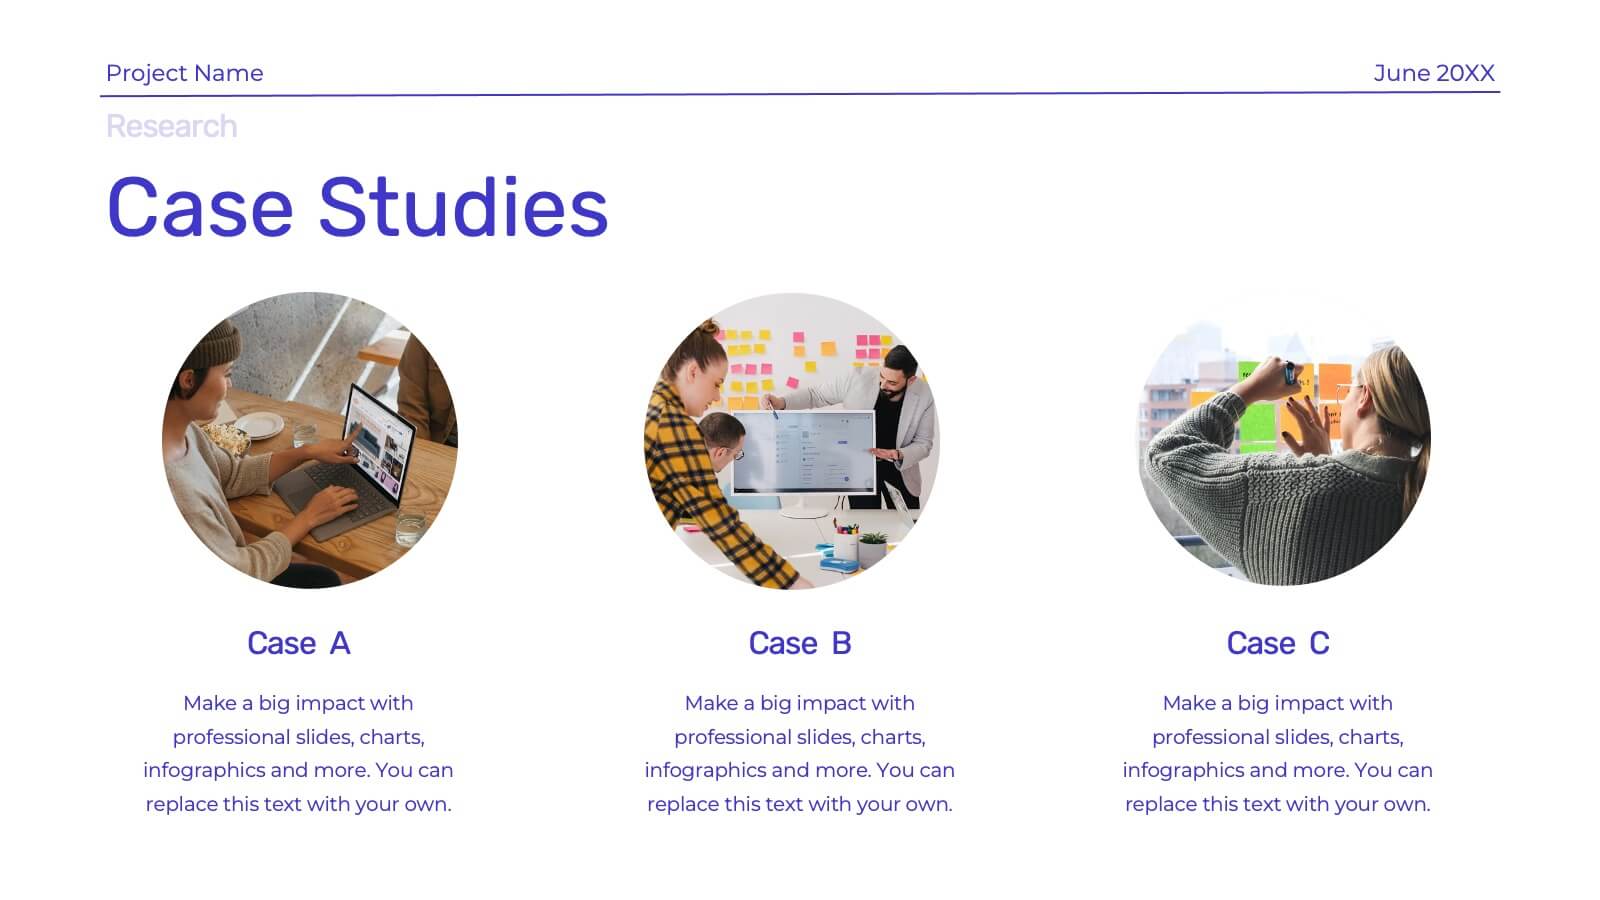
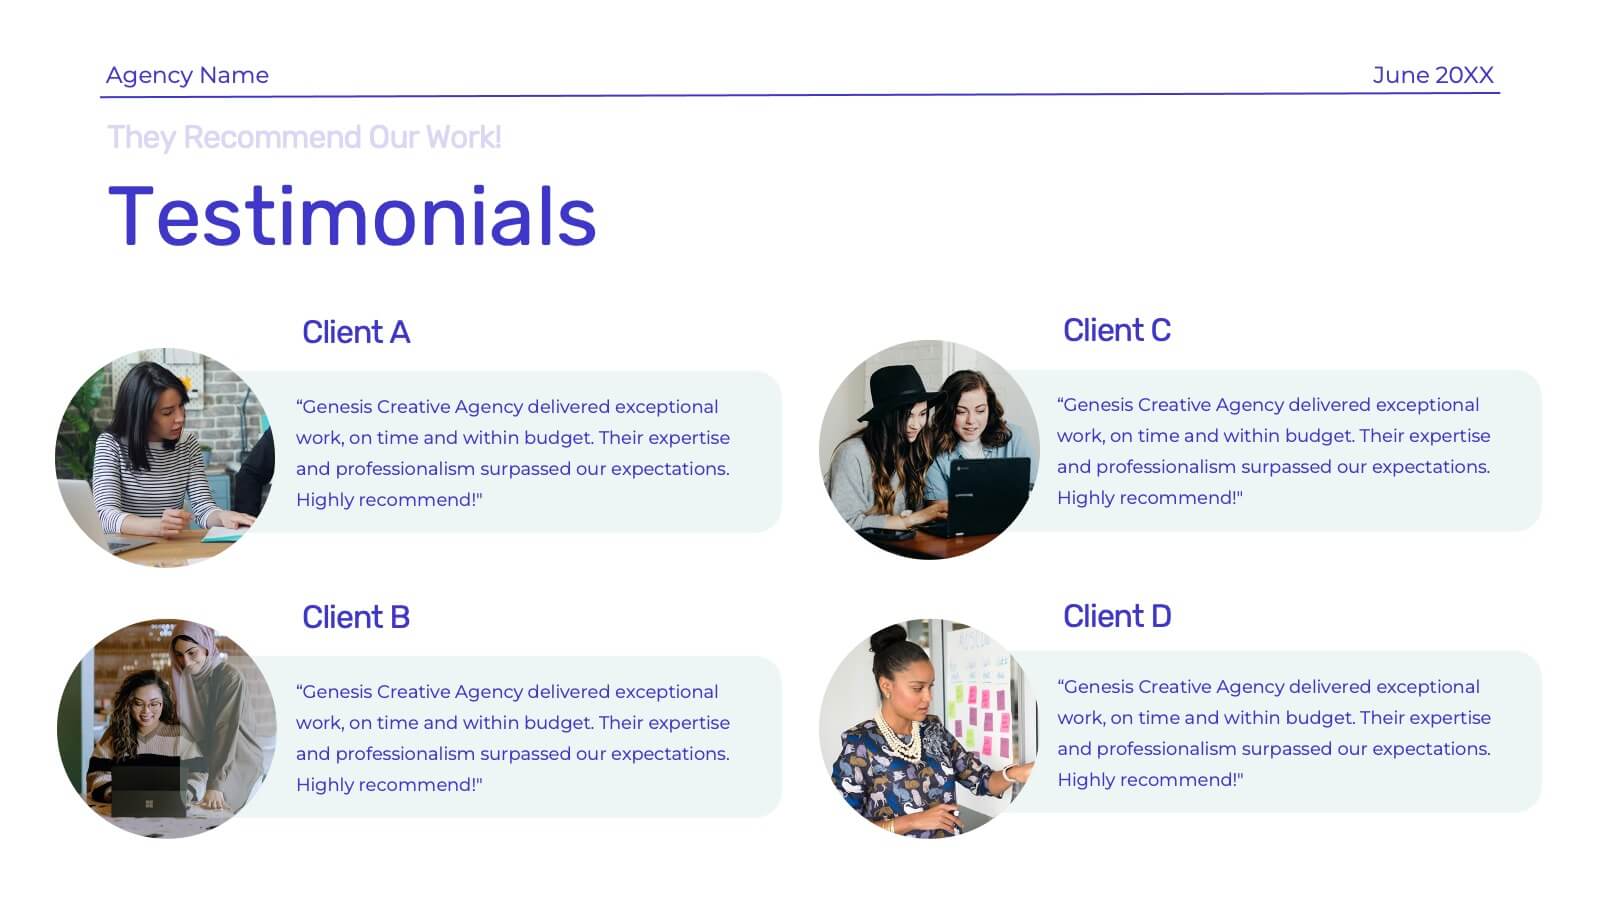
Genesis Creative Agency Pitch Deck Presentation
Showcase your creative agency’s strengths with this vibrant template. Highlight your team, services, success stories, and unique approach. Ideal for case studies, market analysis, and campaign execution. Fully compatible with PowerPoint, Keynote, and Google Slides.


10 slides
AI Impact on Business and Innovation Presentation
Deliver insights with precision using this data-driven presentation template tailored for machine learning, AI, and analytics topics. Featuring a central hub-and-spoke design, this layout allows you to showcase key components like algorithms, tools, processes, or data sources. Each segment includes clean icons and customizable titles for seamless editing. Ideal for data scientists, tech professionals, and academic presentations. Fully editable in PowerPoint, Keynote, and Google Slides.


6 slides
Lean Six Sigma Workflow Steps Presentation
Present the DMAIC cycle with clarity using this Lean Six Sigma workflow template. Each step—Define, Measure, Analyze, Improve, Control—is highlighted with sleek visuals and editable content blocks. Ideal for operations teams, quality experts, and consultants. Customize seamlessly in PowerPoint, Keynote, or Google Slides to fit your process presentations.


5 slides
Sales and Revenue KPI Snapshot Presentation
Present your top metrics with this clean Sales and Revenue KPI Snapshot slide. Display up to four key performance indicators using icons, percentage bars, and customizable labels. Ideal for business reviews, marketing updates, and executive dashboards. Fully editable in PowerPoint, Keynote, and Google Slides for seamless integration.


22 slides
Bona Advertising Agency Proposal Presentation
Present your agency’s vision with confidence using this sleek advertising proposal template. It covers everything from market analysis and strategy development to campaign execution and client testimonials. Ideal for securing new partnerships, it’s compatible with PowerPoint, Keynote, and Google Slides for a polished, professional presentation.


6 slides
Annual Budget Forecast Template Presentation
Plan smarter and present your financial goals with precision using this clean, data-driven layout. Designed to visualize yearly spending, savings, and projections, this template helps teams clearly communicate performance and future targets. Perfect for finance reports or business reviews, it’s fully compatible with PowerPoint, Keynote, and Google Slides for effortless customization.


26 slides
Beauty Products Company Profile Presentation
A beauty products company is a business that specializes in the development, manufacturing, marketing, and sale of various beauty and skincare products. This presentation template is designed to showcase your cosmetics and skincare brand in the most captivating and alluring way possible. With a blend of elegance and modernity, this template is your beauty brand's ticket to leaving a lasting impression on clients, investors, and partners. Fully customizable and compatible with Powerpoint, Keynote, and Google Slides. The sophisticated color palette will reflect the elegance of your beauty company.


3 slides
Workflow Optimization Flow Chart Presentation
Streamline your processes with this Workflow Optimization Flow Chart presentation. Designed to help teams identify inefficiencies, visualize task flows, and improve decision-making. Featuring clearly labeled paths and decision points, it's ideal for process audits, operations planning, or training sessions. Fully editable in PowerPoint, Canva, and Google Slides.


4 slides
Communication Model and Channels Presentation
Illustrate how your messages move through various channels using this clean, visual communication model slide. Ideal for team briefings, marketing workflows, or internal training, it simplifies how information is shared across platforms. Fully editable in Canva, PowerPoint, and Google Slides for seamless customization to match your branding and messaging goals.


3 slides
Cost-Benefit Analysis and Strategic Outcomes Presentation
Present trade-offs with clarity using the Cost-Benefit Analysis and Strategic Outcomes Presentation. Designed with visual balance scales and segmented callouts, this layout helps you compare investments versus returns, making complex decisions easier to explain. Ideal for proposals, audits, or business strategy reviews. Fully editable in PowerPoint, Keynote, and Google Slides.


6 slides
Employee Change Management Strategy Presentation
Communicate change with clarity using this structured, gear-themed presentation slide. Designed to visualize six strategic stages of employee transition, it's ideal for HR professionals, team leaders, and consultants managing organizational change. Each step is represented with a numbered circle and aligned text for easy guidance. Fully customizable in PowerPoint, Keynote, and Google Slides.


6 slides
Cloud Computing Basics Presentation
Bring clarity to the digital world with this sleek and modern template designed to explain online data systems and cloud structures. Perfect for showcasing storage models, connectivity, and IT workflows with simplicity and style. Fully editable and compatible with PowerPoint, Keynote, and Google Slides for seamless customization.