


Features
- 5 Unique slides
- Fully editable and easy to edit in Microsoft Powerpoint, Keynote and Google Slides
- 16:9 widescreen layout
- Clean and professional designs
- Export to JPG, PDF or send by email


Do you have any questions?
Recommend


7 slides
Team Member Overview Slide Presentation
Bring your team’s story to life with a clean, engaging layout that makes every role instantly clear. This presentation helps you introduce key members, outline responsibilities, and highlight individual strengths in a simple, structured way that’s easy for any audience to follow. Fully compatible with PowerPoint, Keynote, and Google Slides.


8 slides
Social Media Strategy Presentation
The "Social Media Strategy Presentation" template is designed to outline effective social media strategies using a clear, visually appealing layout. This template segments essential components of a social media plan into categorized blocks, each designated for a specific platform or strategy component such as Facebook, Instagram, Twitter, and TikTok. The design includes icons that visually represent each platform, enhancing readability and engagement. This layout is ideal for digital marketers, social media managers, or businesses presenting their social media plans internally or in client meetings, ensuring each segment of their strategy is communicated clearly and effectively.


7 slides
Harvey Ball Competitive Analysis Infographic
Enhance your competitive analysis presentations with our Harvey Ball Infographic, an excellent resource for business analysts, product managers, and market researchers. This infographic uses Harvey Balls to visually convey the comparison of product features or company services against competitors in the market. Our Harvey Ball Infographic offers a clear, comparative perspective of how different offerings stack up in key areas. It’s particularly useful for demonstrating product strengths, areas for improvement, and market positioning. With customizable Harvey Ball charts, you can reflect levels of completeness, satisfaction, or performance, allowing for an at-a-glance assessment that is both intuitive and impactful. This SEO-optimized infographic is tailored to make your competitive analysis resonate with stakeholders and decision-makers. Use this infographic to provide a snapshot of where your products or services stand in the competitive landscape, informing strategy and guiding development priorities.


4 slides
Butterfly Graph for Diverging Metrics Presentation
Easily compare opposing values with the Butterfly Graph for Diverging Metrics Presentation. Ideal for visualizing split opinions, pros vs. cons, or pre- and post-metrics across multiple categories. The clean, mirrored layout helps audiences grasp key differences at a glance. Compatible with PowerPoint, Google Slides, Canva, and Keynote.


7 slides
Success Team Work Infographic
Teamwork is the collaborative effort of a group of individuals, each contributing their diverse skills, knowledge, and experiences to achieve a common goal or complete a shared task. Our success teamwork infographic is an inspiring visual tool designed to showcase the art of collaborative achievement. Celebrate the collective triumphs of teamwork and highlight how unity and synergy lead to unparalleled success. Compatible with Powerpoint, Keynote, and Google Slides. This template encourages a culture of collaboration and showcases the magic that happens when individuals unite for a common purpose.


6 slides
Threat and Mitigation Bowtie Model Presentation
Clarify cause and consequence pathways with the Threat and Mitigation Bowtie Model Presentation. This template helps visualize risk sources, critical events, and mitigation strategies in a clear bowtie format. Ideal for incident analysis, safety reviews, and compliance reporting. Fully editable in PowerPoint, Keynote, and Google Slides.


7 slides
Concept Development for Great Ideas Presentation
Bring your ideas to life with the Concept Development for Great Ideas Presentation. This visually engaging layout features a central lightbulb icon surrounded by six customizable segments—ideal for breaking down key phases of ideation, planning, or innovation strategy. Clean, color-coded elements help guide your audience through your thought process. Compatible with Canva, PowerPoint, Keynote, and Google Slides.


20 slides
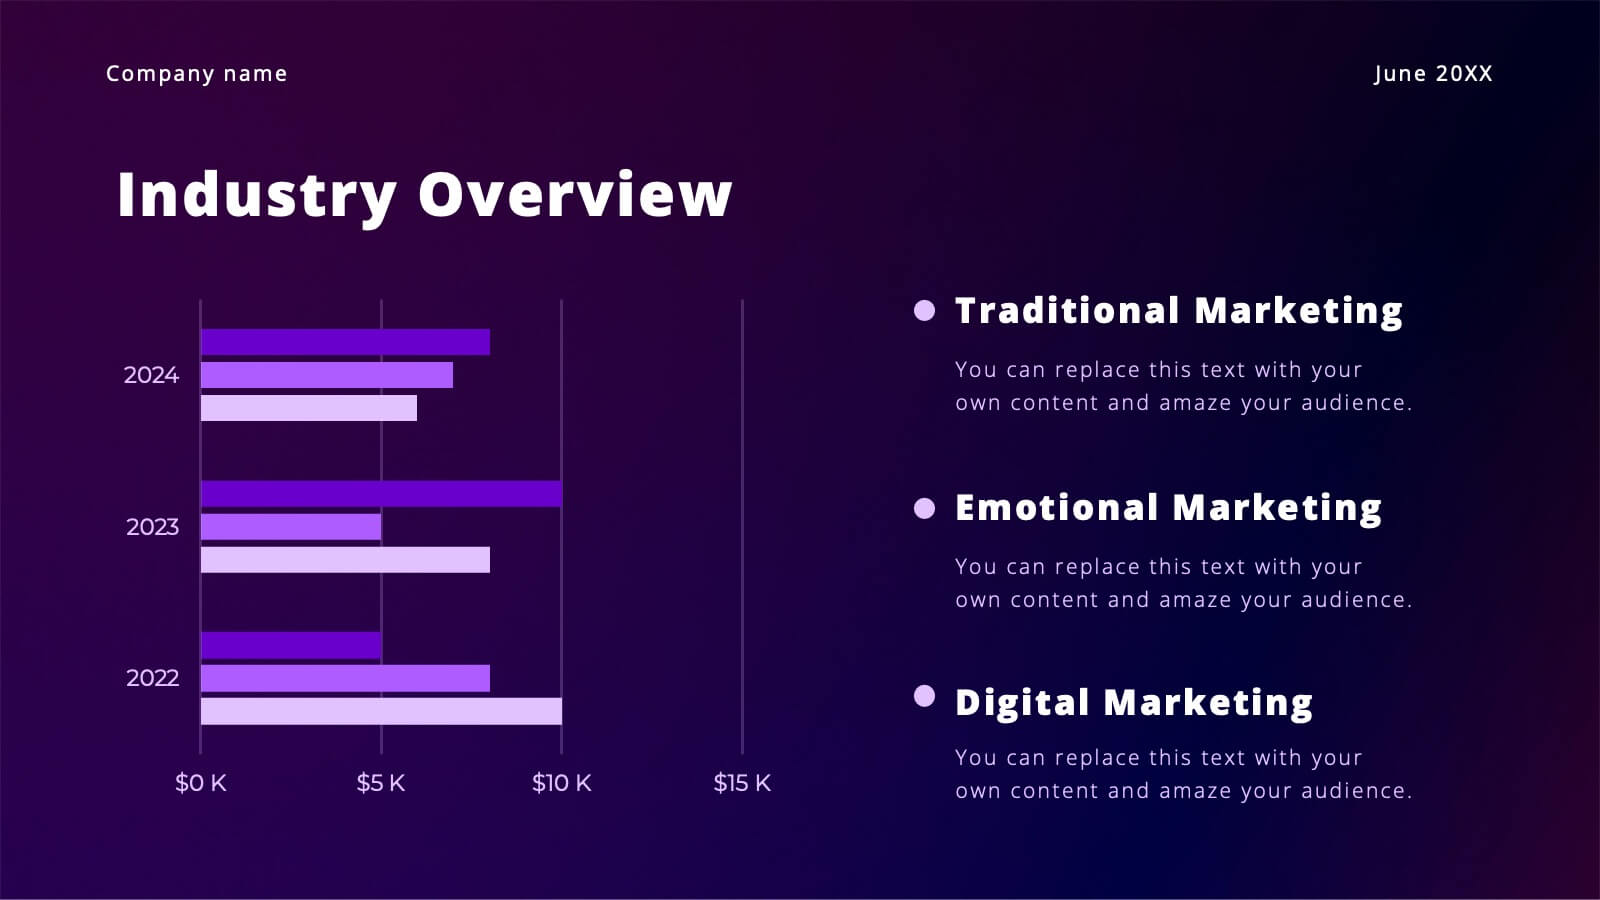
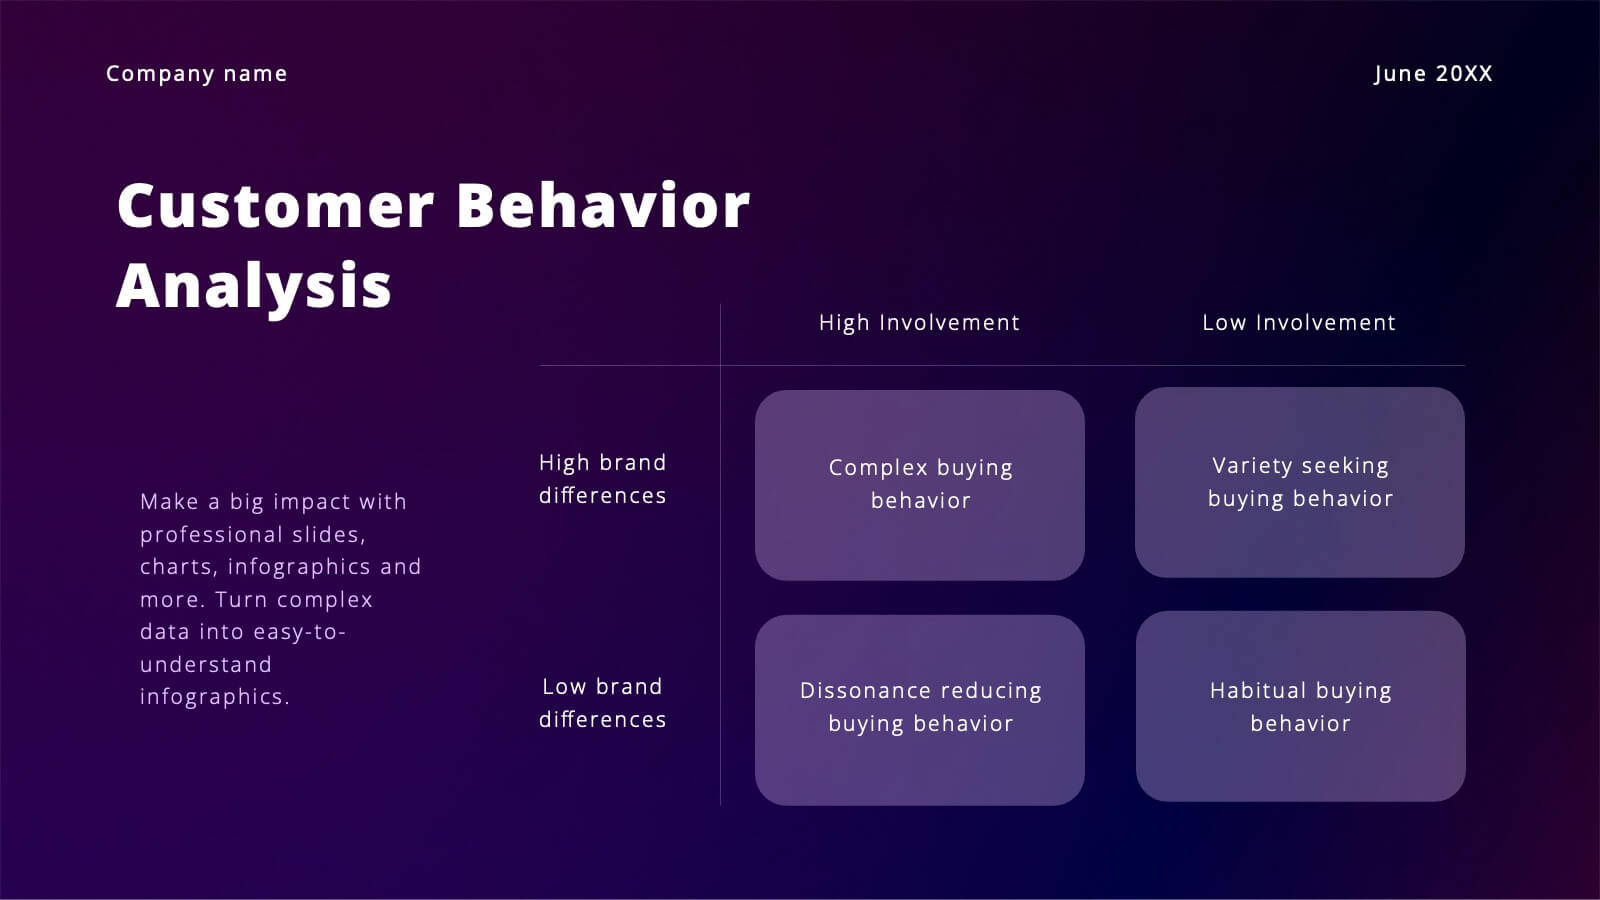
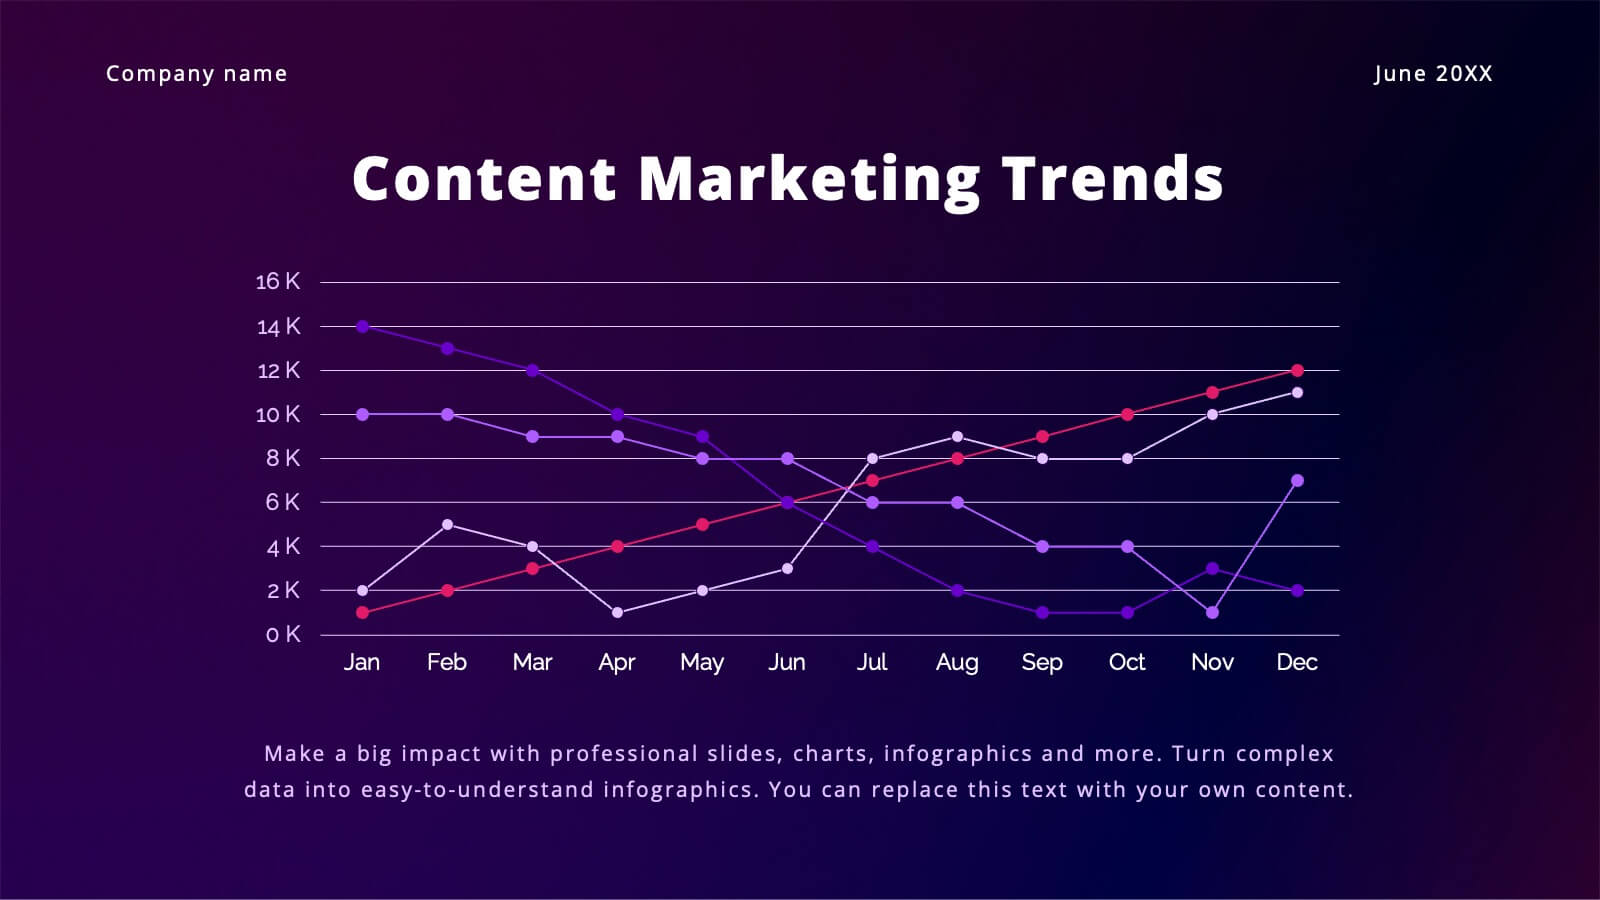
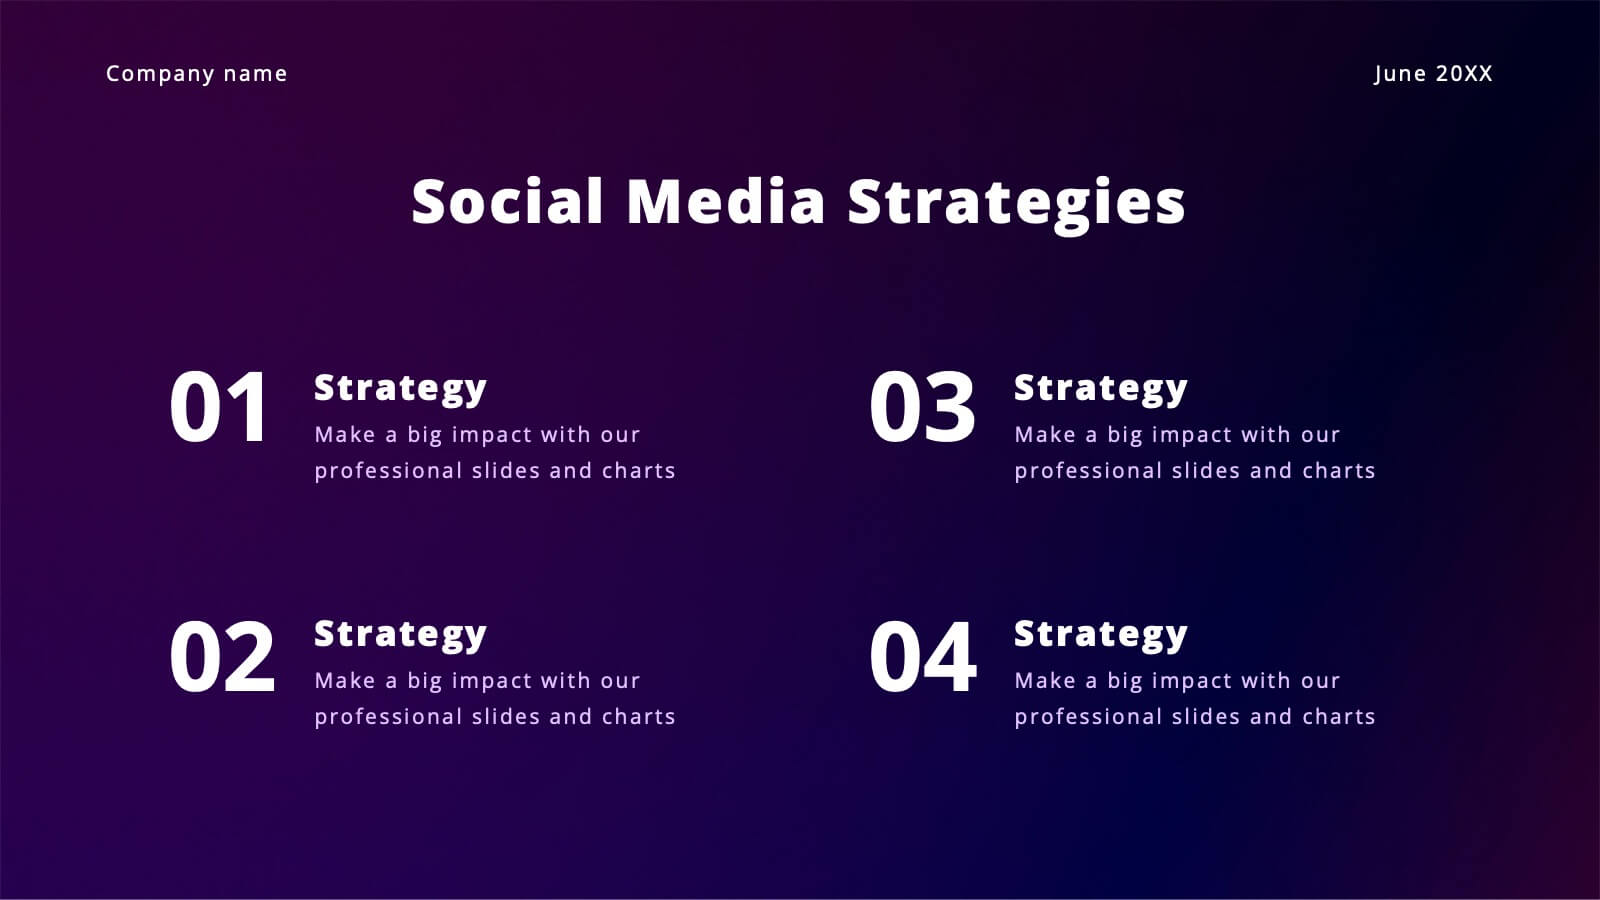
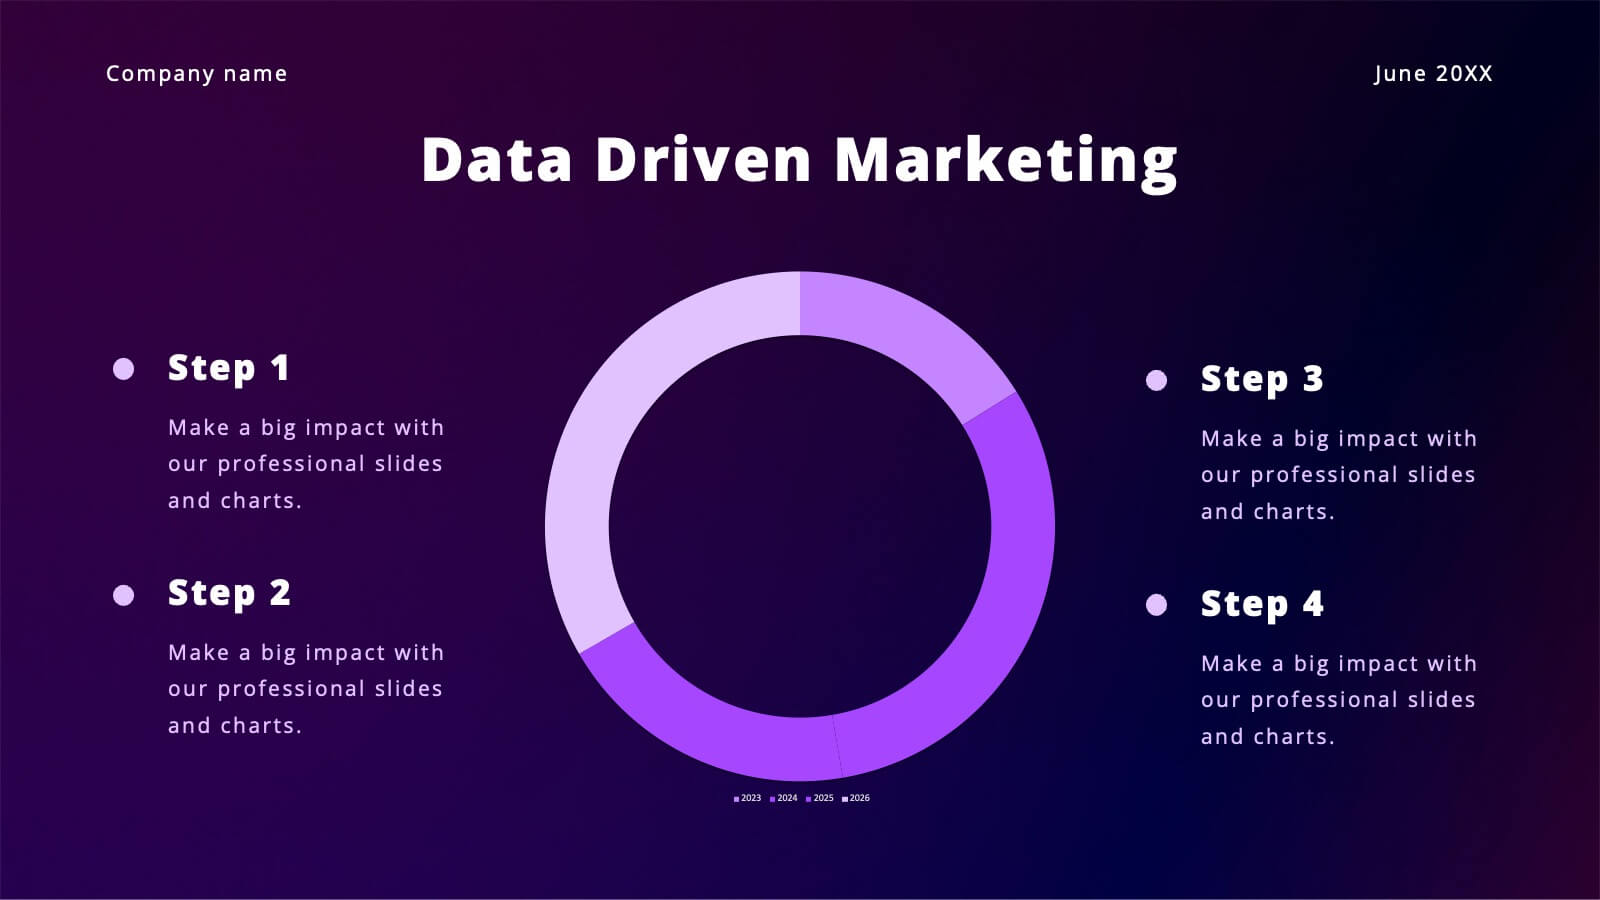
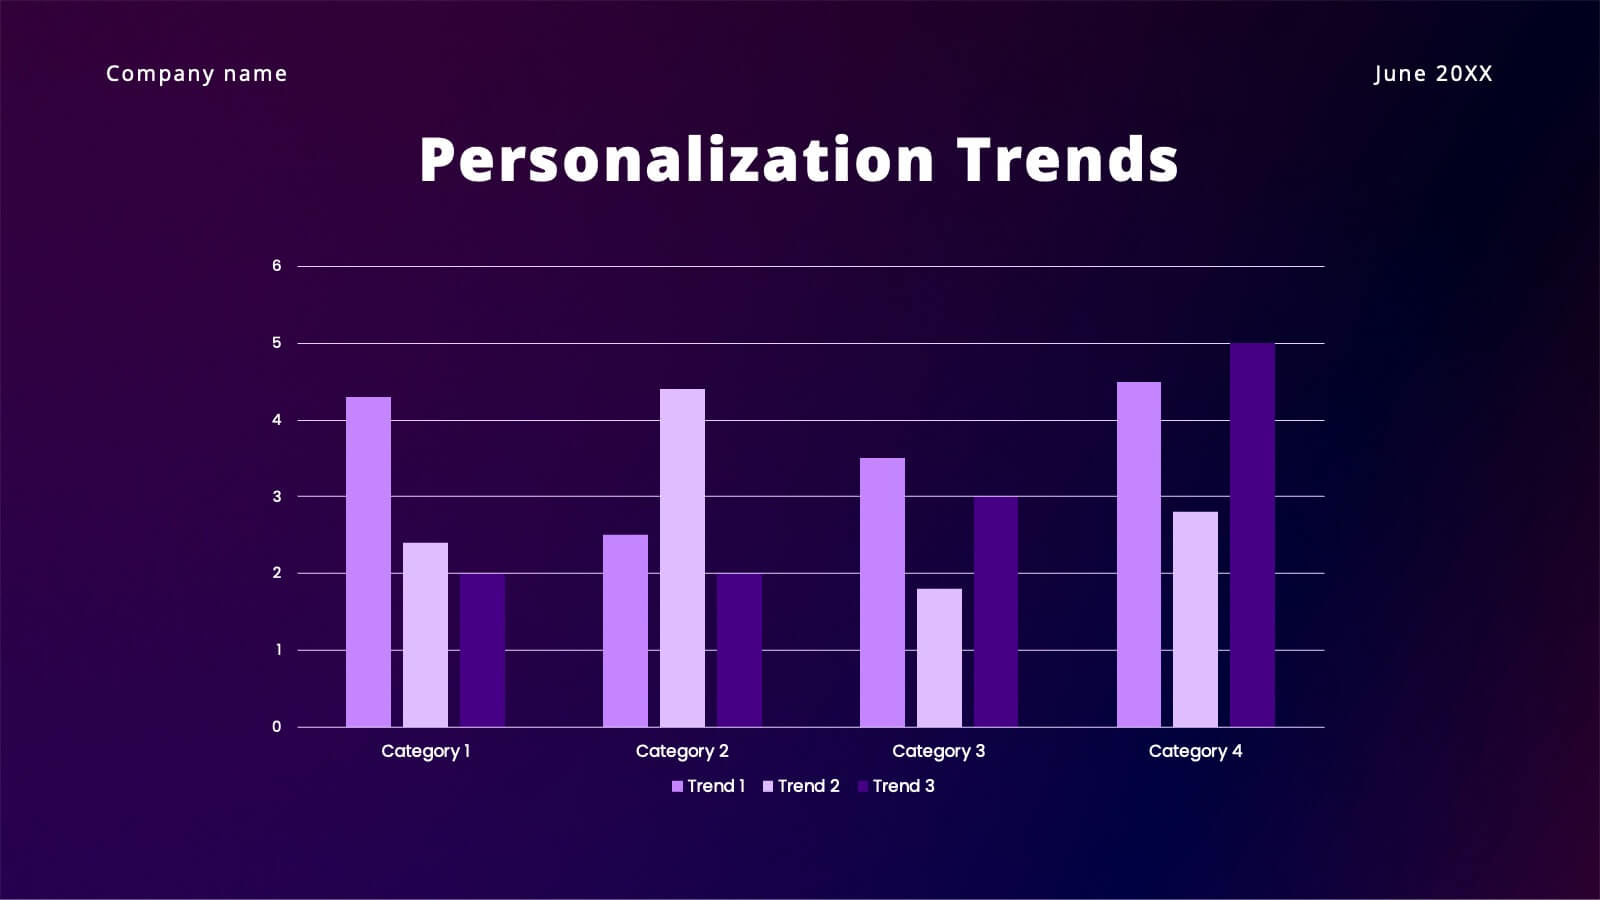
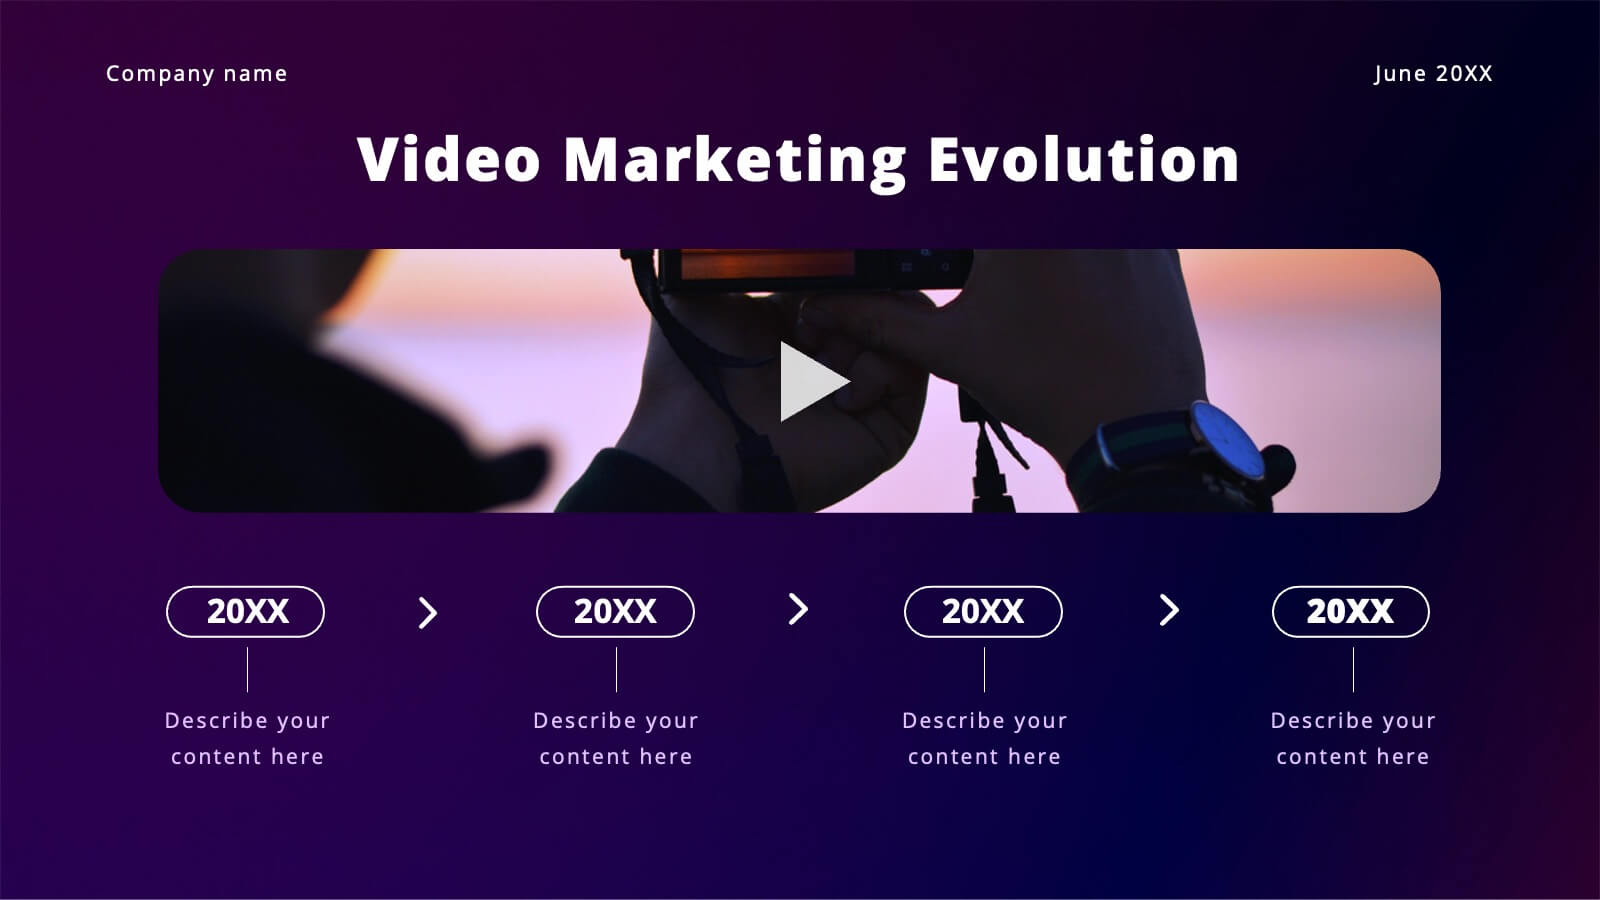
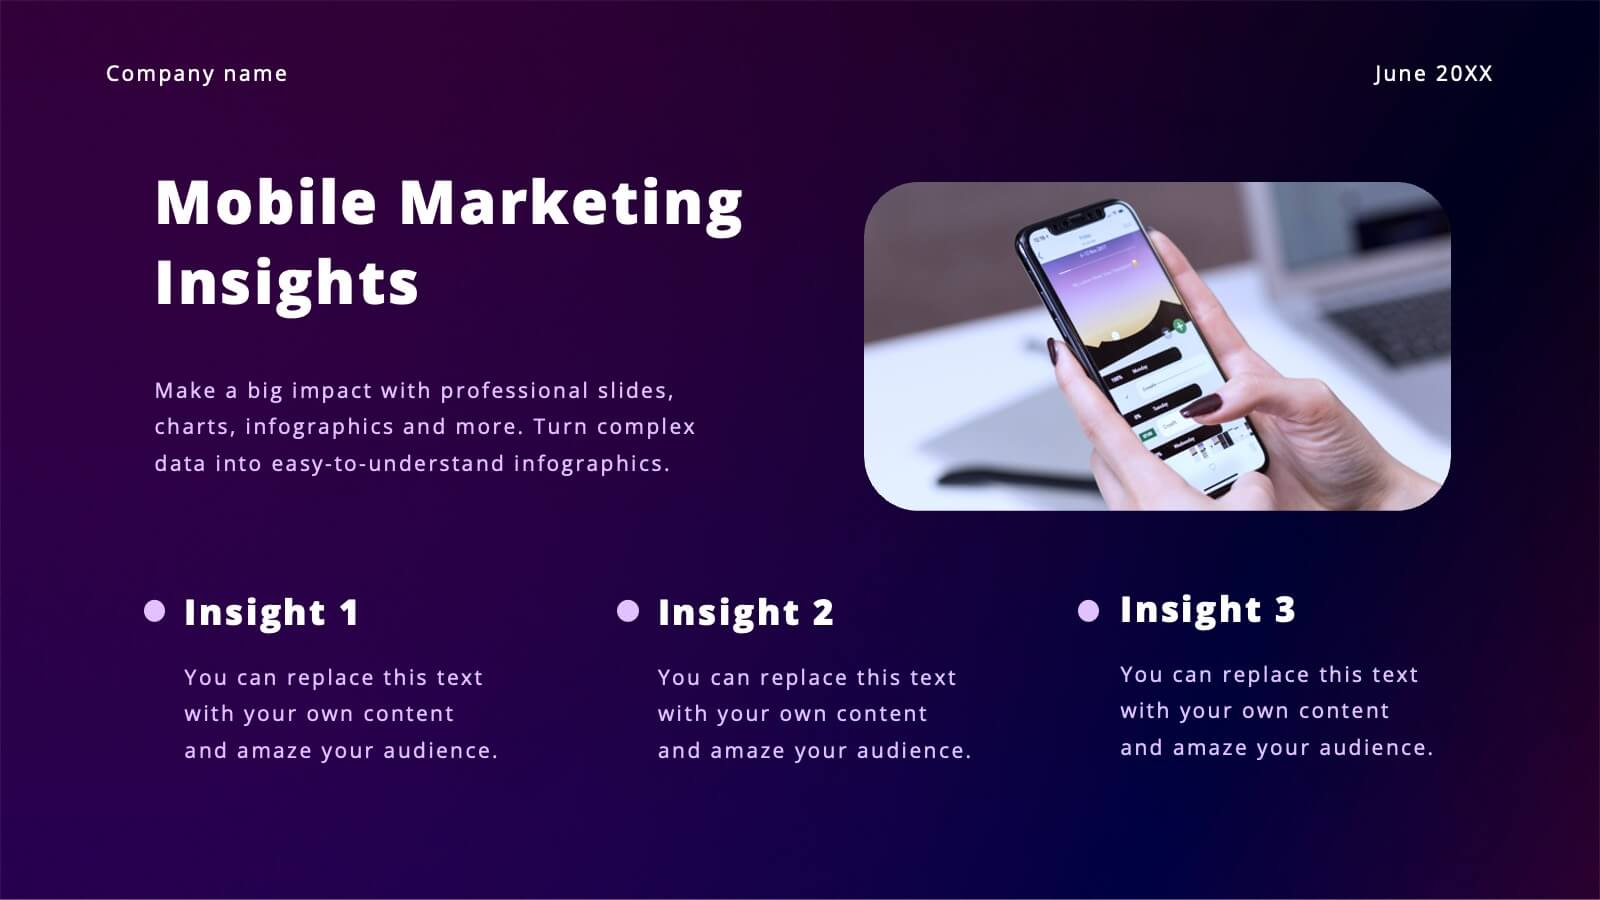
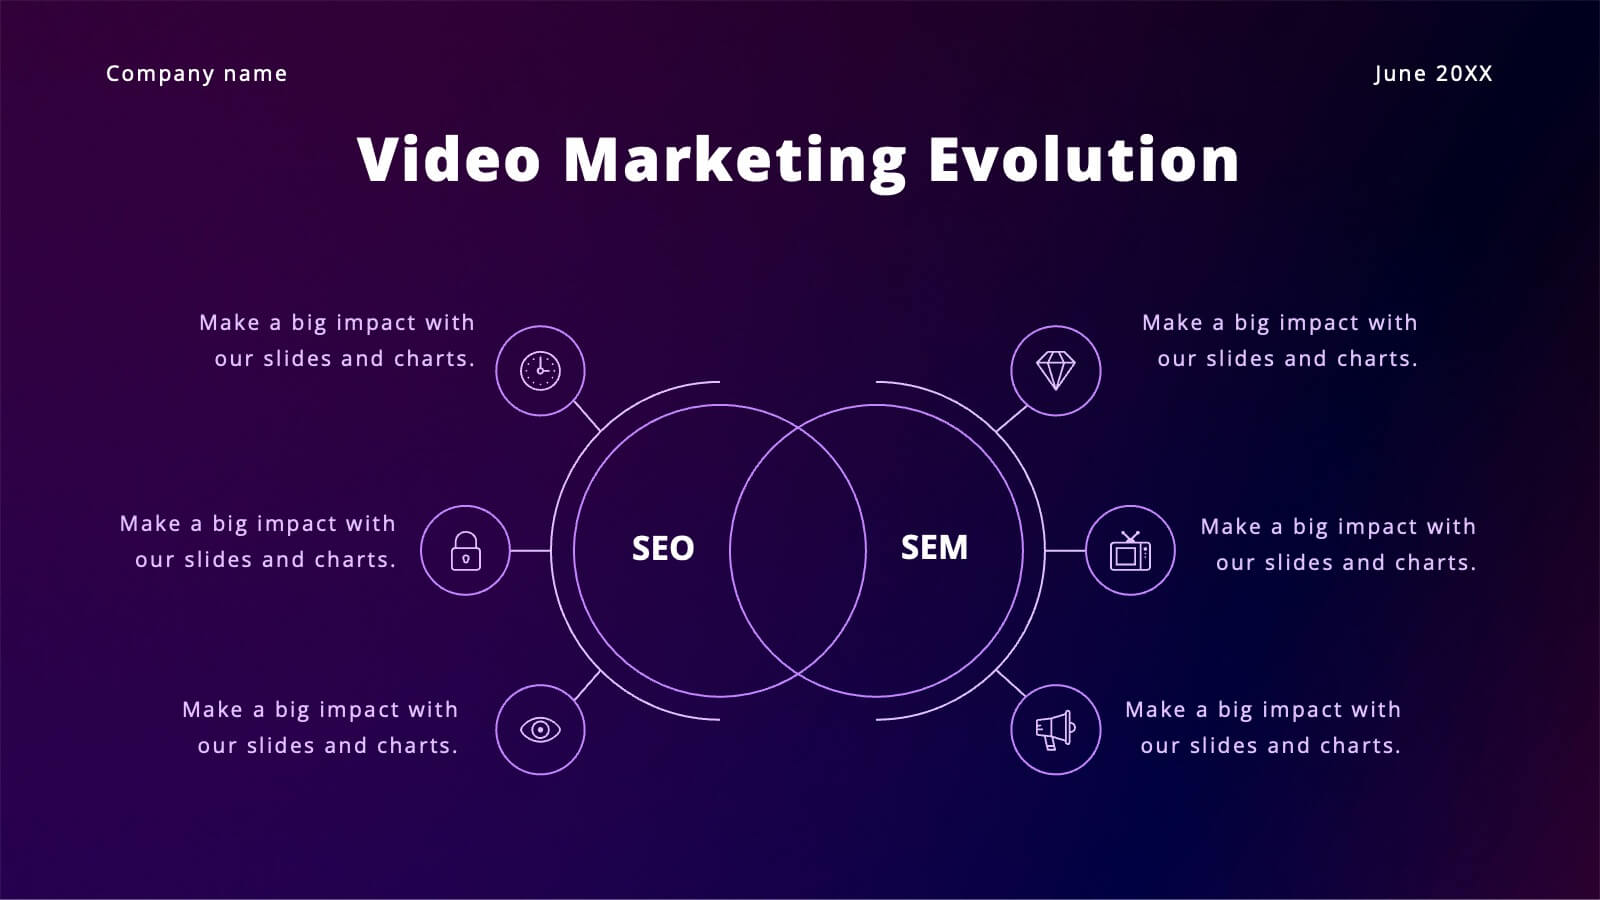
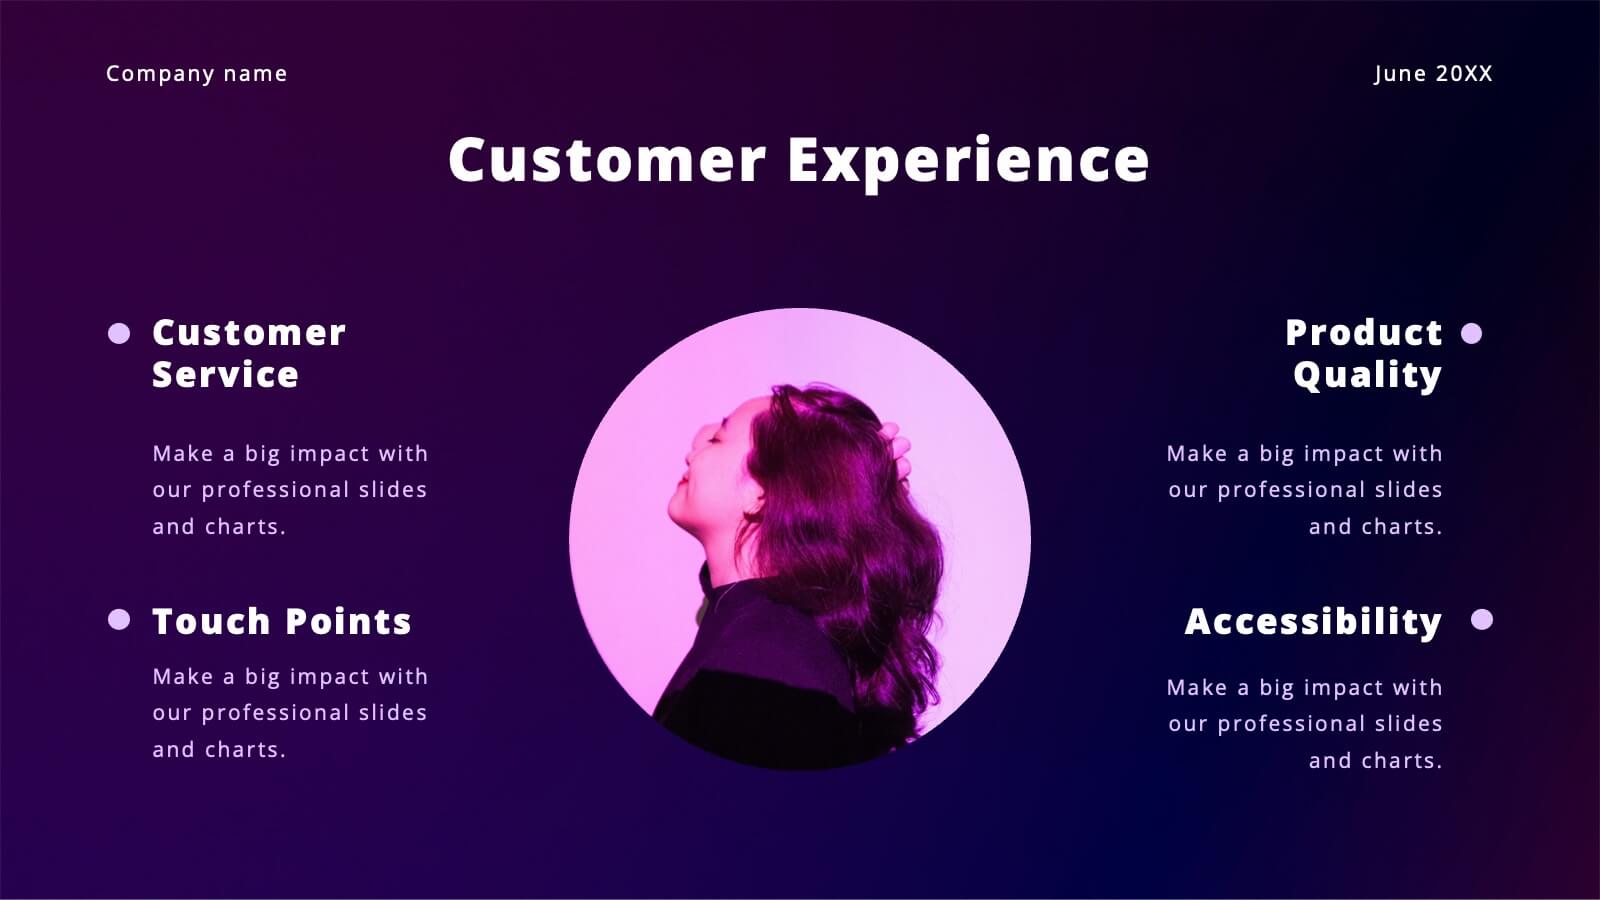
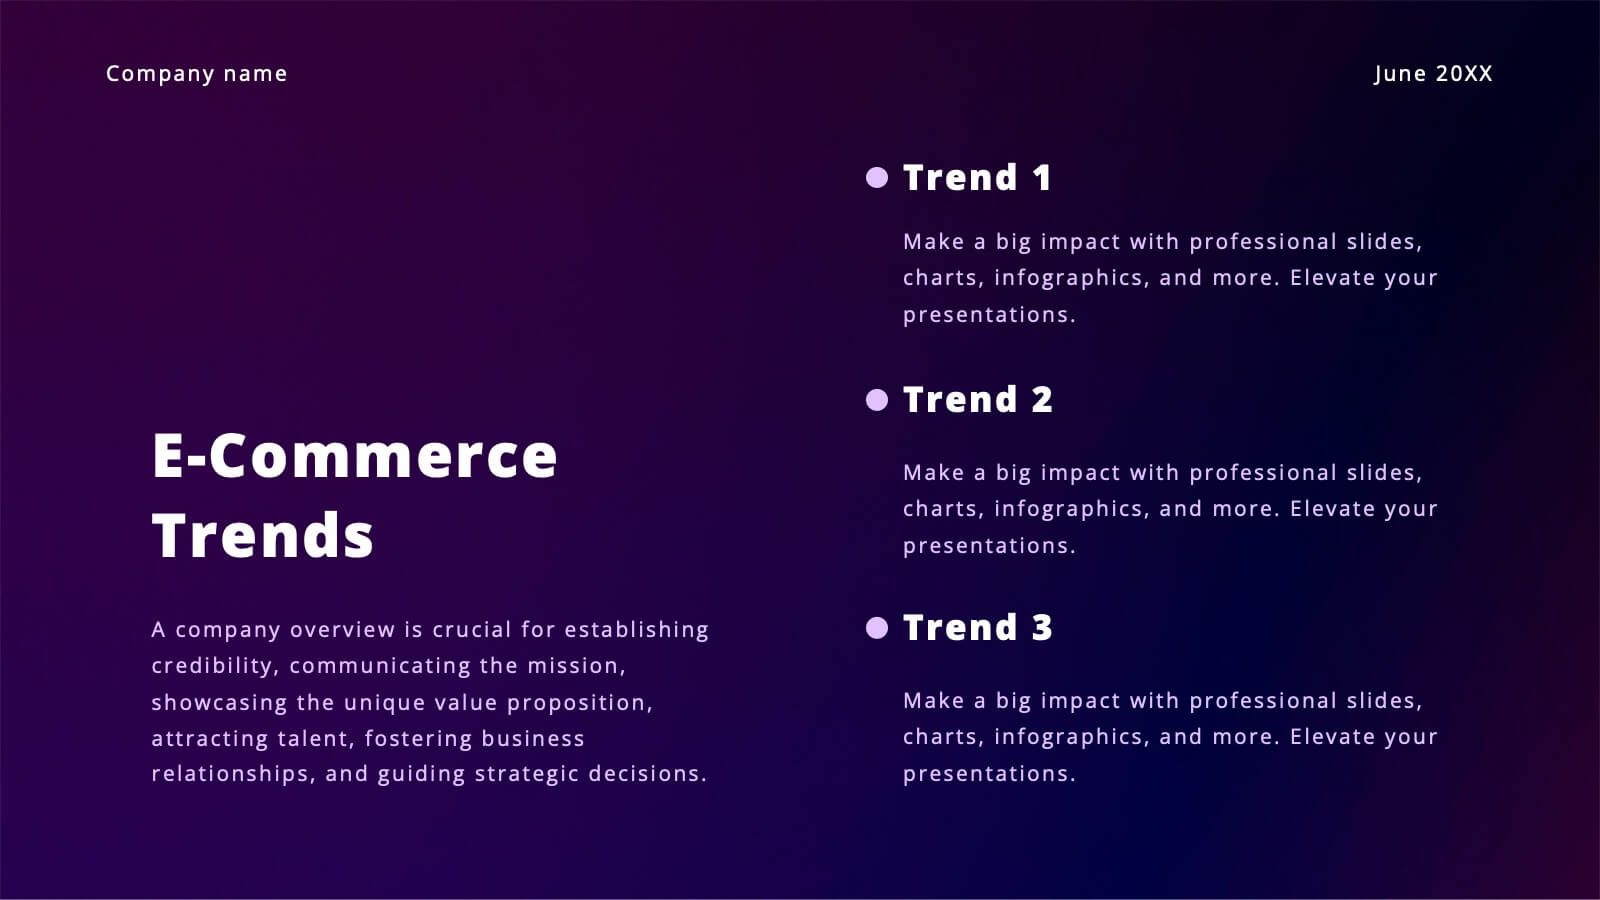
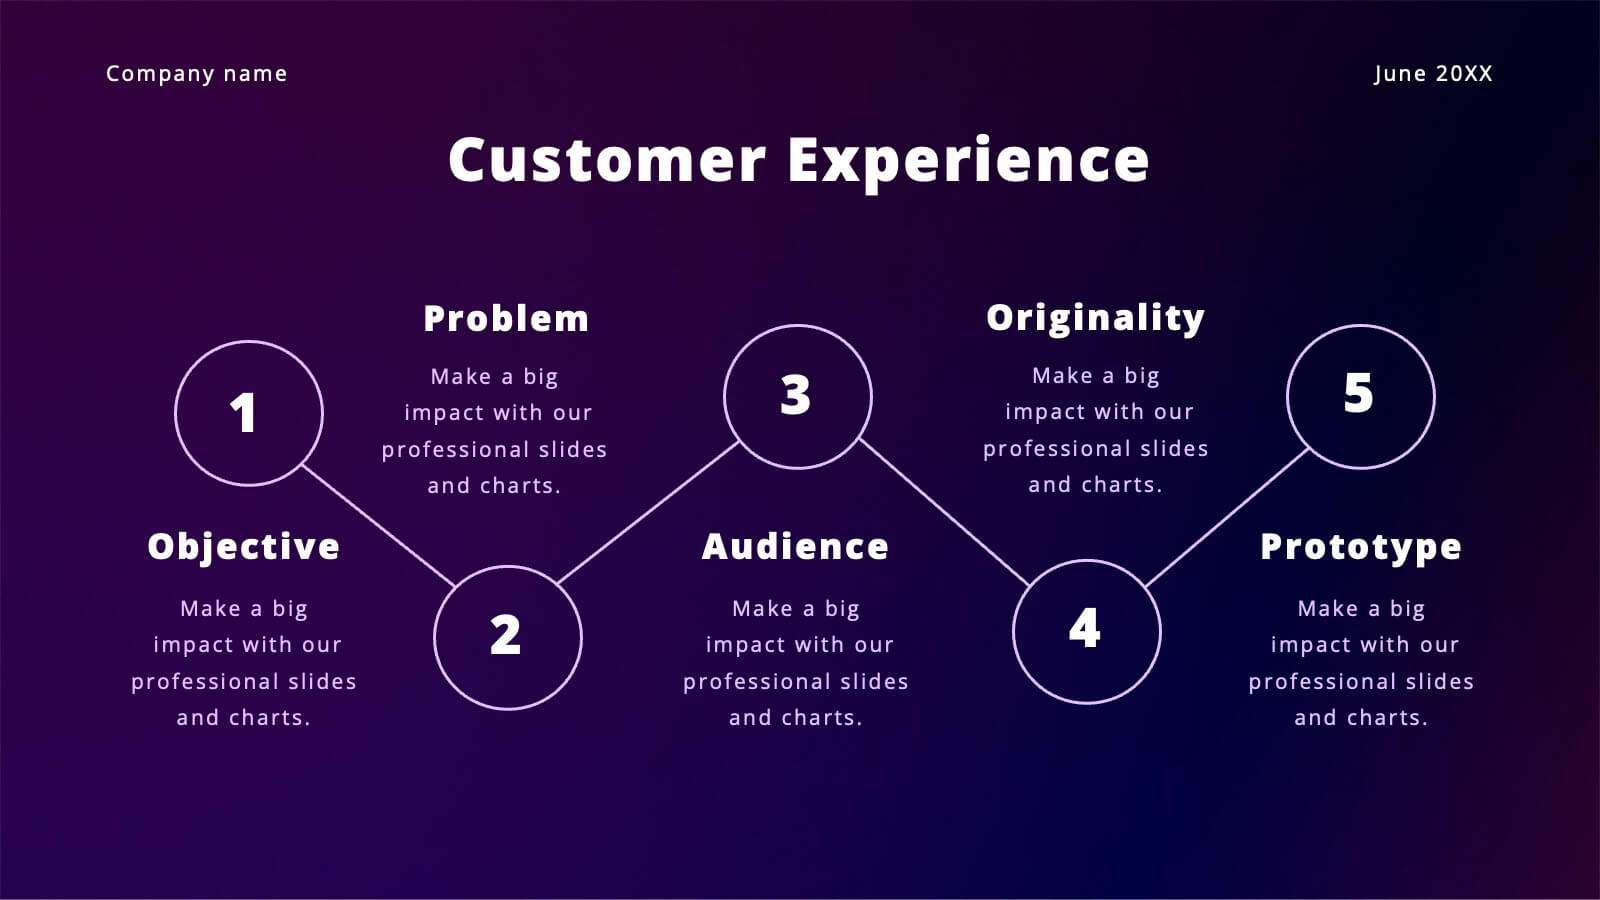
Vibrant Content Marketing Pitch Deck Presentation
Boost your marketing pitch with this vibrant deck! Covering industry overviews, customer behavior analysis, and emerging technologies, it’s designed to captivate your audience. Highlight social media strategies, data-driven marketing, and e-commerce trends effortlessly. Perfect for presenting a comprehensive marketing plan. Compatible with PowerPoint, Keynote, and Google Slides. Make your next pitch stand out!


6 slides
Unique Intersection Comparison Diagram
Illustrate complex relationships with clarity using the Unique Intersection Comparison Diagram Presentation. This visually engaging 5-circle diagram highlights overlaps and distinct points, ideal for showcasing cross-functional collaboration, multi-variable strategies, or layered comparisons. Each segment supports titles and brief text, making it perfect for business planning, product features, or audience segmentation. Fully editable in PowerPoint, Keynote, and Google Slides.


7 slides
Fishbone Diagram Infographic Presentation Template
A Fishbone diagram, also called a cause-and-effect diagram, is a tool used to identify and analyze the potential causes of a particular problem or issue. It is named for its shape, which looks like a fish skeleton with the problem or effect as the head and the various causes as the bones. This template includes a variety of different fishbone diagrams, which are representations of fish skeletons that help show you the different causes of a problem. This template is easy to use and you can add your own information to make it look just how you want, and show how different causes are connected.


5 slides
Political Campaign Marketing Infographics
A political campaign is a strategic effort undertaken by individuals, political parties, or interest groups to influence public opinion and win the support of voters during elections or on specific policy issues. These vertical infographics are designed to assist political candidates, campaign managers, and political organizations in effectively conveying their messages and strategies to the public. This template is ideal for political campaigns seeking to engage voters, raise awareness about their platform, and showcase their marketing efforts. The template utilizes eye-catching infographics to present campaign statistics, polling data, and performance metrics.


6 slides
Customer Feedback Infographic
Customer feedback refers to the opinions, comments, suggestions, and insights provided by customers about their experiences with a product, service, or company. This infographic template visually presents key insights and strategies for collecting and utilizing customer feedback effectively. This infographic will help you provide essential information for businesses to understand how customers perceive their offerings and how they can improve to better meet customer needs and expectations. The visual elements and a well-structured design will make the presentation engaging and accessible.


6 slides
Governance Structure Overview Presentation
A clear, polished flow of ideas makes this slide instantly engaging, guiding viewers through each essential component with ease. This presentation explains how an organization structures oversight, responsibilities, and decision-making to ensure accountability and performance. Clean icons and balanced spacing keep everything easy to follow. Fully compatible with PowerPoint, Keynote, and Google Slides.


10 slides
Body System Educational Overview Presentation
Dive into anatomy with a slide that makes learning the human body visual, clear, and interactive. This educational overview breaks down key body systems into simple, labeled sections—perfect for classroom teaching, medical training, or health awareness campaigns. Fully editable and compatible with PowerPoint, Keynote, and Google Slides for seamless customization.


7 slides
North America Language Map Infographic
Embark on a visual odyssey across the vast terrains of North America with our expertly crafted map infographic. Painted in the expansive blue, the lush green, the vibrant yellow, and the warm orange, our template captures the essence of North America's diverse geographies and cultures. Adorned with accurate infographics, distinct icons, and region-specific image placeholders, it provides a panoramic view of the continent's multifaceted landscape. Flawlessly tailored for Powerpoint, Keynote, or Google Slides. An indispensable tool for educators, travelers, geographers, or businesses targeting the North American market. Navigate with purpose; let every slide be a step into North America's captivating expanse.


8 slides
Business Competitive Analysis
Break down your market strategy into clear, actionable steps with this streamlined analysis slide. Featuring an 8-step horizontal layout with bold icons and color-coded segments, it helps visualize competitive research and planning at a glance. Easily customizable in PowerPoint, Keynote, and Google Slides.


7 slides
Creative Tree Diagram Infographic
Unveil hierarchical structures or processes with our evocative tree diagram infographic. Set against a pristine white canvas and enriched with shades of trusty blue and organic green, this creative template epitomizes growth, interconnections, and systematic understanding. Embellished with crisp infographics, intuitive icons, and illustrative image placeholders, it effortlessly visualizes layered information. Perfectly tailored for Powerpoint, Keynote, or Google Slides. An indispensable resource for project managers, educators, business analysts, or any organization aiming to display branching information or decisions. Grow with clarity; let each slide branch out into a wealth of understanding.