


Features
- 3 Unique slides
- Fully editable and easy to edit in Microsoft Powerpoint, Keynote and Google Slides
- 16:9 widescreen layout
- Clean and professional designs
- Export to JPG, PDF or send by email


Do you have any questions?
Recommend


21 slides
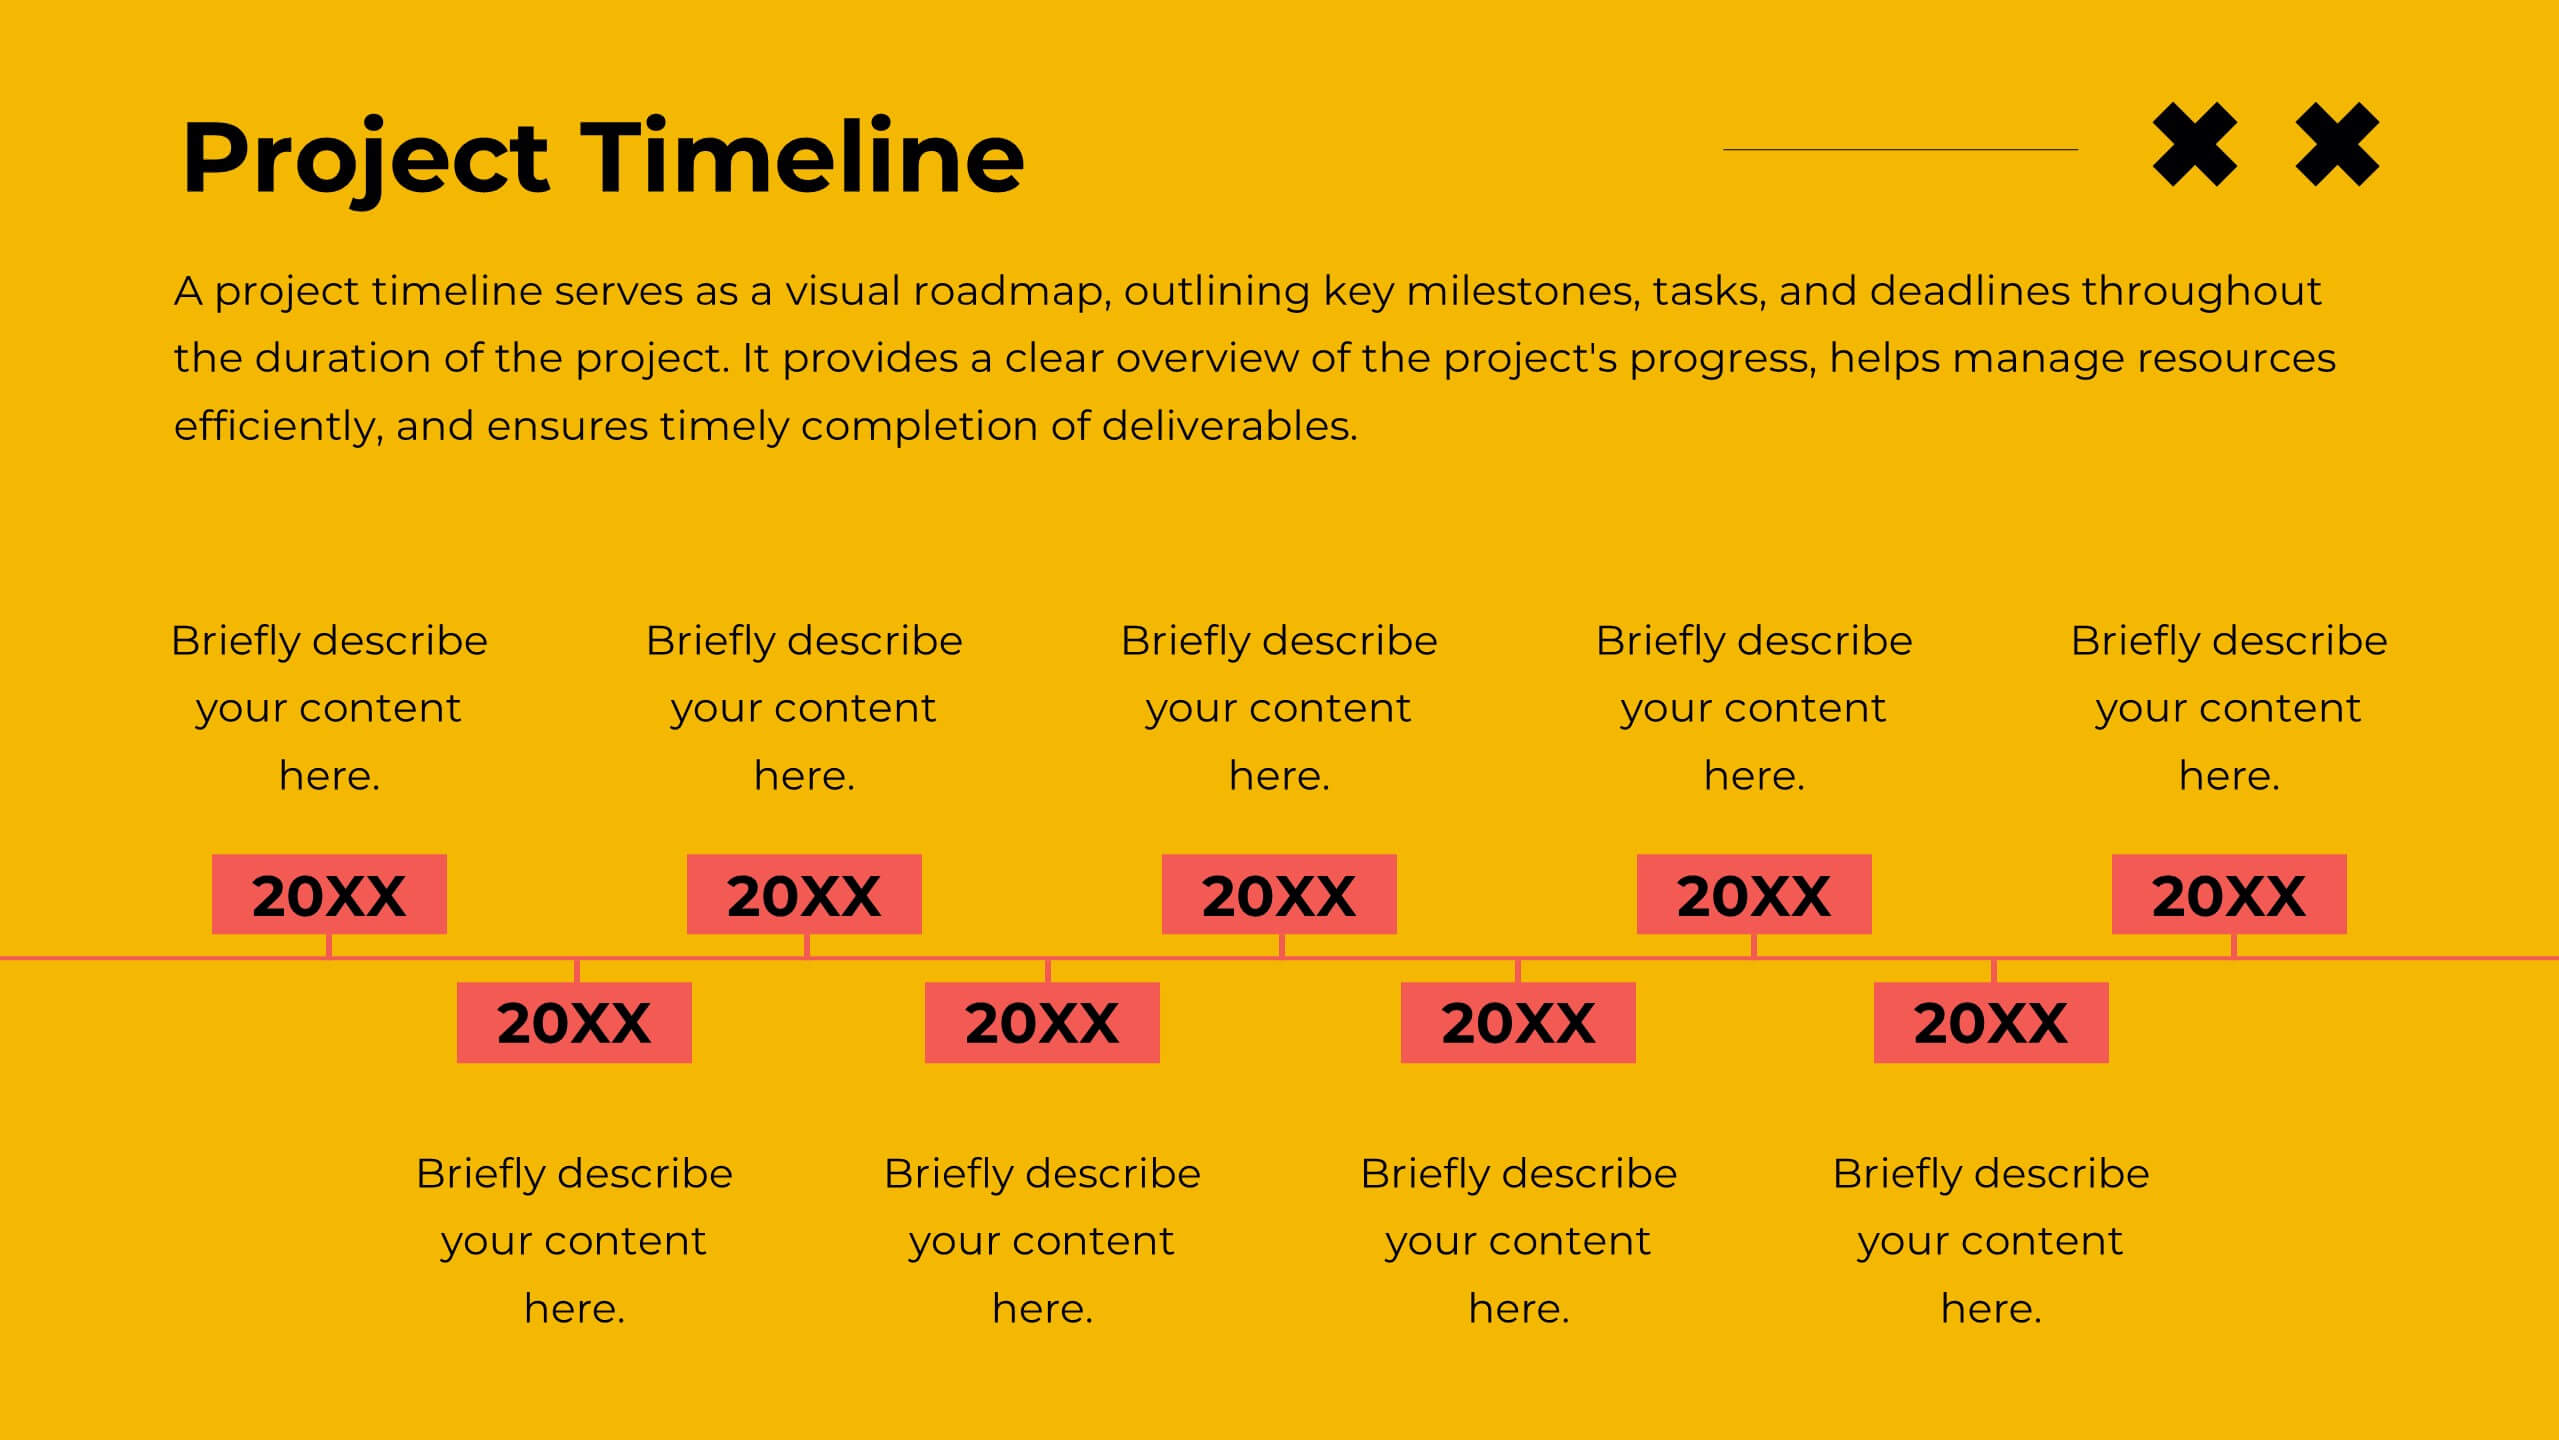
Oslo Design Strategy Proposal Presentation
This design strategy proposal template is tailored to present your creative process with bold colors and clean layouts. It includes sections like overview, design brief, concept development, design process, mood board, and project timeline, giving you a comprehensive structure for showcasing your approach. Compatible with PowerPoint, Keynote, and Google Slides, it ensures seamless presentations.


2 slides
Professional Thank You Slide Presentation
End your presentation with a clean, modern slide that leaves a polished final impression. This layout gives you space to share closing notes, contact details, or key reminders in a clear and visually balanced style. Fully editable and compatible with PowerPoint, Keynote, and Google Slides.


4 slides
Patient Care Plan and Metrics Presentation
Turn healthcare data into meaningful stories with this modern and professional presentation. Perfect for highlighting patient progress, clinical outcomes, and care efficiency, it balances visuals and data for clarity and impact. Easy to edit and fully compatible with PowerPoint, Keynote, and Google Slides for smooth customization.


4 slides
Colorful Workflow Process Chart Presentation
Bring your workflow to life with a vibrant, easy-to-follow layout that makes every stage feel connected and purposeful. This presentation helps you map processes, explain team roles, and simplify complex steps using a clean, visual flow. Fully compatible with PowerPoint, Keynote, and Google Slides.


5 slides
Meal Plan and Nutrition Guide Presentation
Simplify your nutrition strategy with the Meal Plan and Nutrition Guide Presentation. This visually engaging circular layout lets you outline five key nutrition pillars or daily meals with icons and editable titles. Ideal for dietitians, wellness coaches, or health brands. Compatible with PowerPoint, Canva, and Google Slides for seamless customization.


7 slides
Professional Goals Infographic
Unfold the pathway to success with our professional goals infographic. Designed to help individuals and organizations visualize and track their aspirations, this infographic offers a comprehensive look at professional milestones and strategies to achieve them. The primary palette revolves around a pristine white backdrop, enhanced by accents of vibrant orange and a mix of complementary colors to distinguish different areas. Its design ensures seamless integration into PowerPoint, Keynote, or Google Slides presentations, transforming your professional goals discourse into a visually engaging experience.


6 slides
3D Diagram Slide Presentation
Bring your ideas to life with this modern 3D visual layout that adds depth and clarity to any concept. Ideal for breaking down complex information into four connected sections, it enhances understanding through visual hierarchy. Fully customizable and compatible with PowerPoint, Keynote, and Google Slides for effortless use.


6 slides
Market Research Case Study
Visualize your research findings with this step-by-step arrow-style case study slide. Ideal for outlining research methodology, key findings, and conclusions across six distinct phases. This layout is perfect for marketing reports, academic presentations, or business insights. Fully editable in PowerPoint, Keynote, and Google Slides.


4 slides
Buyer Persona and Market Segmentation Presentation
Visualize ideal customer types with this engaging buyer persona template. Showcase personality traits, goals, brand affinities, and bios in a stylish format with tropical-inspired accents. Ideal for market segmentation, branding, and campaign alignment. Fully editable in PowerPoint, Keynote, and Google Slides to match your marketing strategy and presentation tone.


5 slides
Business Opportunities Infographics
Business Opportunities refer to favorable circumstances or situations in the market that can be exploited to start a new business venture or expand an existing one. These infographic templates offers various business opportunities and potential areas for growth and success. It enables you to present market analysis, emerging trends, niche markets, global expansion opportunities, and other factors that entrepreneurs and businesses should consider. This template serves as a valuable resource for entrepreneurs, business professionals, consultants, and educators looking to explore new business possibilities or expand their existing ventures.


2 slides
Clean Cover Page Presentation
Start your presentation with a bold first impression using this sleek and minimalistic cover design. Perfect for business proposals, reports, or client pitches, this layout draws attention with clean typography and a strong visual hierarchy. Fully editable and easy to personalize in PowerPoint, Keynote, and Google Slides for smooth customization.


21 slides
Wyrm Marketing Strategy Plan Presentation
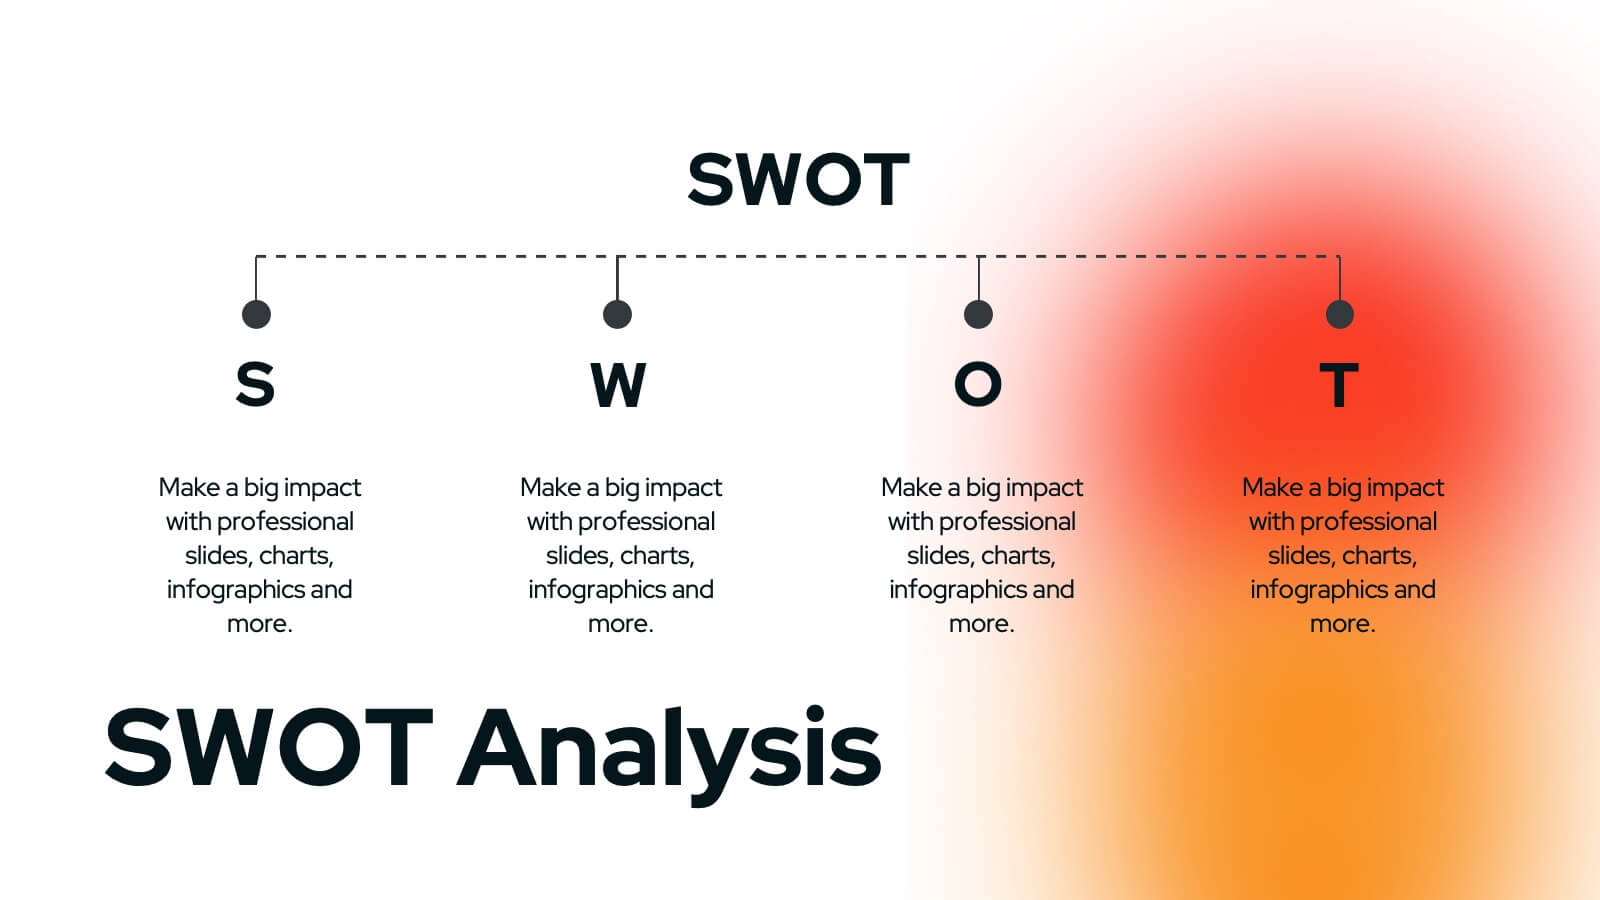
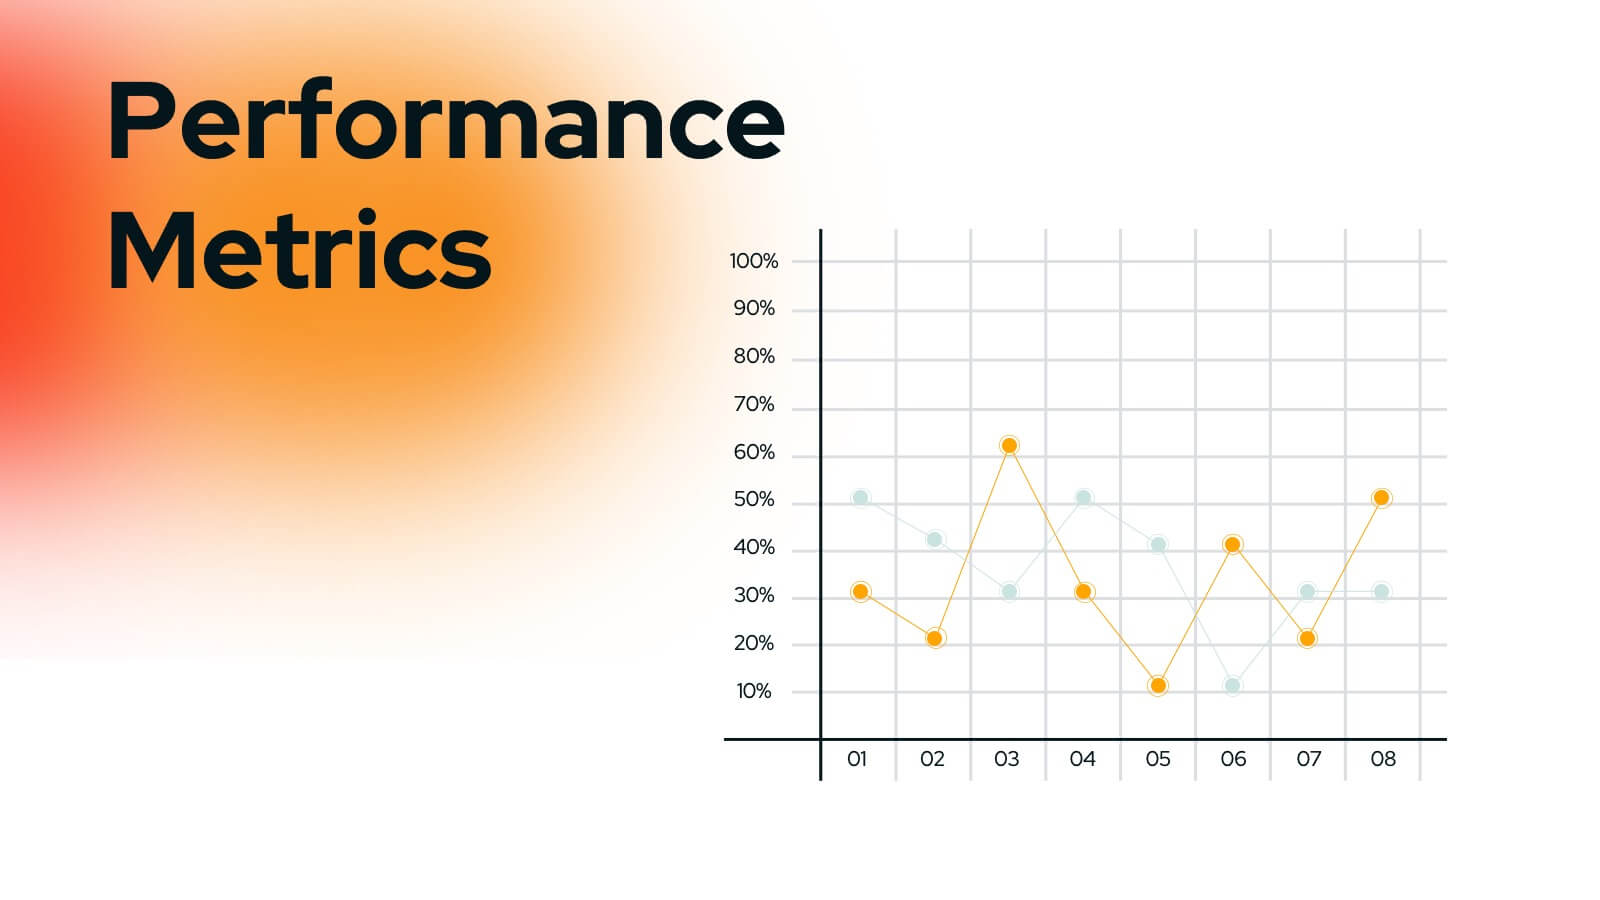
Unleash the power of your marketing strategy with this bold and dynamic presentation template! Perfect for covering everything from landscape analysis and target audience identification to performance metrics and risk management. This template helps guide your audience through key challenges, SWOT analysis, and strategic initiatives with clarity and impact. Compatible with PowerPoint, Keynote, and Google Slides for effortless and engaging presentations.

21 slides
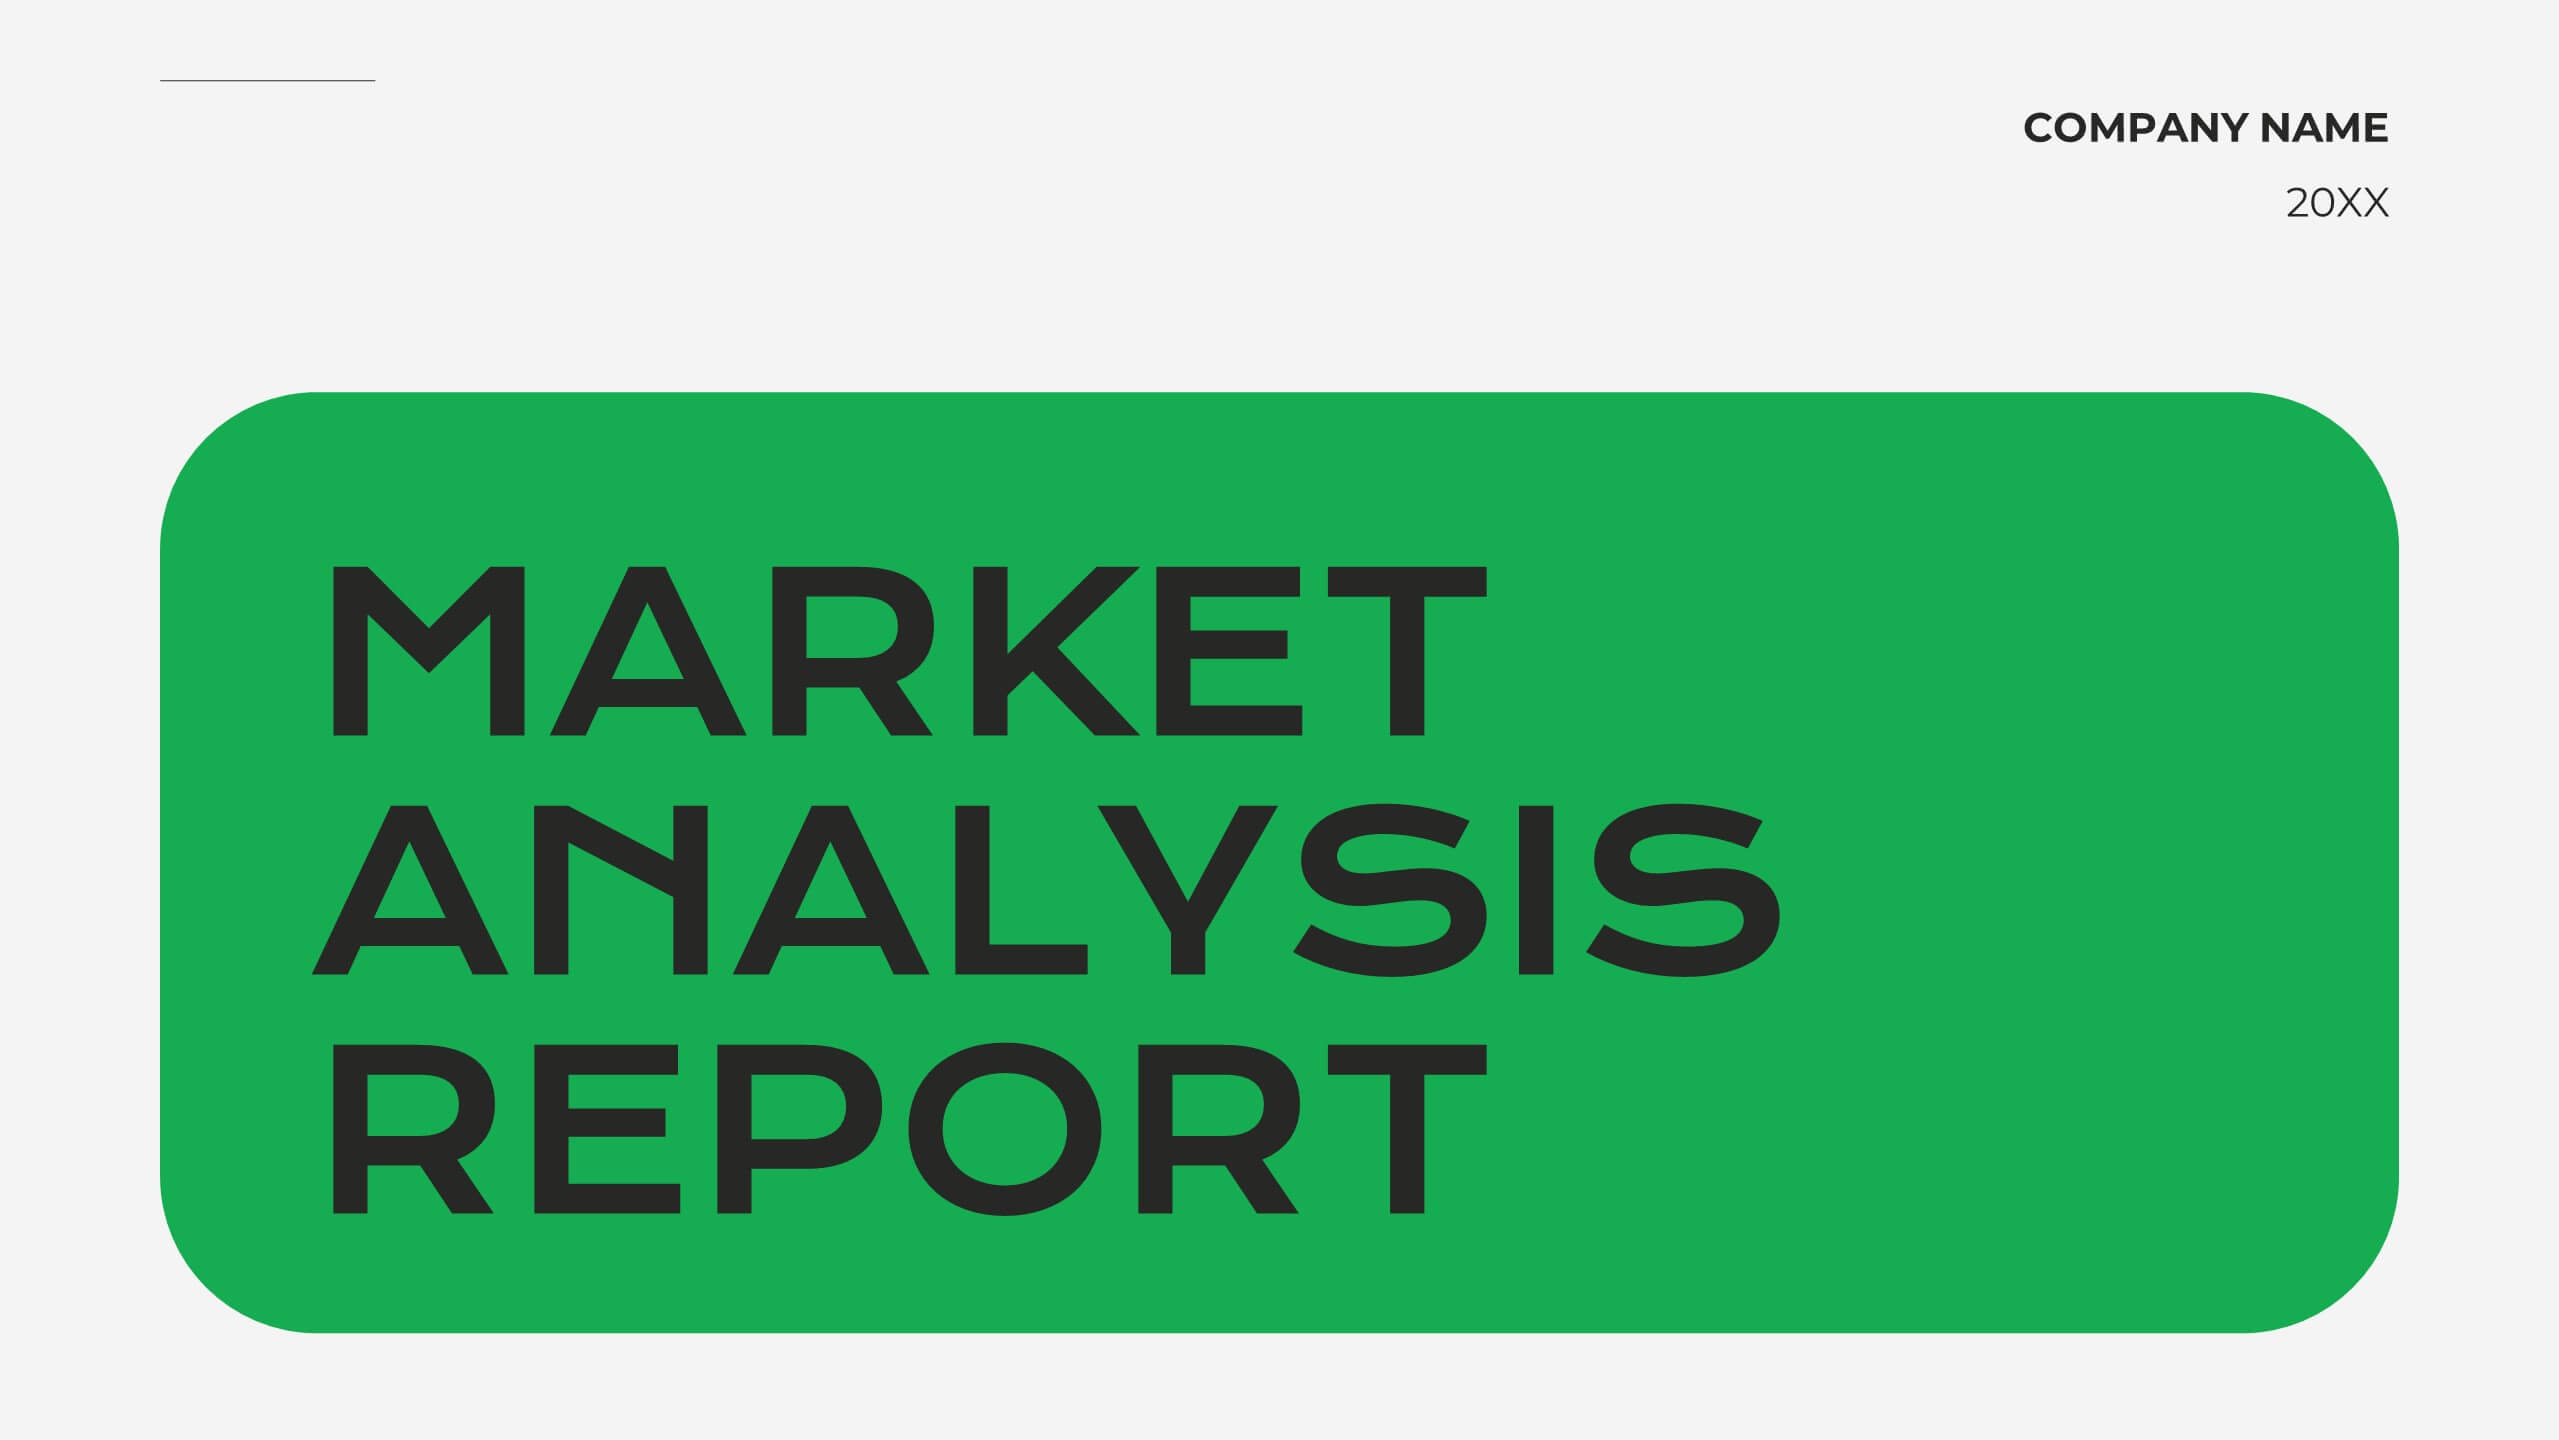
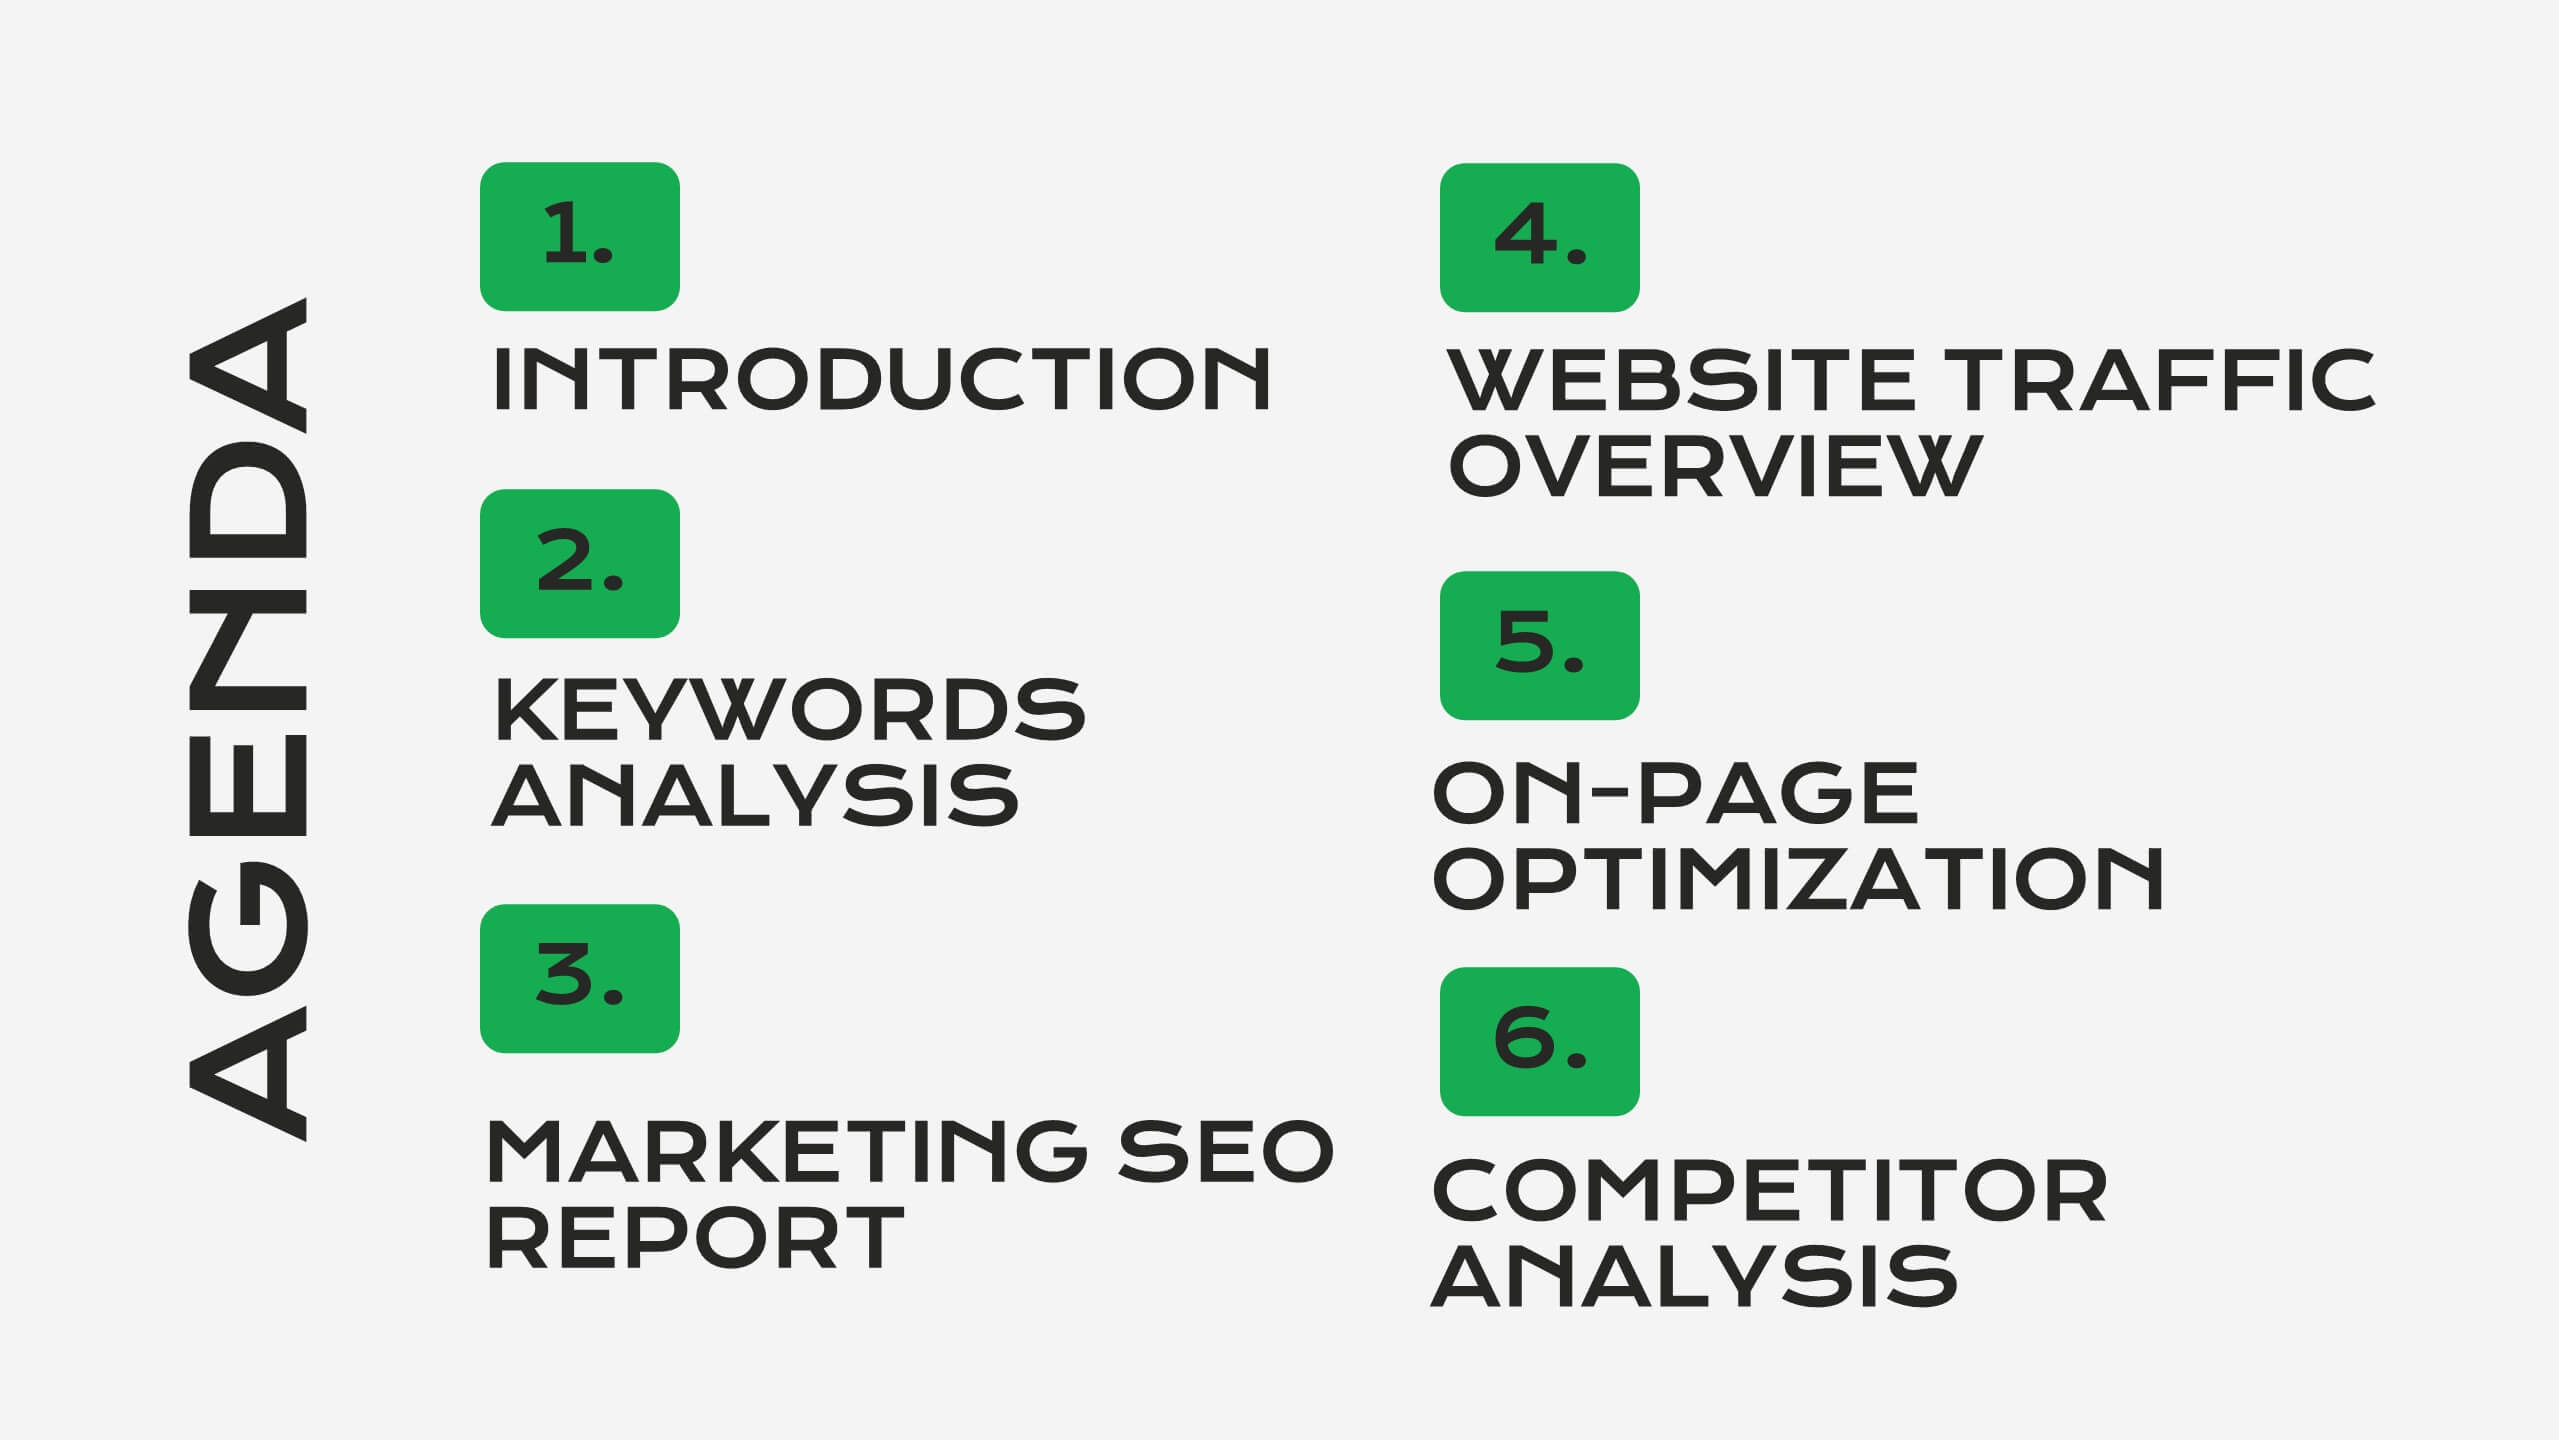
Serene Market Analysis Report Presentation
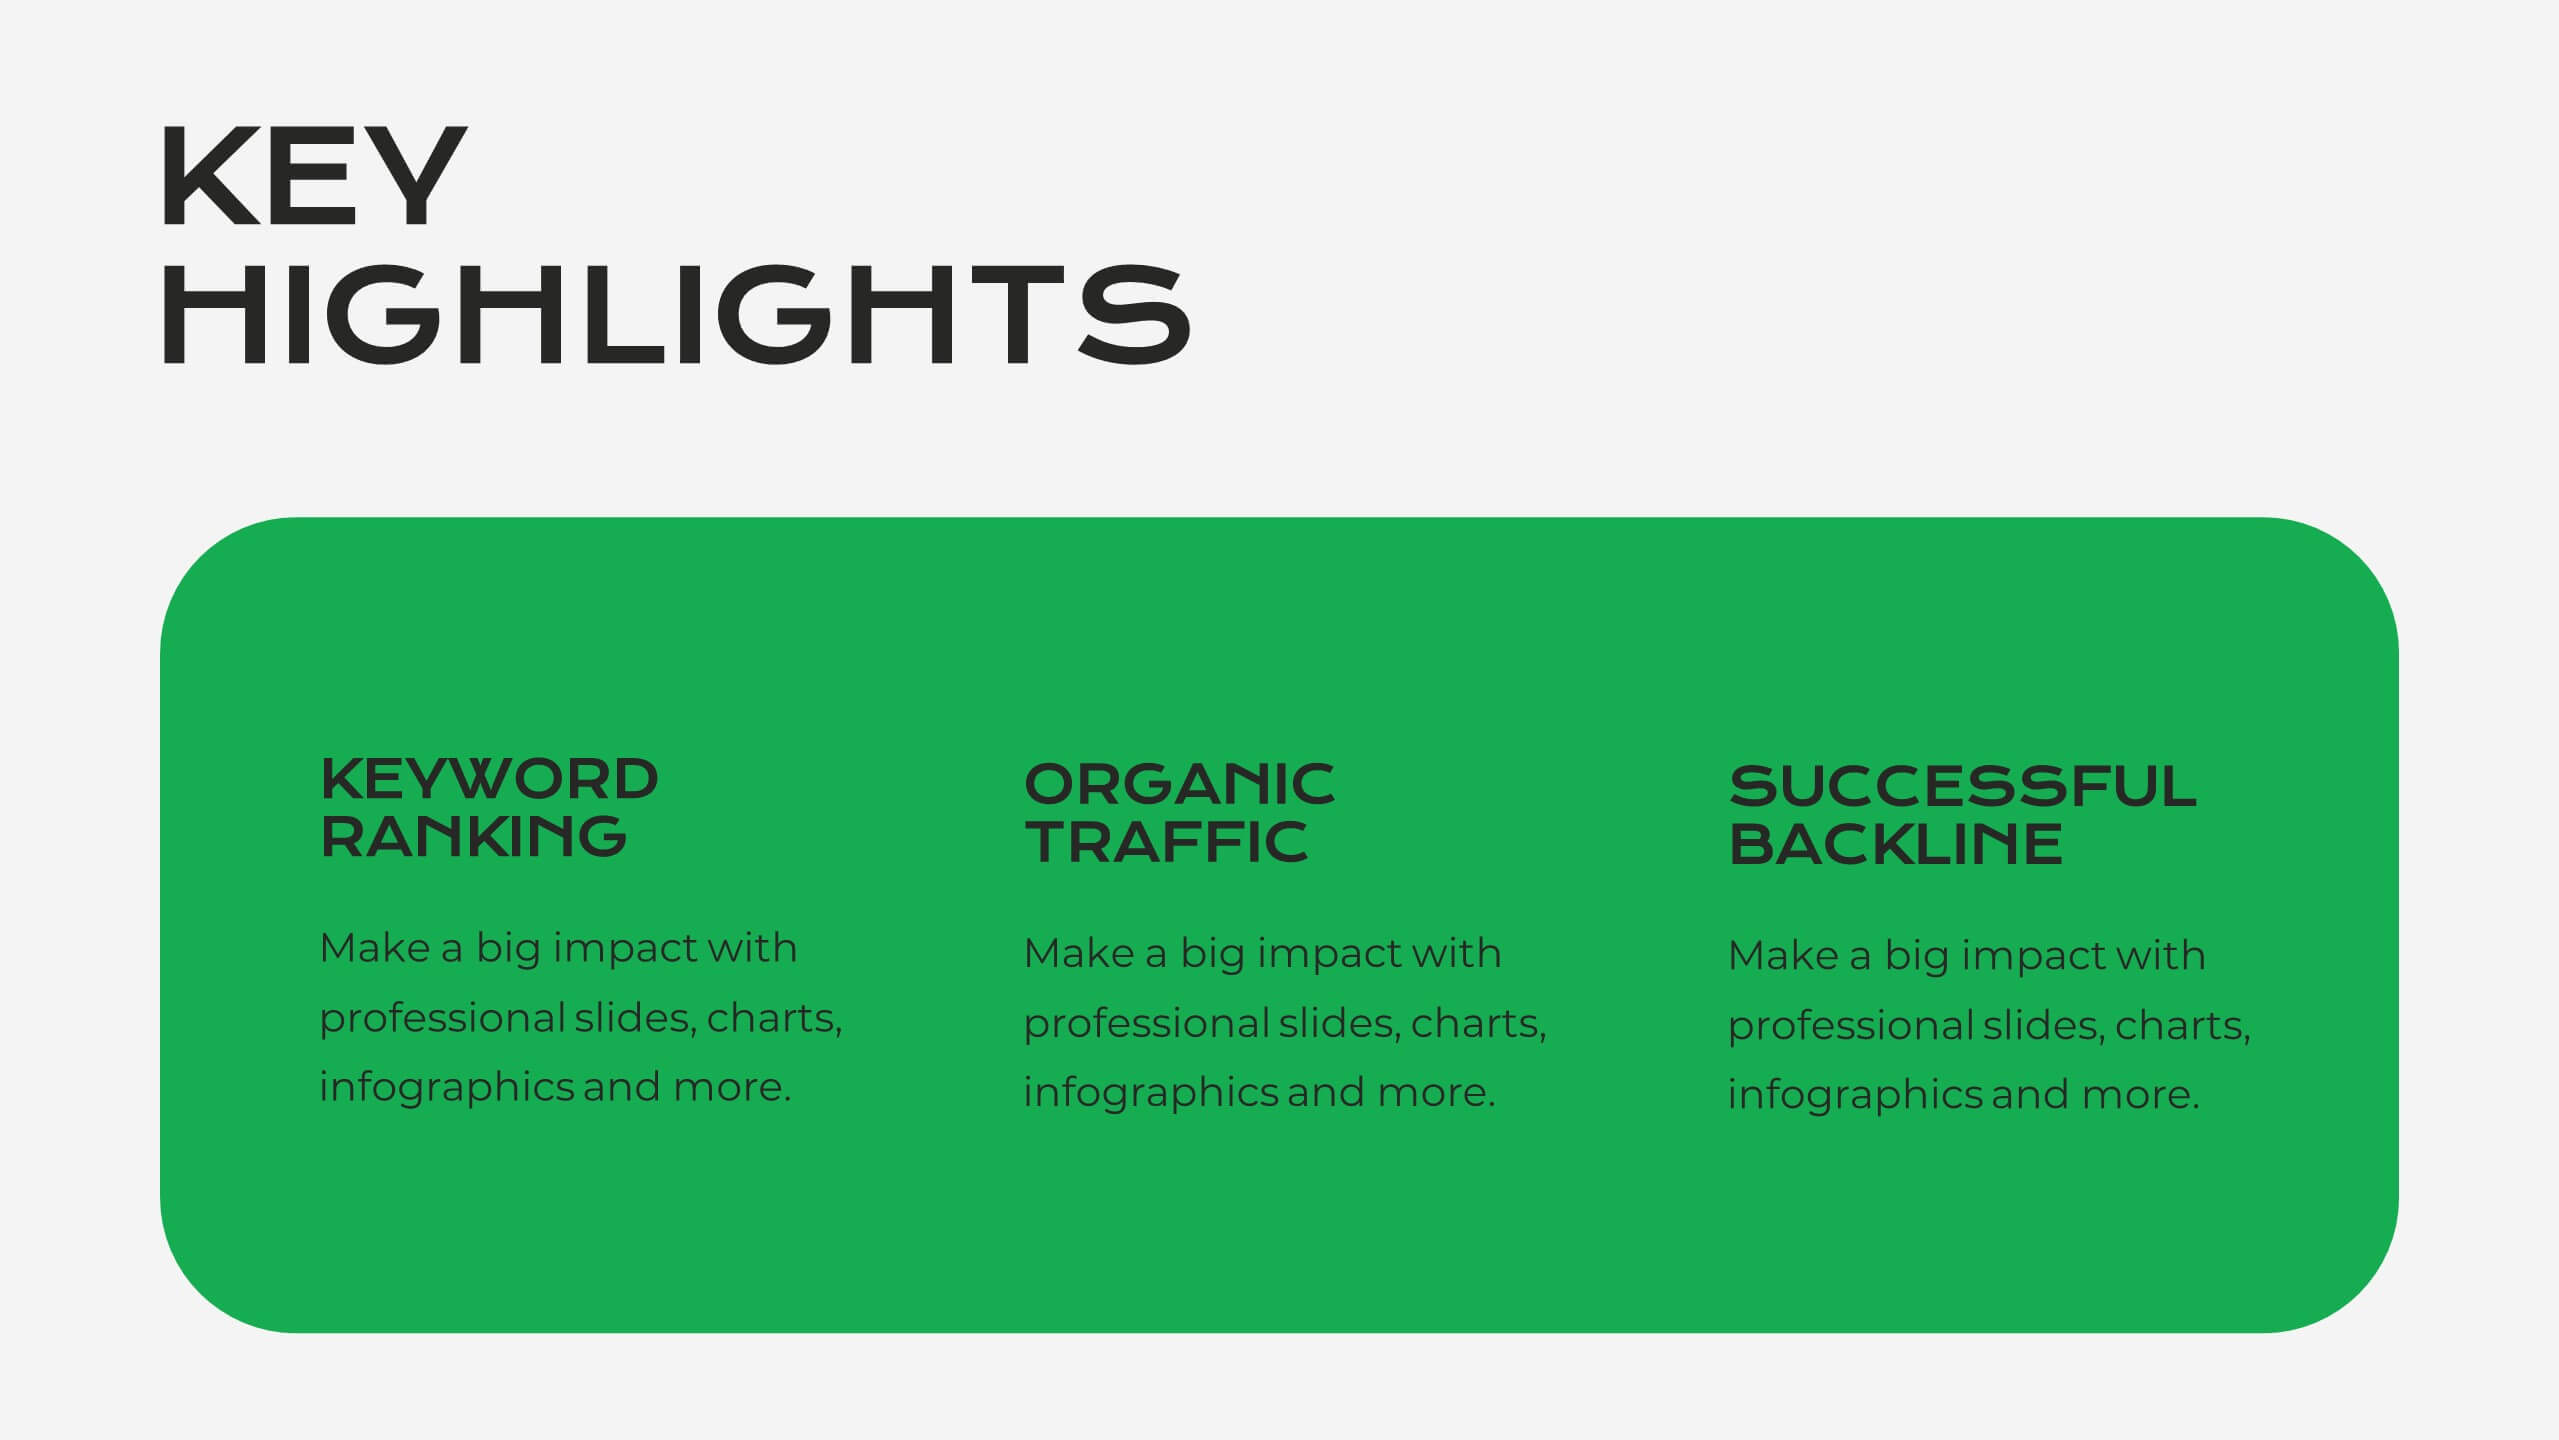
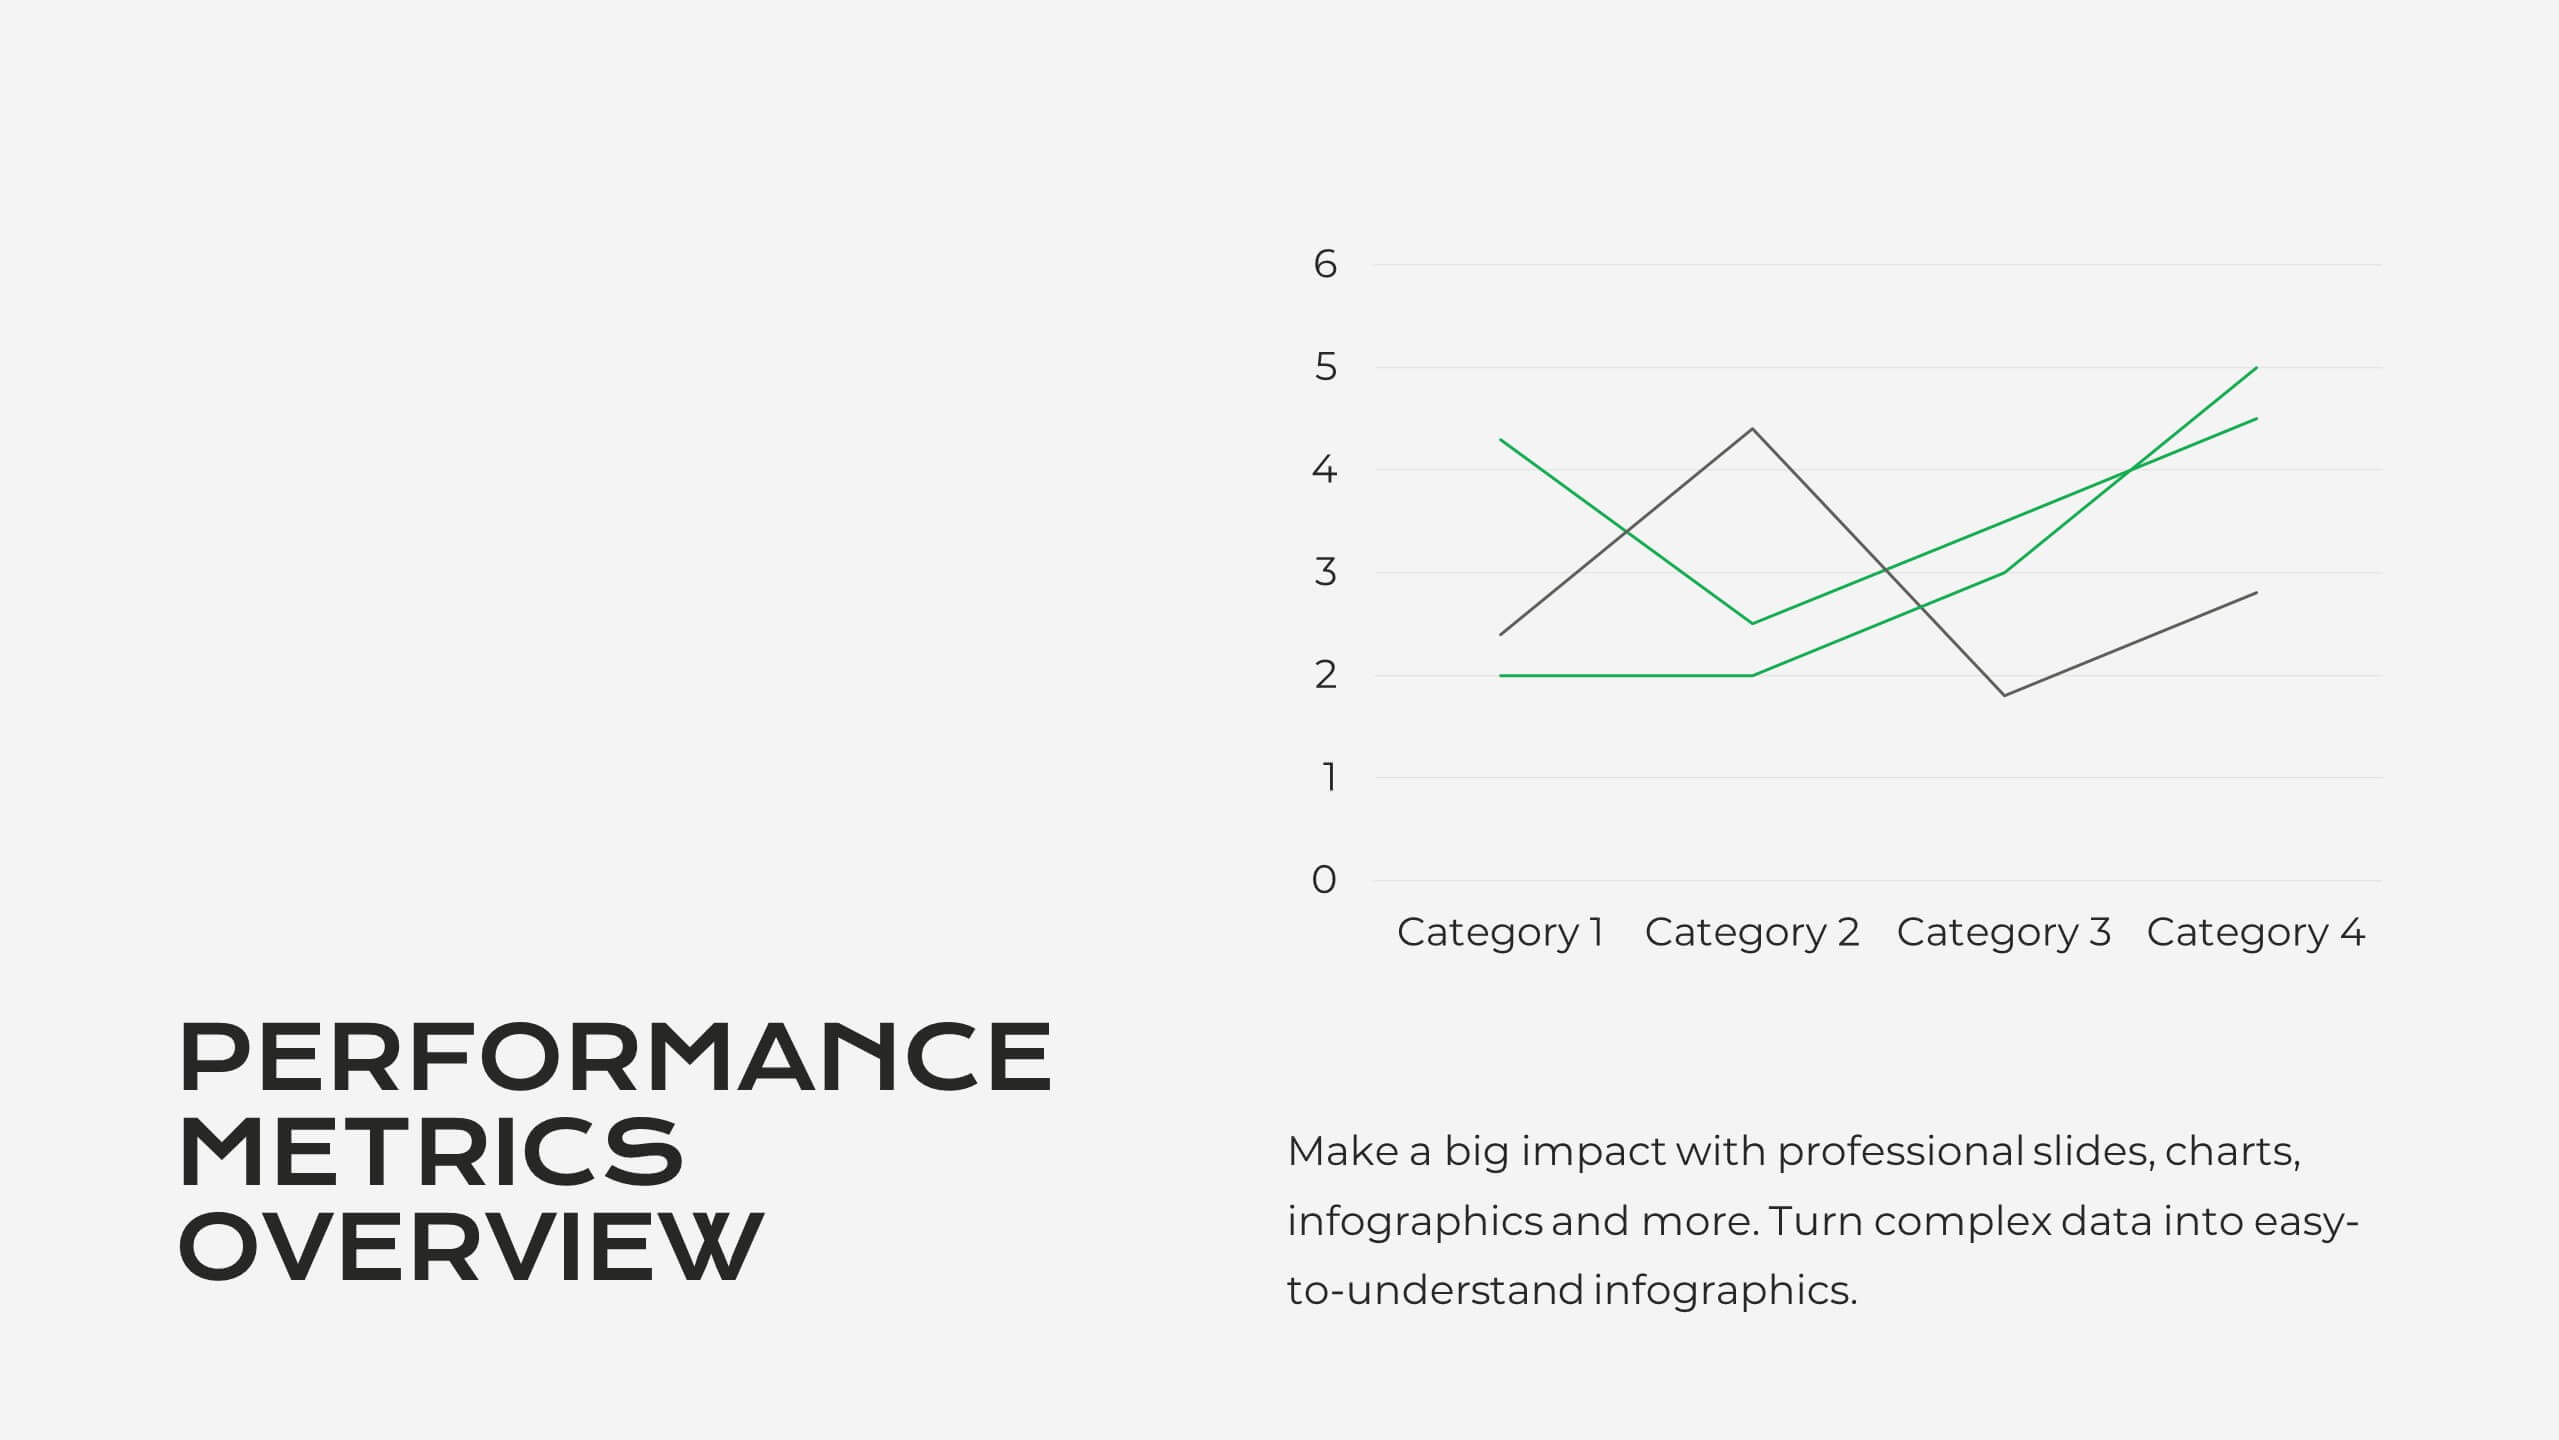
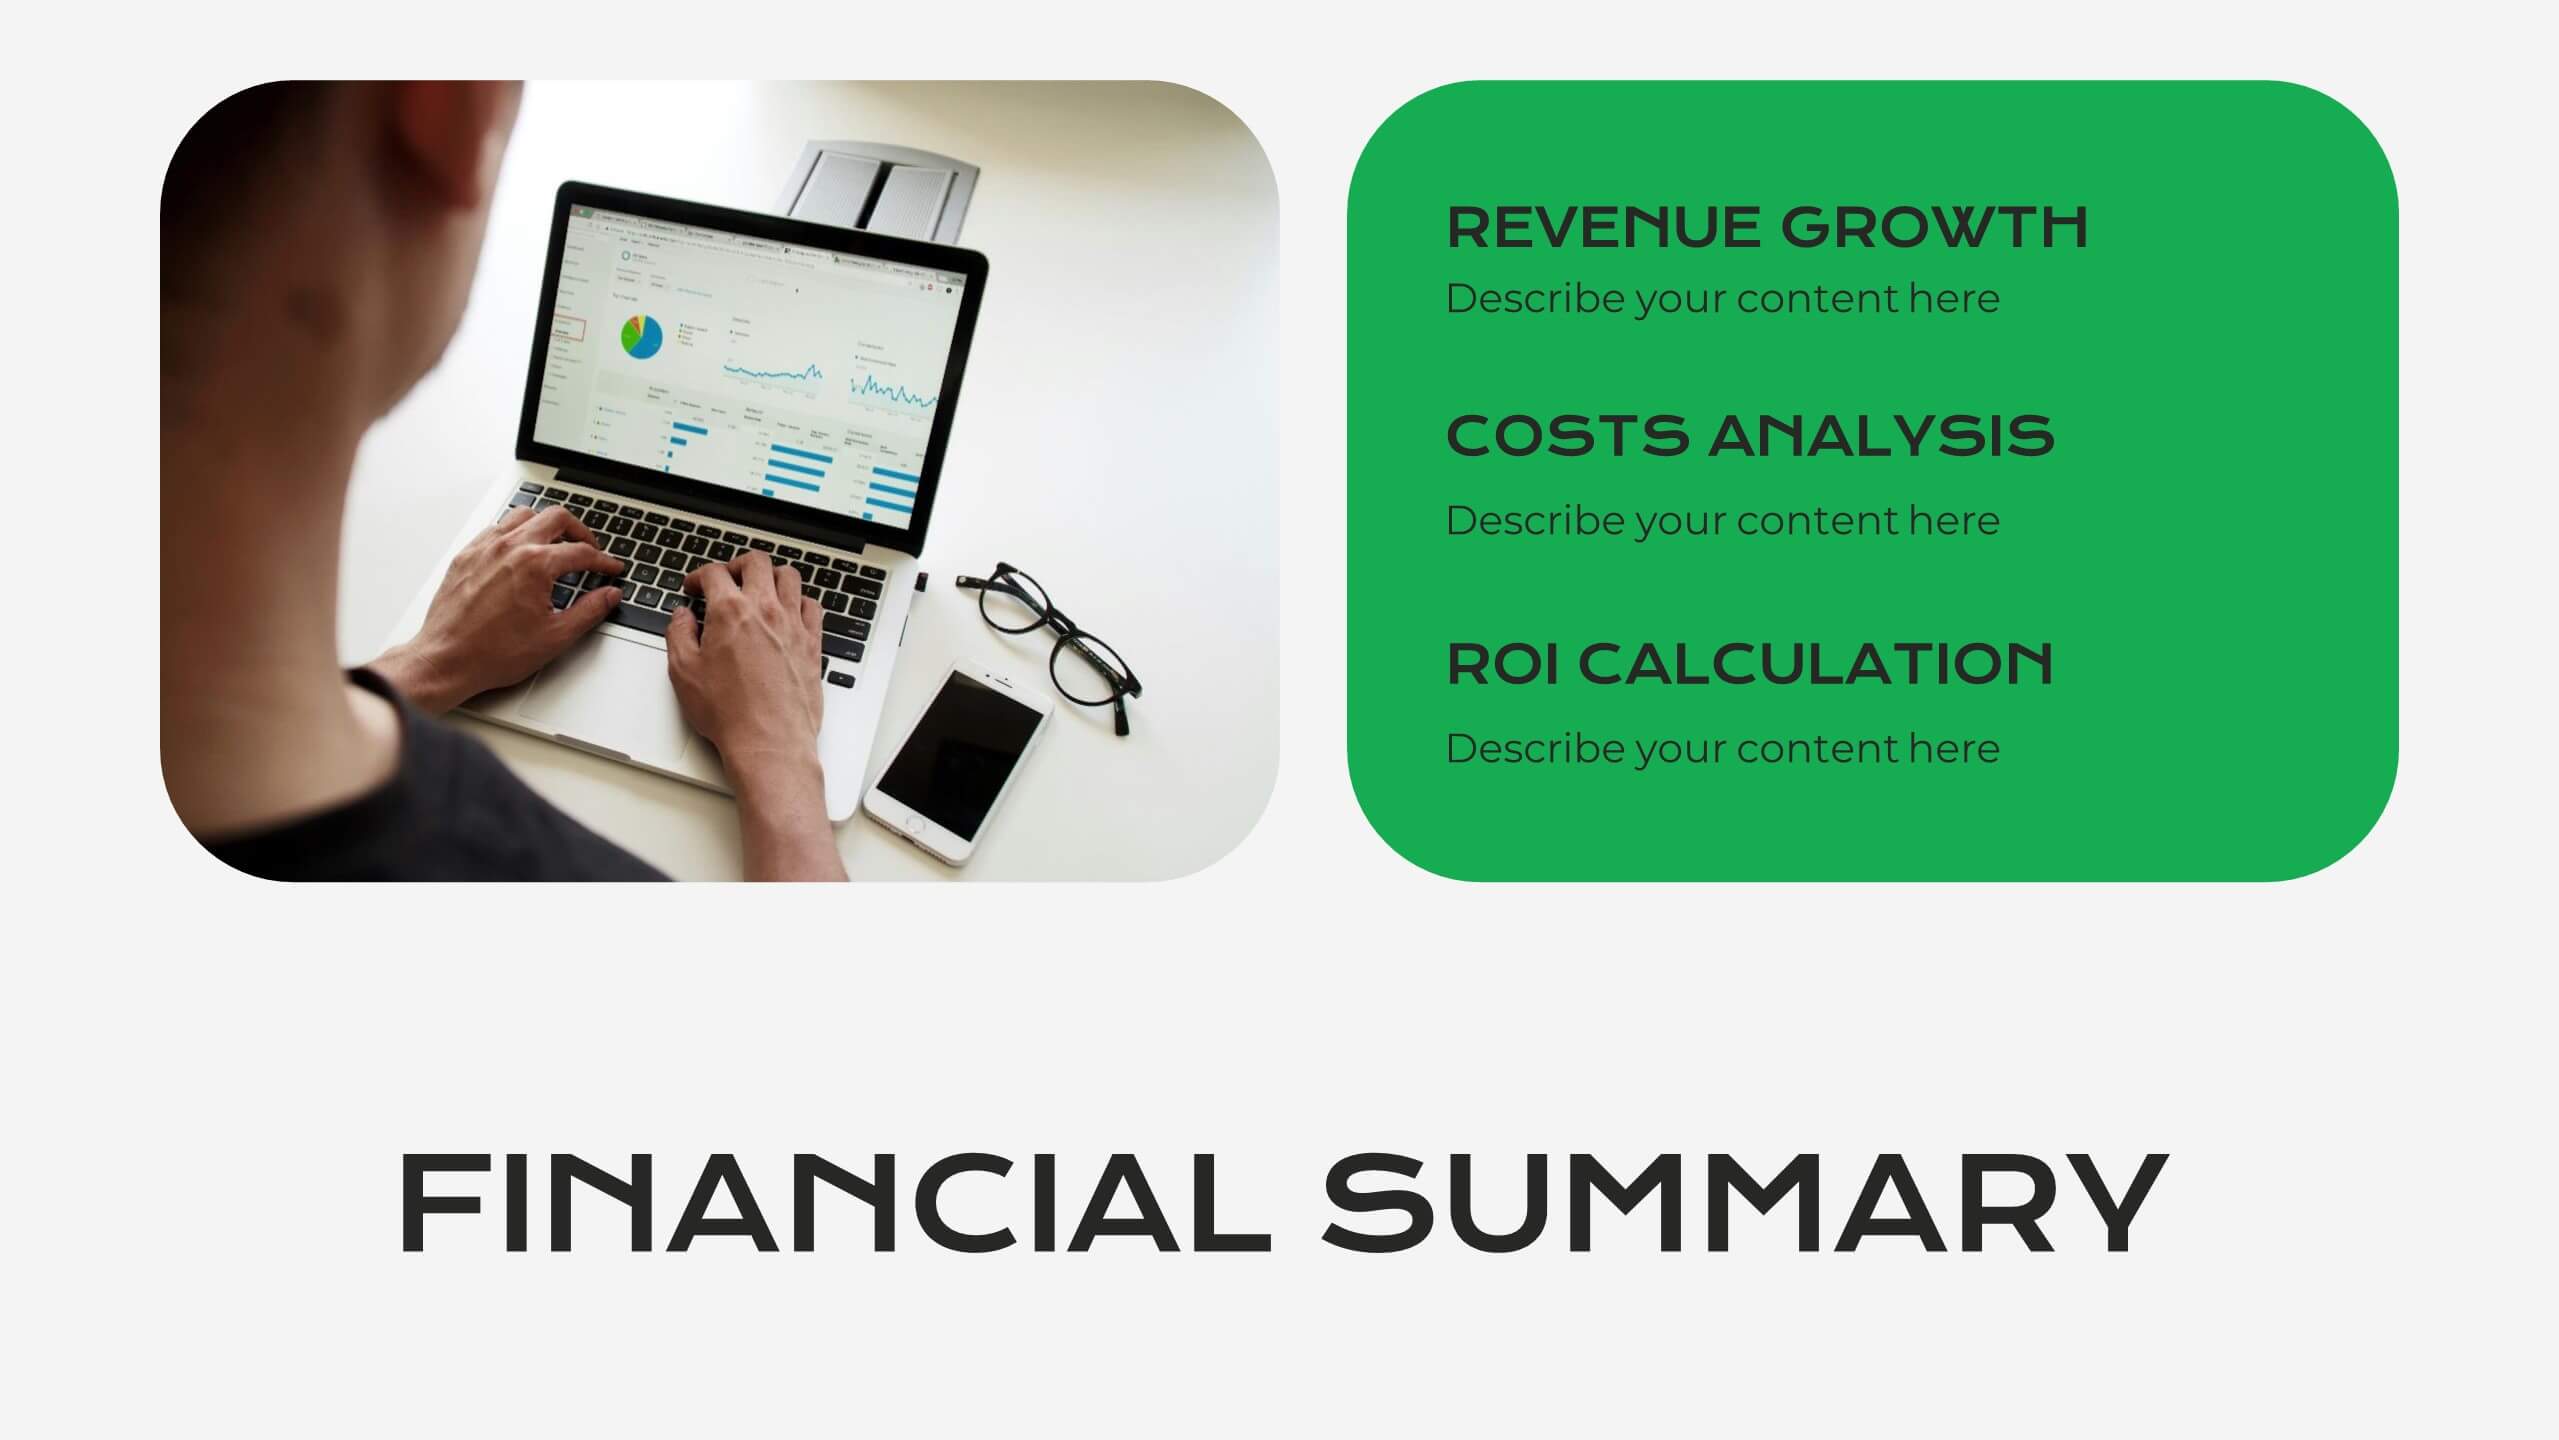
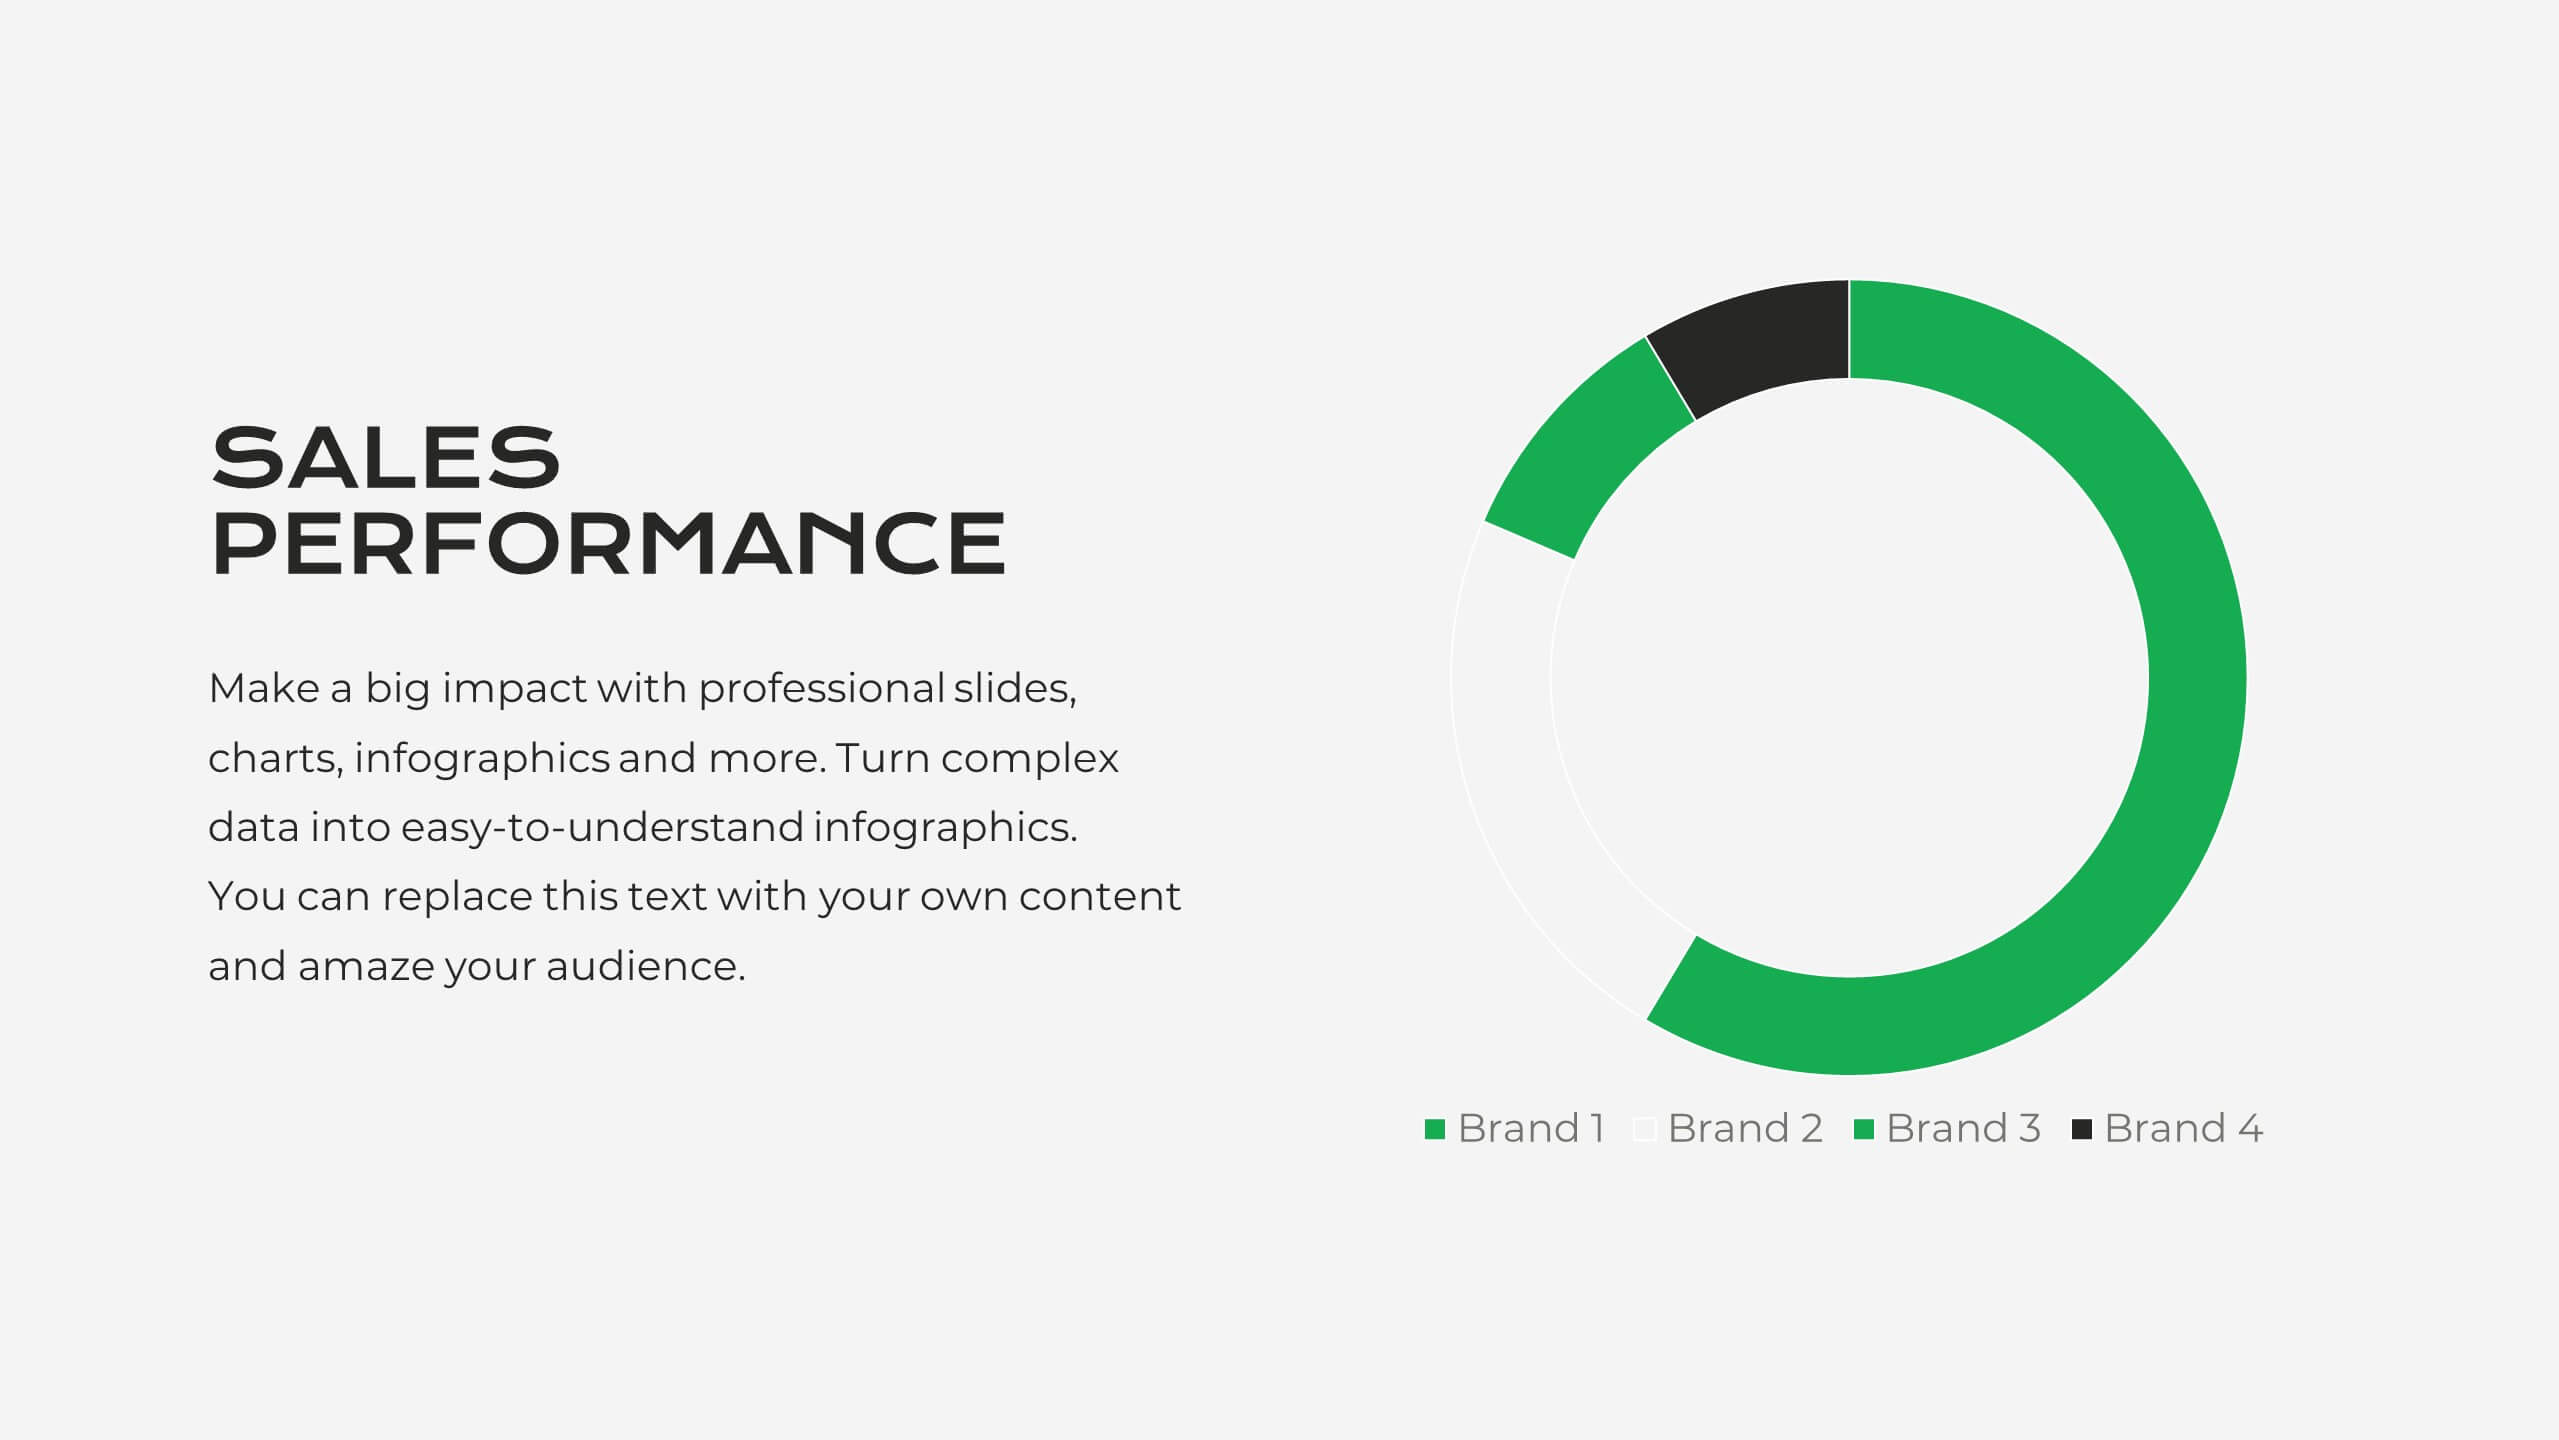
This modern and clean Market Analysis Report template is designed to help you present key data and insights with clarity and impact. Ideal for business professionals and analysts, it includes slides for key highlights, performance metrics, financial summaries, competitor insights, and strategic initiatives. The template's sleek layout ensures that your data is easy to understand and visually appealing, making it perfect for internal reports or client presentations. Customize it effortlessly in PowerPoint, Keynote, or Google Slides, and impress your audience with a polished and professional report.


5 slides
USA Trade Map Infographics
A USA Trade Map Infographic is a visual representation of the trade relationships that exist in the United States. This vertical infographic includes a vector or image of the United States map in a vertical orientation, with space for text or data to be included. This design features the maps in a bold, eye-catching color scheme allowing the data and text to stand out. The template also includes additional visual elements such as icons and illustrations to help present data and statistics related to different areas within the United States. Use this to present demographic data, election results, economic indicators, or travel and tourism information.


5 slides
Data-Driven Business Statistics
Visualize insights and percentages with this dynamic, data-driven infographic layout. Ideal for illustrating business progress, KPIs, and performance highlights. This editable template is fully compatible with PowerPoint, Keynote, and Google Slides, allowing you to tailor it effortlessly to fit your corporate style and messaging.


5 slides
Workplace Safety Guidelines and Protocols Presentation
Prioritize health and hazard awareness with the Workplace Safety Guidelines and Protocols presentation. Featuring a clean visual of a segmented fire extinguisher, this design clearly breaks down safety measures into five customizable steps. Ideal for internal training, HR onboarding, or compliance meetings, each section is paired with editable titles and descriptive placeholders. Communicate procedures like emergency response, equipment use, or safety checklists effectively. Compatible with PowerPoint, Keynote, and Google Slides, this template ensures your team stays informed and aligned.


10 slides
Market Positioning Competitive Analysis
Visually assess your brand’s position in the market with this quadrant-based layout designed for strategic clarity. This slide helps showcase key comparisons across marketing analysis, target audience alignment, unique value proposition, and messaging consistency. Fully editable in PowerPoint, Keynote, and Google Slides.