


Features
- 10 Unique slides
- Fully editable and easy to edit in Microsoft Powerpoint, Keynote and Google Slides
- 16:9 widescreen layout
- Clean and professional designs
- Export to JPG, PDF or send by email


Do you have any questions?
Recommend


6 slides
Threat and Mitigation Bowtie Model Presentation
Clarify cause and consequence pathways with the Threat and Mitigation Bowtie Model Presentation. This template helps visualize risk sources, critical events, and mitigation strategies in a clear bowtie format. Ideal for incident analysis, safety reviews, and compliance reporting. Fully editable in PowerPoint, Keynote, and Google Slides.


6 slides
Product Life Cycle Stages and Management Presentation
Visualize the journey from product development to market maturity with this modern, conveyor-style layout. Designed to represent five sequential phases, this presentation is perfect for product managers, marketing teams, or business strategists explaining launch strategies, performance tracking, or growth planning. Fully editable in PowerPoint, Keynote, and Google Slides.
4 slides
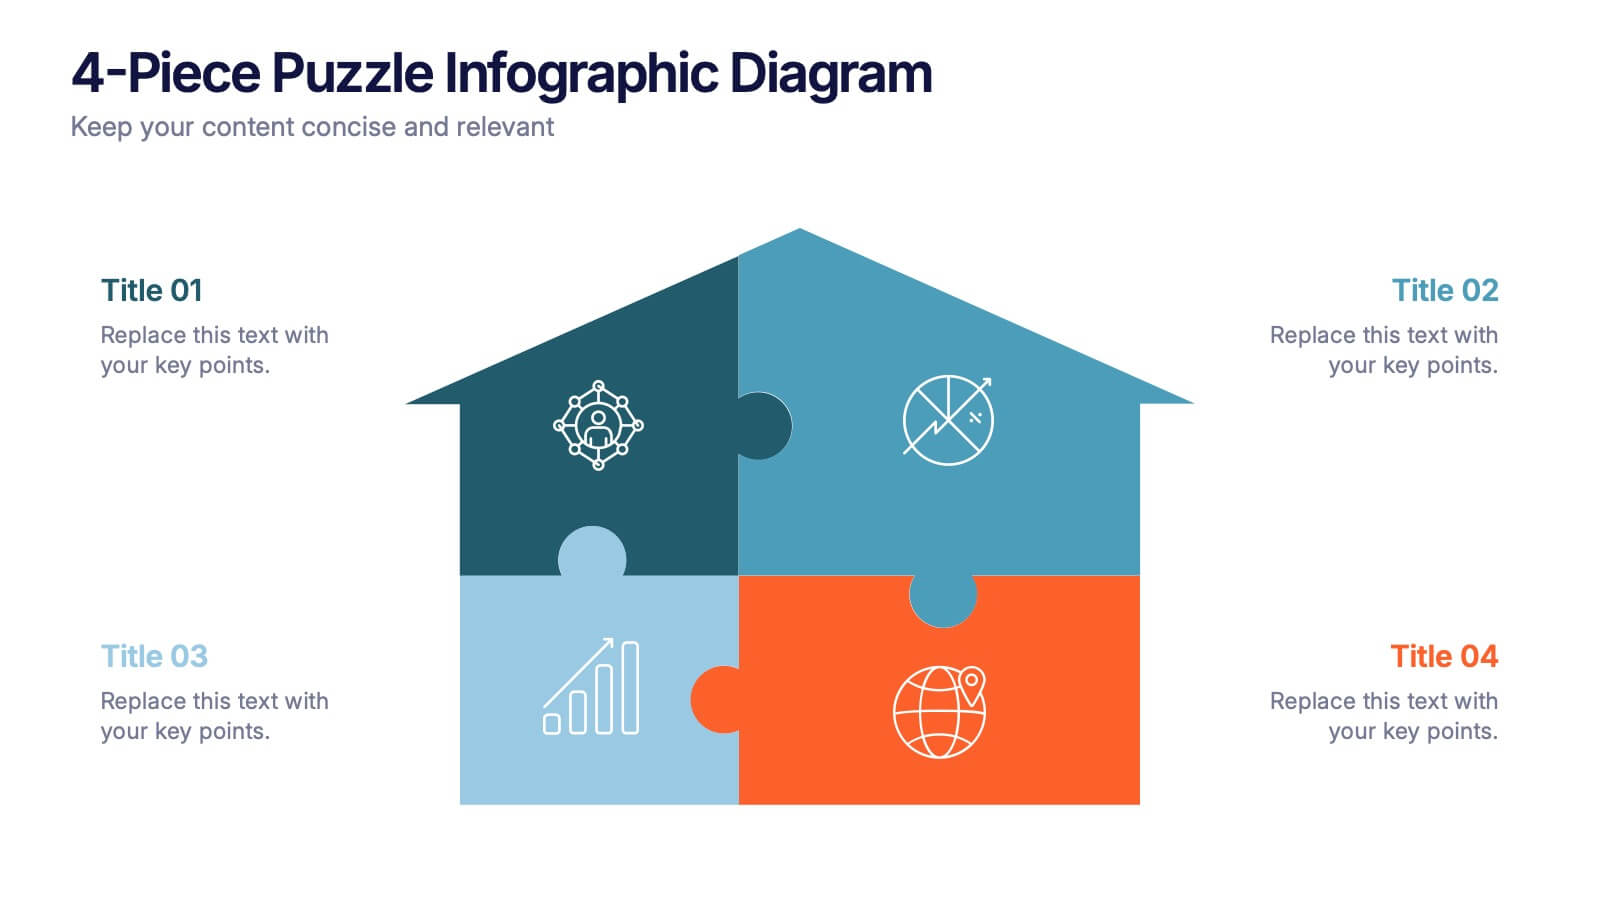
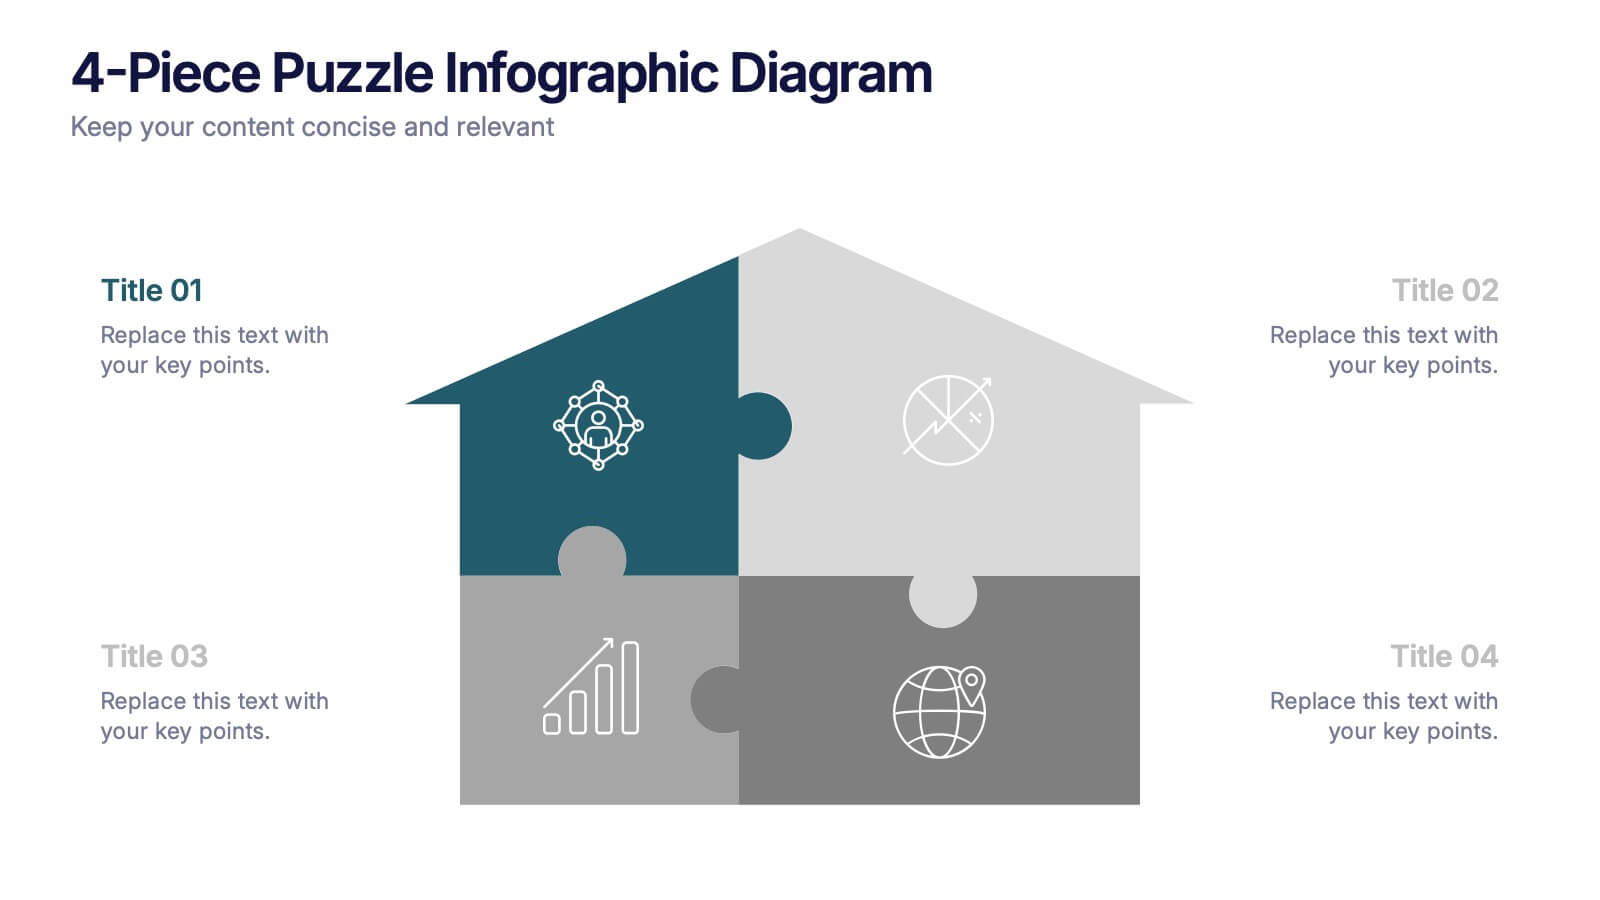
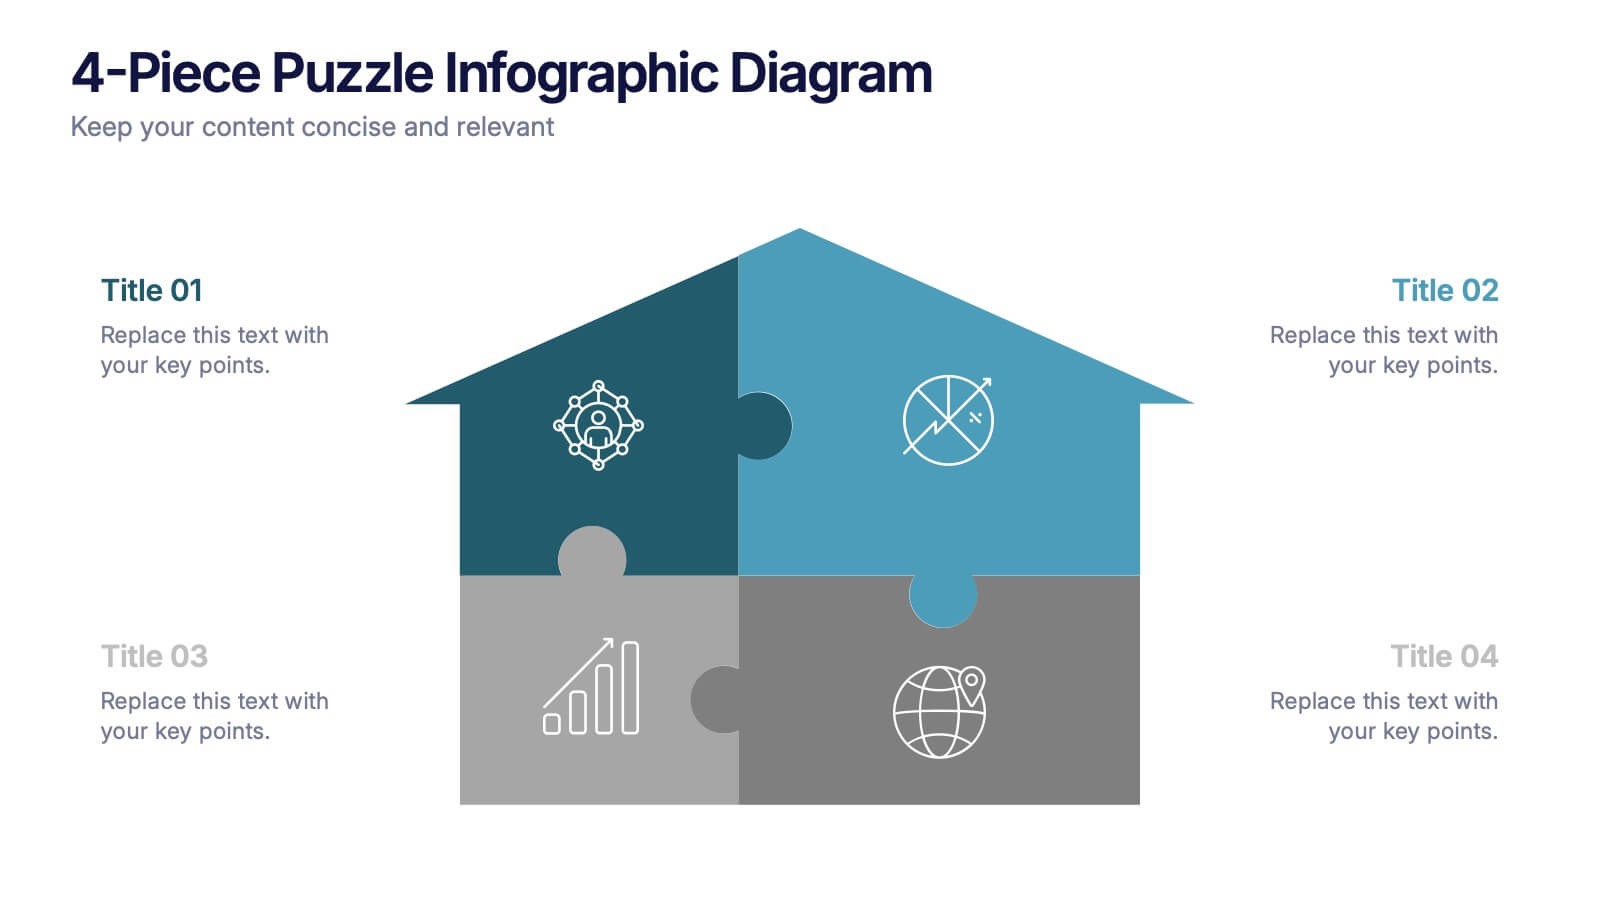
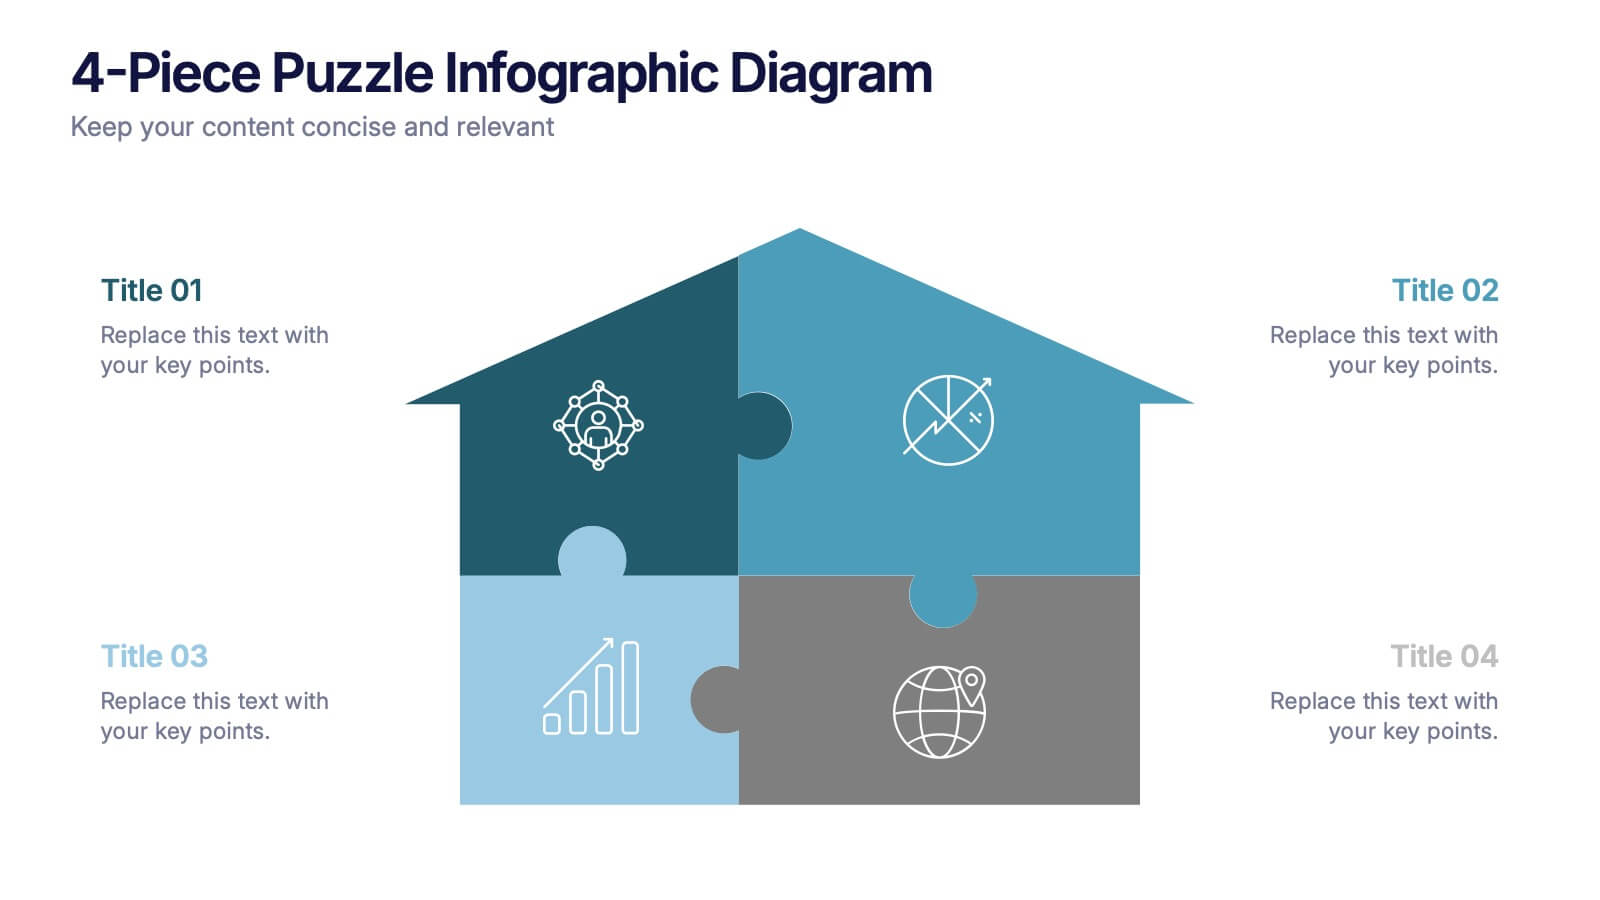
4-Piece Puzzle Infographic Diagram Presentation
Bring clarity and impact to your message with a visual layout that snaps big ideas together like a puzzle. This presentation helps you break complex concepts into four connected sections, making explanations easier and more engaging for any audience. Ideal for planning, insights, or strategy sessions. Fully compatible with PowerPoint, Keynote, and Google Slides.


7 slides
KPI Sales Dashboard Infographic
A KPI (Key Performance Indicator) Dashboard is a visual tool or interface that provides a real-time snapshot of an organization's or a specific department's key performance indicators. Empower your sales team with our KPI sales dashboard infographic template. This visually striking and insightful template allows you to present key performance indicators and metrics in an easily understandable and engaging format. Compatible with Powerpoint, Keynote, and Google Slides. This template will transform your sales data into a dynamic, easy-to-understand dashboard, helping your team stay informed, motivated, and focused on achieving sales targets.


10 slides
Territorial Insights with South America Map Presentation
Unlock regional clarity with the Territorial Insights with South America Map Presentation. This editable slide visualizes country-specific highlights using a modern grid-based map layout, customizable color zones, and label connectors to break down key insights. Ideal for sales analysis, market entry strategies, or logistics reporting. Compatible with PowerPoint, Keynote, Google Slides, and Canva.


5 slides
Startup Business Plan Presentation
Launch your ideas with clarity using this Startup Business Plan slide template. The rocket-inspired visual guides your audience through five strategic stages, each labeled with editable icons and titles—perfect for pitching goals, financials, timelines, or key operations. Ideal for entrepreneurs and early-stage companies, this slide is easy to customize in PowerPoint, Keynote, or Google Slides.


7 slides
Pillar Points Infographic Presentation
A Pillar Infographic presents information on a specific topic or subject in a clear and organized manner. It consists of several sections or "pillars" that are interconnected and support the overall message of the infographic. In this template each pillar can be used to represent different aspects of the topic being discussed. Each section contains relevant data, statistics, and other information that illustrates the aspect. This can be used in marketing and advertising to promote products or services, as well as in education and journalism to explain complex ideas in a visually appealing way.


4 slides
Simple and Effective Steps Presentation
Guide your audience through a seamless workflow with this "Simple and Effective Steps" template. Designed for clarity and impact, this layout breaks down processes into four distinct steps, making it ideal for project planning, decision-making, and strategy execution. Fully customizable and compatible with PowerPoint, Keynote, and Google Slides.


10 slides
Environmental Sustainability Strategy
Bring your green initiatives to life with this vibrant, four-step sustainability roadmap. Ideal for visualizing eco-friendly practices, CSR programs, or environmental policy rollouts. The organic flow, icons, and plant-themed accents enhance clarity and engagement. Fully customizable in PowerPoint, Keynote, and Google Slides.


4 slides
Digital Marketing and SEO Best Practices Presentation
Communicate your digital strategy with this clean and structured visual layout. This template features a horizontal flowchart design with four circular icons branching from a central infographic, allowing you to showcase core areas such as audience targeting, content creation, performance analytics, and ranking improvement. Ideal for marketers, consultants, and SEO professionals. Fully editable in PowerPoint, Keynote, and Google Slides.


5 slides
Identifying Problems in Projects Presentation
Kickstart your analysis with a bold, colorful layout that makes uncovering project issues feel clear and structured. This presentation helps you outline challenges, compare causes, and guide teams toward practical solutions using a simple, organized flow. Fully compatible with PowerPoint, Keynote, and Google Slides.
8 slides
3-Step Arrow Diagram Presentation
Streamline your presentations with the 3-Step Arrow Diagram Presentation. Designed for process flows, strategic planning, and step-by-step guides, this visually engaging template simplifies complex ideas into clear, structured steps. Customize colors, text, and icons effortlessly to match your brand. Fully compatible with PowerPoint, Keynote, and Google Slides for seamless editing and professional results.


10 slides
5-Level Circular Diagram Presentation
Visualize complex concepts with this professional 5-Level Circular Diagram template. Perfect for business strategies, project planning, and hierarchical structures, it provides a clear, layered approach. Fully editable and compatible with PowerPoint, Keynote, and Google Slides, this design ensures a polished, impactful presentation with structured, easy-to-understand visuals.


5 slides
Cyber Security Best Practices Infographics
Navigate the digital landscape safely with our cyber security best practices infographics. Crafted in a striking combination of black with colorful accents, this creative, vertical template is a powerhouse of cyber safety education. It's an indispensable resource for IT professionals, and educators seeking to propagate security protocols. The design encapsulates compelling graphics, intuitive icons, and dedicated placeholders. Compatible with Powerpoint, Keynote, and Google Slides. By employing this infographic, users can foster a culture of digital vigilance and defense, making it an asset in the fight against online threats.


4 slides
Internal Meeting Agenda and Notes Presentation
Stay organized and aligned with the Internal Meeting Agenda and Notes presentation template. Designed for clarity and productivity, this layout includes dedicated sections for meeting topics, notes, action items (to-do list), brainstorming, and extra comments. Ideal for team check-ins, project syncs, and internal reviews. Fully editable and compatible with PowerPoint, Keynote, and Google Slides.


5 slides
Creative Alphabet Infographic Presentation
Make learning and presentations more engaging with this Creative Alphabet Infographic Presentation template. Featuring bold, letter-based visual elements resembling pencils, this slide is perfect for educational content, branding, or step-by-step processes. Fully editable and compatible with PowerPoint, Keynote, and Google Slides.


5 slides
Business Objectives and Strategic Goals Presentation
Clarify your roadmap to success with this visually structured Business Objectives and Strategic Goals slide. Featuring five segmented goal icons arranged in a semi-circle layout, this template is perfect for strategic planning, quarterly reports, and team briefings. Each section allows space to detail your specific objectives with matching visuals for easy comprehension. Fully editable in PowerPoint, Keynote, and Google Slides.