


Features
- 6 Unique slides
- Fully editable and easy to edit in Microsoft Powerpoint, Keynote and Google Slides
- 16:9 widescreen layout
- Clean and professional designs
- Export to JPG, PDF or send by email


Do you have any questions?
Recommend


4 slides
Career Onboarding 30 60 90 Day Presentation
Start strong with a clean, uplifting layout that makes each milestone in the onboarding journey feel clear, motivating, and easy to follow. This presentation helps you outline expectations, track early progress, and communicate development goals with confidence and clarity. Fully editable and compatible with PowerPoint, Keynote, and Google Slides.


10 slides
Social Media Marketing Growth Presentation
Boost your social media strategy with this dynamic infographic template! Perfect for illustrating marketing growth, engagement tactics, and content performance, it features an intuitive flow that simplifies complex data. Ideal for presentations to teams and clients, it’s fully customizable and works seamlessly with PowerPoint, Keynote, and Google Slides.


6 slides
ABC Alphabet Infographic
An "Alphabet Infographic" is a visually engaging way to present the letters of the alphabet along with corresponding words or images that start with each letter. This type of infographic is often used in educational settings to teach young children the alphabet and basic vocabulary. Display the letters of the alphabet in a clear and appealing layout. You can arrange them in rows or columns, using a bold and easily readable font. Use colorful and child-friendly illustrations for the images associated with each letter. This will make the infographic more captivating and engaging for young learners.


5 slides
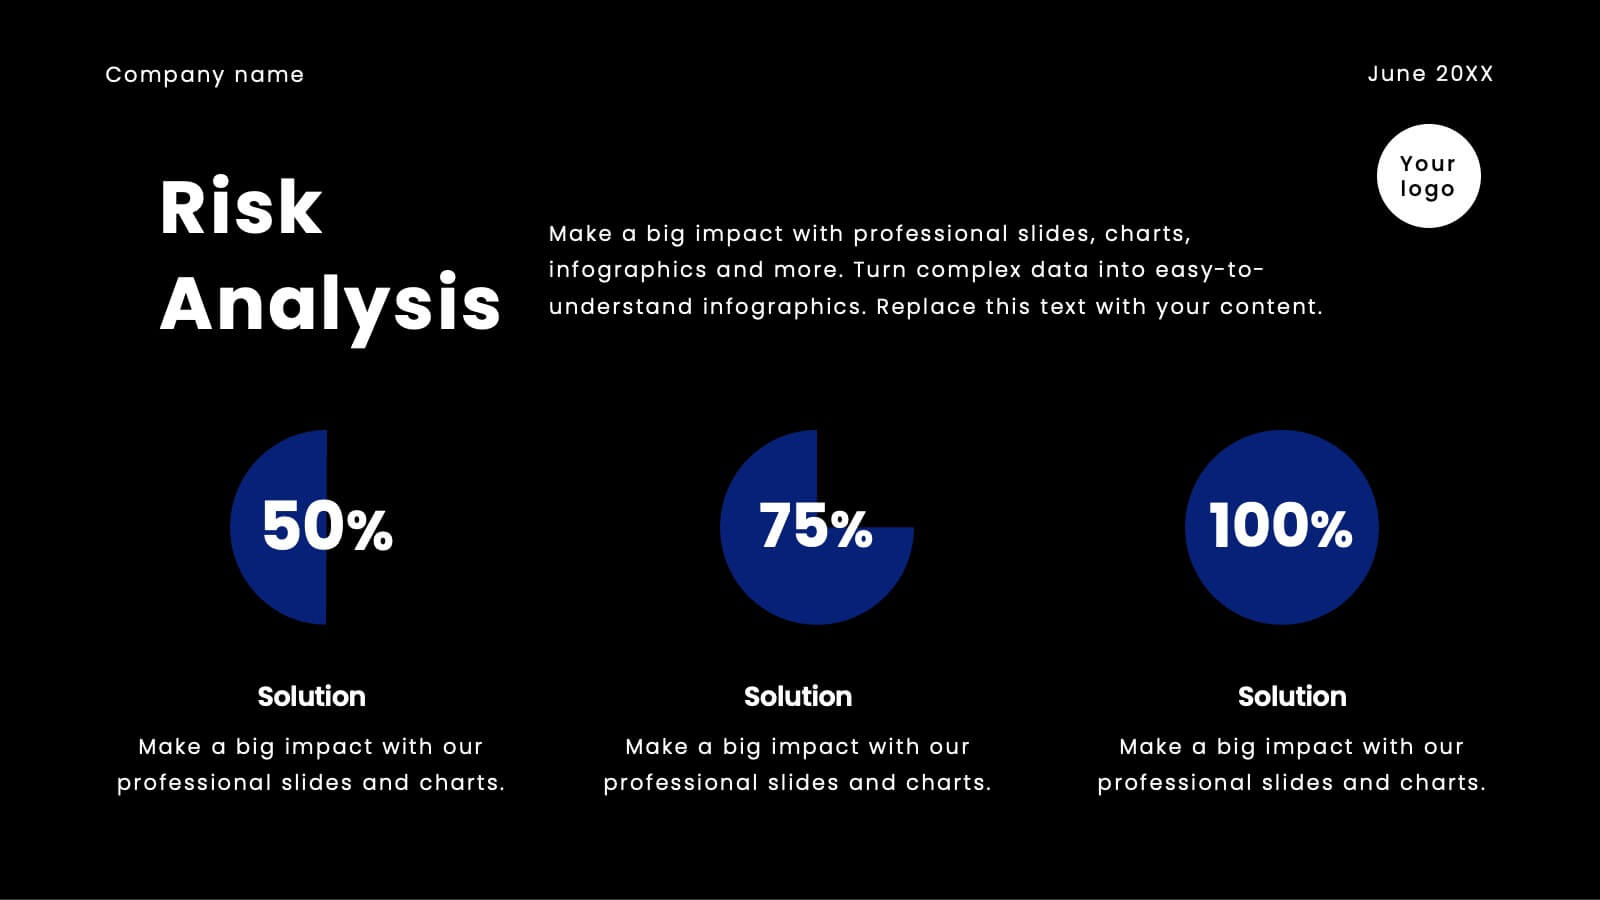
Insurance Risk Management Presentation
Make complex risk strategies easy to understand with this clean and professional presentation design. Perfect for explaining insurance coverage, threat assessment, or business protection plans, it blends clear visuals with modern design elements. Fully editable and compatible with PowerPoint, Keynote, and Google Slides for effortless customization and presentation.


5 slides
4-Piece Puzzle Diagram Presentation
Break down complex concepts with the 4-Piece Puzzle Diagram. This intuitive visual aid allows you to illustrate relationships, key components, and strategic elements in a clear and structured format. Perfect for business presentations, project planning, and educational content, this template ensures seamless customization and compatibility with PowerPoint, Keynote, and Google Slides.


8 slides
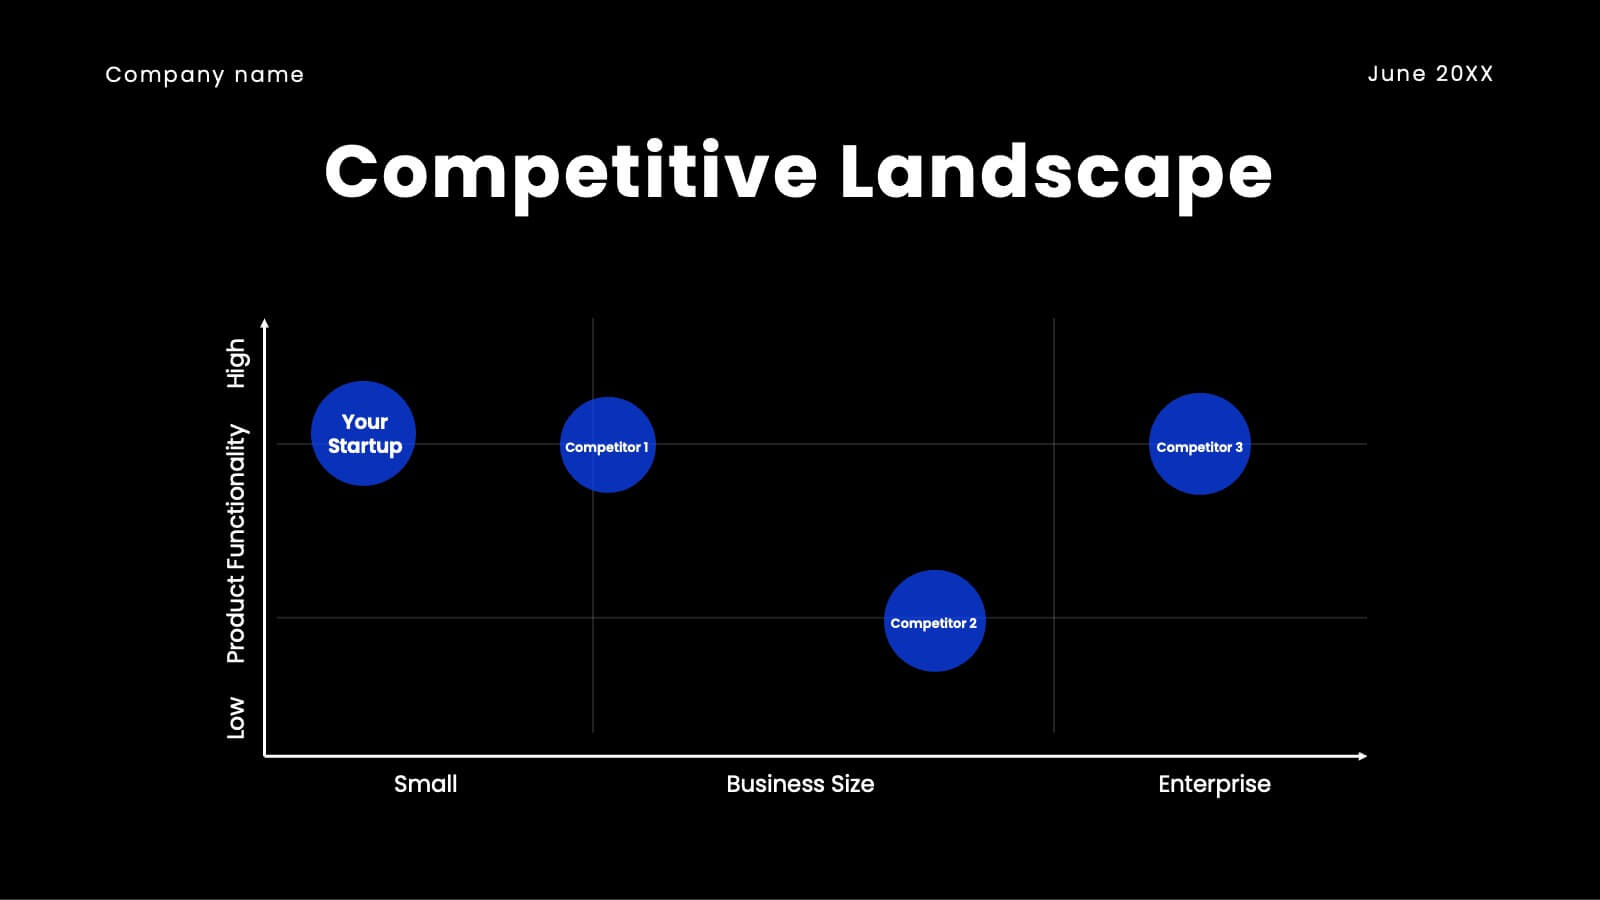
TAM SAM SOM Market Analysis Presentation
Define Your Market Potential Clearly with this TAM SAM SOM Market Analysis Presentation template. Designed to break down Total Addressable Market (TAM), Serviceable Available Market (SAM), and Serviceable Obtainable Market (SOM), this structured layout helps startups, investors, and business analysts showcase market opportunities and growth potential. Fully customizable and compatible with PowerPoint, Keynote, and Google Slides, this template is perfect for fundraising pitches, strategic planning, and competitive analysis.


5 slides
Survey Findings and Summary Report Presentation
Present survey data clearly with this layered, step-style layout. Each section is color-coded with matching icons for quick insight into key findings. Ideal for summarizing feedback, analytics, or market research. Fully editable in Canva, PowerPoint, or Google Slides—perfect for making data-driven presentations engaging and easy to follow.


22 slides
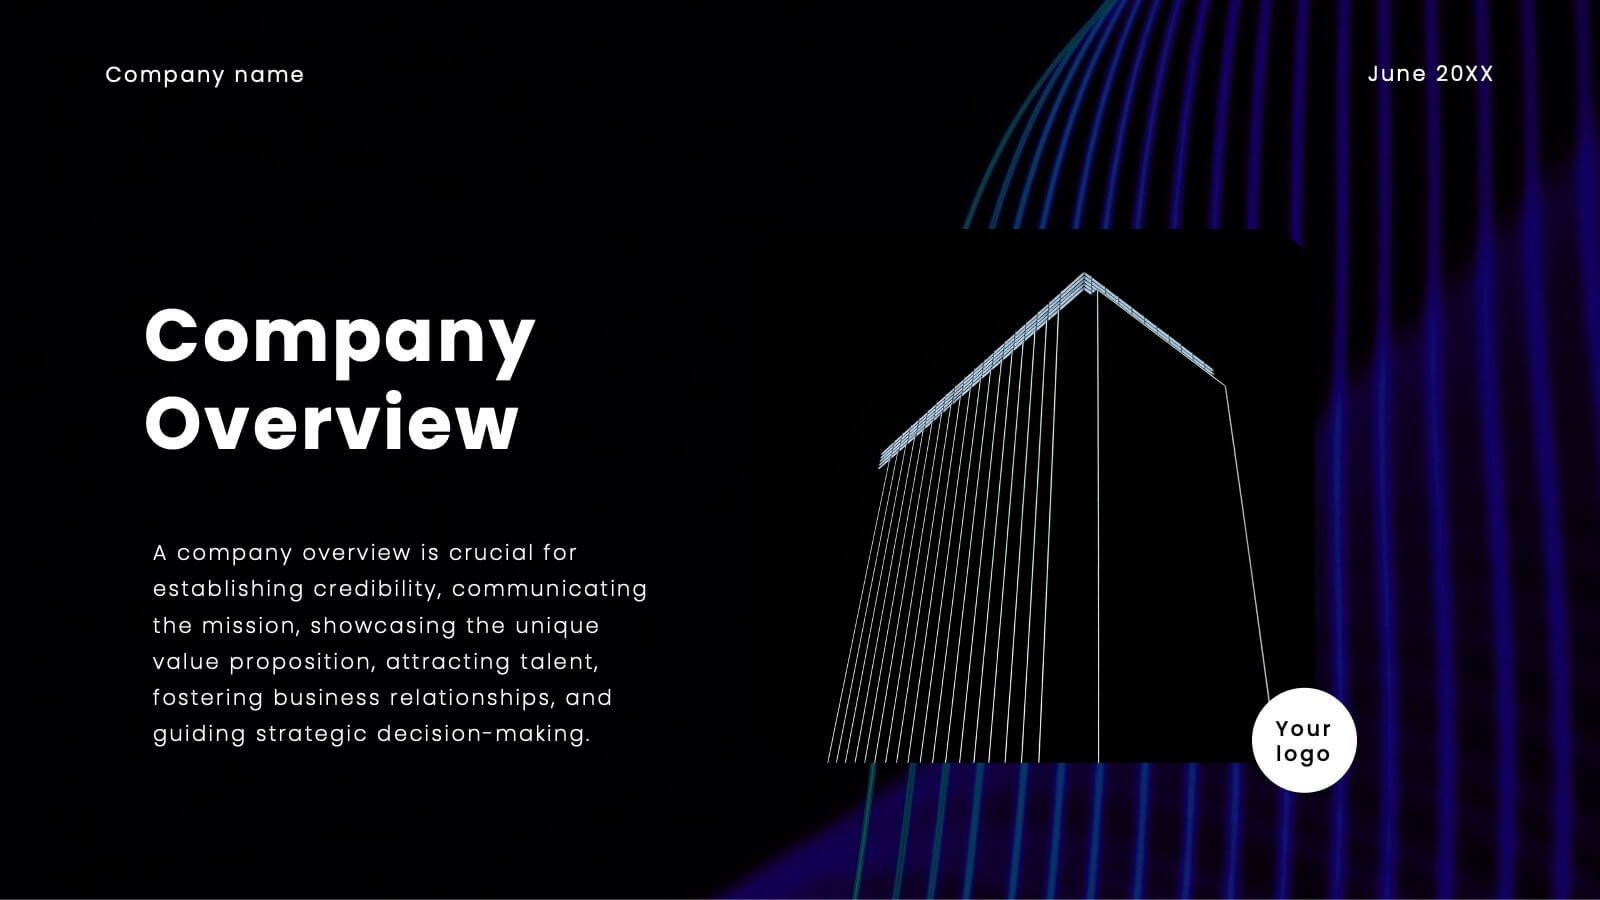
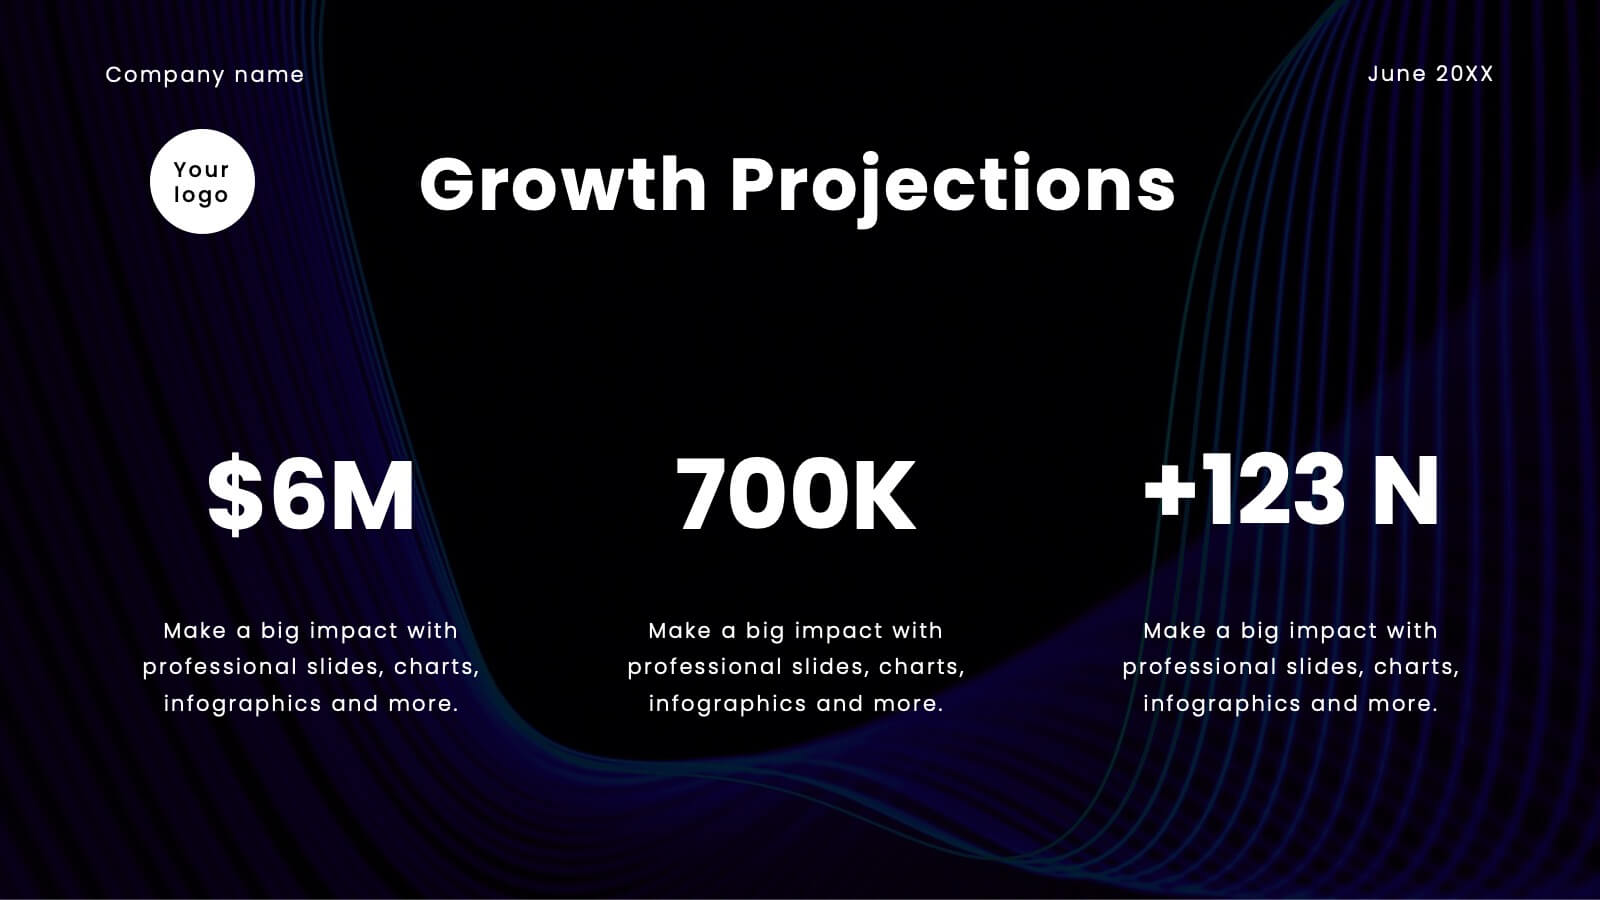
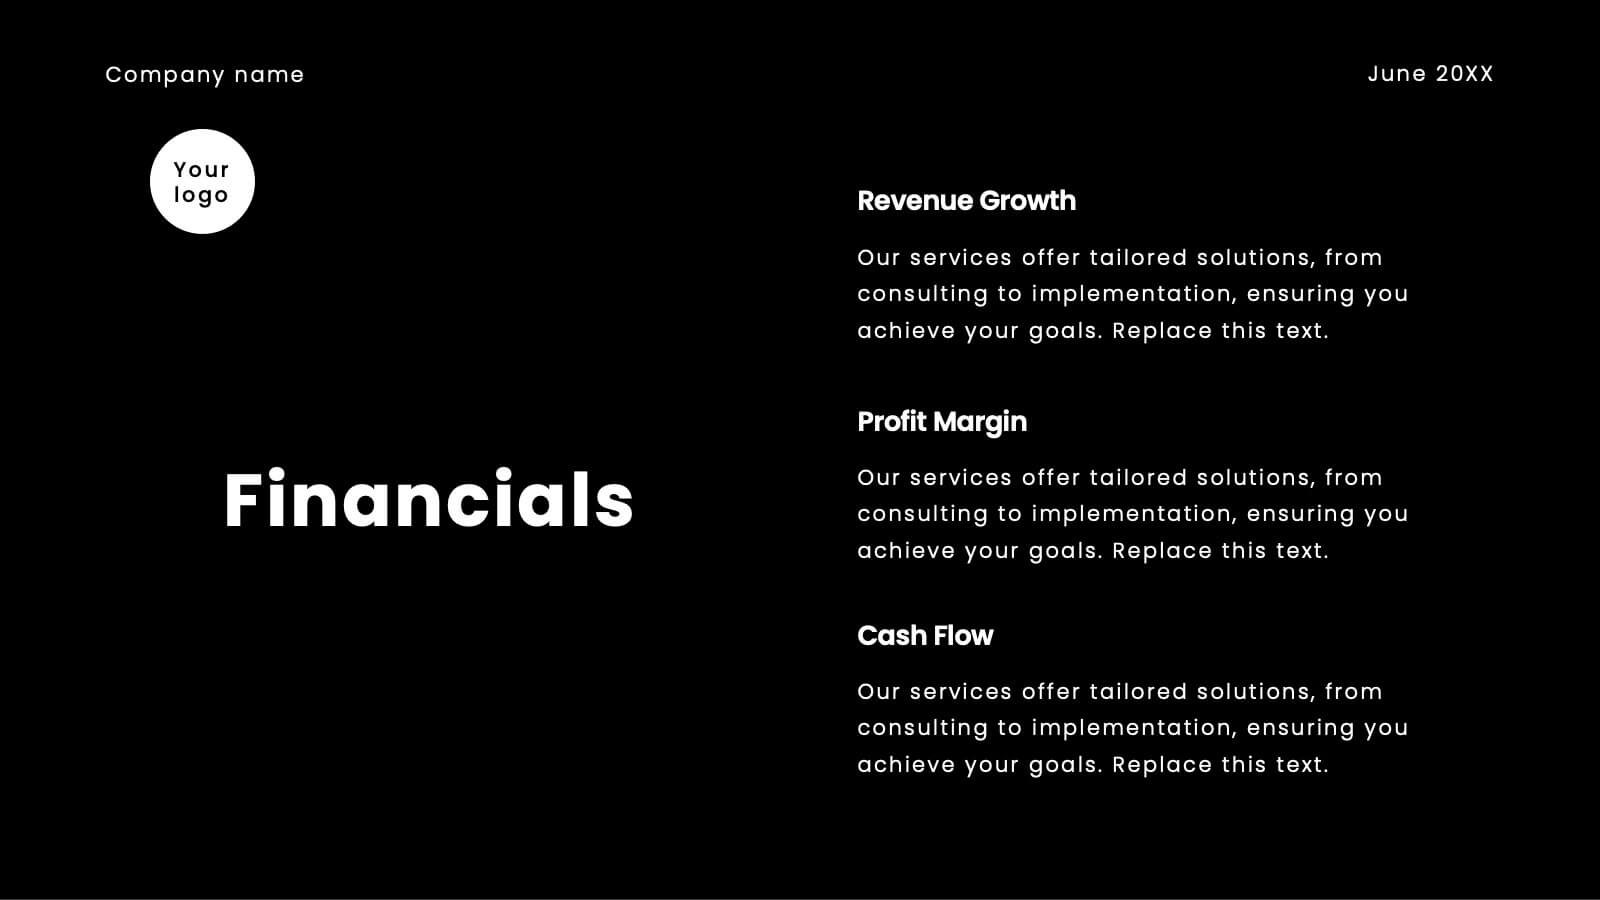
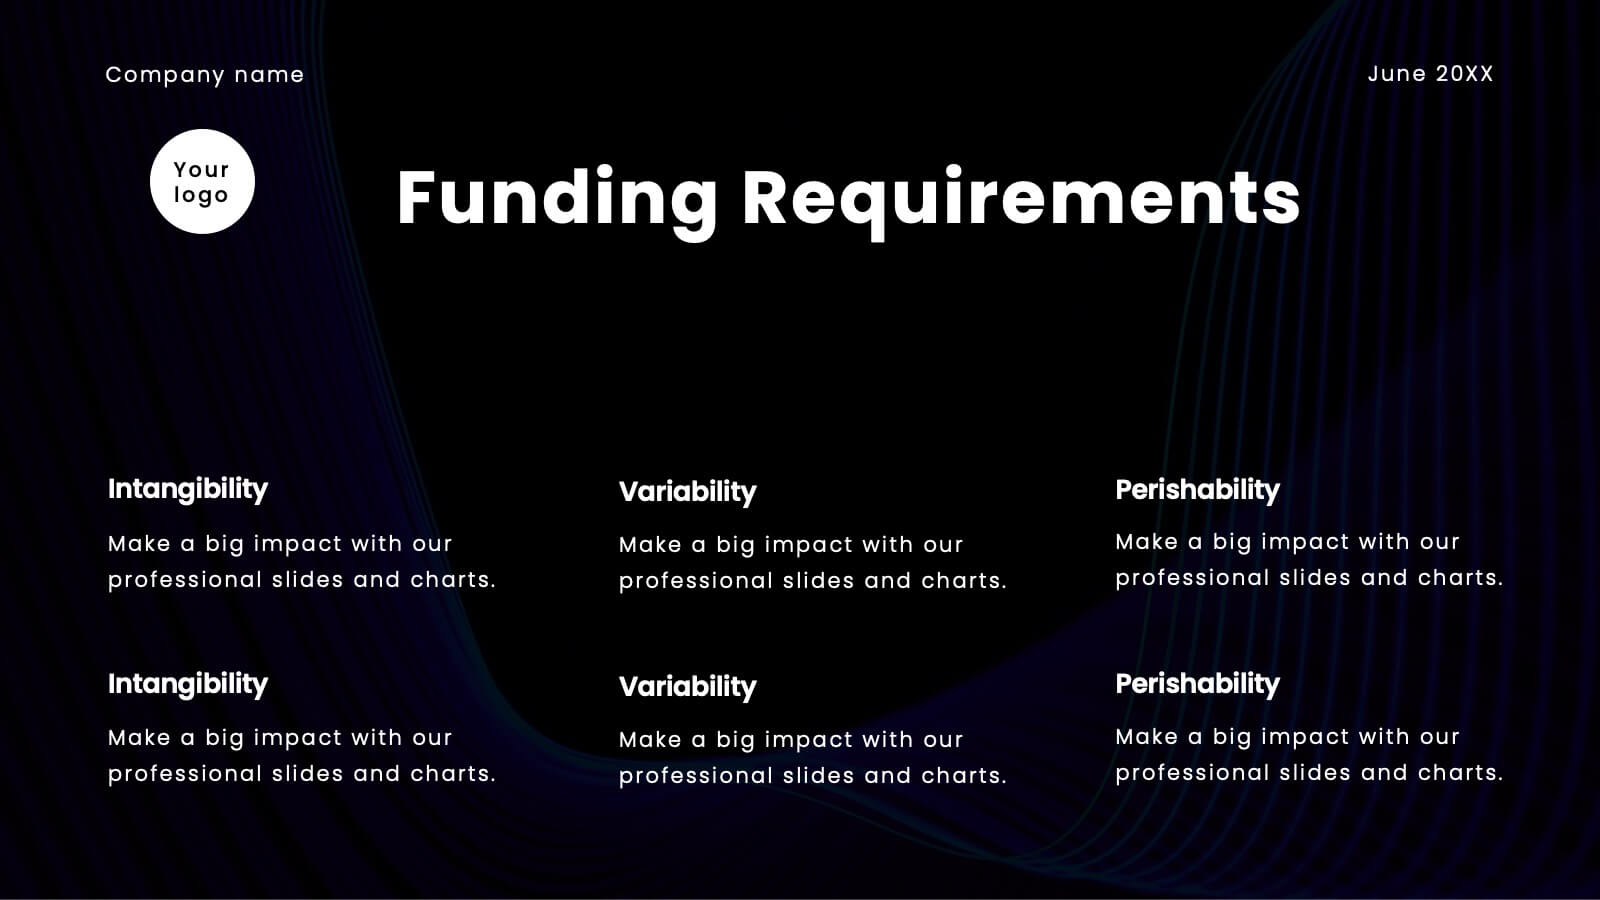
Jolt Business Idea Pitch Deck Presentation
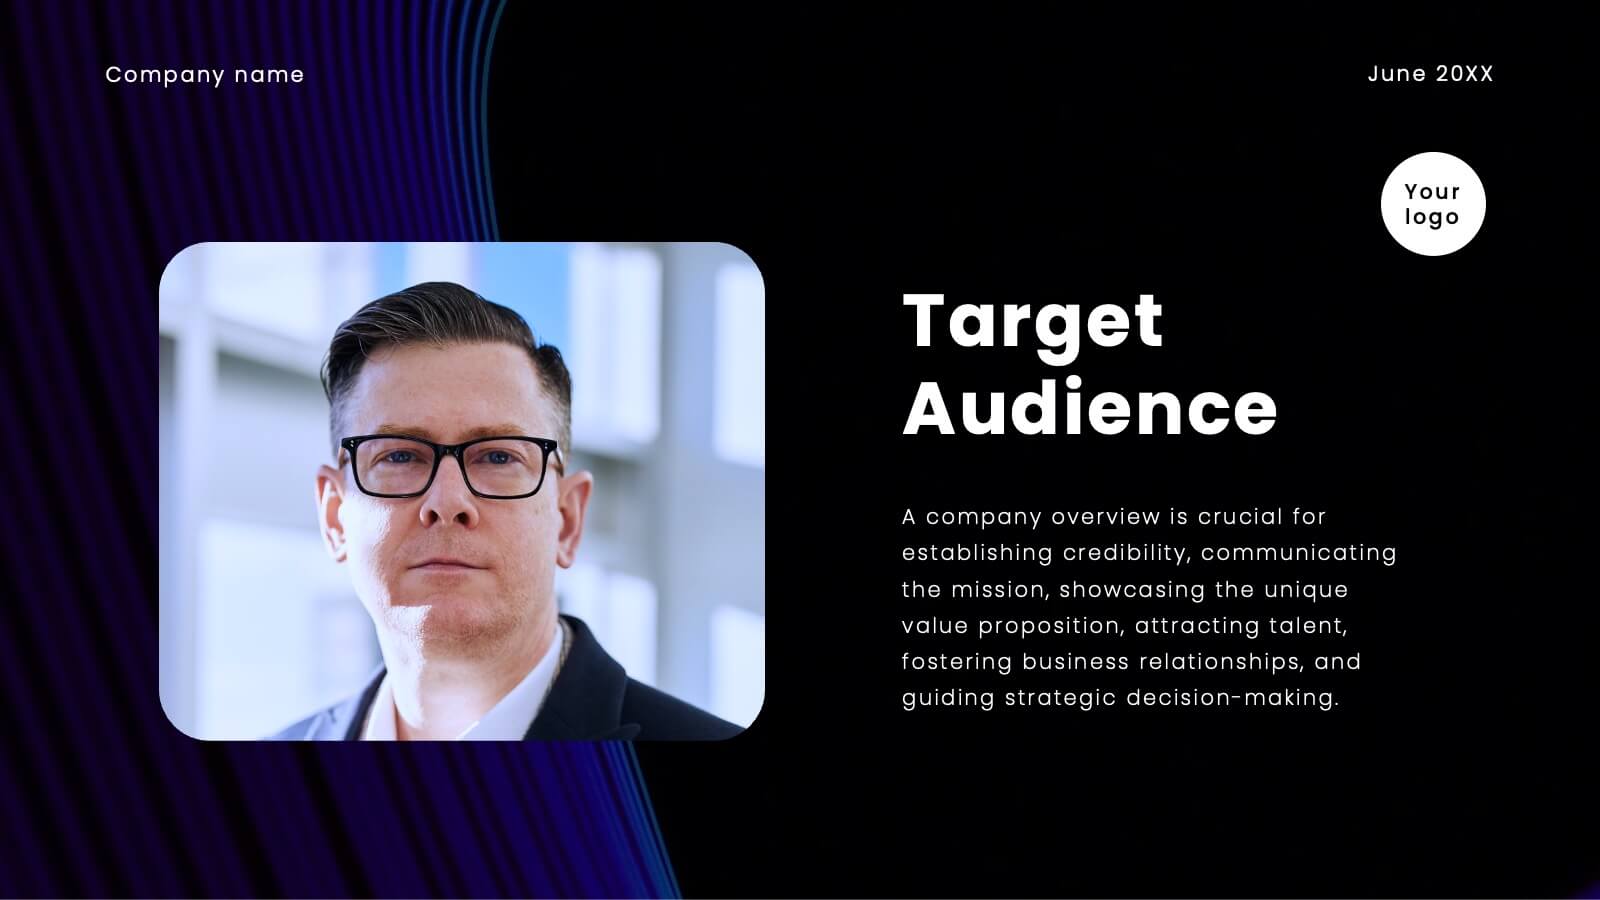
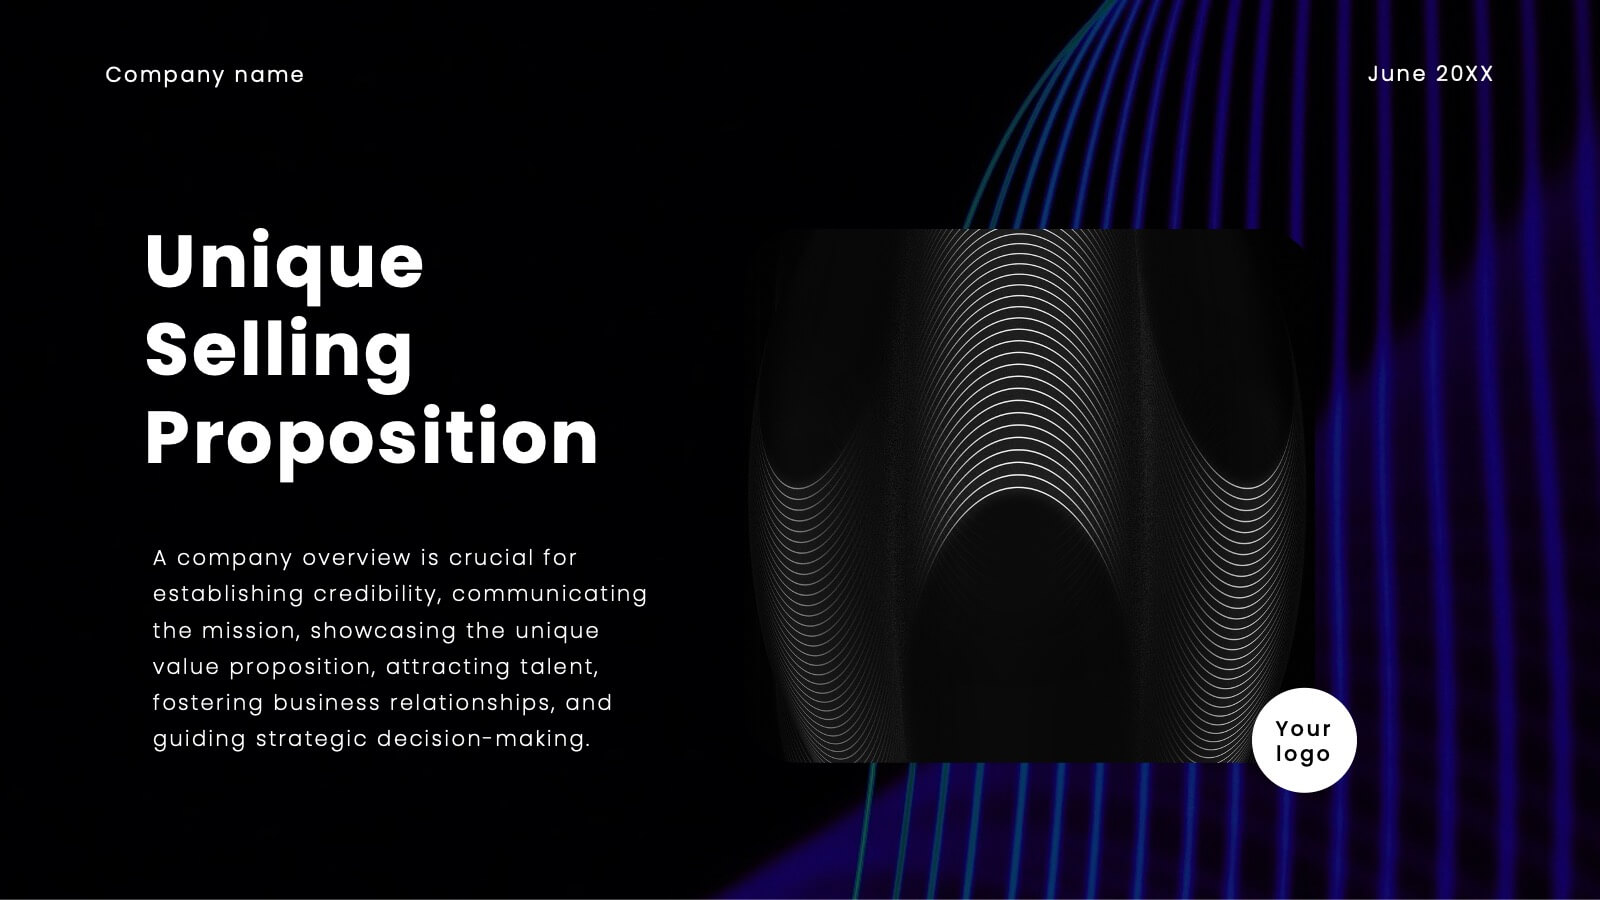
Prepare to electrify your audience with a pitch deck that’s nothing short of spectacular! This high-impact template is designed to captivate, engage, and persuade your stakeholders with every slide. It’s more than just a presentation; it’s your gateway to showcasing your company’s unique value proposition, innovative solutions, and future growth potential in a way that’s visually stunning and incredibly compelling. From the moment you unveil your company overview to the final slide on financials and funding requirements, this template ensures your pitch is memorable, powerful, and impossible to ignore. The sleek, modern design highlights your strategic vision, competitive advantages, and market opportunities, making a bold statement that you’re ready to lead the future. Compatible with PowerPoint, Keynote, and Google Slides, this pitch deck template is your ultimate tool for turning heads and securing buy-in from investors, partners, and clients alike!


6 slides
Platform-Specific Social Strategy Presentation
Break down your marketing approach by channel using this clear, platform-focused timeline. Highlight strategies for TikTok, Facebook, Instagram, X, and email in a linear, easy-to-read format. Ideal for digital marketers, content teams, and social media managers. Fully editable in PowerPoint, Keynote, and Google Slides to match your brand and strategy.


26 slides
Fundraising Event Presentation
Inspire generosity and support for your cause with our Fundraising Event presentation template, ideal for PowerPoint, Keynote, and Google Slides. This template is crafted with non-profit organizations, charity foundations, and event coordinators in mind, featuring a heartwarming design that encourages giving and communal effort. The slides are tailored to highlight the importance of philanthropy, with 'big image slides' to tell the stories of those you're helping, 'process infographics' to explain how donations are used, and 'chart slides' to show the impact of collected funds. The soothing color palette and thoughtful graphics create an atmosphere of hope and solidarity. Our Fundraising Event template is more than just a collection of slides; it's a powerful storytelling tool that can galvanize audiences into action. Download it now to create a moving presentation that not only shares the vision of your event but also rallies the community around your noble cause.


12 slides
Sales Metrics Dashboard Presentation
Unlock a sharper view of your sales story with a clean, data-driven layout that highlights performance trends at a glance. This presentation organizes KPIs, charts, and progress indicators into an easy-to-follow dashboard that supports smarter decision-making. Fully compatible with PowerPoint, Keynote, and Google Slides.


5 slides
Retention and Loyalty Program Benefits Presentation
Showcase the value of your loyalty strategy with the Retention and Loyalty Program Benefits presentation. This template clearly communicates reward tiers, membership perks, and engagement incentives using a card-based visual structure. Perfect for marketing presentations, customer success teams, and subscription-based business models. Fully customizable in PowerPoint, Keynote, and Google Slides.


6 slides
Market Trends and Risk Analysis with PESTEL Presentation
Present strategic insights with clarity using this Market Trends and Risk Analysis with PESTEL slide. Ideal for business consultants, marketers, and strategic planners, this slide helps dissect external factors—Political, Economic, Sociocultural, Technological, Environmental, and Legal—into clearly labeled segments using a modern hexagonal layout. Each section offers dedicated space for brief analysis or key data points, making it perfect for risk assessment, market evaluation, and forecasting discussions. Easily customizable in PowerPoint, Keynote, and Google Slides.


22 slides
SEO Report Presentation
Optimize your SEO strategies using our comprehensive SEO Report template. It includes sections for keyword performance, market trends, competitor insights, and client feedback. Tailored for digital marketers and SEO specialists, this template supports presentations in PowerPoint, Keynote, and Google Slides.


6 slides
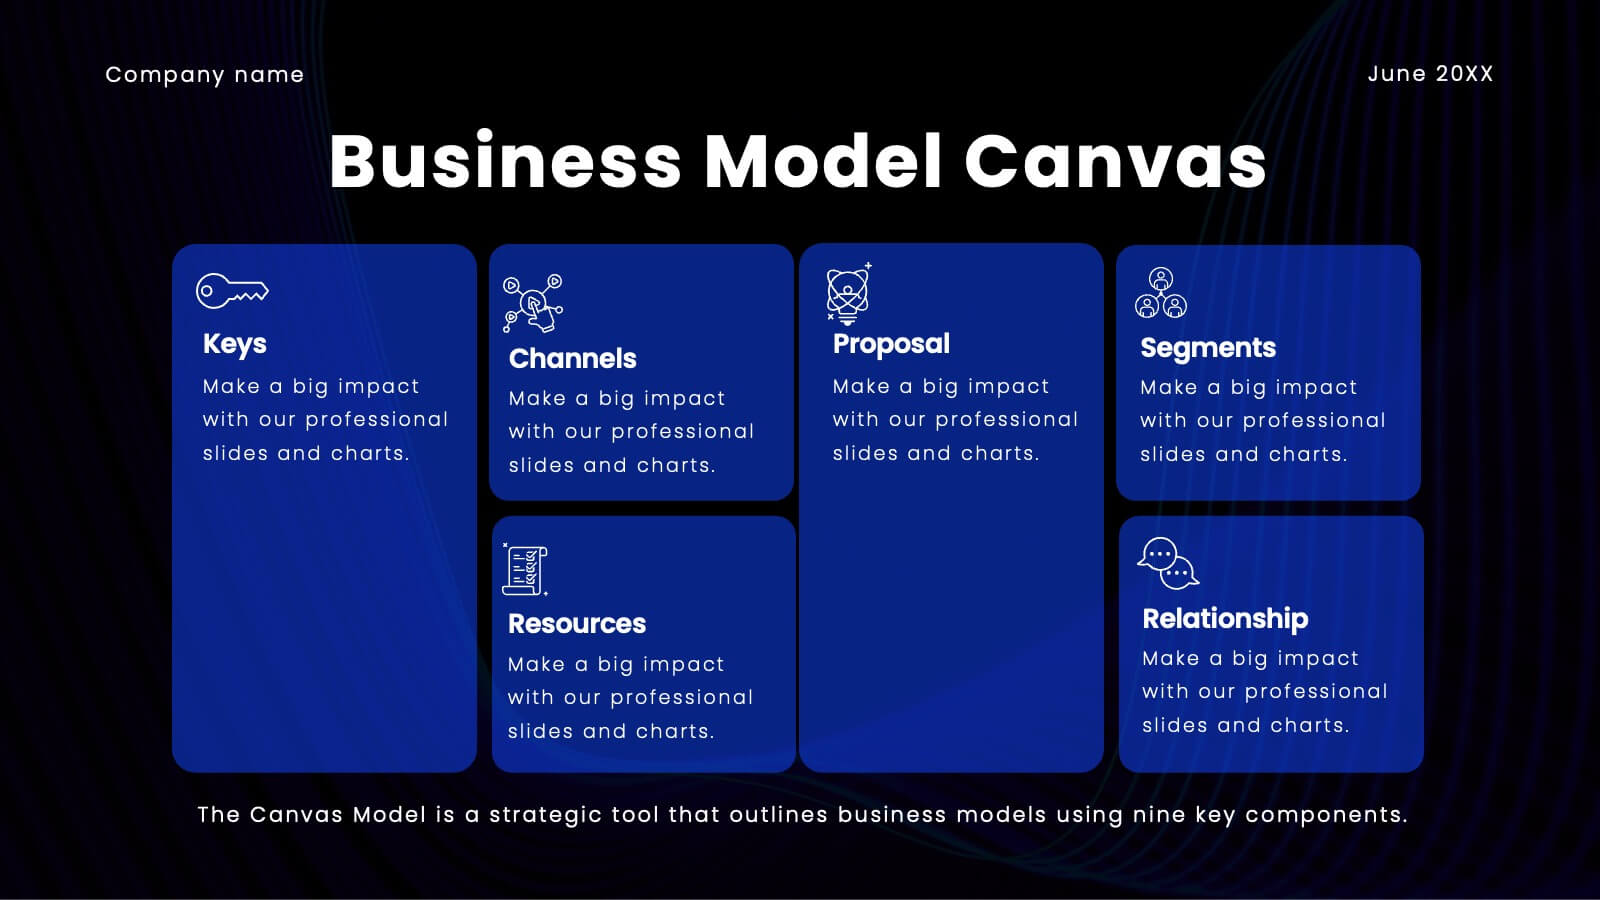
Startup Business Validation Plan Presentation
Present your startup’s validation strategy with this structured, color-coded framework. Ideal for mapping business assumptions, customer segments, and testing stages. Includes five top-phase boxes and supporting rows for team input or feedback. Fully editable in PowerPoint, Keynote, or Google Slides—perfect for founders, incubators, or pitch decks.
6 slides
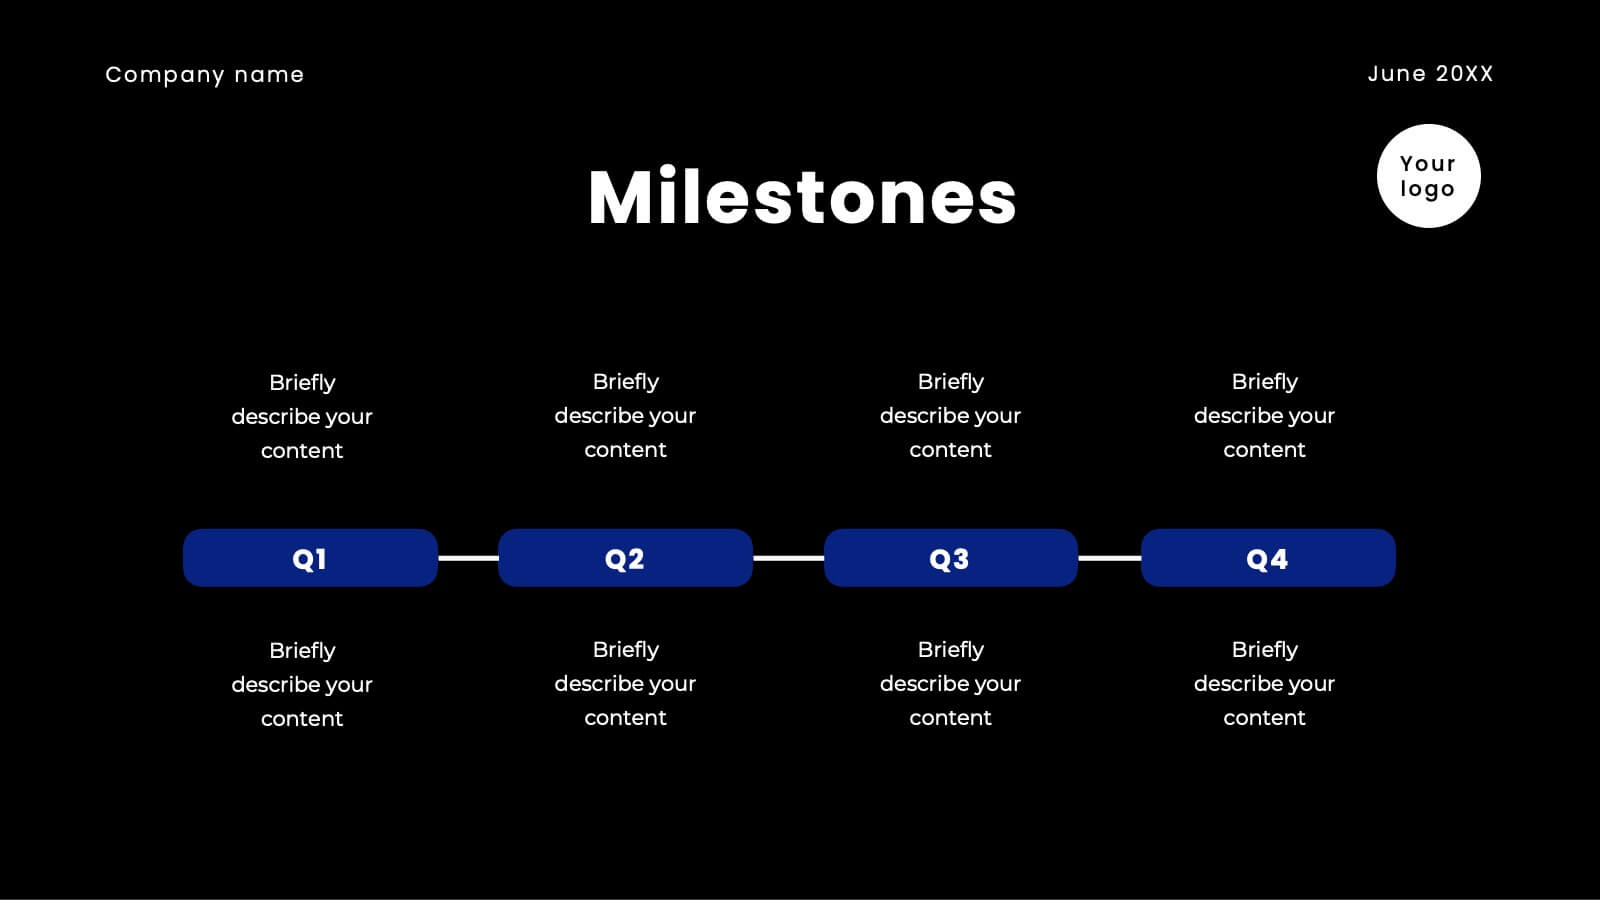
Team Objective Tracker and Milestone Plan Presentation
Stay on top of team goals with the Team Objective Tracker and Milestone Plan Presentation. Designed for performance reviews, progress reports, or planning meetings, this template visualizes KPIs with clarity. Each slide is fully customizable in PowerPoint, Keynote, or Google Slides—ideal for project leads and department managers.


7 slides
PESTEL Framework Business Presentation
The "PESTEL Framework Business" presentation effectively utilizes a segmented color scheme to categorize different environmental factors impacting business strategy: Political, Economic, Social, Technological, Environmental, and Legal. Each segment is color-coded and designated space for text, making it easy to highlight how each factor can influence business operations and decision-making processes. This visual arrangement not only aids in easy comprehension but also allows for a systematic review of external factors, essential for strategic planning.