


Features
- 7 Unique slides
- Fully editable and easy to edit in Microsoft Powerpoint, Keynote and Google Slides
- 16:9 widescreen layout
- Clean and professional designs
- Export to JPG, PDF or send by email


Do you have any questions?
Recommend


6 slides
Child Development Psychology Presentation
Bright colors and geometric birds bring this slide to life, making complex concepts easy to follow. This presentation template simplifies the key stages of emotional and psychological growth in children, helping you explain theories and behaviors clearly. Compatible with PowerPoint, Keynote, and Google Slides for seamless use across platforms.


5 slides
Impacts of Fake News Infographics
Fake News refers to deliberately false or misleading information presented as factual news. The spread of fake news can have significant impacts on individuals, society, and even the democratic process. With this infographic template, you can effectively communicate the far-reaching consequences of fake news and encourage critical thinking and media literacy. Whether you're presenting to a classroom, sharing on social media, or creating educational materials, this template serves as a powerful tool to raise awareness and promote responsible consumption of information in the digital era. Compatible with Powerpoint, Keynote, and Google Slides.


6 slides
Sports Training Program Presentation
Get ready to energize your audience with a slide that feels fast, motivating, and built for action. This presentation helps you outline key training steps, performance goals, and athletic milestones in a clean, visual way that keeps information clear and engaging. Fully compatible with PowerPoint, Keynote, and Google Slides.


4 slides
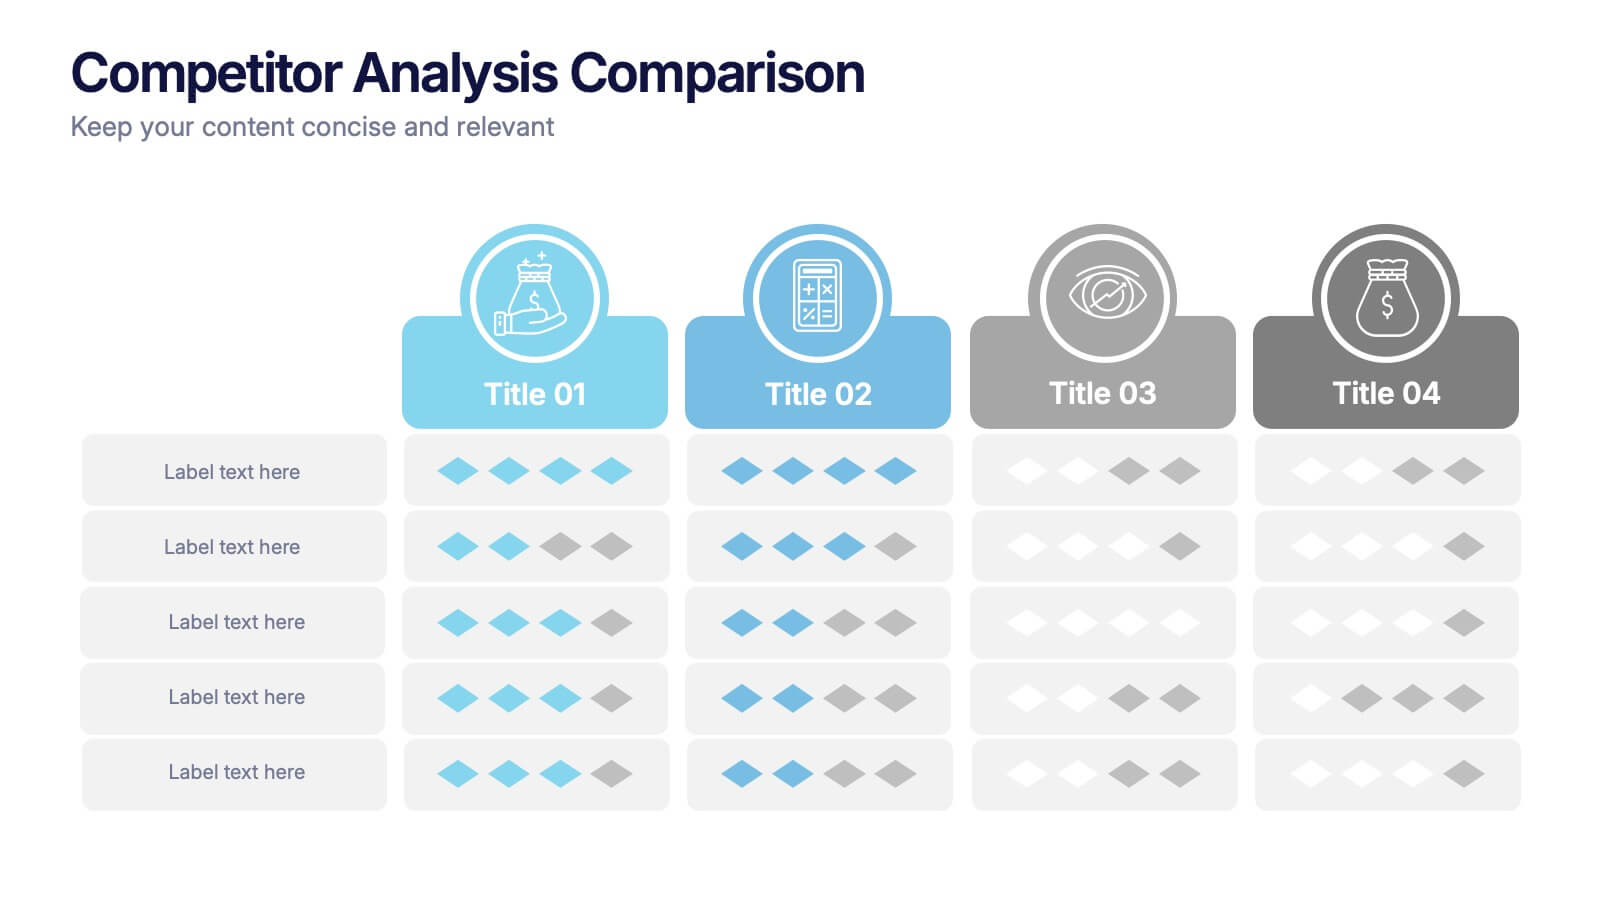
Competitor Analysis Comparison Presentation
Quickly evaluate strengths and weaknesses across your market landscape with this Competitor Analysis Comparison Presentation. Featuring clean tables, icons, and rating visuals, it's ideal for highlighting where your brand stands out. Fully editable in PowerPoint, Keynote, and Google Slides.
6 slides
Arrow Segments for Goal Tracking Presentation
Clearly define objectives and measure performance with the Arrow Segments for Goal Tracking Presentation. This visually engaging dartboard-style layout is perfect for showcasing KPIs, targets, or strategic milestones. Each arrow represents a key focus area, allowing you to highlight priorities and progress. Fully customizable in PowerPoint, Google Slides, and Canva.


5 slides
Demographic and Psychographic Segments Presentation
Break down your audience with clarity using the Demographic and Psychographic Segments Presentation. This slide is ideal for showcasing four key consumer dimensions through a centered circular layout and quadrant icons. Perfect for marketing campaigns, branding strategies, and audience targeting. Fully editable in Canva, PowerPoint, Keynote, or Google Slides.


5 slides
Risk Assessment Heat Map Presentation
Evaluate risks effectively with a structured heat map. This Risk Assessment Heat Map helps visualize potential threats by mapping probability and impact levels. Ideal for risk management, business continuity planning, and decision-making. Fully customizable and compatible with PowerPoint, Keynote, and Google Slides for professional and seamless integration.


6 slides
Growth Through Lifelong Learning Presentation
Visualize personal or organizational development with this creative lifelong learning slide. Featuring a human head silhouette and puzzle piece graphics, it's perfect for illustrating stages of learning, training programs, or growth mindset principles. Fully editable in PowerPoint, Keynote, and Google Slides—ideal for educators, coaches, or corporate development professionals.


6 slides
North America Weather Map Infographics
Explore our customizable North America Weather Map infographic template, a valuable tool for understanding regional weather patterns. Compatible with PowerPoint, Keynote, and Google Slides, this template simplifies complex data into user-friendly visuals, allowing you to tailor it to your specific requirements. This infographic template offers a foundation for displaying current and historical weather data, temperature trends, precipitation patterns, and more. Whether you're a meteorologist, educator, or just curious, this template provides a versatile platform to create weather-related presentations that suit your unique needs. Impress your audience with this SEO-optimized North America Weather Map infographic template, designed for clarity and ease of use. Customize it to stay informed, plan outdoor activities, and effectively communicate weather information. Get started with your customized infographic today!


6 slides
Target Market Stock Infographic
The target market refers to the specific group of individuals or businesses that a company aims to reach and serve with its products or services. The goal of this infographic template is to provide a overview of your target market, allowing marketers and businesses to craft more personalized and effective marketing strategies. This template is designed to identify and understand that the market is a crucial aspect of marketing and business strategy. This template will help you tailor offerings and marketing efforts to meet the needs of your intended audience. Create marketing campaigns that resonate with your viewers.


7 slides
Analyze Survey Results Infographic
Survey results refer to the outcomes and findings obtained from a survey conducted to gather information, opinions, feedback, or data from a specific group of individuals or a target audience. This visually appealing and insightful infographic template transforms survey findings into captivating visuals, enabling you to grasp trends, patterns, and valuable insights at a glance. Compatible with Powerpoint, Keynote, and Google Slides. This provides valuable insights and analysis based on the responses collected. Our infographic is a common research method used in various fields, including business, academia, social sciences, marketing, and more.


6 slides
Change Management Model Infographics
Navigate organizational change effectively with our Change Management Model infographic template. This template is fully compatible with popular presentation software like PowerPoint, Keynote, and Google Slides, allowing you to easily customize it to illustrate and communicate the key components of a change management model. The Change Management Model infographic template offers a visually engaging platform to outline the stages, strategies, and best practices for managing change within an organization. Whether you're a change management professional, business leader, or team member involved in change initiatives, this template provides a user-friendly canvas to create informative presentations and educational materials. Optimize your change management processes with this SEO-optimized Change Management Model infographic template, thoughtfully designed for clarity and ease of use. Customize it to showcase the change model you're using, steps involved, communication strategies, and the importance of addressing resistance to change. Ensure that your audience gains valuable insights into effective change management. Start crafting your personalized infographic today to navigate change with confidence.


7 slides
Matrix System Diagram Infographic
A matrix diagram is a visual representation of data in a matrix format, commonly used to analyze the relationships between two or more sets of items. This infographic template is a valuable tool in various fields including business, project management, quality management, and decision-making processes. Compatible with Powerpoint, Keynote, and Google Slides. This is designed to help you present intricate relationships, structures, and data in a clear and visually engaging way. Whether you're illustrating business strategies, decision matrices, or organizational hierarchies, this template simplifies complexity.


5 slides
Social Media Strategy Infographic
Social Media refers to digital platforms and websites that allow users to create and share content, engage with others, and participate in online communities. This presentation template is a powerful tool to help you create a comprehensive social media strategy. It provides a visually appealing and easy-to-understand overview of the key elements of a successful social media strategy. Use this template to plan and communicate your social media strategy effectively, ensuring that you make the most of your social media presence and engage your target audience efficiently. This template is compatible with Powerpoint, Keynote, and Google Slides.


12 slides
Corporate Growth Strategy Steps Presentation
Showcase your expansion roadmap with this Corporate Growth Strategy Steps Presentation. Designed as a five-step vertical ladder, this layout is perfect for illustrating progressive stages like market entry, development, scaling, innovation, and leadership. Each level includes editable icons and text placeholders for clarity and customization. Fully compatible with PowerPoint, Keynote, and Google Slides.


7 slides
Responsibility Assignment Matrix Infographic Presentation Template
The Responsibility Assignment Matrix is a graphical tool used to visually represent the various assignments and the roles of each individual in a project. It helps in better understanding who is responsible for what, and who is accountable for results. This is a matrix that identifies the key tasks involved in a project, and maps them to the individuals responsible for completing them. Use this template to emphasizes on the role of managers and the organizational goals. This simple template is designed to help teams create an effective accountability model, perfect for your next project!


10 slides
Human Resources Process Diagram
The "Human Resources Process Diagram" presentation template is designed to streamline the visualization of the HR process from analysis to evaluation. This template allows for a detailed display of the stages involved in HR processes, such as analyzing, designing, developing, implementing, and evaluating, making it ideal for training sessions, strategic HR presentations, and management meetings. The circular flow of the diagram emphasizes the continuous and interconnected nature of HR activities, facilitating better understanding and communication of complex processes. Each segment is color-coded for easy identification and reference, enhancing both the aesthetic appeal and the functionality of the presentation.