


Features
- 4 Unique slides
- Fully editable and easy to edit in Microsoft Powerpoint, Keynote and Google Slides
- 16:9 widescreen layout
- Clean and professional designs
- Export to JPG, PDF or send by email


Do you have any questions?
Recommend


5 slides
Tiered Strategy Framework Pyramid Presentation
Break down your plan into clear, actionable steps with this Tiered Strategy Framework Pyramid presentation. Each arrow-shaped tier helps visualize hierarchical strategies, workflows, or growth levels. Use this layout to communicate priorities, initiatives, or milestones in a sleek and modern format. Fully editable in Canva, PowerPoint, or Google Slides.


7 slides
Office Scenes Interview Infographic
Office Scenes refer to various activities, situations, or interactions that occur within a typical office environment. Embark on a visual journey through the dynamic world of interviews and office scenes with our office scenes interview infographic template. This visually appealing and informative template is tailored to give insights into the art of interviews, providing valuable tips and tricks for success within the corporate sphere. Compatible with Powerpoint, Keynote, and Google Slides. This template presents an enticing introduction to the world of interviews, setting the stage for a journey towards success and career growth.


5 slides
Health Benefits Infographics
Health Benefits refer to the positive effects that certain practices, behaviors, or conditions have on a person's physical, mental, and emotional well-being. These informative infographic templates are an effective tool to educate and motivate individuals to prioritize their health and make informed lifestyle choices. Its visually appealing design, concise information, and emphasis on positive outcomes will engage and inspire readers to take action towards a healthier and happier life. This template is designed to present key information in an appealing and concise manner, making it suitable for presentations, websites, social media posts, and educational materials.


5 slides
Business Gaps and Solutions Assessment Presentation
Spot the gaps and climb to clarity with this smart pyramid-style assessment design. Perfect for identifying weaknesses and matching them with targeted solutions, this layout helps teams visualize challenges at every level of the business. Use it to guide strategy with confidence. Works great in PowerPoint, Keynote, and Google Slides.


7 slides
Buyer Infographic
Discover the power of visual storytelling with our dynamic Infographic Template, designed to bring the buyer's journey to life in full color and engaging detail! Each slide is a palette of opportunity, with bold hues and intuitive layouts that transform standard data into a compelling narrative. This template is a marketer’s dream, perfect for delineating complex buyer behaviors, demographics, and decision processes in an easily digestible format. It leverages striking graphics and concise text to illuminate key insights that drive consumer actions, making it indispensable for presentations, reports, or online content. Customize to your heart’s content, adjusting colors, fonts, and layouts to align perfectly with your branding. Whether you're detailing market trends, consumer feedback, or purchase patterns, this template ensures your data not only informs but also inspires. Ideal for strategists, sales teams, and marketers, it's your secret weapon in crafting stories that not only tell but also sell.


4 slides
Country-Specific Data World Map Presentation
Visually highlight regional data insights with this sleek Country-Specific Data World Map slide. Designed for clarity and impact, this layout lets you present four key statistics or findings alongside a pinpointed global map. Each percentage and title is customizable—ideal for business growth, research, or market penetration analysis. Clean design ensures your message stands out. Fully editable and compatible with PowerPoint, Keynote, and Google Slides.


5 slides
Process Improvement Using Five Steps Framework Presentation
Visualize progress with clarity using the Process Improvement Using Five Steps Framework Presentation. This stepped layout helps you illustrate sequential actions, milestones, or improvements across five stages. Ideal for strategy, operations, or performance initiatives. Easy to customize in PowerPoint, Keynote, Google Slides, and Canva to fit your workflow needs.


20 slides
Legacy Product Launch Presentation
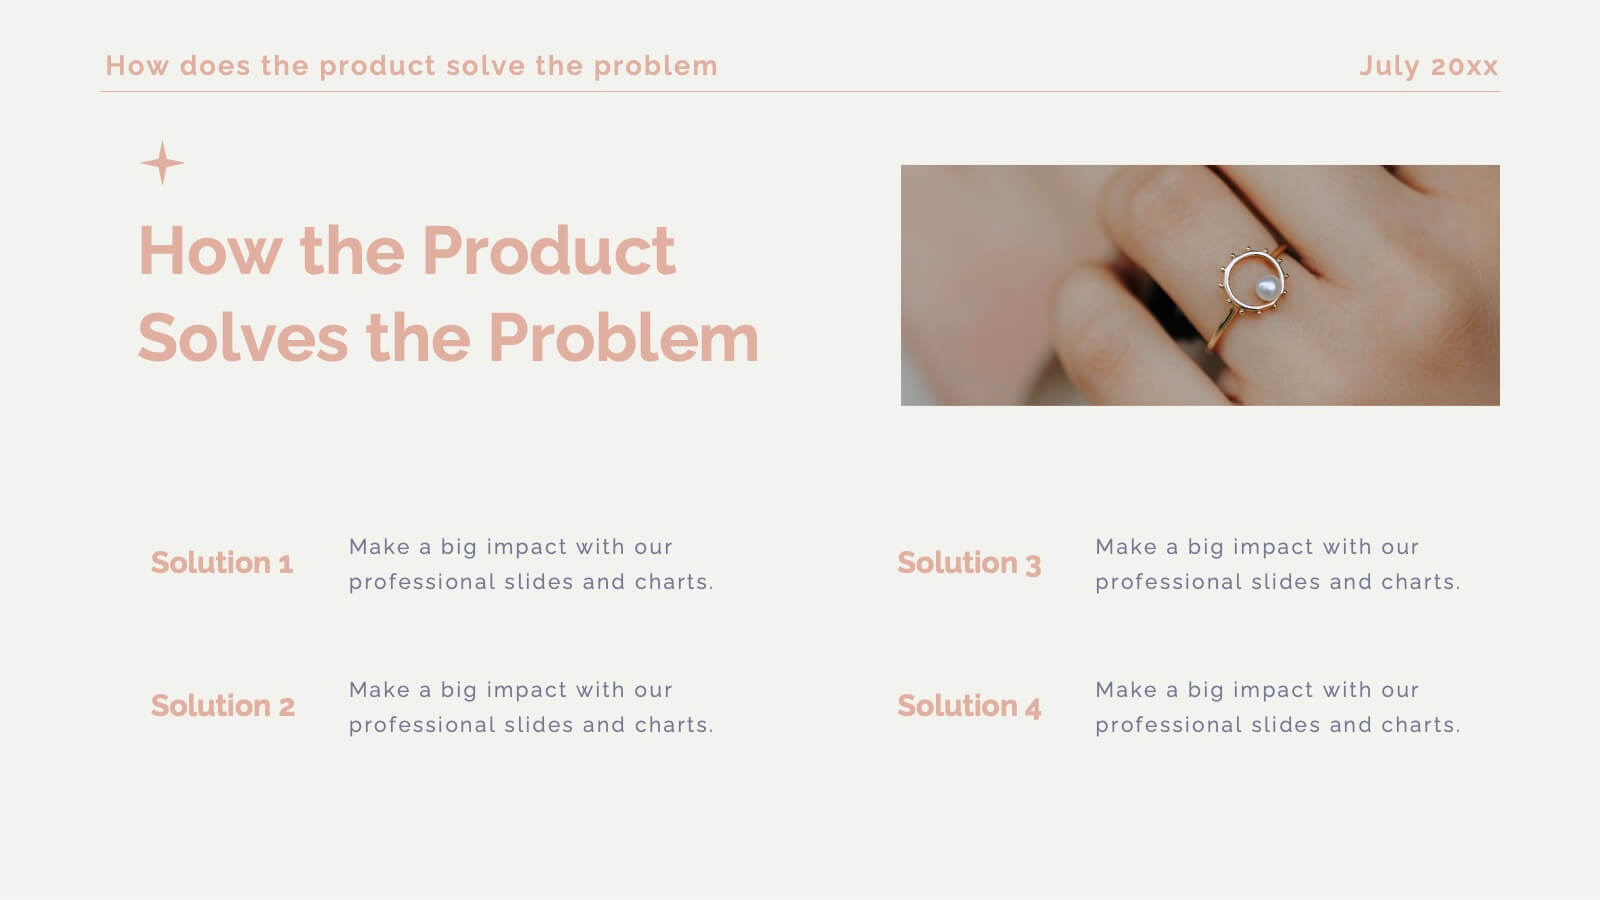
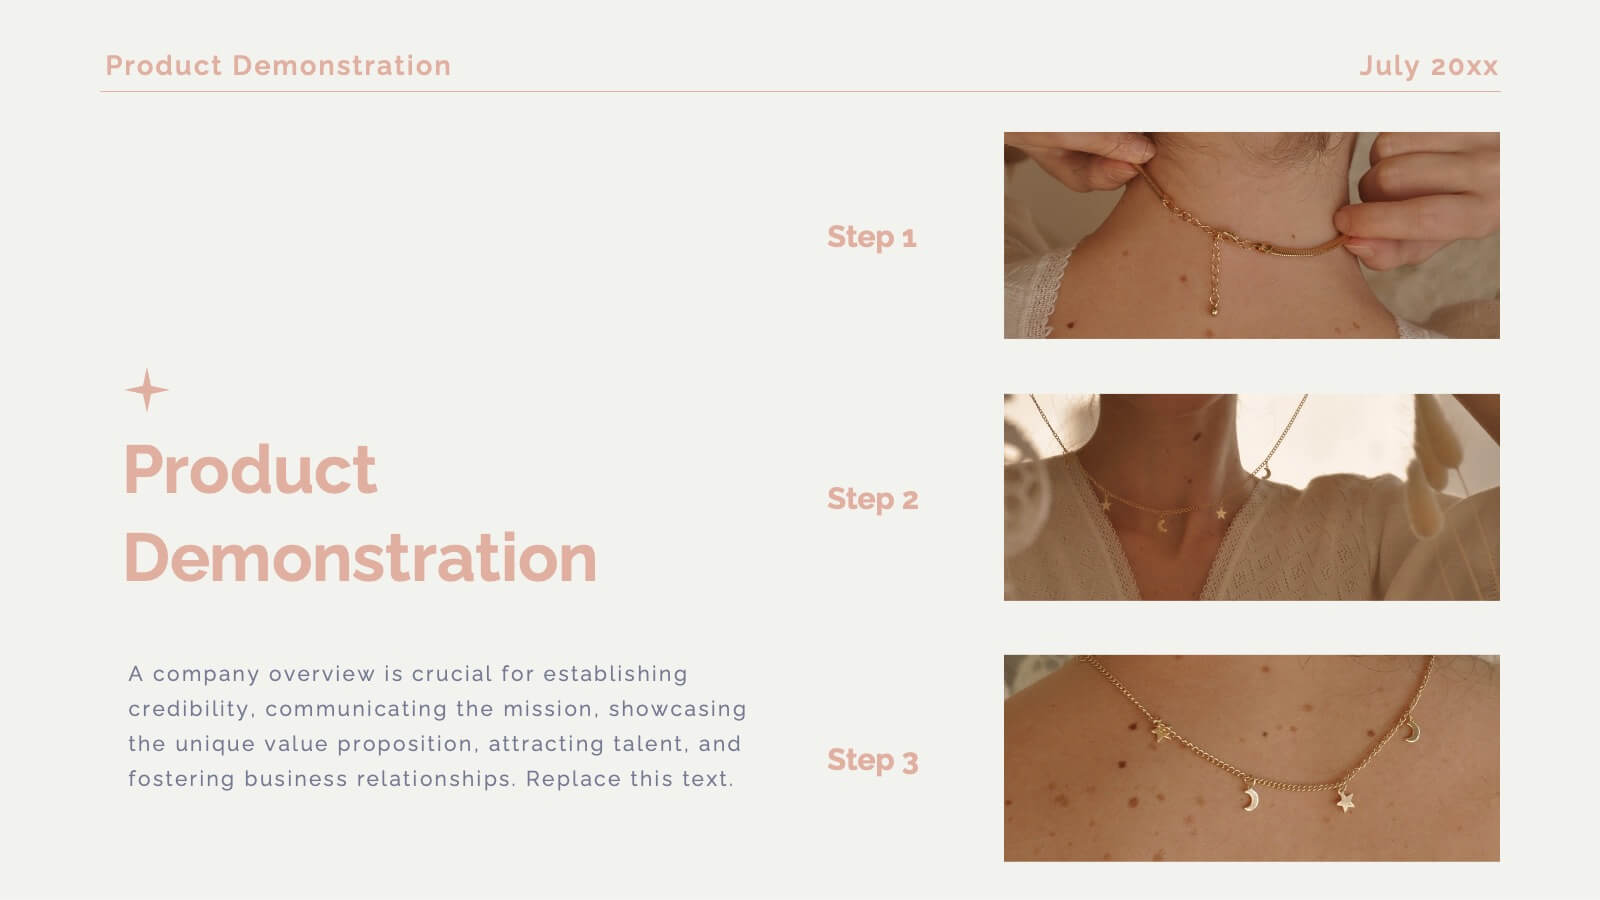
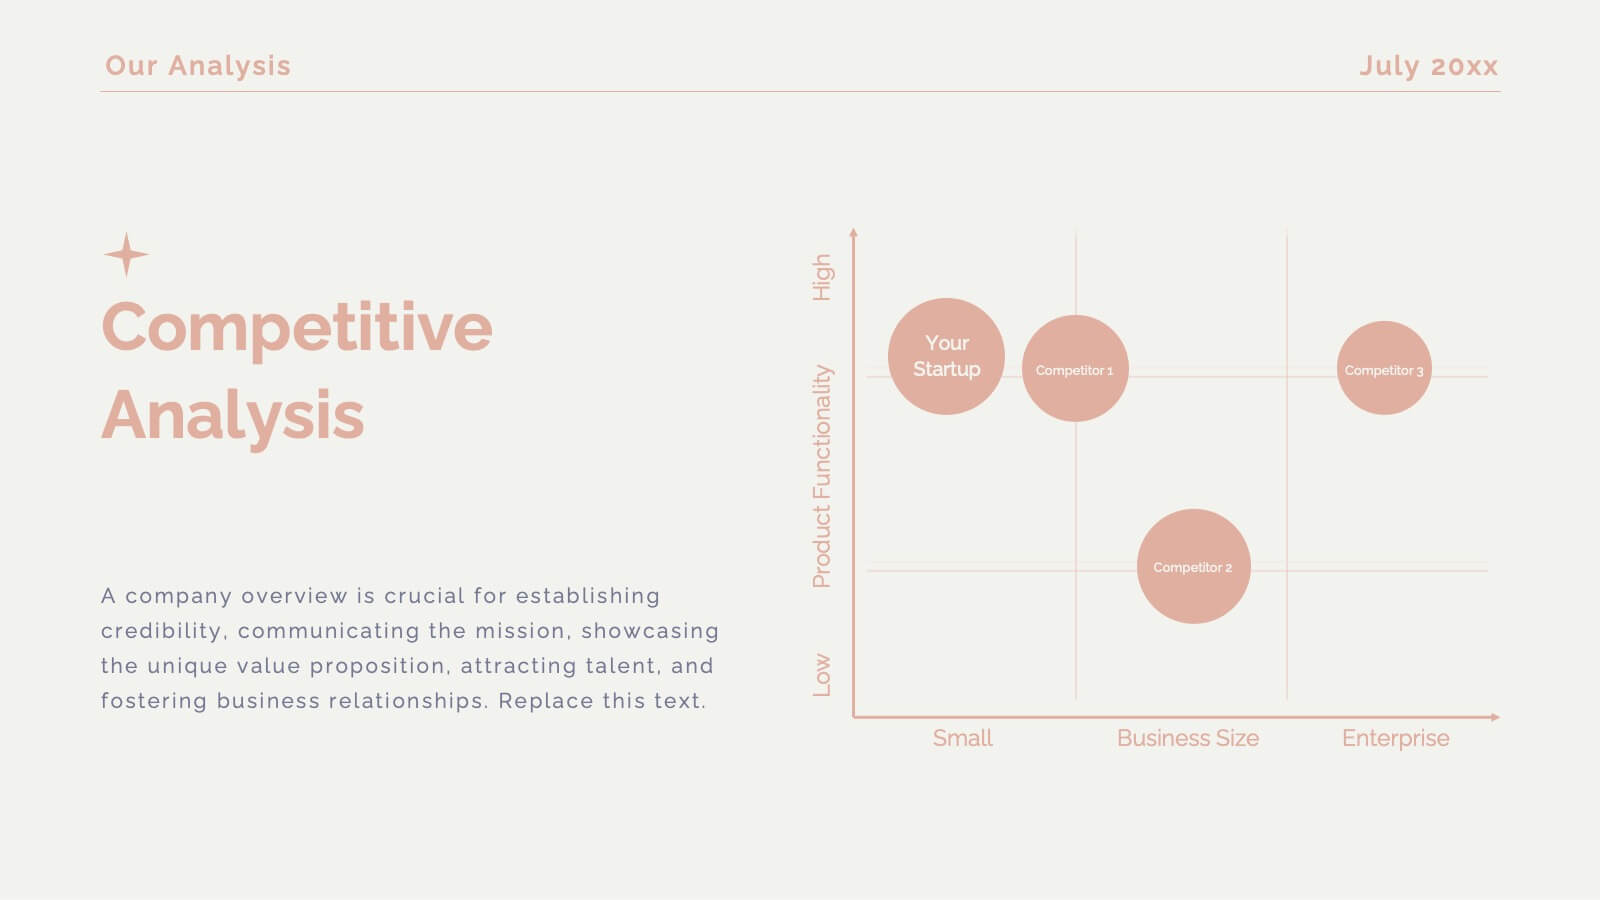
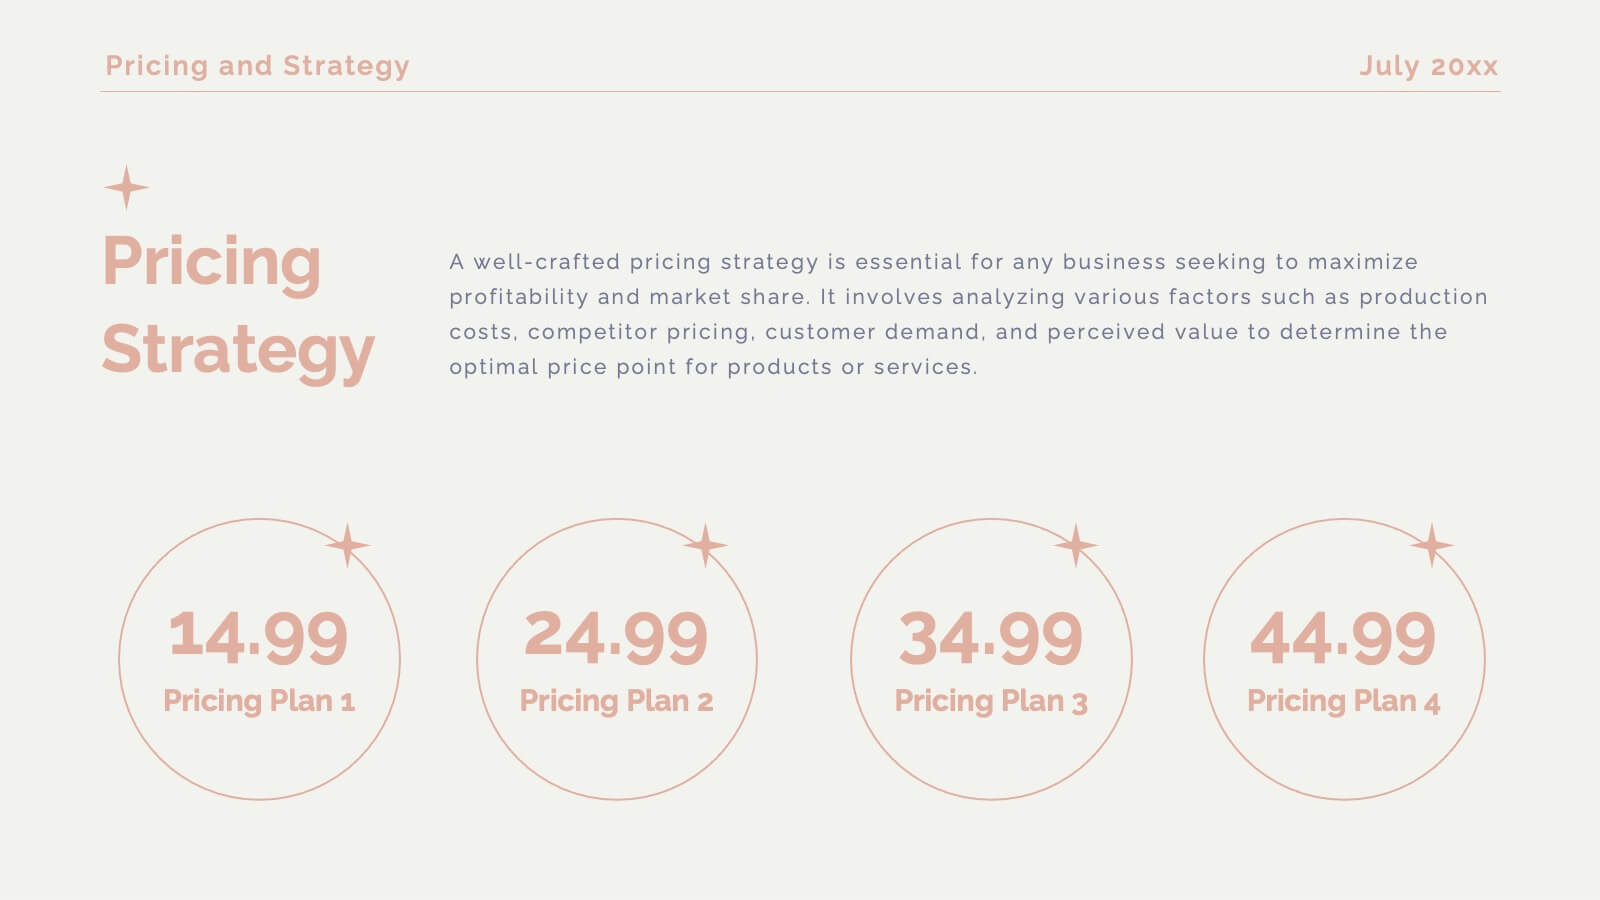
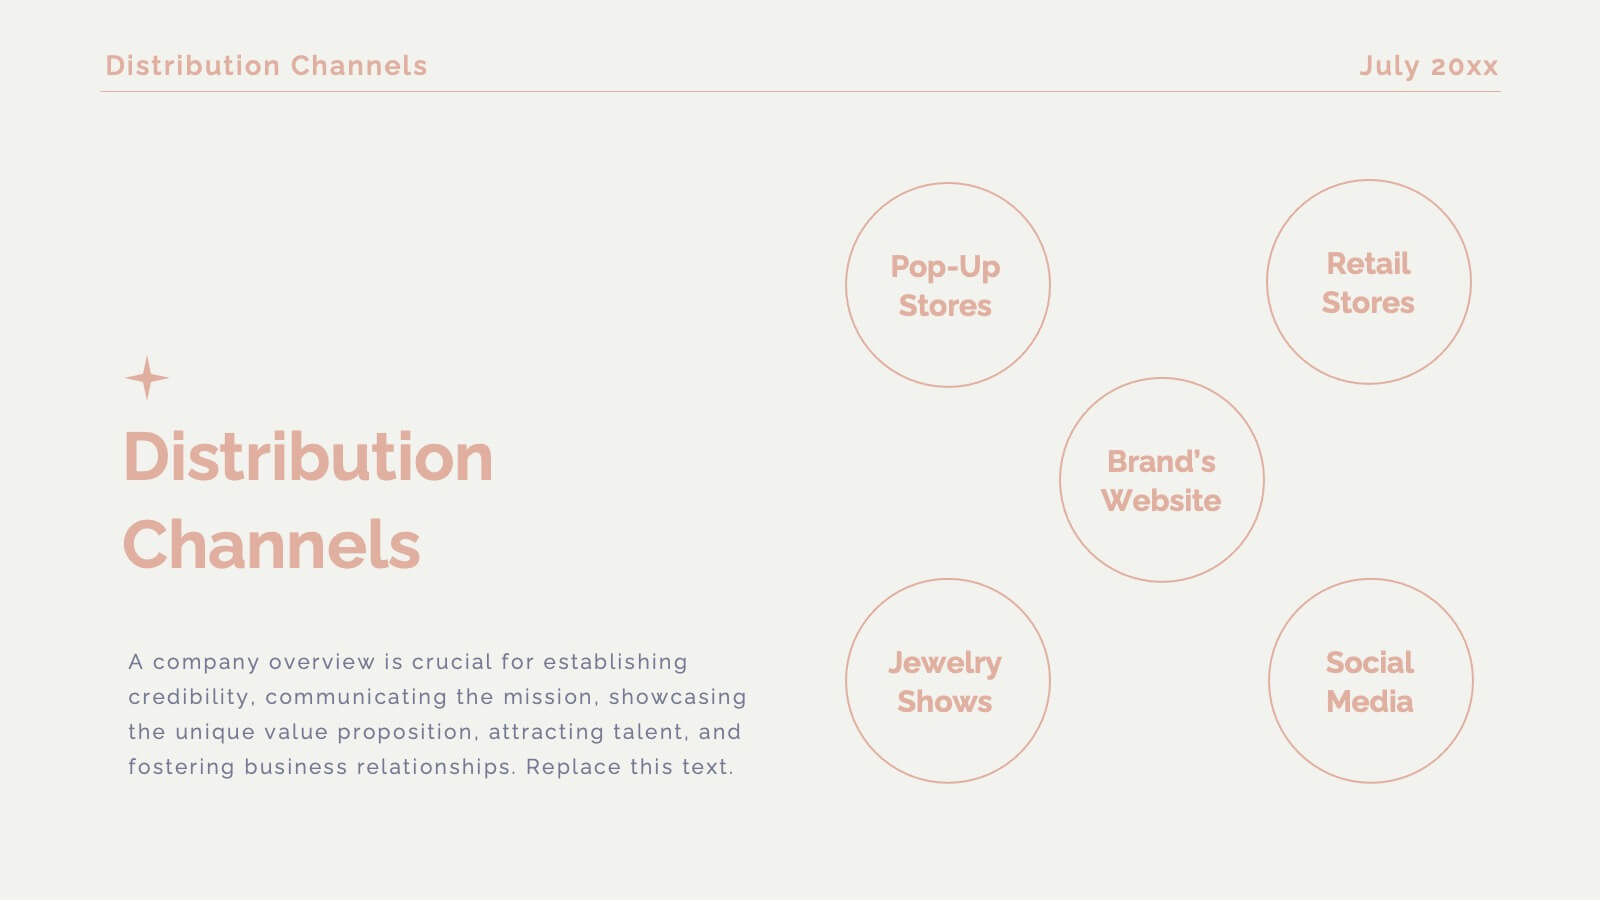
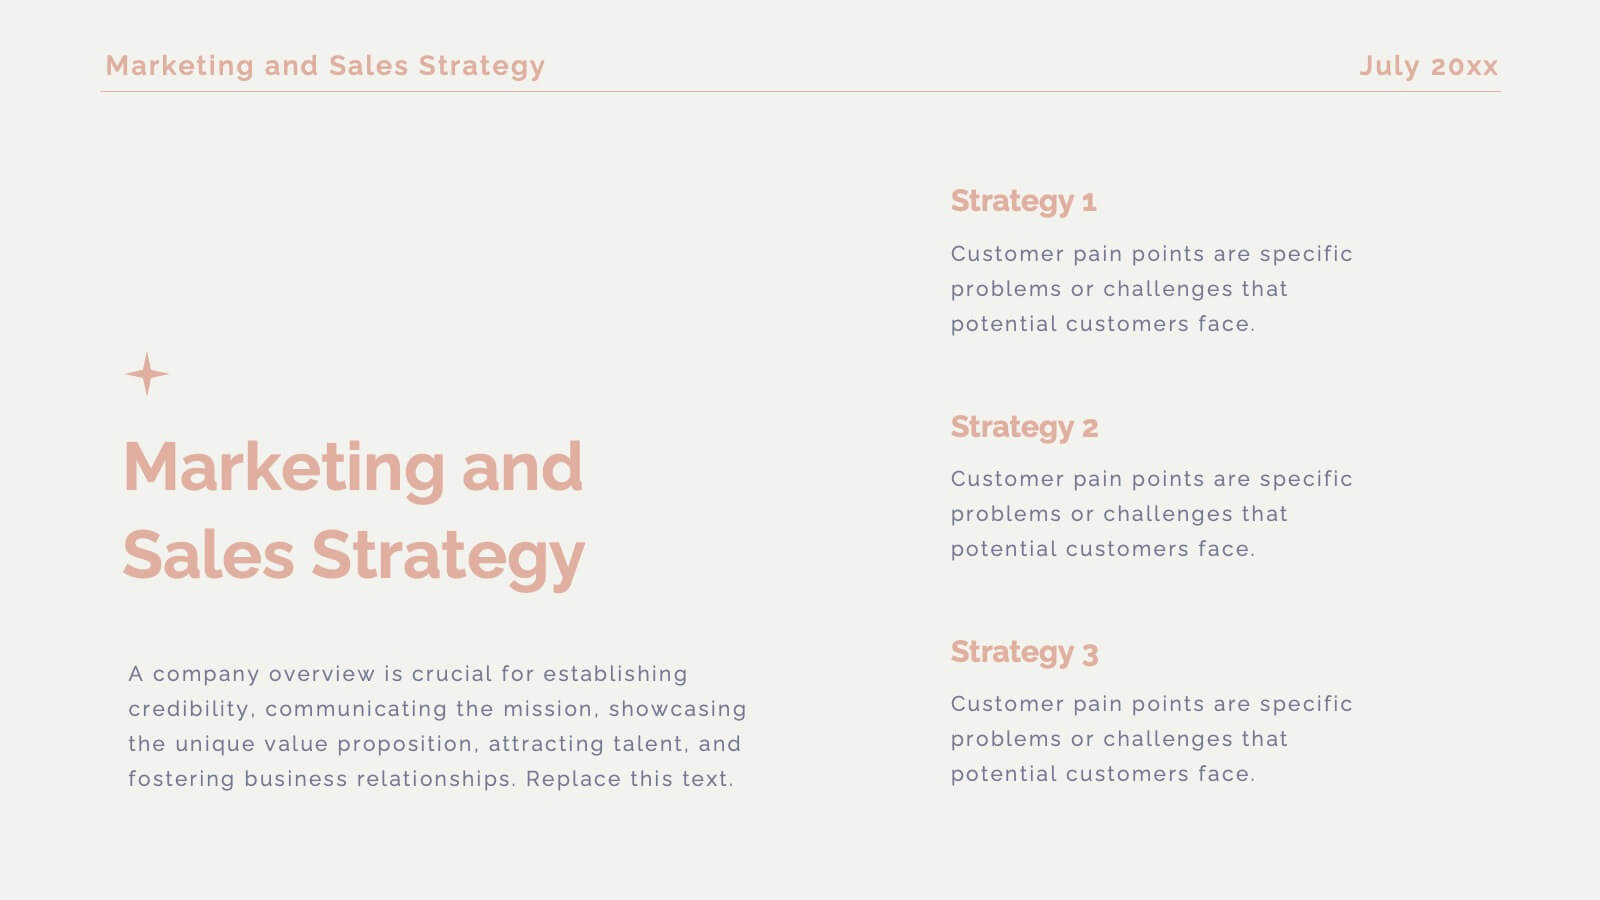
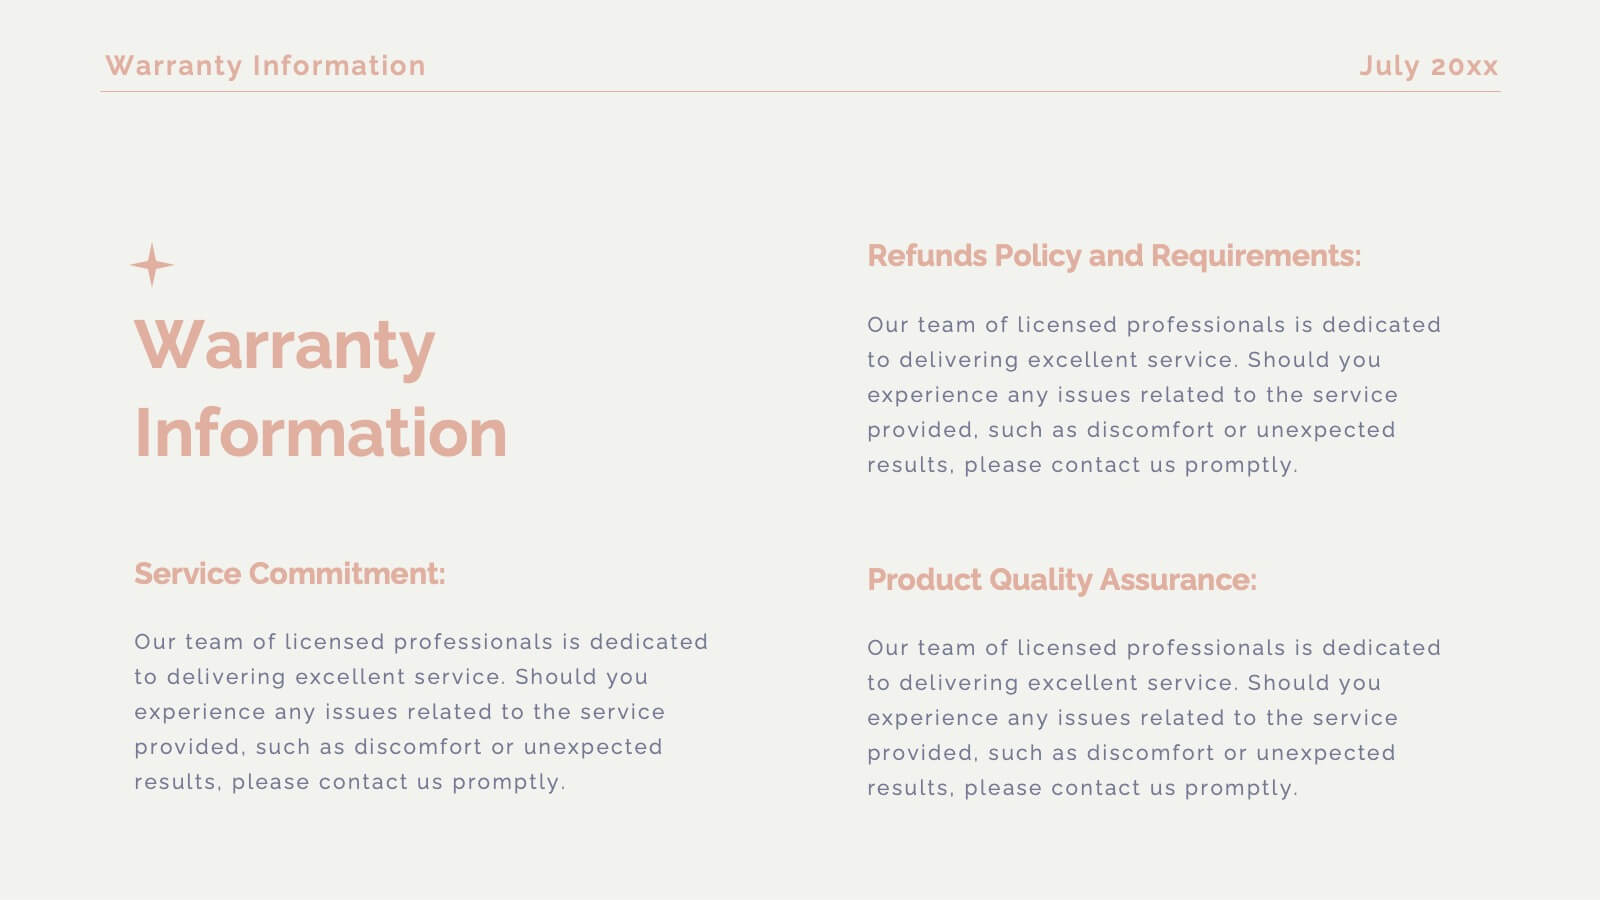
Get ready to unveil your product with a stunning and sophisticated launch template designed to captivate and convert! This template offers everything you need to present your product in the most compelling way possible, from an inviting welcome slide to an in-depth company overview that sets the stage for your brand’s story. The sleek design highlights key product features, unique selling propositions, and a thorough competitive analysis that positions your product as the market leader. With sections dedicated to customer pain points, solutions, and a powerful product demonstration, this template ensures your audience understands the value and impact of your offering. It also includes critical details like pricing strategy, distribution channels, and manufacturing processes, giving a full picture of your product’s journey from concept to market. Compatible with PowerPoint, Keynote, and Google Slides, this template is your ultimate tool for a successful product launch that leaves a lasting impression!


4 slides
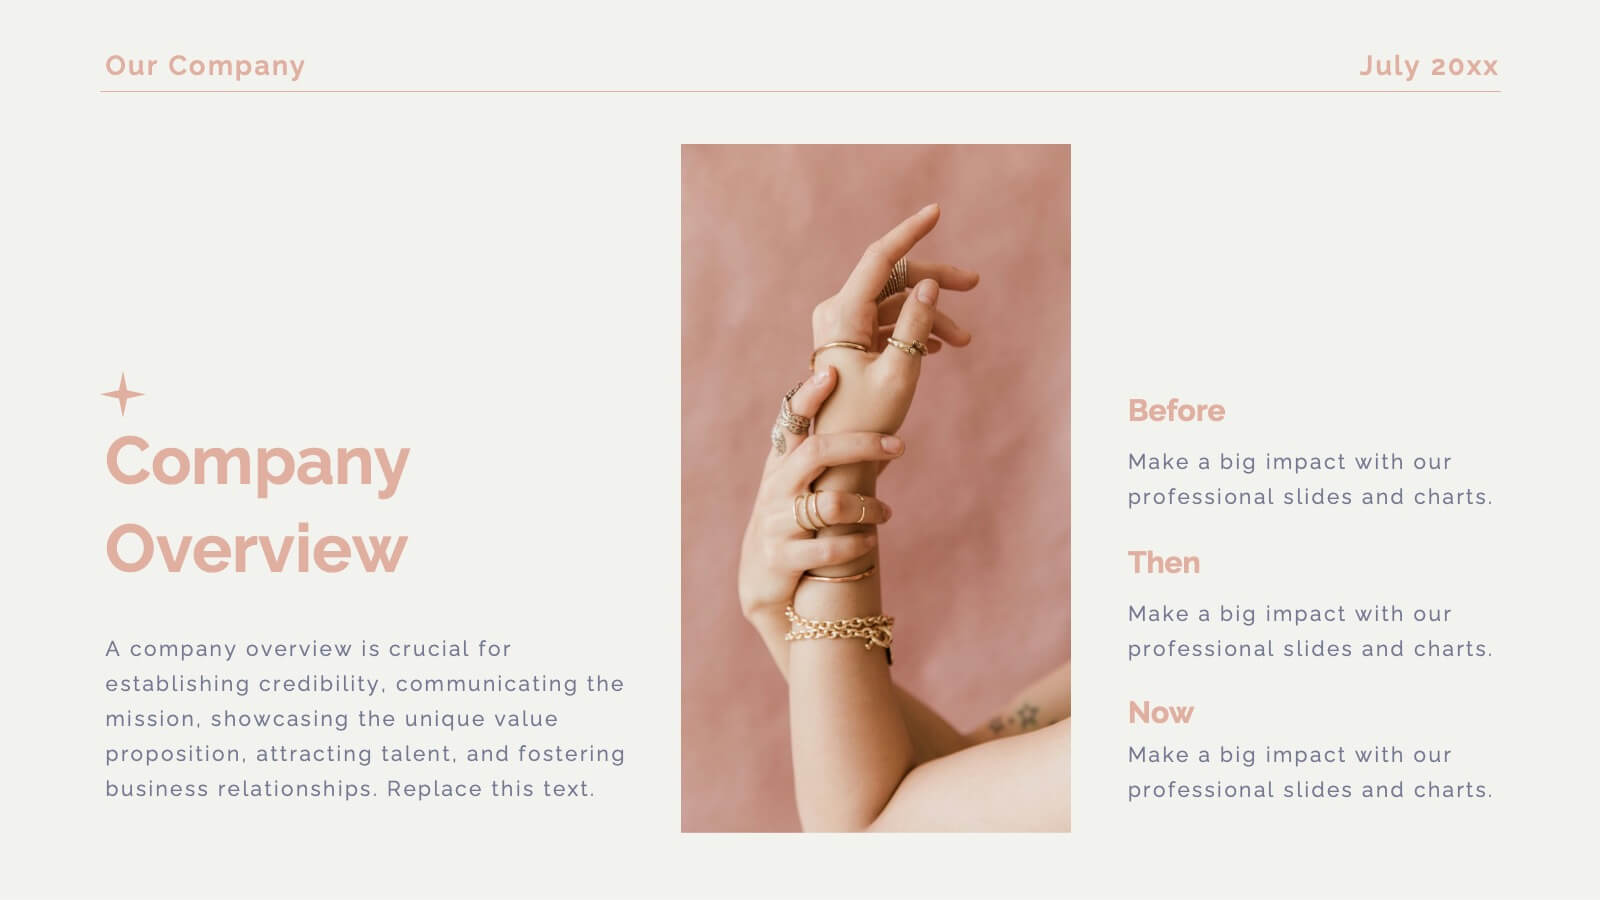
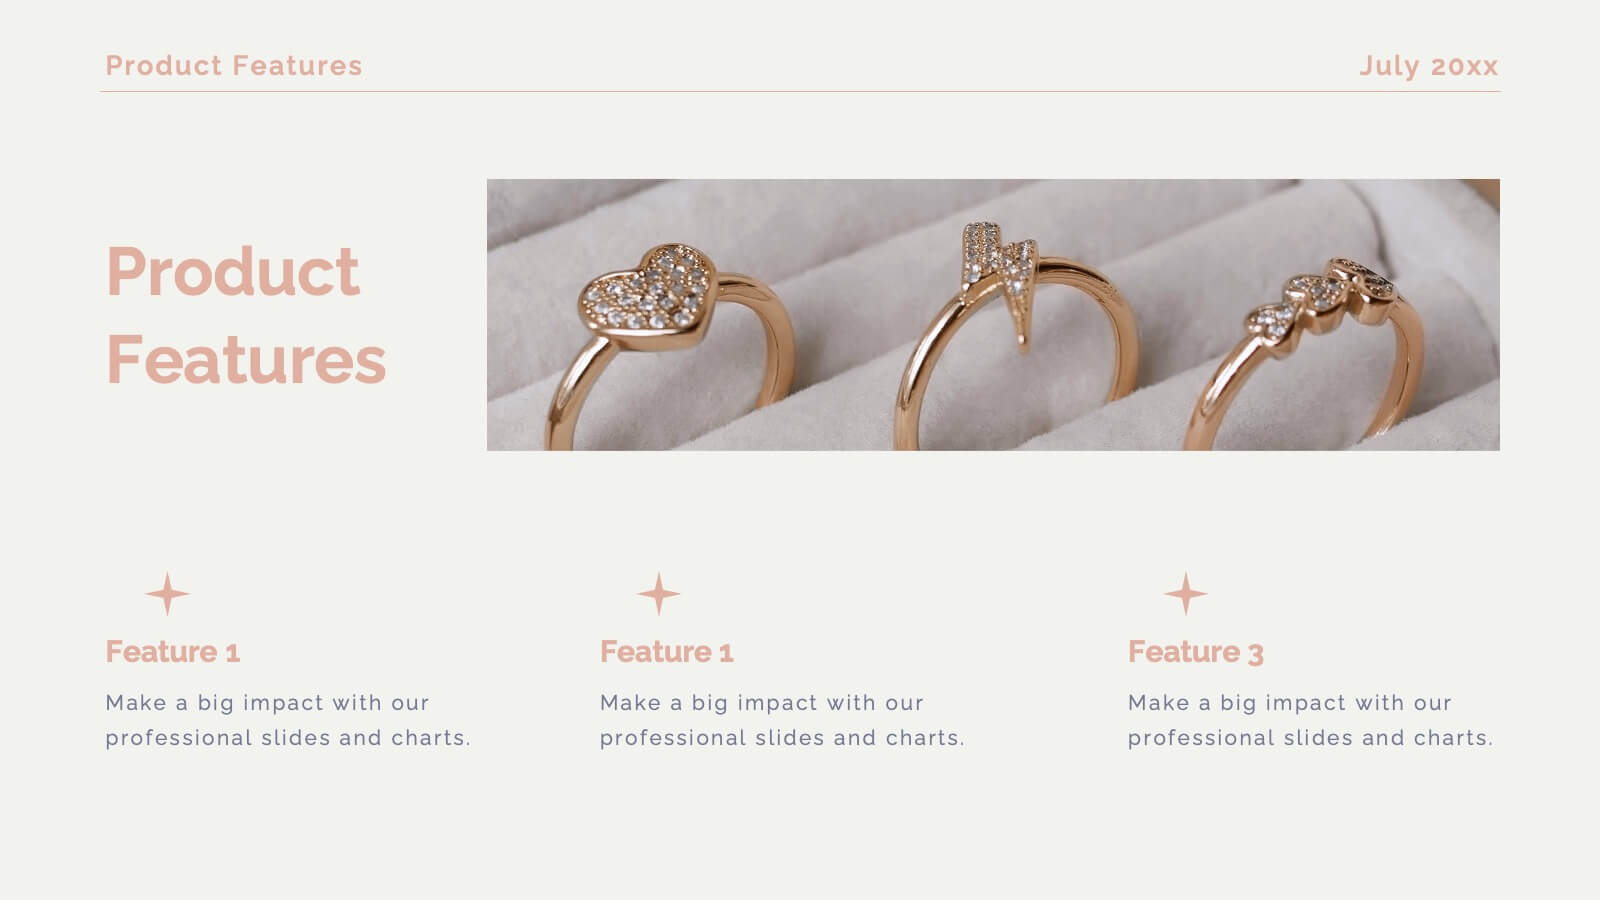
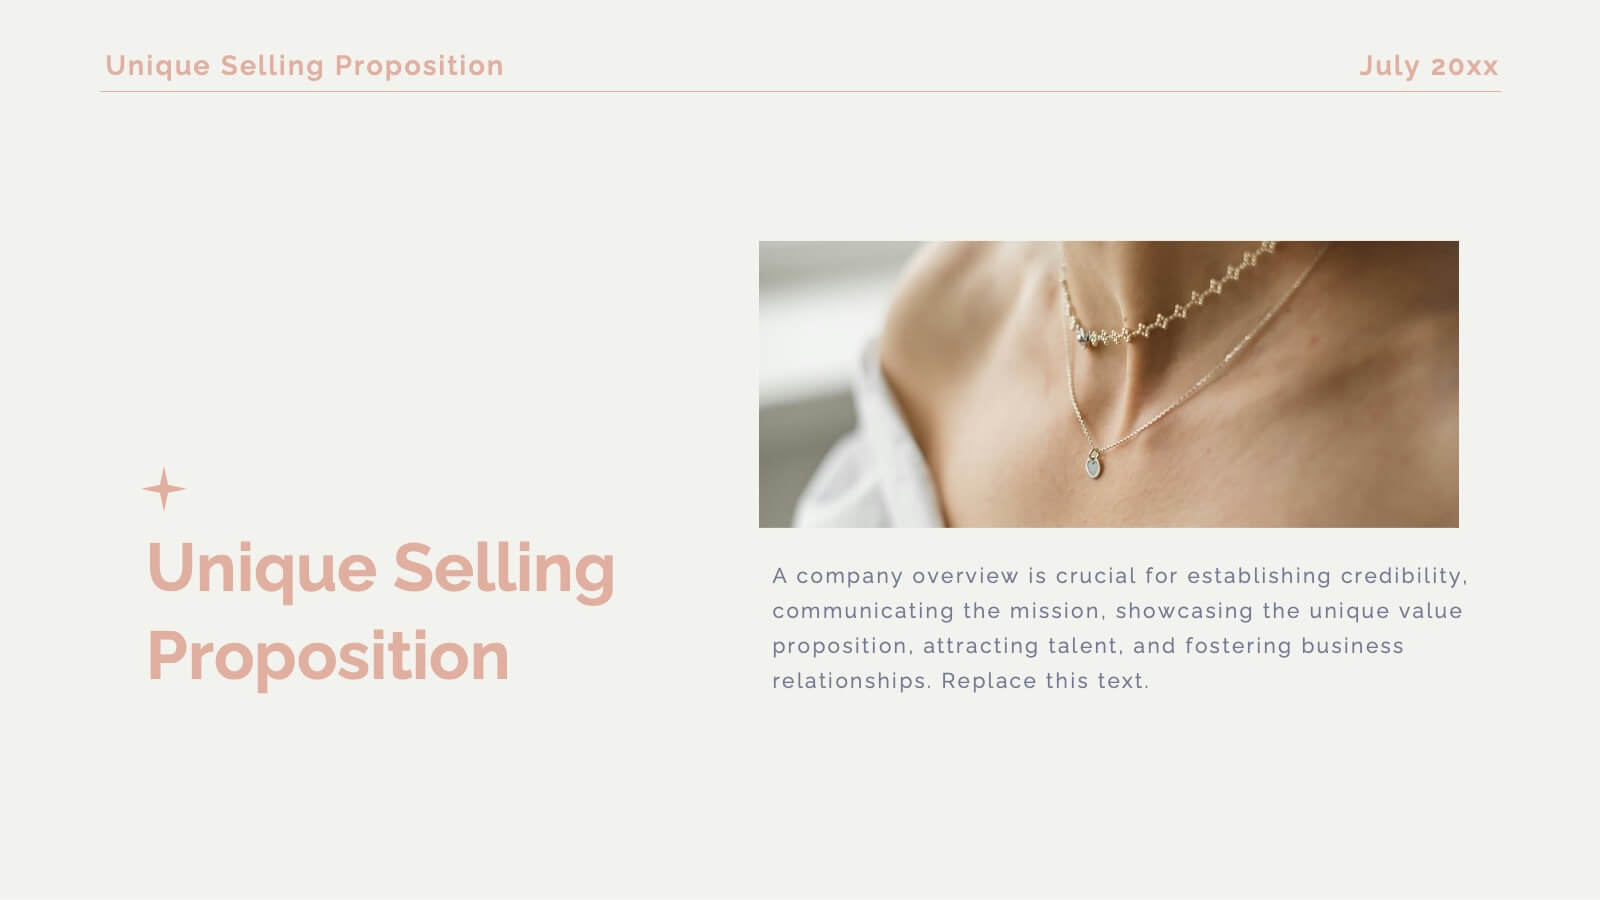
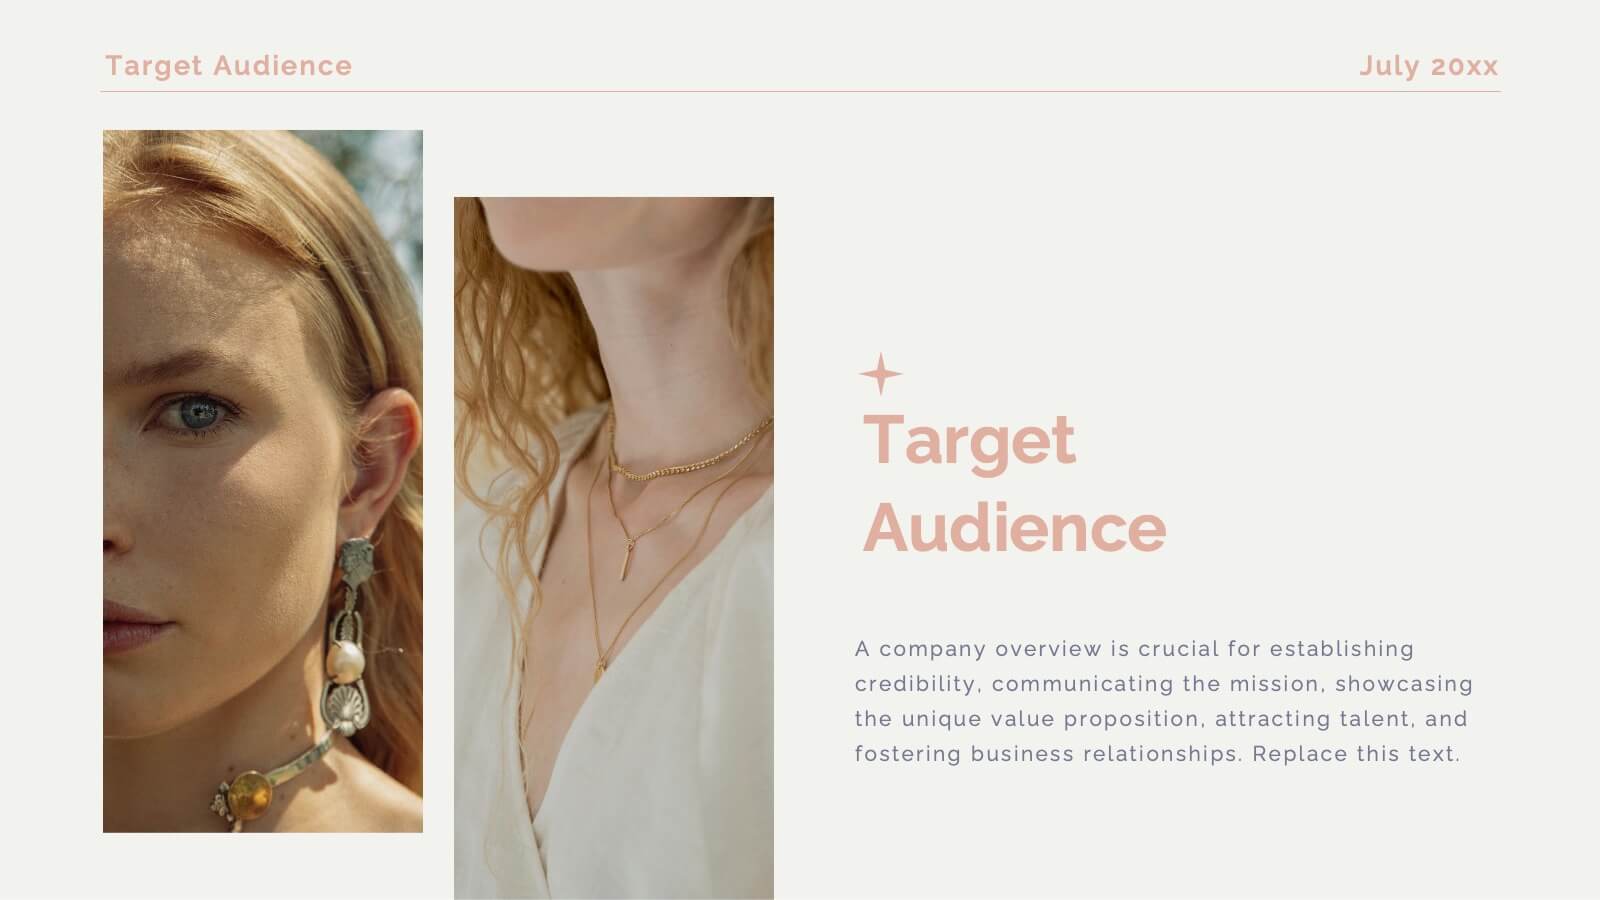
Company Welcome and Overview Presentation
Set the tone for your business presentation with this professional welcome slide. Designed to introduce your company, services, or mission, it includes a customizable photo and clear text sections. Ideal for onboarding, team meetings, or proposals—fully editable in Canva, PowerPoint, or Google Slides for a polished first impression.


6 slides
Child Development Psychology Presentation
Bright colors and geometric birds bring this slide to life, making complex concepts easy to follow. This presentation template simplifies the key stages of emotional and psychological growth in children, helping you explain theories and behaviors clearly. Compatible with PowerPoint, Keynote, and Google Slides for seamless use across platforms.


20 slides
Victoria Design Strategy Proposal Presentation
This design strategy proposal template, crafted with a soft, modern aesthetic, offers a comprehensive layout for presenting design elements, processes, and deliverables. Each slide provides a clean, structured approach to showcase your brand’s design brief, target audience, color palette, typography, mood board, and project timeline. Perfect for designers and agencies, it supports PowerPoint, Keynote, and Google Slides for versatile use.


7 slides
Safety Rules Infographic
Safety rules are crucial in various settings, including workplaces, public spaces, and homes, because they play a fundamental role in protecting individuals from harm and ensuring their well-being. This infographic template aims to present essential safety rules and guidelines in a visually appealing manner. Compatible with Powerpoint, Keynote, and Google Slides. Tailor the content to suit your specific safety guidelines and ensure the infographic effectively communicates the importance of safety across different contexts. This will allow you to effectively communicate essential safety guidelines in your presentations.


5 slides
Public Health Data Presentation
Bright visuals and clean data blocks make this slide an energizing way to present key insights, instantly pulling viewers into the story behind your metrics. It helps simplify complex information while keeping everything clear, structured, and easy to follow. Fully compatible with PowerPoint, Keynote, and Google Slides.


15 slides
Business Proposal Infographic
A business proposal is a formal document that outlines a specific business endeavor, project, or venture, and presents a persuasive argument for why the proposed approach or solution is viable and advantageous. This infographic template is a tool for the business world to communicate business ideas, pitch a product or service, secure funding or partnerships, or enter into a business agreement. Fully customizable and compatible with Powerpoint, Keynote, and Google Slides. Showcase your unique value proposition and unveil how it fuels your journey to success. Energize your business propositions and set the stage for success!


6 slides
Strategy for Effective Solutions Presentation
Unlock strategic clarity with the Strategy for Effective Solutions template, which effectively organizes complex strategies into six interconnected segments, ideal for sequentially showcasing business insights. Its clear, systematic design supports concise communication and is compatible with PowerPoint, Keynote, and Google Slides, making it a versatile tool for professional presentations.


5 slides
Financial Overview and Money Flow Presentation
Showcase financial performance and money distribution with this clear, layered infographic. Each stack segment represents a key insight—ideal for budgets, cost analysis, or income flow presentations. Simple yet visually effective, it's perfect for helping stakeholders see the full picture. Fully compatible with PowerPoint, Keynote, and Google Slides.


4 slides
Objectives and Key Results Overview Presentation
Set your goals, define success, and visualize progress with a sleek, easy-to-follow layout that connects objectives to measurable outcomes. Ideal for business strategy, team performance, or quarterly reviews, this presentation keeps your message clear and professional. Fully compatible with PowerPoint, Keynote, and Google Slides for effortless editing.