


Features
- 6 Unique slides
- Fully editable and easy to edit in Microsoft Powerpoint, Keynote and Google Slides
- 16:9 widescreen layout
- Clean and professional designs
- Export to JPG, PDF or send by email


Do you have any questions?
Recommend


21 slides
Illume Detailed Project Execution Plan Presentation
Get ready to wow your audience with this dynamic Project Execution Plan template! Bursting with sleek design, it transforms your project timelines, deliverables, and stakeholder analysis into a stunning visual journey. Keep everyone engaged while you showcase your strategy with flair and finesse. Perfect for PowerPoint, Keynote, and Google Slides!


5 slides
Business Matrix Model Presentation
Clearly define your strategy with this Business Matrix Model Presentation. This slide visualizes four key segments in a grid layout, perfect for mapping business priorities, comparing performance, or identifying growth opportunities. Each quadrant is color-coded and labeled, making it easy to explain complex concepts. Ideal for business planning, SWOT analysis, or strategy workshops. Fully editable in PowerPoint, Keynote, and Google Slides.


5 slides
Customer Experience Empathy Map Presentation
Enhance Customer Understanding with the Empathy Map Presentation! This Customer Experience Empathy Map template is designed to help businesses visualize customer needs, thoughts, emotions, and behaviors for improved engagement and strategy. Featuring a clear quadrant-based layout, this template allows you to map out customer insights, pain points, and expectations for more effective decision-making. Ideal for marketers, UX designers, and business strategists, this fully editable template is compatible with PowerPoint, Keynote, and Google Slides, making


5 slides
Business SWOT Infographics
Dive deep into organizational analysis with our business SWOT infographics. Crafted in engaging shades of blue and pink, this collection is an essential tool for businesses aiming to uncover their strengths, weaknesses, and threats. This template, brimming with creative graphics and icons, is specifically designed for business strategists, educational instructors, and company executives who are keen to present SWOT analysis with clarity. Compatible with Powerpoint, keynote, and Google Slides. Its vertical, creative styling makes complex information digestible, fostering understanding and strategic thinking in your business planning sessions.


12 slides
Corporate Growth Strategy Steps Presentation
Showcase your expansion roadmap with this Corporate Growth Strategy Steps Presentation. Designed as a five-step vertical ladder, this layout is perfect for illustrating progressive stages like market entry, development, scaling, innovation, and leadership. Each level includes editable icons and text placeholders for clarity and customization. Fully compatible with PowerPoint, Keynote, and Google Slides.


5 slides
Corporate Case Study Analysis Presentation
Enhance your business presentations with the Corporate Case Study Analysis Presentation template. This structured design helps visualize case studies, success stories, or business challenges in a clear, step-by-step format. Ideal for consultants, business analysts, and executives, this slide simplifies complex data into an easy-to-follow journey. Fully customizable in PowerPoint, Keynote, and Google Slides to align with your brand and insights.


6 slides
Spider Diagram for Concept Mapping
Map complex relationships with ease using the Spider Diagram for Concept Mapping Presentation. This slide features a central radial chart connected to six surrounding nodes—each paired with editable titles, icons, and detailed text sections. Perfect for visualizing project scopes, idea clustering, strategic alignment, or team functions. Customize colors, icons, and text directly in PowerPoint, Keynote, or Google Slides. The clean, professional layout ensures clear communication across all types of presentations.


21 slides
Turquoise Market Analysis Report Presentation
This sleek report presentation template covers essential sections like key performance metrics, market analysis, and strategic initiatives. It’s designed for a professional yet modern look, perfect for showcasing updates and insights. Compatible with PowerPoint, Keynote, and Google Slides, it’s ideal for delivering engaging and impactful business reports.


4 slides
Competitive Advantage Blue Ocean Strategy
Highlight strategic positioning with this Competitive Advantage Blue Ocean template. Designed with clear flow visuals and modern iconography, it’s perfect for showcasing unique value propositions, competitive edges, and market leadership strategies. Easy to edit in PowerPoint, Keynote, and Google Slides for seamless customization.


26 slides
Fundraising Event Presentation
Inspire generosity and support for your cause with our Fundraising Event presentation template, ideal for PowerPoint, Keynote, and Google Slides. This template is crafted with non-profit organizations, charity foundations, and event coordinators in mind, featuring a heartwarming design that encourages giving and communal effort. The slides are tailored to highlight the importance of philanthropy, with 'big image slides' to tell the stories of those you're helping, 'process infographics' to explain how donations are used, and 'chart slides' to show the impact of collected funds. The soothing color palette and thoughtful graphics create an atmosphere of hope and solidarity. Our Fundraising Event template is more than just a collection of slides; it's a powerful storytelling tool that can galvanize audiences into action. Download it now to create a moving presentation that not only shares the vision of your event but also rallies the community around your noble cause.


8 slides
Company Vision and Strategic Direction Presentation
Present your company’s long-term goals with clarity using the Company Vision and Strategic Direction Presentation. This clean, icon-led layout helps communicate your vision, focus areas, and roadmap in a linear, easy-to-follow format. Ideal for executive updates, investor decks, or team briefings. Compatible with PowerPoint, Canva, and Google Slides.


5 slides
Online Learning Platforms and Strategies Presentation
Simplify complex educational strategies with this layered house-shaped diagram designed for digital learning topics. Each tier represents a strategic element of your e-learning platform, from planning to implementation. Featuring five clearly labeled sections with editable icons and text, this slide is ideal for showcasing course structures, platform features, or training rollouts. Fully customizable in PowerPoint, Keynote, and Google Slides.


20 slides
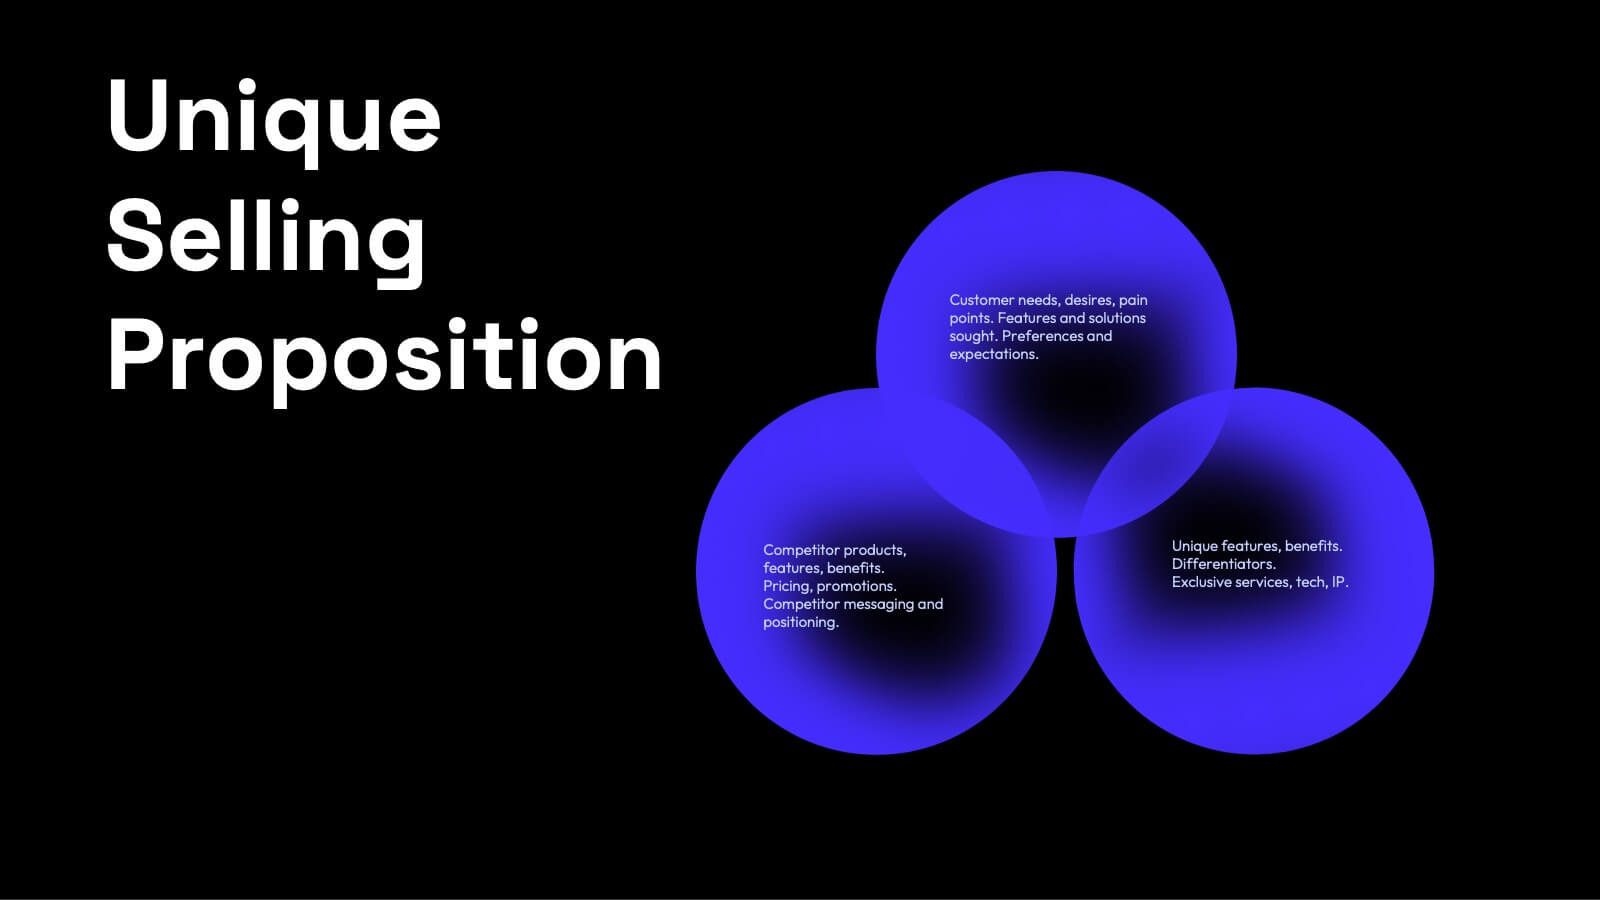
Apex Content Marketing Pitch Deck Presentation
Ignite your marketing strategy with this captivating pitch deck! Perfect for showcasing content marketing plans, it features slides on company history, target audience, and unique selling propositions. Make a lasting impression with sleek, modern designs and compelling content. Compatible with PowerPoint, Keynote, and Google Slides for a smooth presentation experience on any platform.


6 slides
Investment Trust Infographic
An investment trust, also known as a closed-end fund, is a type of collective investment vehicle that pools funds from multiple investors to invest in a diversified portfolio of assets. This Infographic template visually communicates key information about investment trusts, which are financial vehicles from multiple investors to invest in a diversified portfolio of assets. This template highlights different types of investment, such as trusts, fixed-income trusts, or sector-specific trusts. The icons and images are included to represent each type. This infographic is fully customizable and compatible with Powerpoint, Keynote, and Google Slides.


5 slides
Leadership and Workforce Culture
Inspire growth from the ground up with this bold, step-by-step visual that captures the journey of leadership and team development. From culture-building to individual progress, this layout helps you illustrate each stage clearly and confidently. Fully compatible with PowerPoint, Keynote, and Google Slides.


4 slides
Healthcare Access and Preventive Care Presentation
Bring your health strategy to life with this engaging heart-themed infographic slide. Perfect for illustrating patient access points, wellness checkpoints, or preventive initiatives, each segment is cleanly organized with icons and text. Ideal for medical presentations, this template works seamlessly in PowerPoint, Keynote, and Google Slides for total flexibility.


6 slides
Project Status Analysis Infographics
Analyze your project's status effectively with our Project Status Analysis infographic template. This template is fully compatible with popular presentation software like PowerPoint, Keynote, and Google Slides, allowing you to easily customize it to illustrate and communicate the key elements of project status analysis. The Project Status Analysis infographic template offers a visually engaging platform to depict project progress, milestones, risks, and key performance indicators. Whether you're a project manager, team leader, or business professional, this template provides a user-friendly canvas to create informative presentations and reports on your project's status. Optimize your project management and reporting with this SEO-optimized Project Status Analysis infographic template, thoughtfully designed for clarity and ease of use. Customize it to showcase project timelines, status updates, issue tracking, and strategies for project success, ensuring that your audience gains a comprehensive understanding of the project's current situation. Start crafting your personalized infographic today to excel in project status analysis.