


Features
- 6 Unique slides
- Fully editable and easy to edit in Microsoft Powerpoint, Keynote and Google Slides
- 16:9 widescreen layout
- Clean and professional designs
- Export to JPG, PDF or send by email


Do you have any questions?
Recommend


5 slides
Insurance Policy Infographics
Dive into the intricacies of insurance with our insurance policy infographics. Rendered in a professional palette of blue and an array of engaging colors, this creative, vertical template simplifies the often complex world of insurance policies. Ideal for insurance agents, companies, and educators, it provides a visual aid to explain coverage specifics, terms, and conditions or to compare policy offerings clearly and effectively. The infographic includes aesthetically pleasing graphics, symbolic icons, and designated spaces for factual data, making it a quintessential tool for enhancing audience understanding and promoting informed decision-making.


6 slides
SEO Consulting Infographics
The "SEO Consulting" infographic template is designed for PowerPoint, Keynote, and Google Slides, making it a valuable resource for SEO consultants, digital marketing professionals, and business owners. This template is crafted to effectively communicate the essentials of SEO in a professional and engaging manner. Featuring key elements of SEO such as optimization strategies, keyword research, and website traffic analysis, the template is structured to simplify the complex aspects of SEO. This makes it an ideal tool for presentations aimed at educating clients or team members about the nuances of search engine optimization and its impact on digital marketing. The design of the template is modern and business-oriented, with a color scheme that includes shades of blue, green, and gray. This professional yet engaging aesthetic ensures that the presentation is not only informative but also visually appealing. Whether used in client meetings, training sessions, or marketing seminars, this template is sure to enhance the understanding and appeal of SEO consulting services.


23 slides
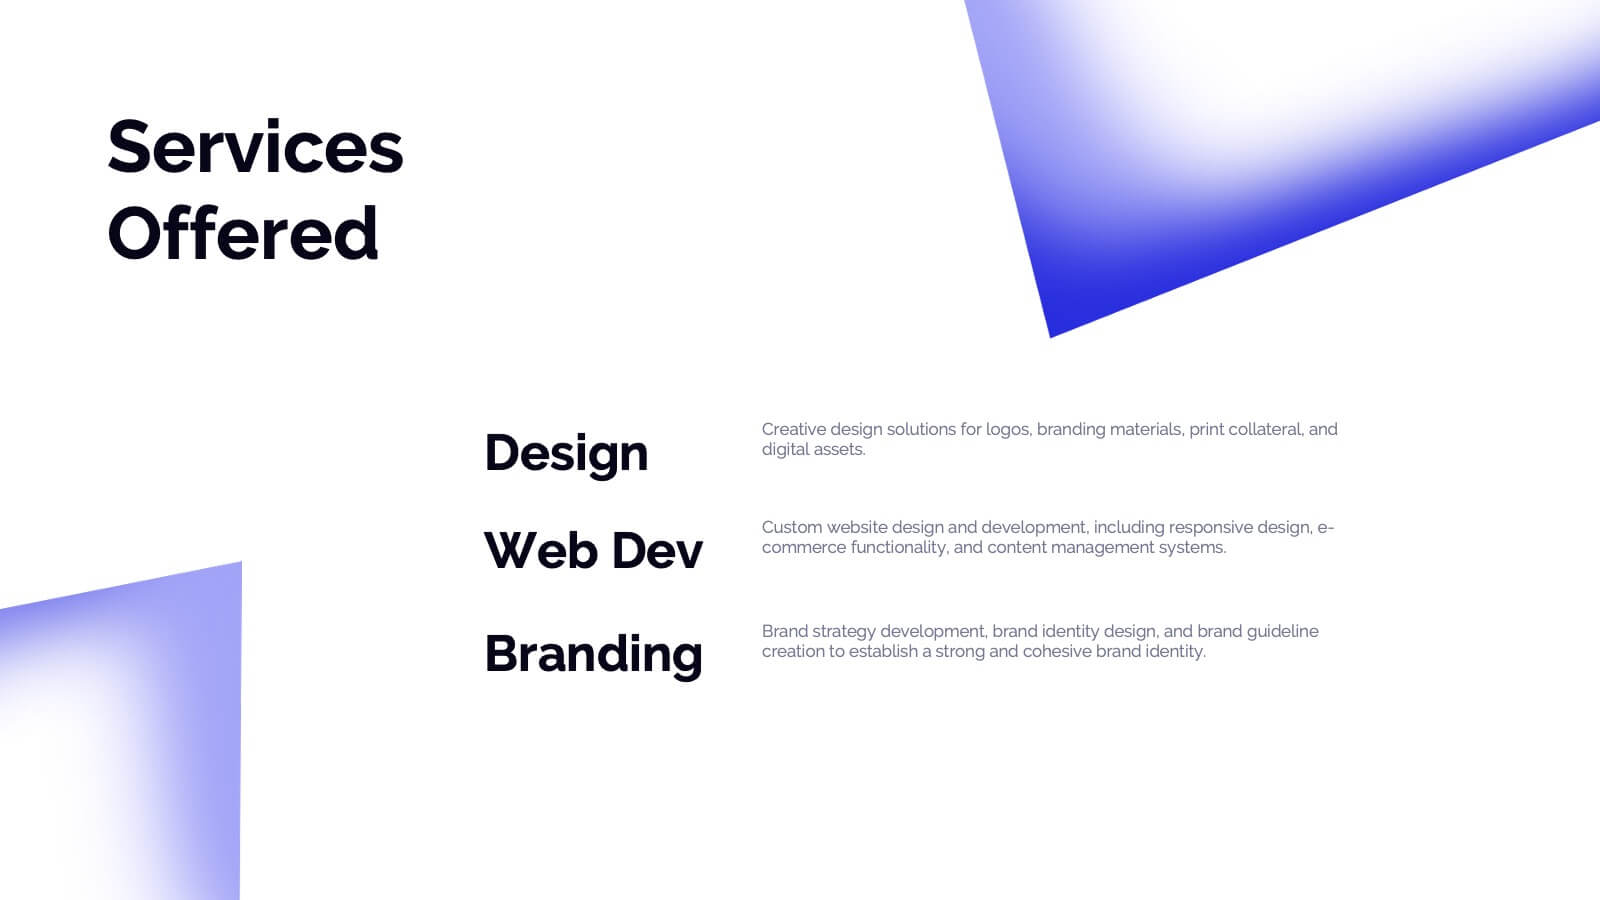
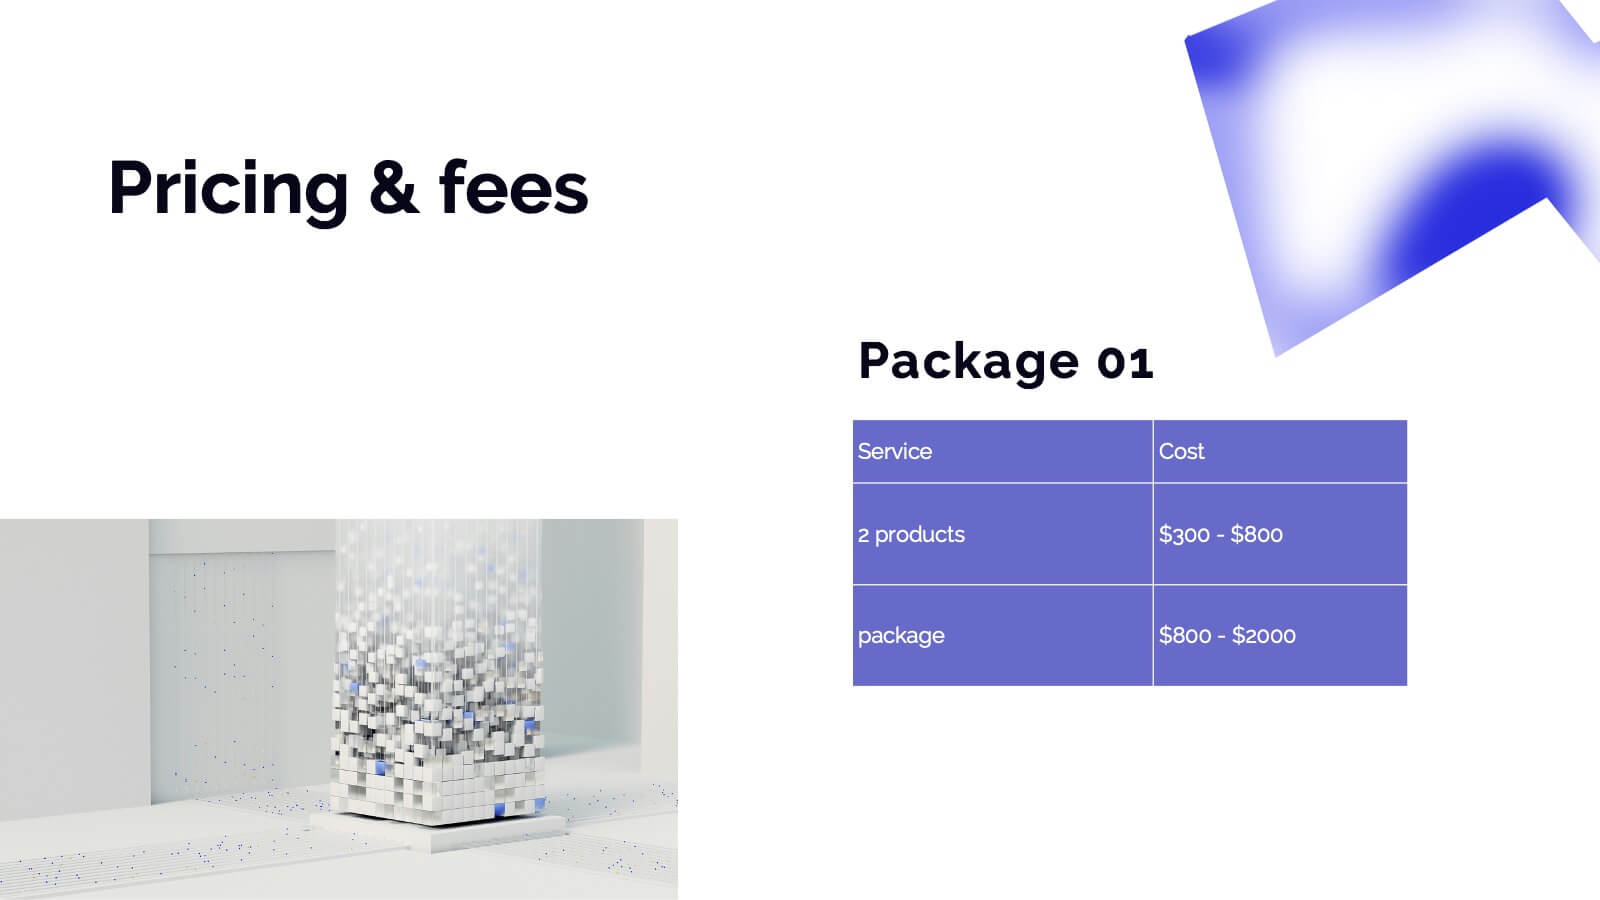
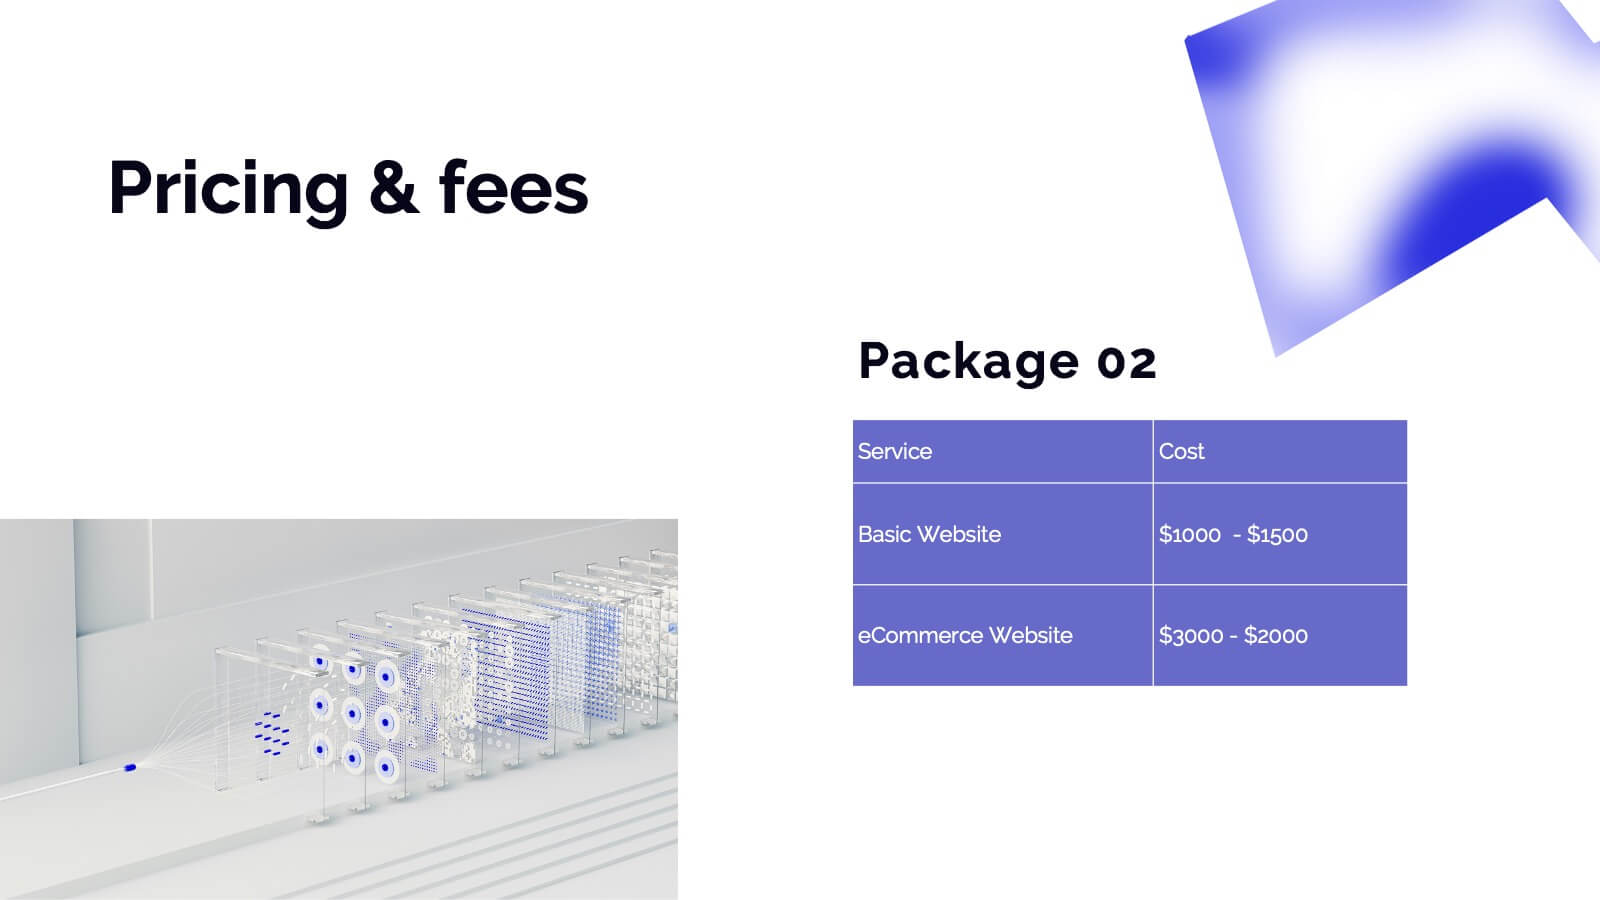
Dryad Photography Portfolio Template Presentation
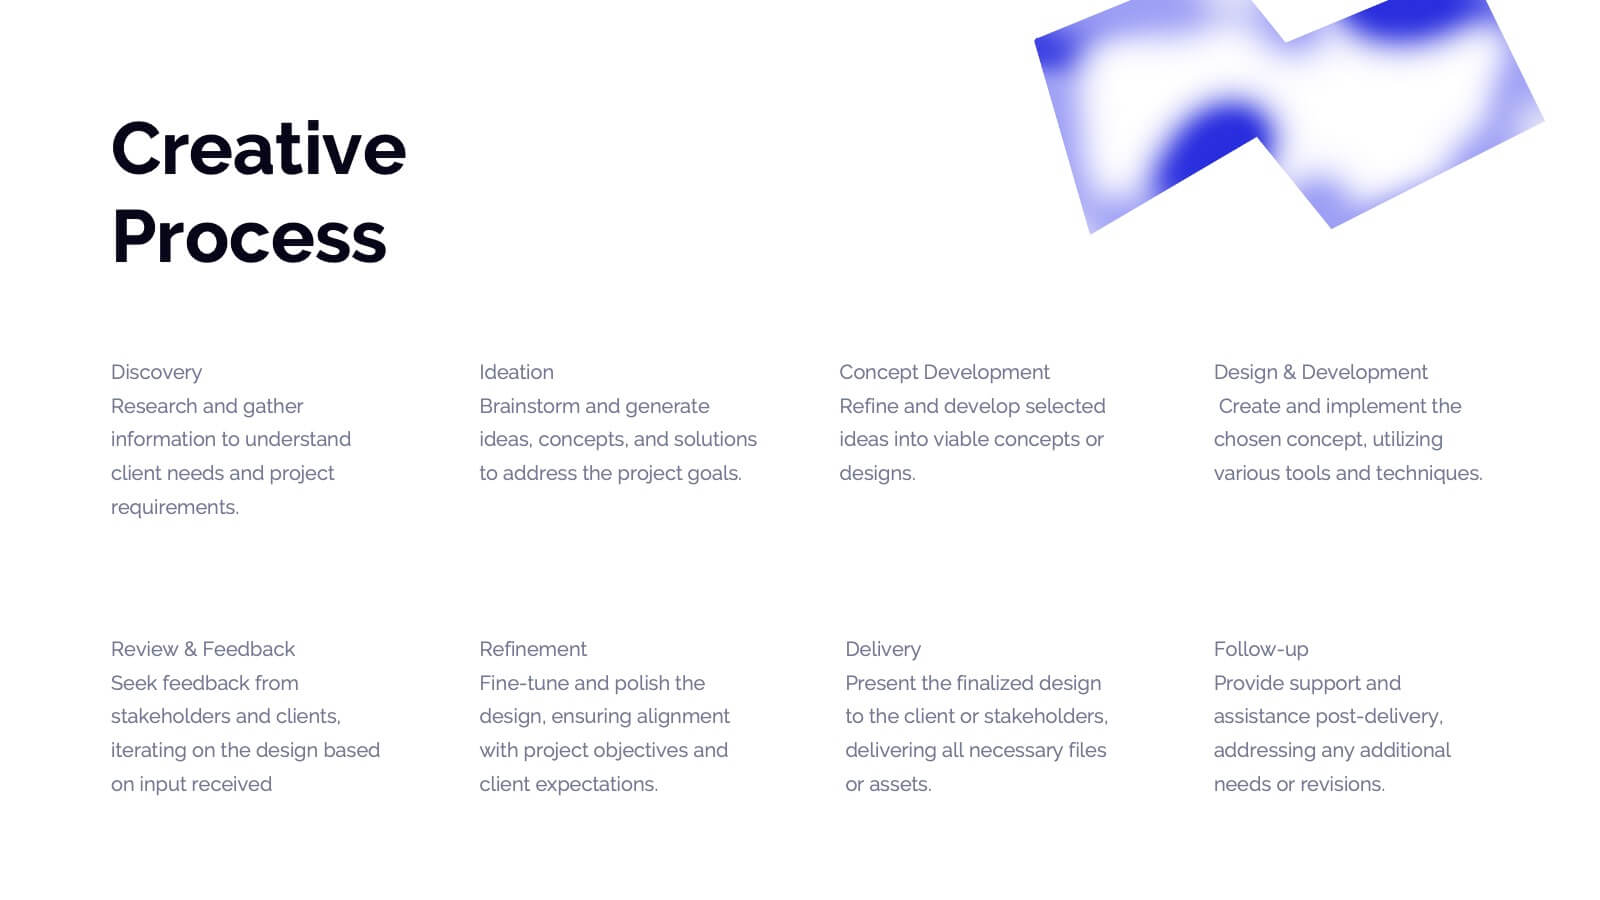
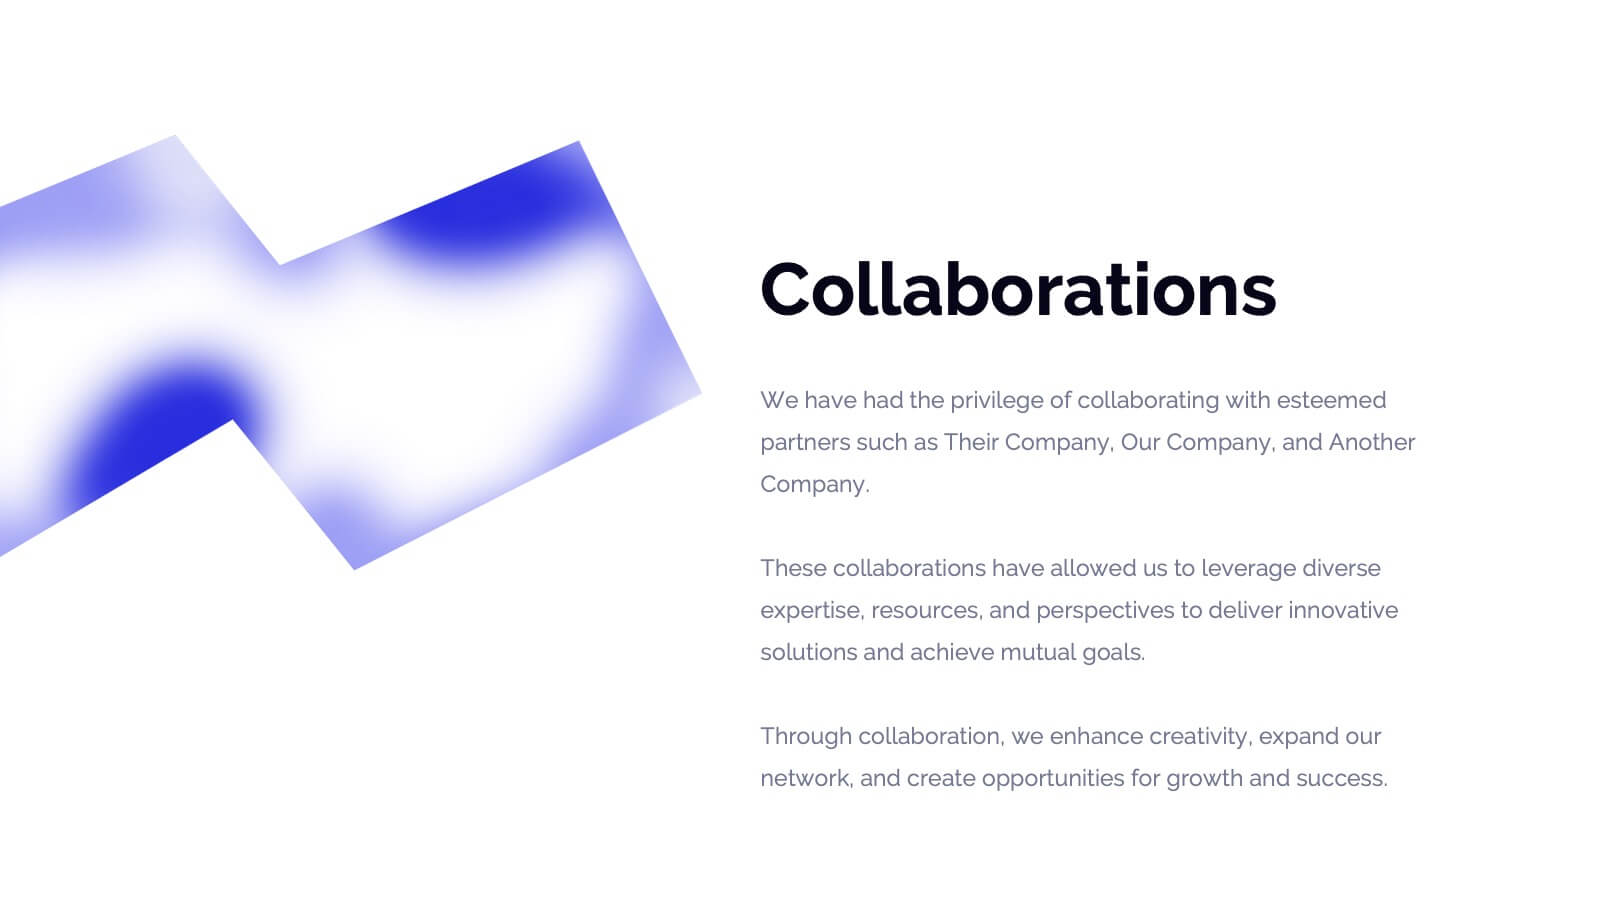
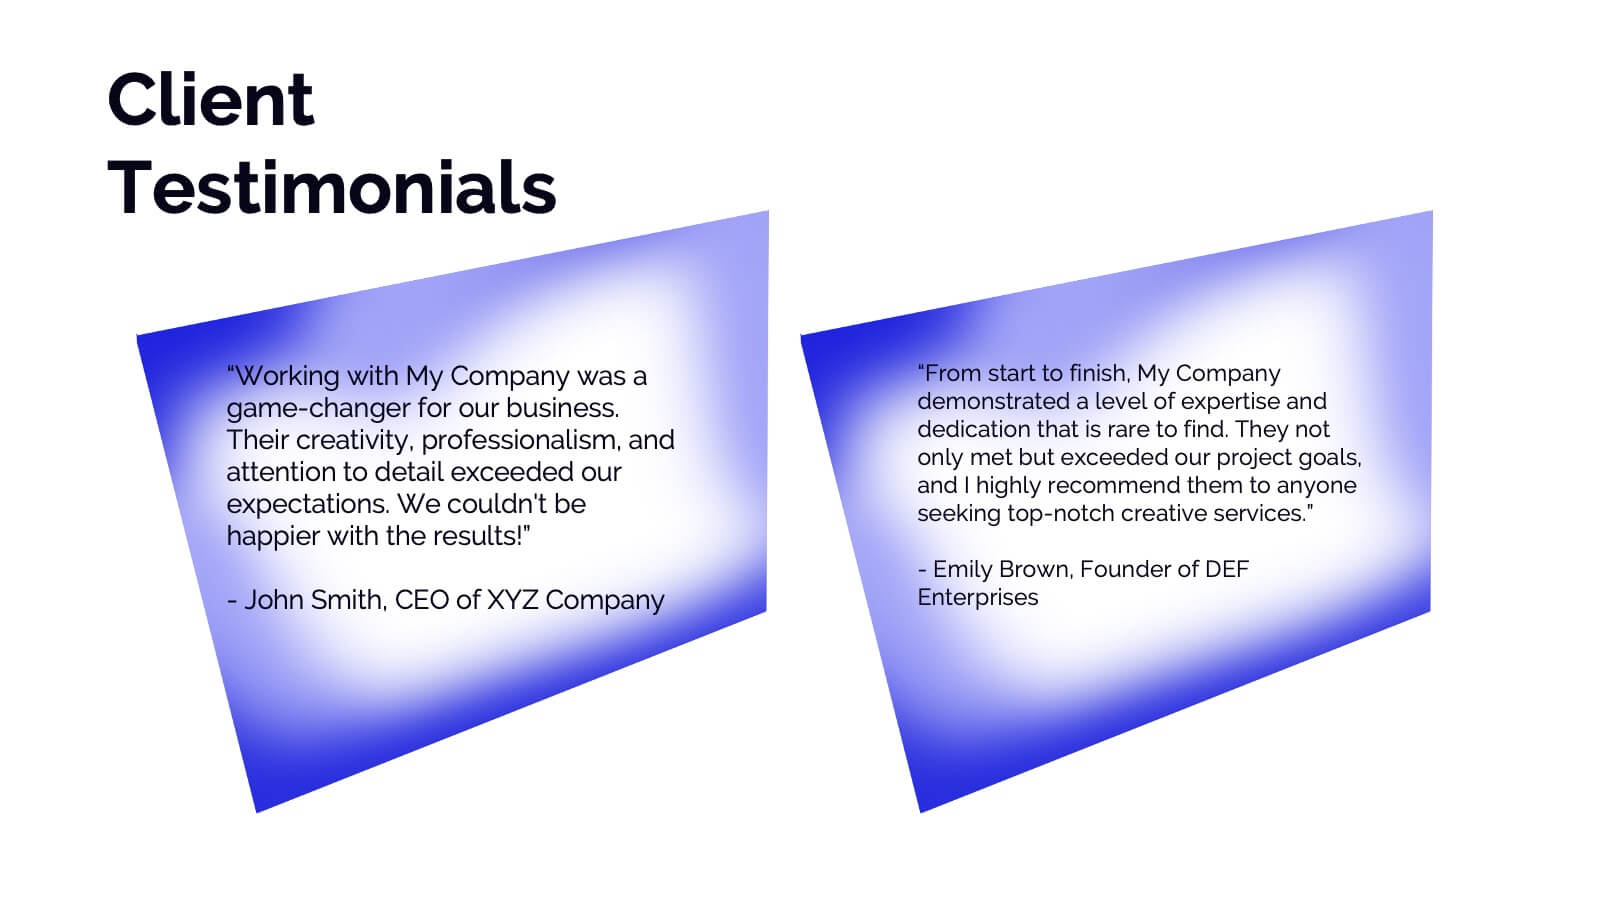
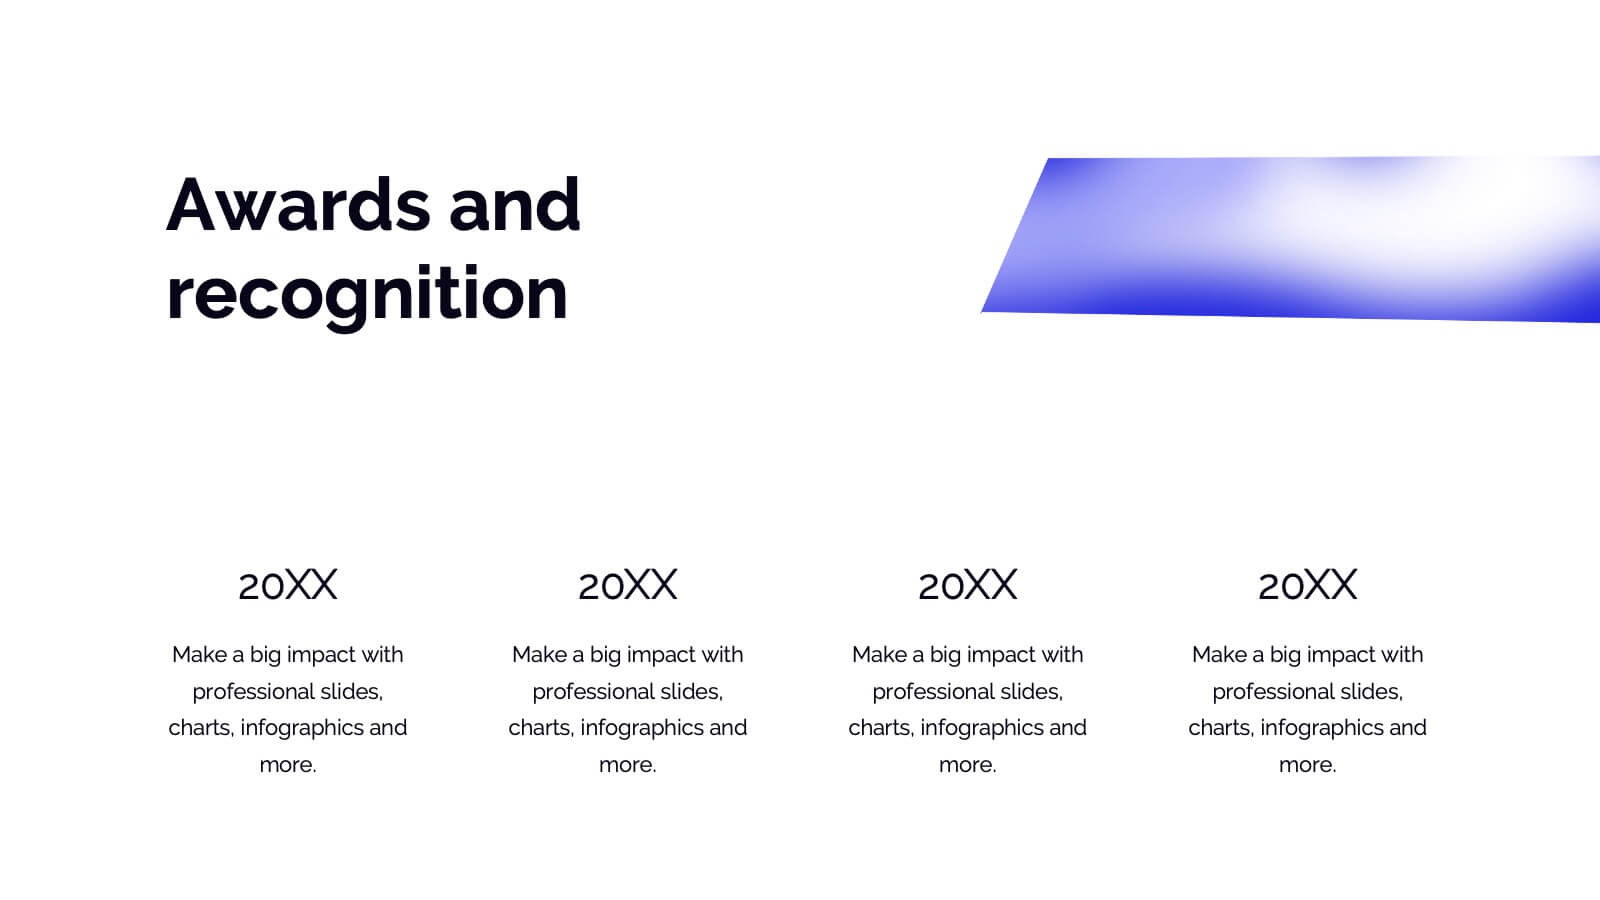
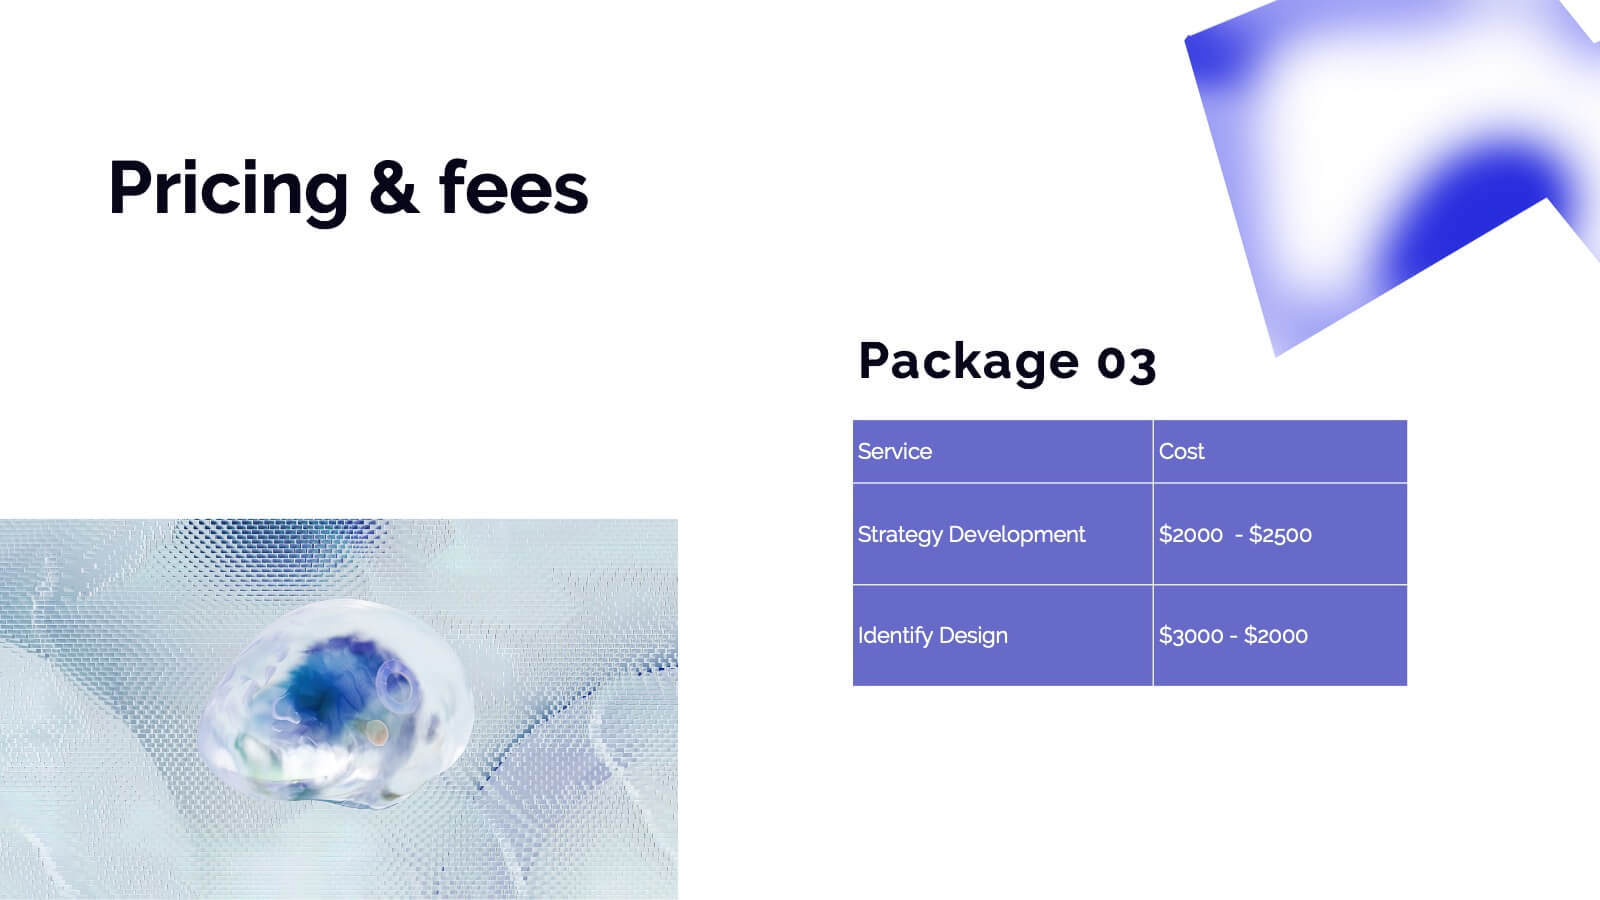
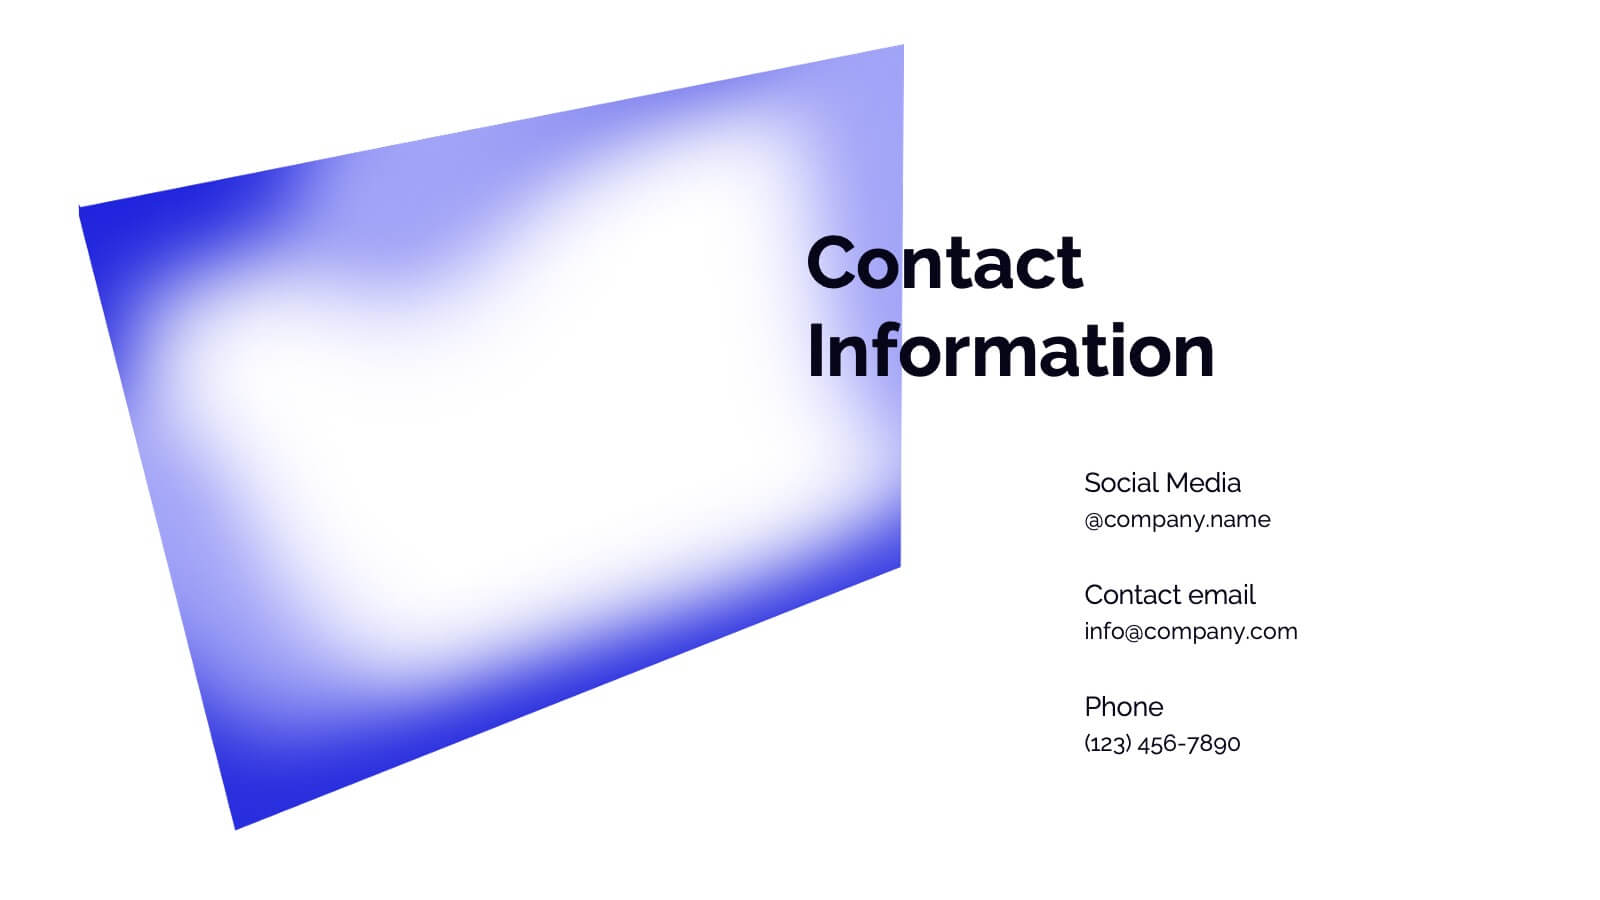
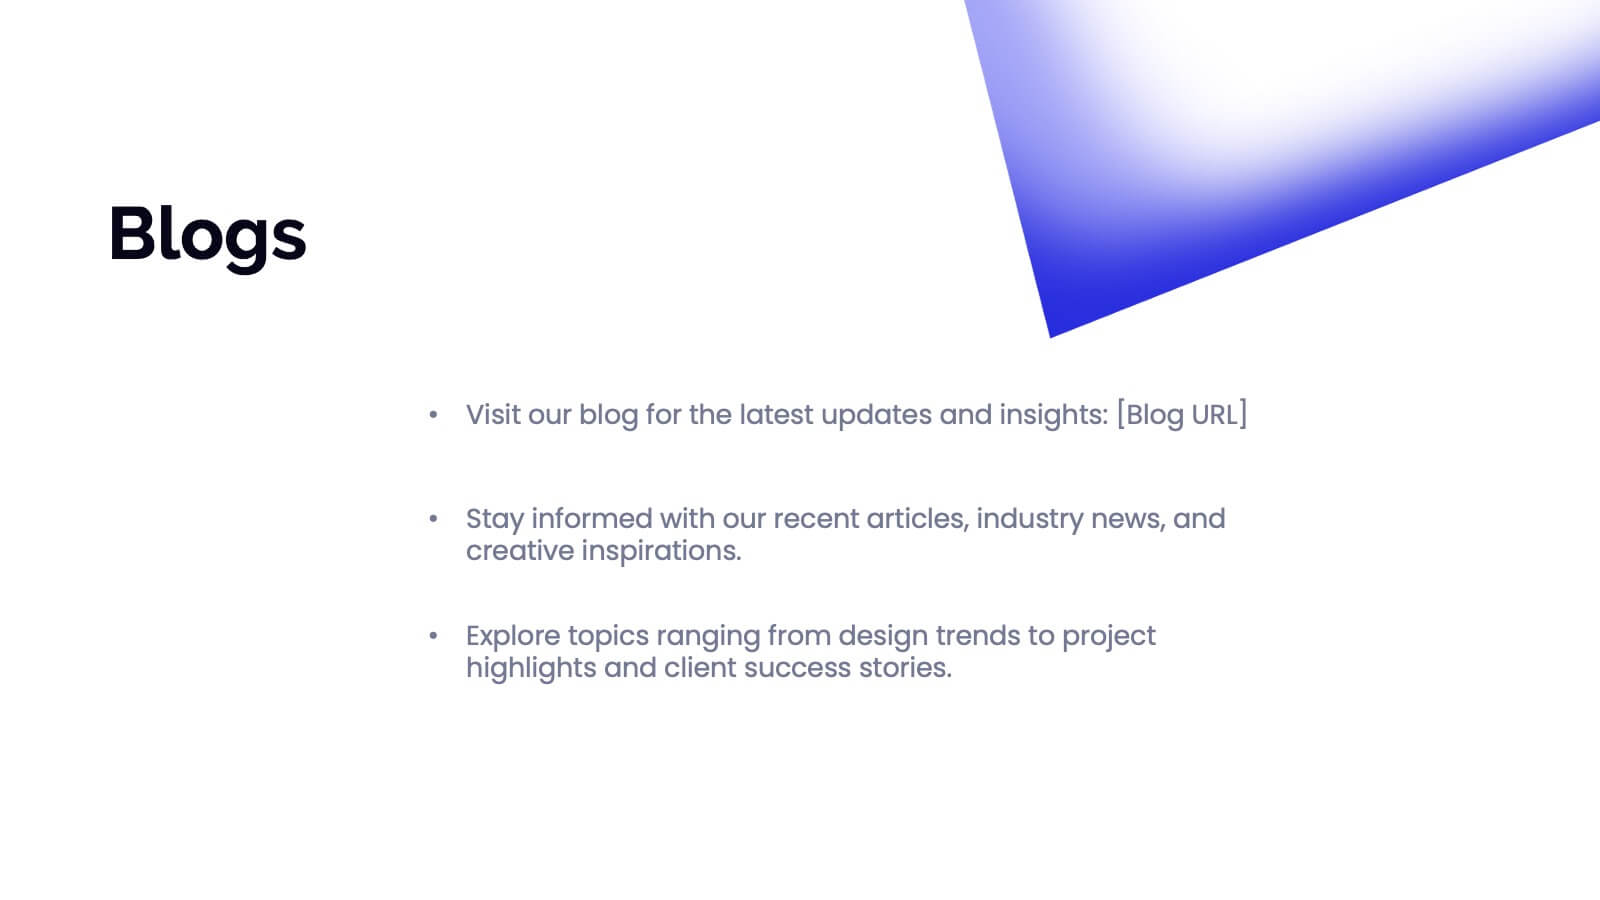
Showcase your photography skills with this elegant and professional portfolio presentation template! Perfect for highlighting your projects, style, and creative process, this template covers everything from client testimonials to pricing and services offered. It’s ideal for photographers wanting to present their work with style and clarity. Compatible with PowerPoint, Keynote, and Google Slides for effortless sharing and presentations.


7 slides
Education Infographic Presentation Template
An education infographic is a visual representation of information related to education. It is used to present information in a clear, concise and easy-to-understand manner. It can be used to show statistics, facts, or data on a variety of educational topics such as student enrollment, graduation rates, test scores, and more. This template has bright and colorful photo designs that make it fun to use and easy to read. You can add your own pictures and customize the colors to make it look just the way you want. This template has many charts and graphs you can use to show all kinds of information.


20 slides
Symphonix Marketing Campaign Presentation
The Marketing Campaign Presentation Template is designed for impactful storytelling and strategy. With 20 vibrant, customizable slides, it covers key topics like consumer behavior, emerging trends, data-driven strategies, and sustainability. Perfect for marketers and agencies, it’s fully compatible with PowerPoint, Keynote, and Google Slides for seamless presentations.


6 slides
Vision Statement Infographic
Define and share your organization's aspirations with our Vision Statement Infographic Template. Designed for impact and clarity, this template offers a modern, sleek way to communicate your company's vision to team members, stakeholders, and the public. With its clean lines and focused layout, it provides the perfect backdrop to highlight your strategic intentions. This template features a series of customizable slides, each structured to help you articulate different elements of your vision statement. Utilize engaging icons, bold color blocks, and concise text to make your message resonate. It’s ideal for integrating into annual reports, company presentations, or onboarding materials, ensuring that your vision is not only shared but also inspires. Tailor each slide to suit your corporate identity, adjusting colors and fonts for consistency with your brand aesthetics. This tool is essential for leaders looking to instill a sense of purpose and direction throughout their organization.


4 slides
Stakeholder Analysis Matrix Example Presentation
Make every relationship in your project strategy crystal clear with this smart and colorful matrix design. Perfect for mapping influence, interest, and engagement levels, it helps teams identify priorities and manage communication effectively. Fully editable and compatible with PowerPoint, Keynote, and Google Slides for seamless customization.


26 slides
Geometric Technology Presentation
Technology has changed the world we live in, it is a powerful tool when used correctly and with caution. This template offers a sleek way to deliver your message and is designed with geometric shapes that are arranged in a flexible design. It includes a backdrop with a geometric pattern, which can be customized with your own images and colors. This template is a great way to impress your teachers, clients, or students with the newest technologies. With an emphasis on high-quality visuals, this template is perfect for illustrating your ideas and giving people confidence in your business plan.


7 slides
Local Sales Infographic
Local sales refer to transactions or sales activities that occur within a specific geographic area or locality. This infographic template is a visual tour through the vibrant world of neighborhood commerce, where small businesses flourish and community connections thrive. This template is designed to encourage your audience to embrace the local sales experience. This invites them to explore and support their community's treasures, fostering a strong local economy. Fully customizable and compatible with Powerpoint, Keynote, and Google Slides. Use visuals like sale tags or a shopping cart to illustrate the concept of attracting shoppers through offers.


6 slides
United States Coronavirus Map
A United States Coronavirus Map is a graphical representation that displays the spread of the coronavirus (COVID-19) across the United States. This infographic template may use different colors, shades, or symbols to indicate the severity of COVID-19 cases in different areas. Darker colors may represent higher case numbers, while lighter colors may represent lower case numbers. These maps are valuable tools to track the progression of the virus, identify hotspots, and make informed decisions related to public health. This can also help raise awareness about the importance of preventive measures and promote data-driven strategies to control the spread.


4 slides
Sales and Reach Across Asia Map Presentation
Visualize your company’s market presence with the Sales and Reach Across Asia Map Presentation. Featuring clean markers, color-coded regions, and icon-labeled highlights, this template helps you clearly showcase key sales zones, distribution channels, or growth markets across Asia. Perfect for business reviews, expansion pitches, and performance updates. Fully editable in PowerPoint, Keynote, Google Slides, and Canva.


5 slides
Project Task Management Presentation
Stay on top of your workflow with this visually organized project task management slide. It features a clear table layout with editable fields for subject, priority level, due date, task status, progress percentage, and last modified date. Ideal for teams managing multiple tasks and deadlines. Use color-coded status bars and icons to communicate task progress at a glance. Perfect for project managers and team leaders. Compatible with PowerPoint, Keynote, and Google Slides.


10 slides
Body System Educational Overview Presentation
Dive into anatomy with a slide that makes learning the human body visual, clear, and interactive. This educational overview breaks down key body systems into simple, labeled sections—perfect for classroom teaching, medical training, or health awareness campaigns. Fully editable and compatible with PowerPoint, Keynote, and Google Slides for seamless customization.


5 slides
Tips for Recycling Infographics
Recycling is an important practice that helps reduce waste, conserve resources, and protect the environment. These vertical infographics are designed to educate and encourage individuals on effective recycling practices. These provides a comprehensive overview of recycling and offers practical tips to help people incorporate recycling into their daily lives. This aims to educate and inspire individuals to take an active role in recycling and waste reduction. These are the perfect tools to raise awareness about waste management, and encourage sustainable behaviors. Compatible with Powerpoint, Keynote, and Google Slides.


6 slides
Solution Architect Infographics
Our Solution Architect infographic is an exceptional visual aid designed for Powerpoint, Keynote, and Google Slides. This infographic is perfectly suited for solution architects, systems engineers, and IT professionals who need to convey complex architectural solutions in a clear and concise manner. The infographic is structured to outline the components of a solution architecture framework, including the software, hardware, and network infrastructure. It helps in visualizing the relationships between different system components, making it easier to understand how they work together to create a comprehensive solution. Using this infographic in your presentations will not only add a professional touch but also enhance the audience's comprehension of the solution architecture. Whether you're explaining the architecture of a new software system, the integration of various technologies, or the planning of an IT project, this infographic provides a streamlined way to share that information, ensuring your concepts are communicated effectively.


6 slides
Marketing Business Plan Infographics
The "Marketing Business Plan" infographic template is a strategic and detailed resource, perfect for PowerPoint, Keynote, and Google Slides. Designed for marketing professionals, business strategists, and entrepreneurs, this template is an effective tool for planning and presenting marketing strategies. This template includes key components of a marketing business plan, such as market analysis, marketing strategies, target audience identification, and budget allocation. Its structured layout helps users clearly present their marketing approach, making it invaluable for business plan presentations, strategy meetings, and marketing courses. The design is professional and focused, with a dynamic color scheme that uses shades of blue, green, and orange. This palette not only makes the template visually appealing but also symbolizes important aspects of marketing planning, such as creativity, growth, and organization. Whether used in business pitches, strategy workshops, or educational settings, this template ensures that your marketing business plan is conveyed with clarity and visual impact.


10 slides
Employee Retention and HR Strategy Presentation
Present your HR initiatives with a clean, puzzle-inspired visual in this Employee Retention and HR Strategy slide. This layout features a silhouette icon alongside a 5-step vertical format—each step with its own icon and title box—to illustrate key elements like onboarding, employee engagement, recognition programs, and more. Fully editable and compatible with PowerPoint, Keynote, and Google Slides.