


Features
- 4 Unique slides
- Fully editable and easy to edit in Microsoft Powerpoint, Keynote and Google Slides
- 16:9 widescreen layout
- Clean and professional designs
- Export to JPG, PDF or send by email


Do you have any questions?
Recommend


28 slides
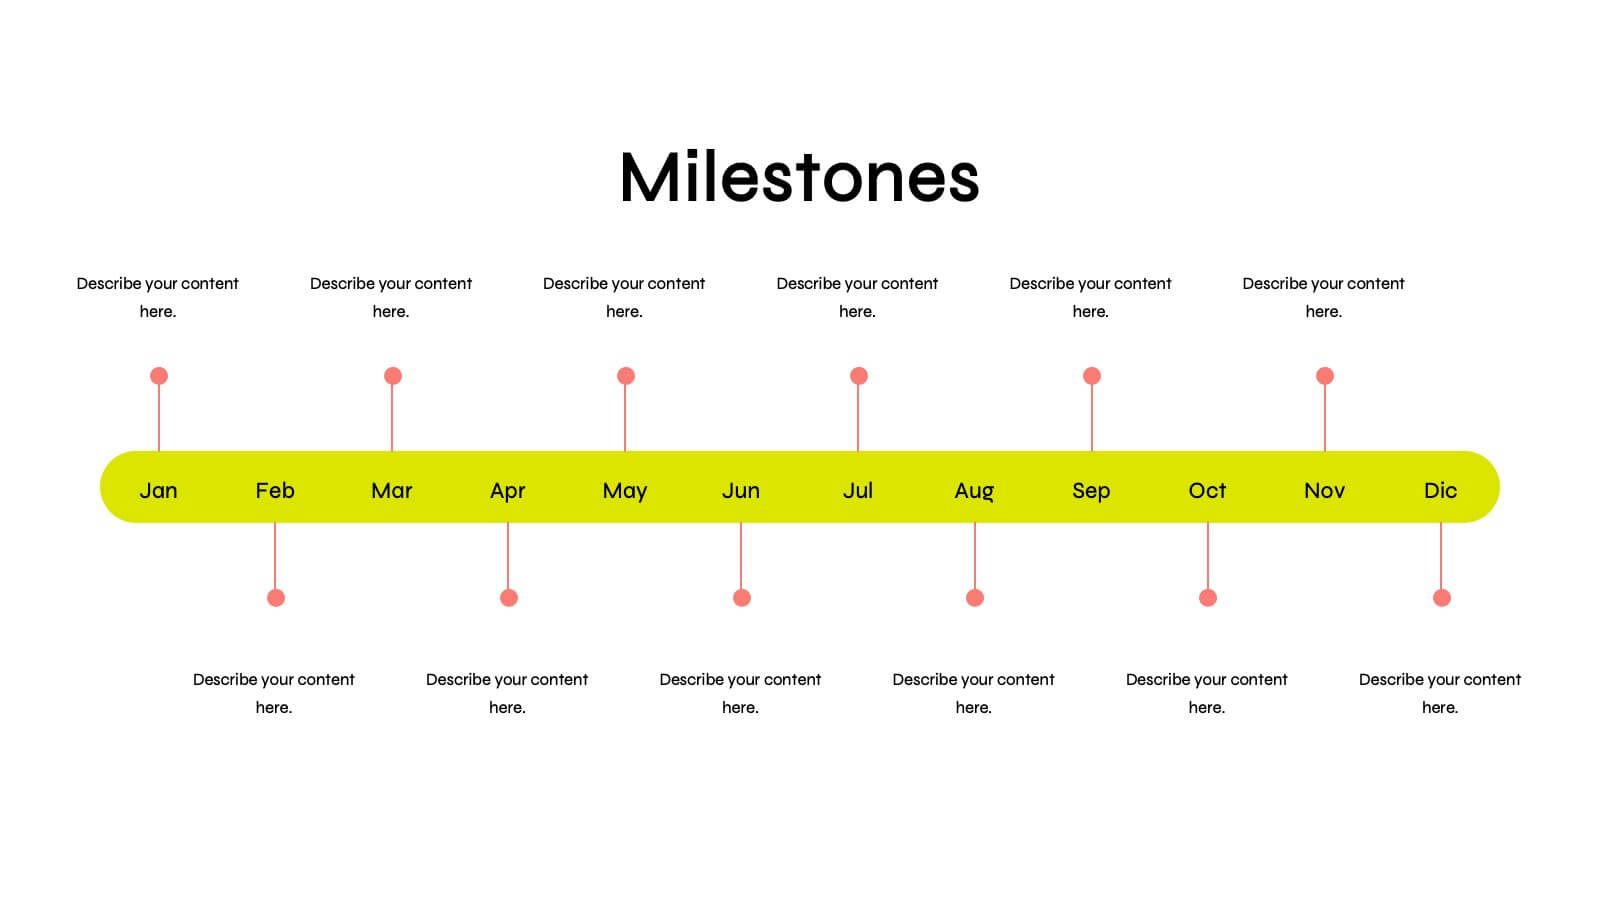
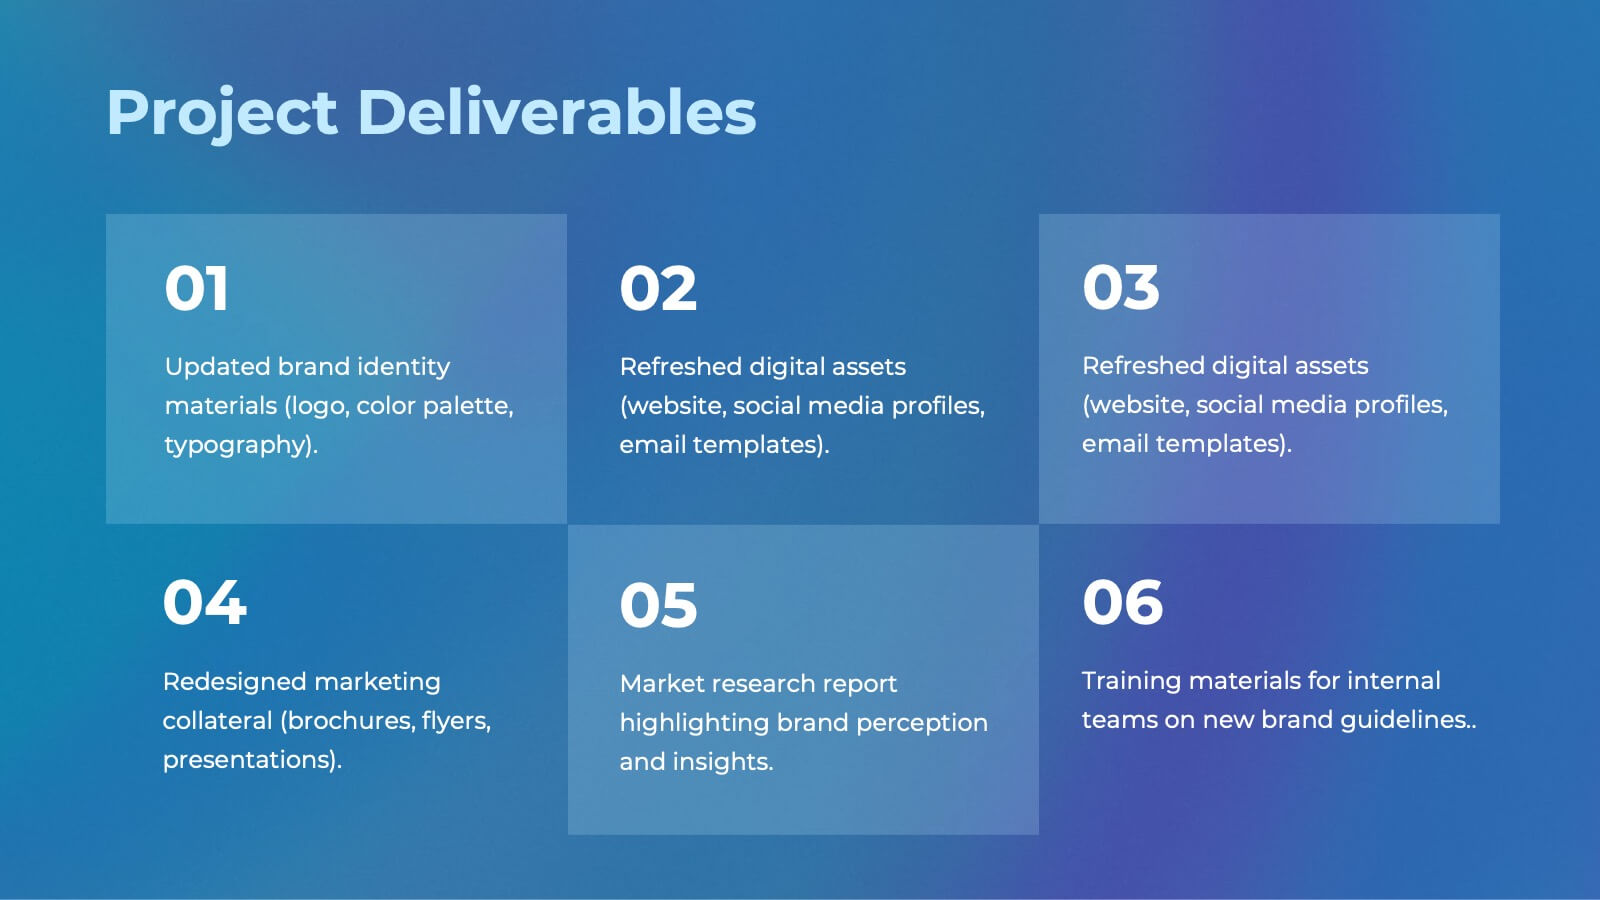
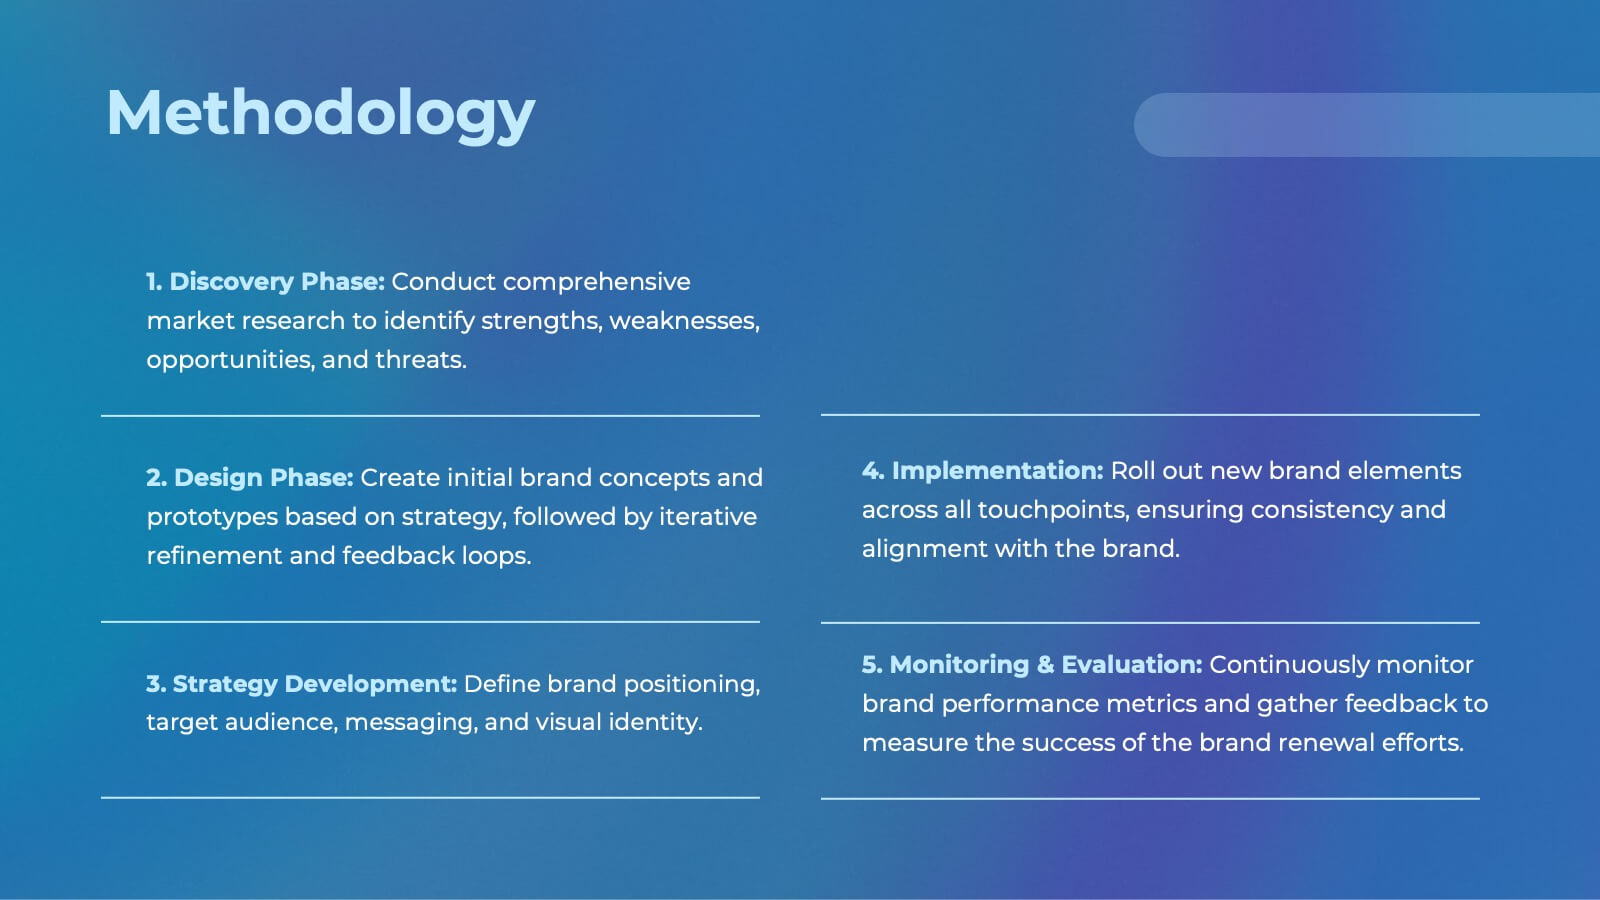
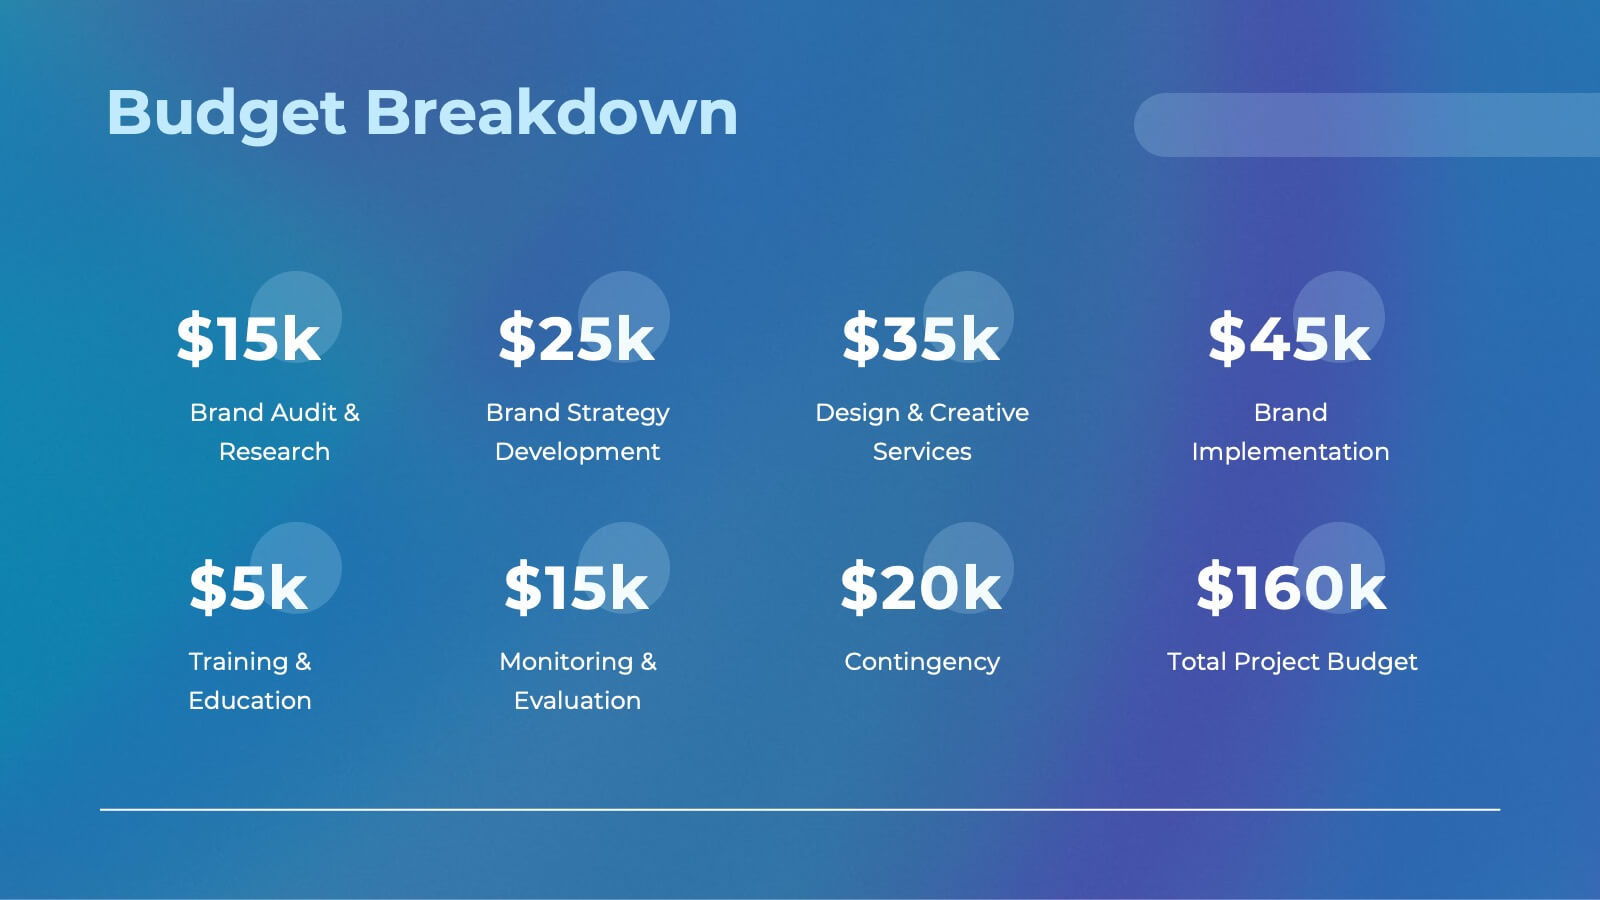
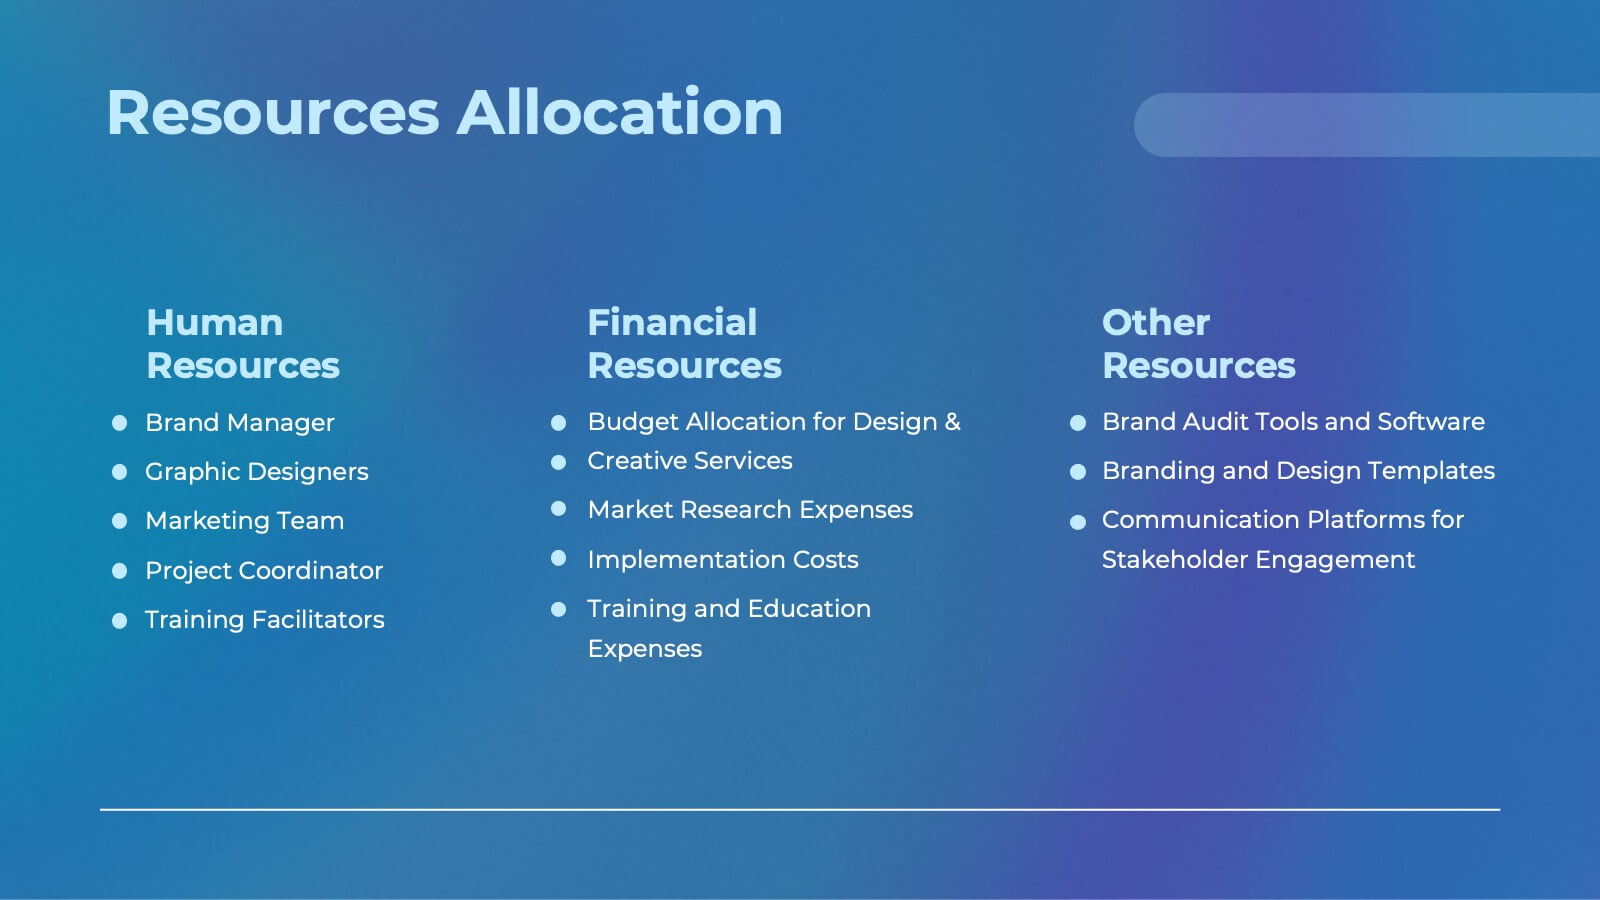
Ignite Rebranding Project Plan Presentation
Ignite your brand with this vibrant project plan template! Perfect for defining brand identity, vision, and strategy. Ideal for marketers and brand managers aiming to create a cohesive and compelling brand presence. Compatible with PowerPoint, Keynote, and Google Slides, this template ensures your branding is impactful and professional. Make your brand unforgettable!


10 slides
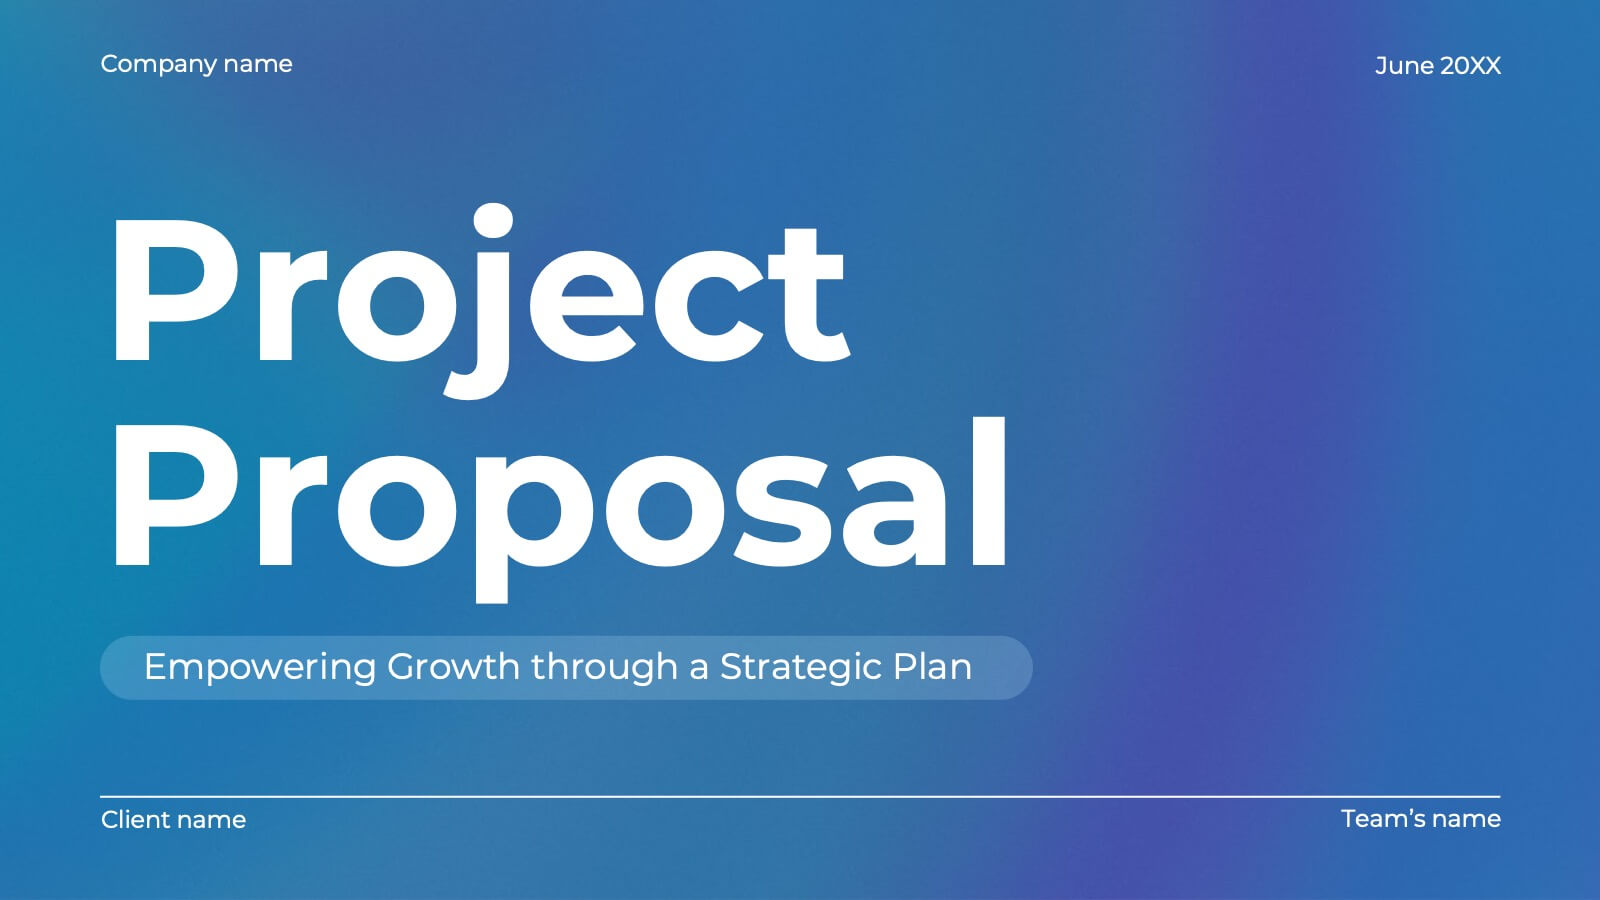
Strategic Business Action Plan Presentation
Create a roadmap for success with the Strategic Business Action Plan presentation. This well-structured template provides a clear, step-by-step framework for executing business strategies, making it ideal for corporate teams, entrepreneurs, and business consultants. Its modern design ensures effective communication of key goals and objectives. Fully customizable and compatible with PowerPoint, Keynote, and Google Slides.


22 slides
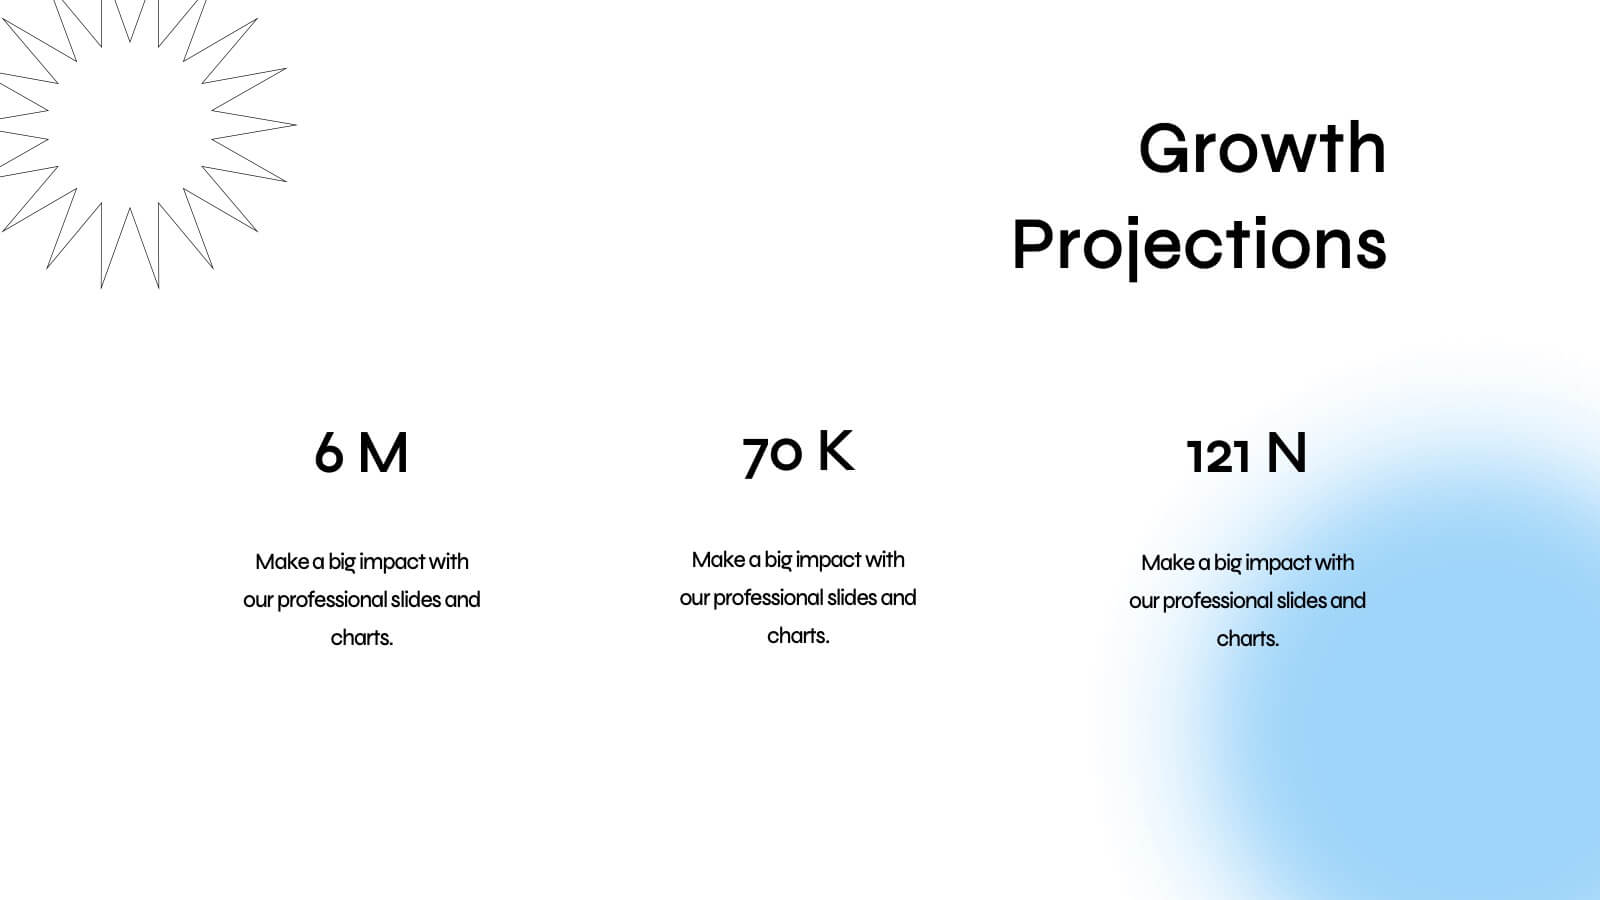
Quirinus Investor Pitch Presentation
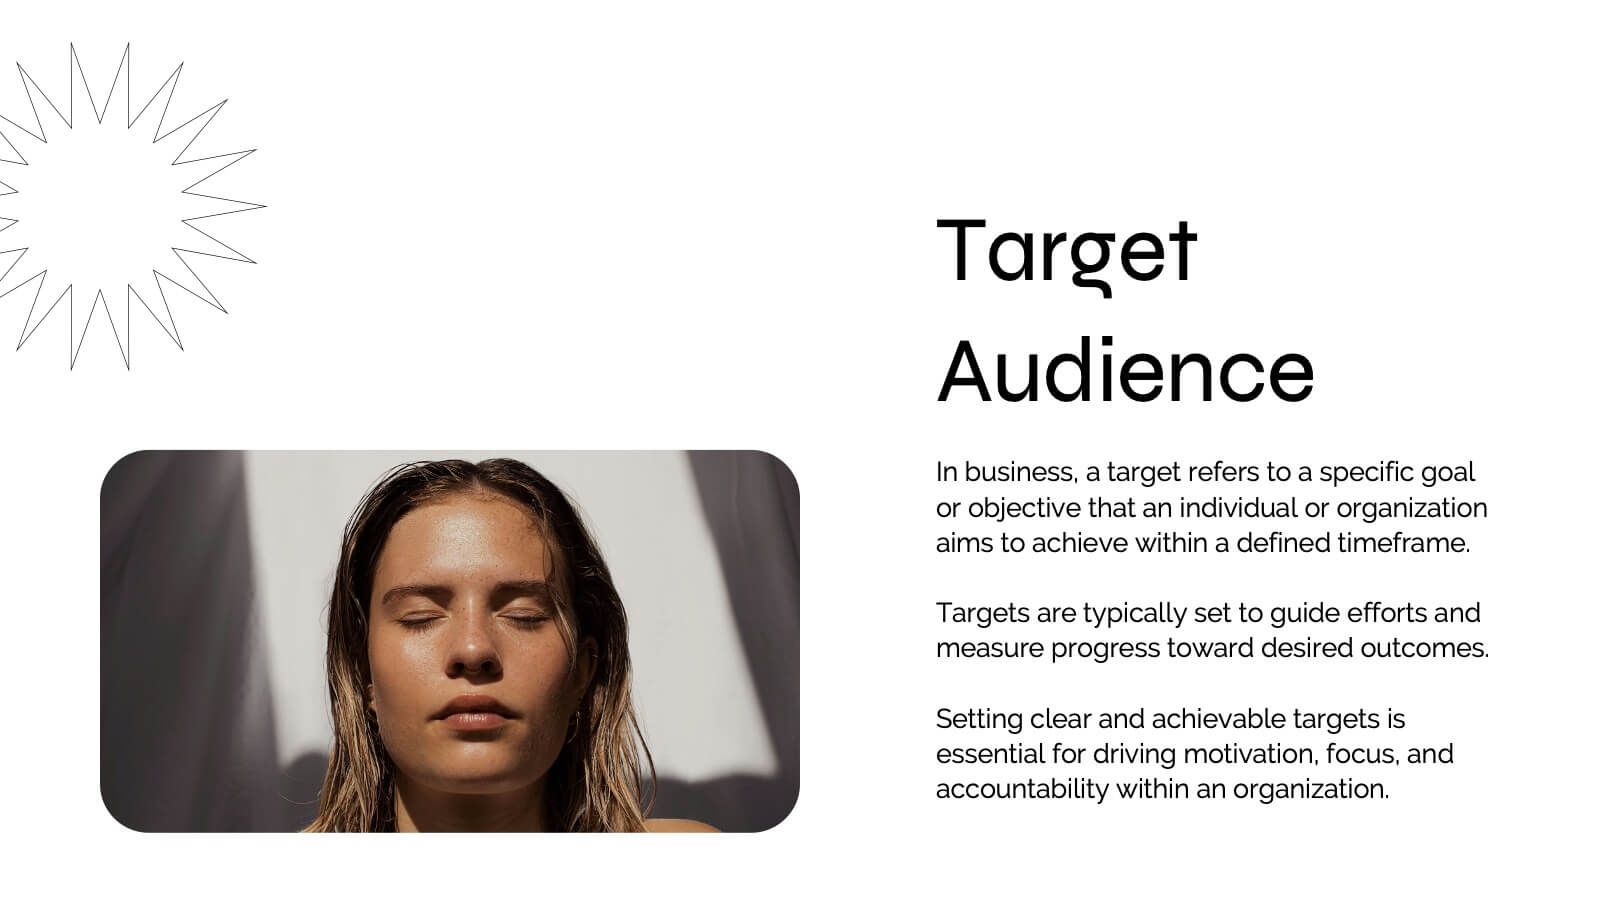
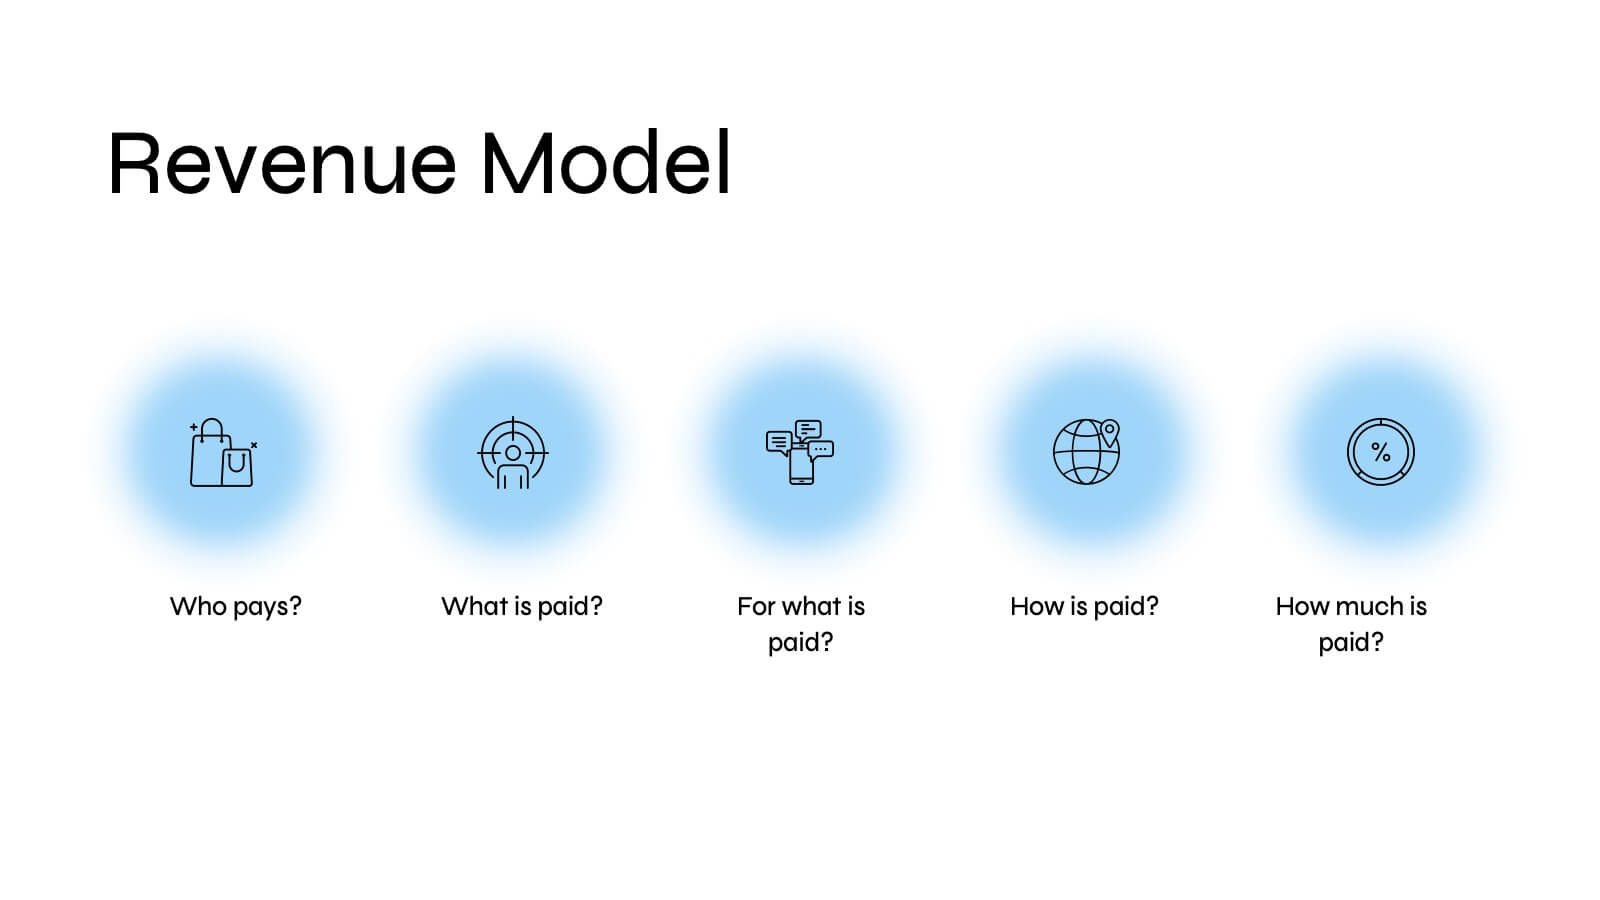
Ready to impress investors and stakeholders? This sleek and modern pitch deck template covers all the essentials, from problem statements and market opportunities to revenue models and growth projections. Each slide is designed to convey clear and compelling information for maximum impact. Fully compatible with PowerPoint, Keynote, and Google Slides, making it the perfect tool for your next product launch!


8 slides
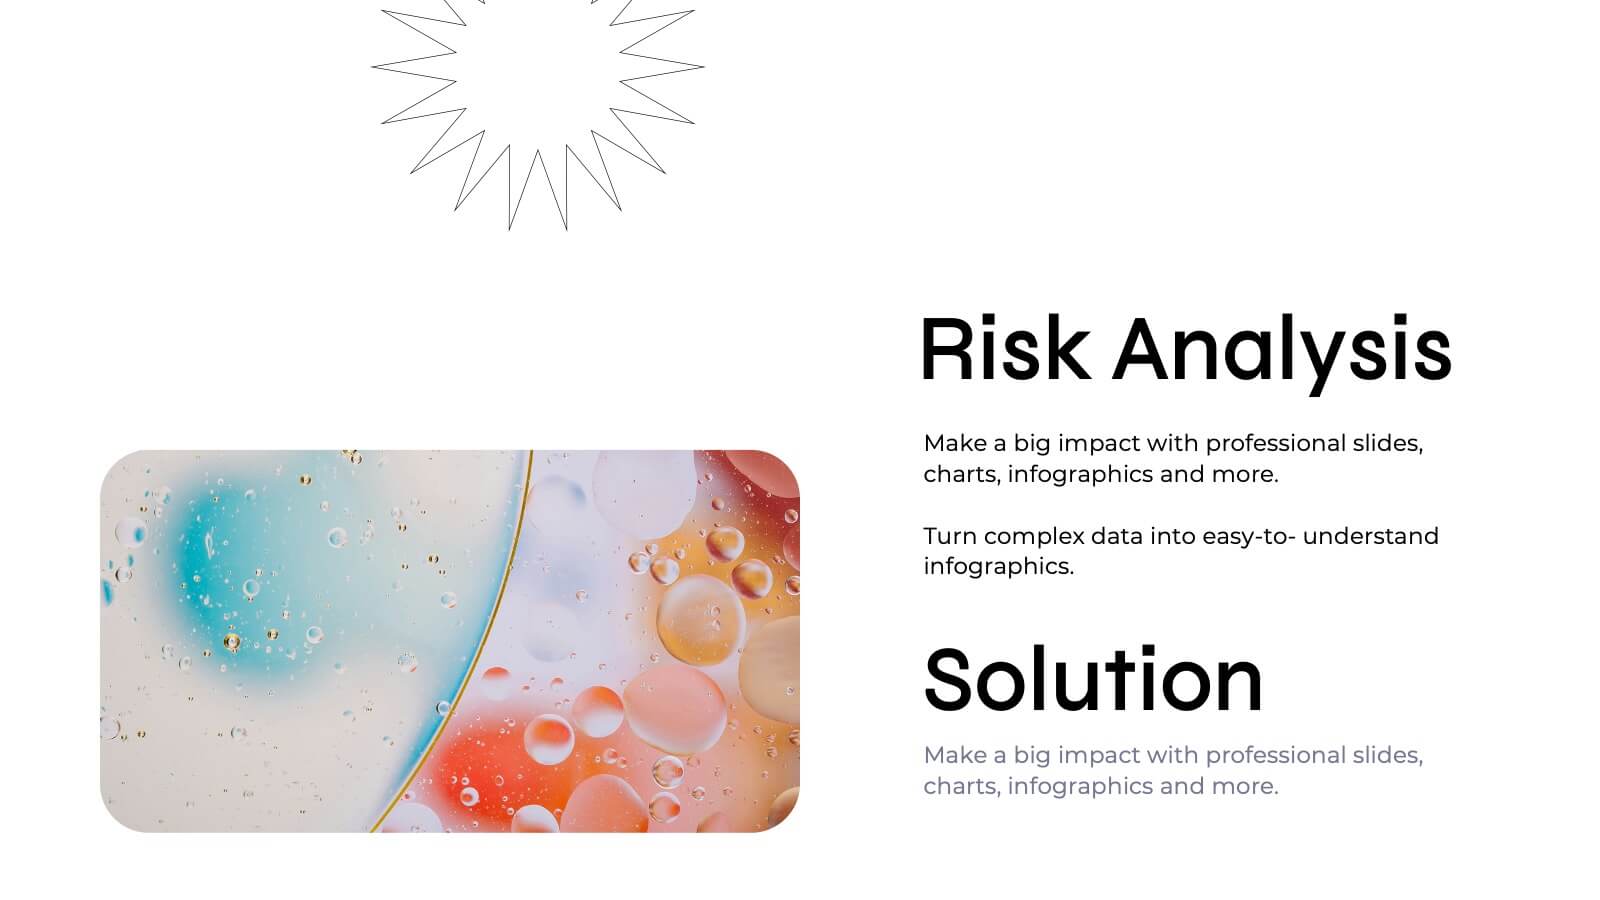
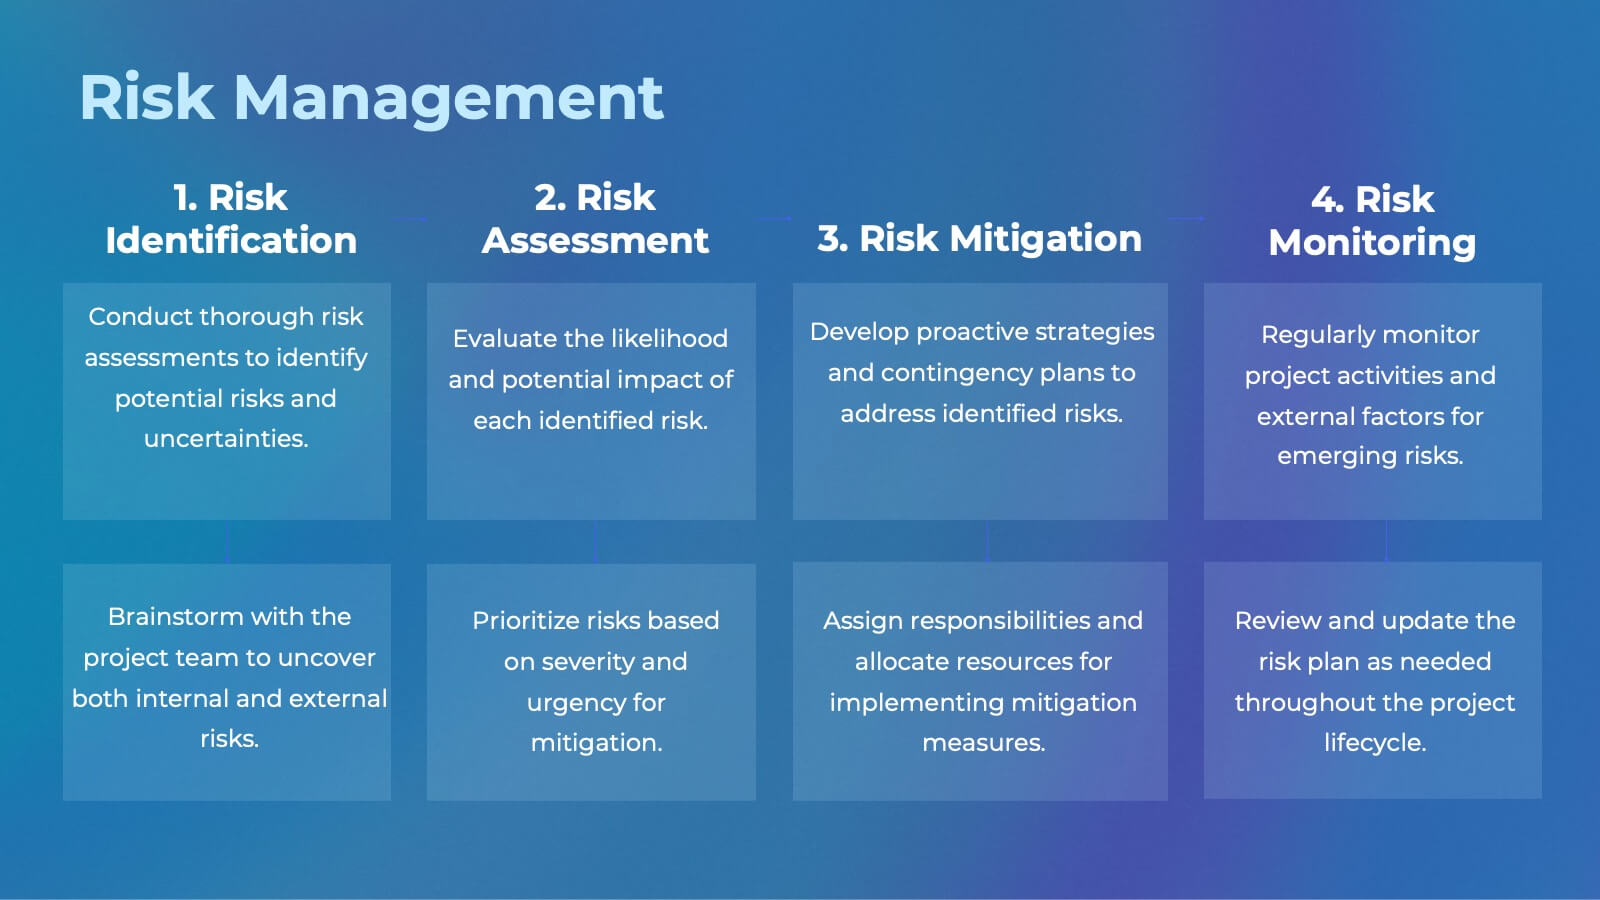
Business Risk Identification and Management
Simplify complex risk factors with this visually engaging diagram. This template uses overlapping circular segments to categorize and assess risk impact across four business areas—ideal for project managers, analysts, and consultants. Customizable progress bars help communicate risk levels with clarity. Compatible with PowerPoint, Keynote, and Google Slides.


21 slides
Ember Agile Project Plan Presentation
Ready to ace your next project proposal? This sleek presentation template is perfect for outlining objectives, timelines, and budgets. Designed for professionals aiming to impress stakeholders and secure approvals. Compatible with PowerPoint, Keynote, and Google Slides, it ensures a smooth and professional presentation every time. Ideal for project managers and business leaders.


7 slides
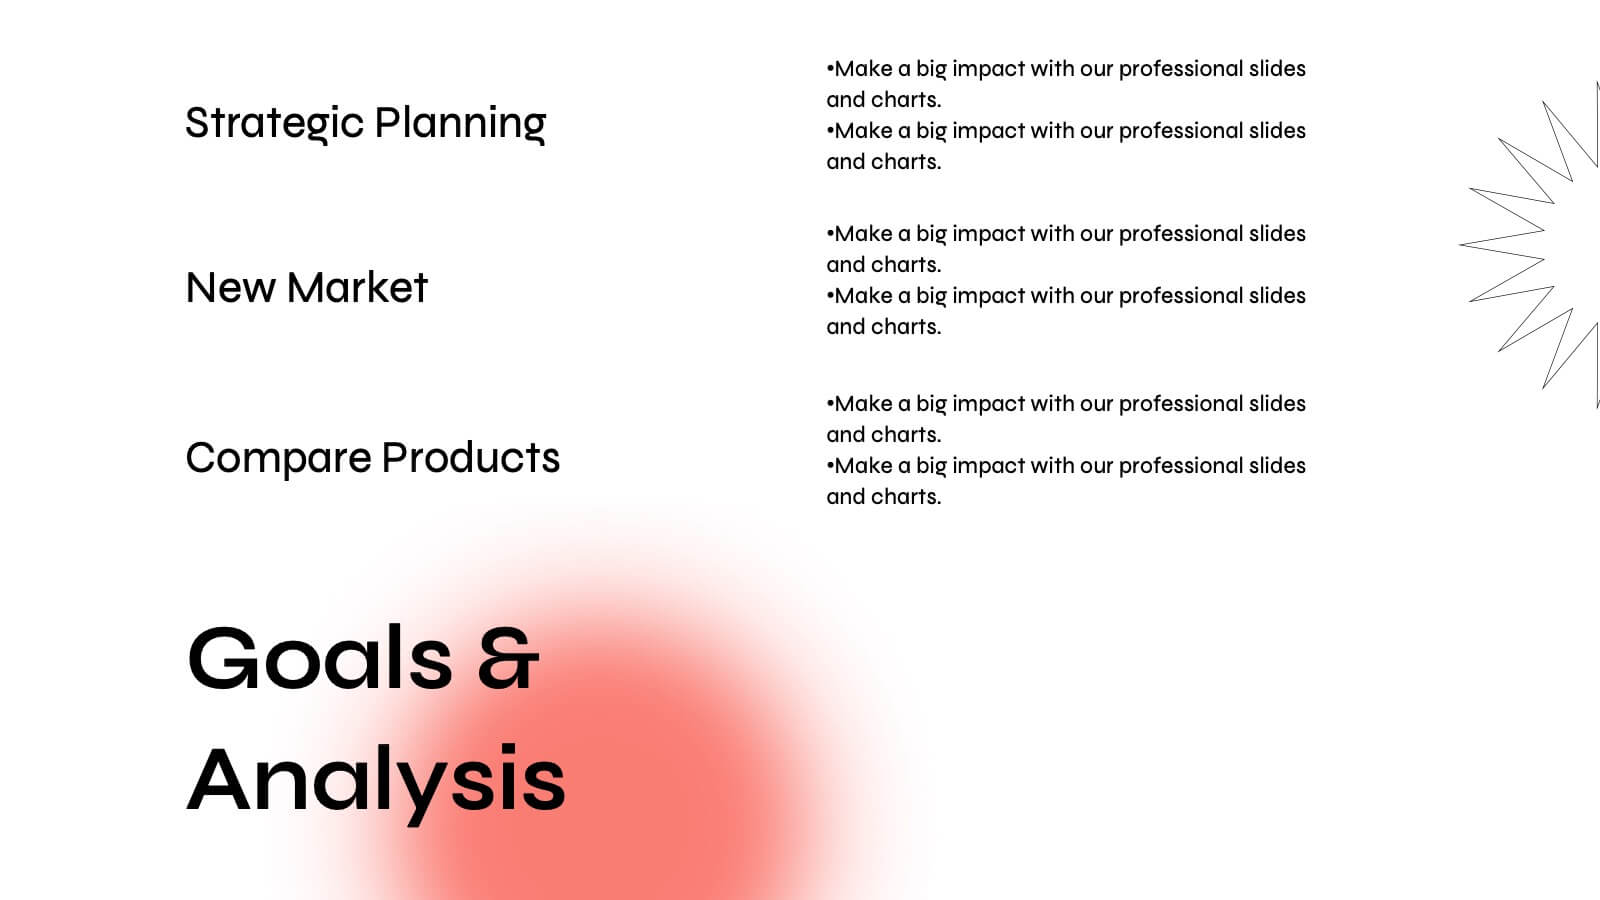
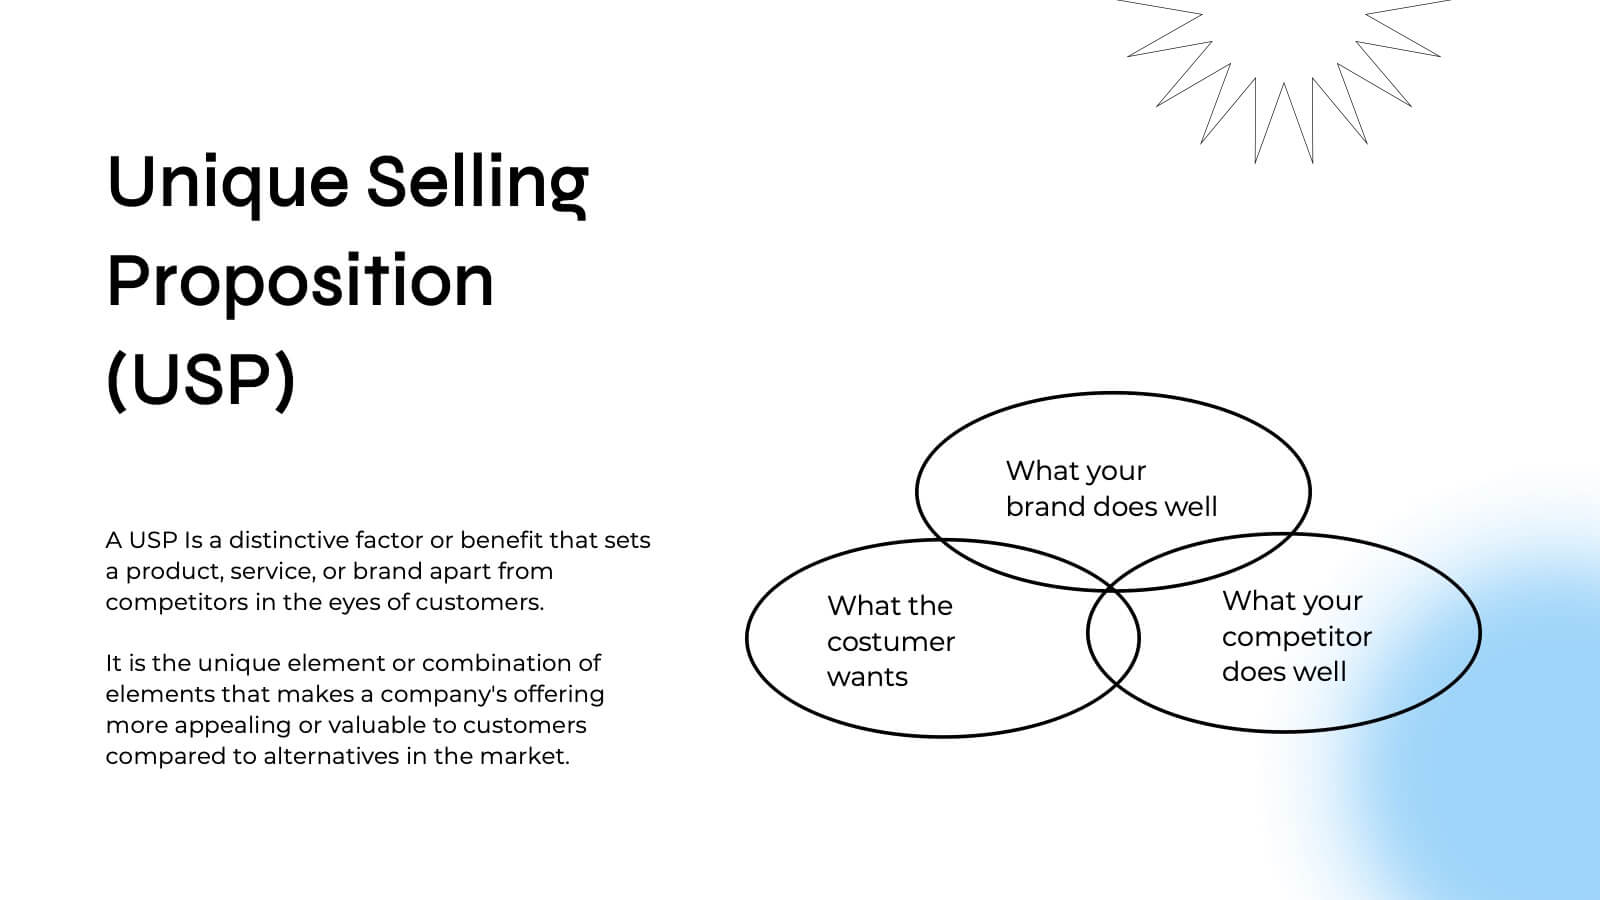
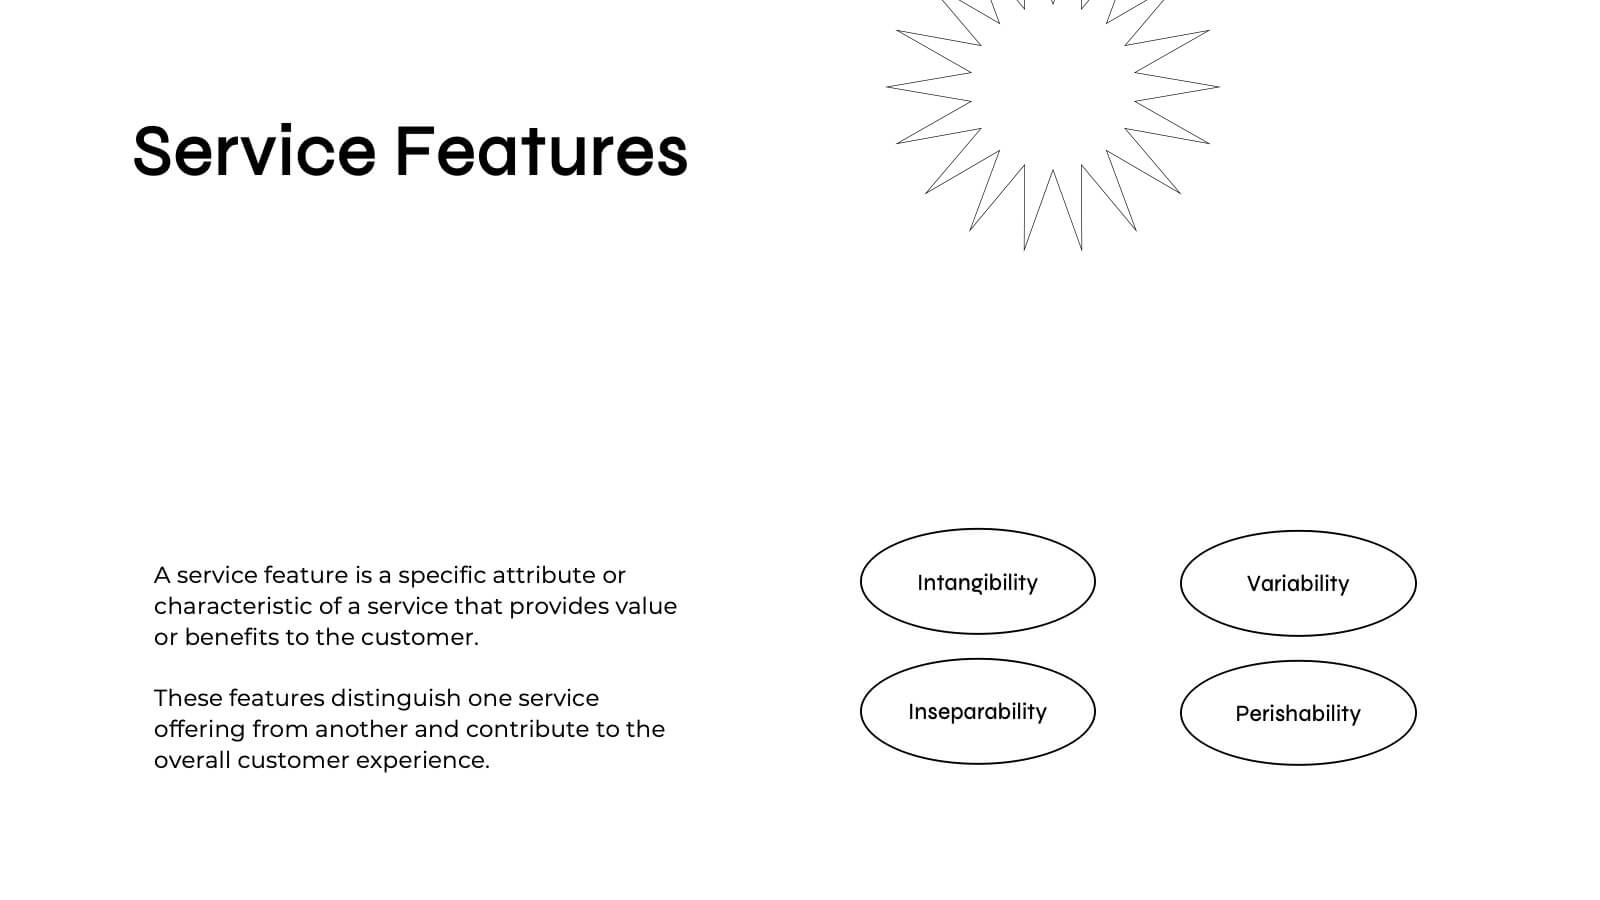
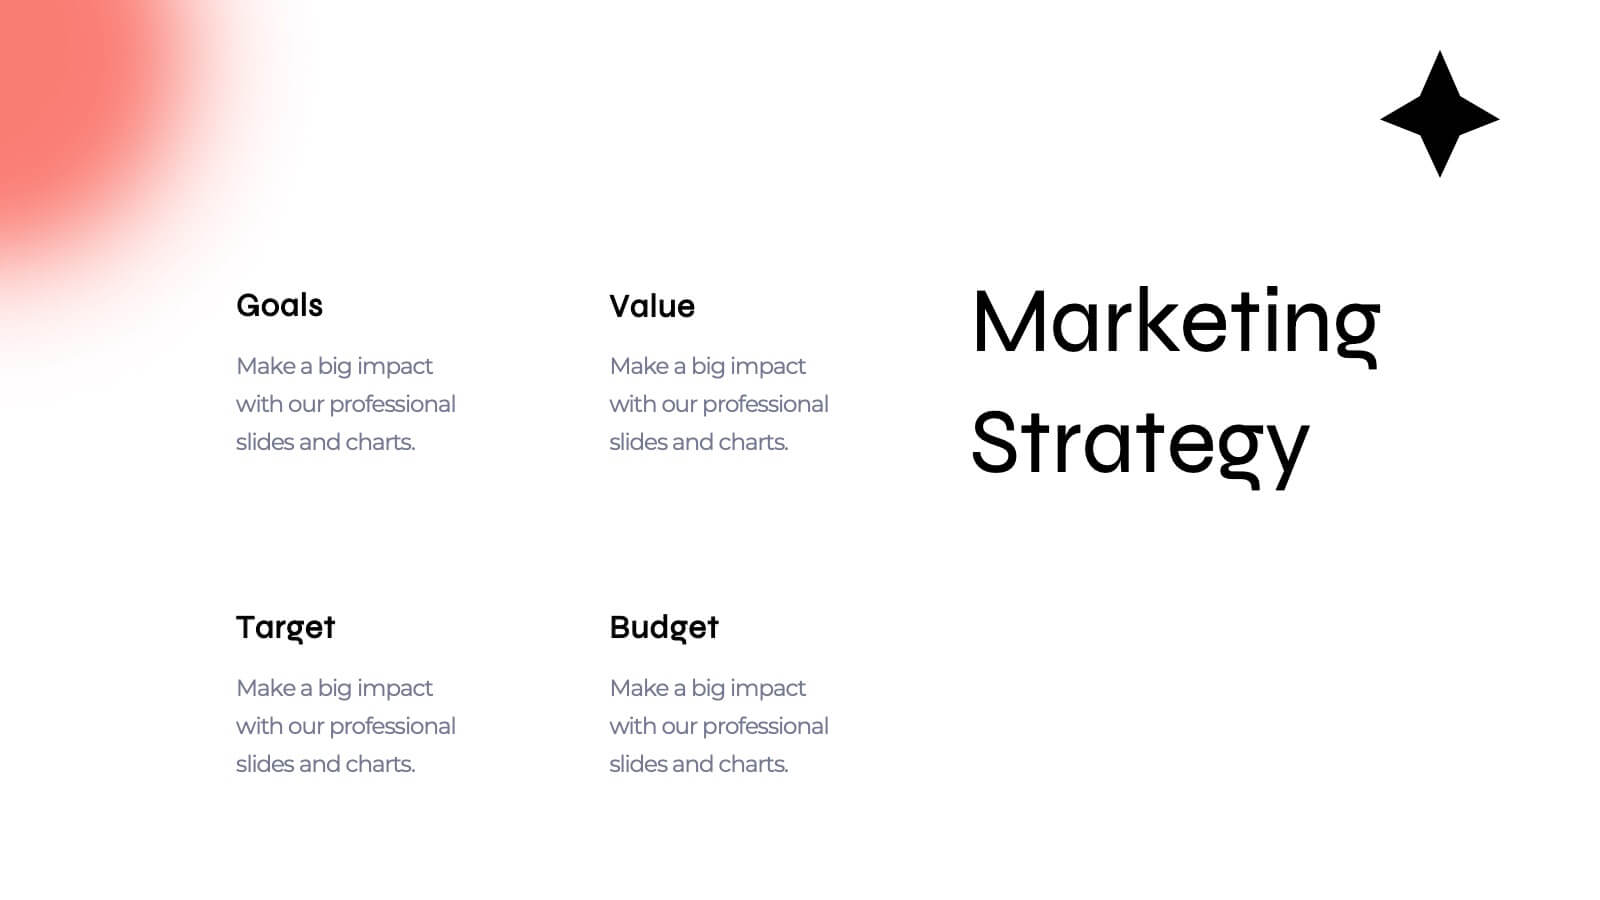
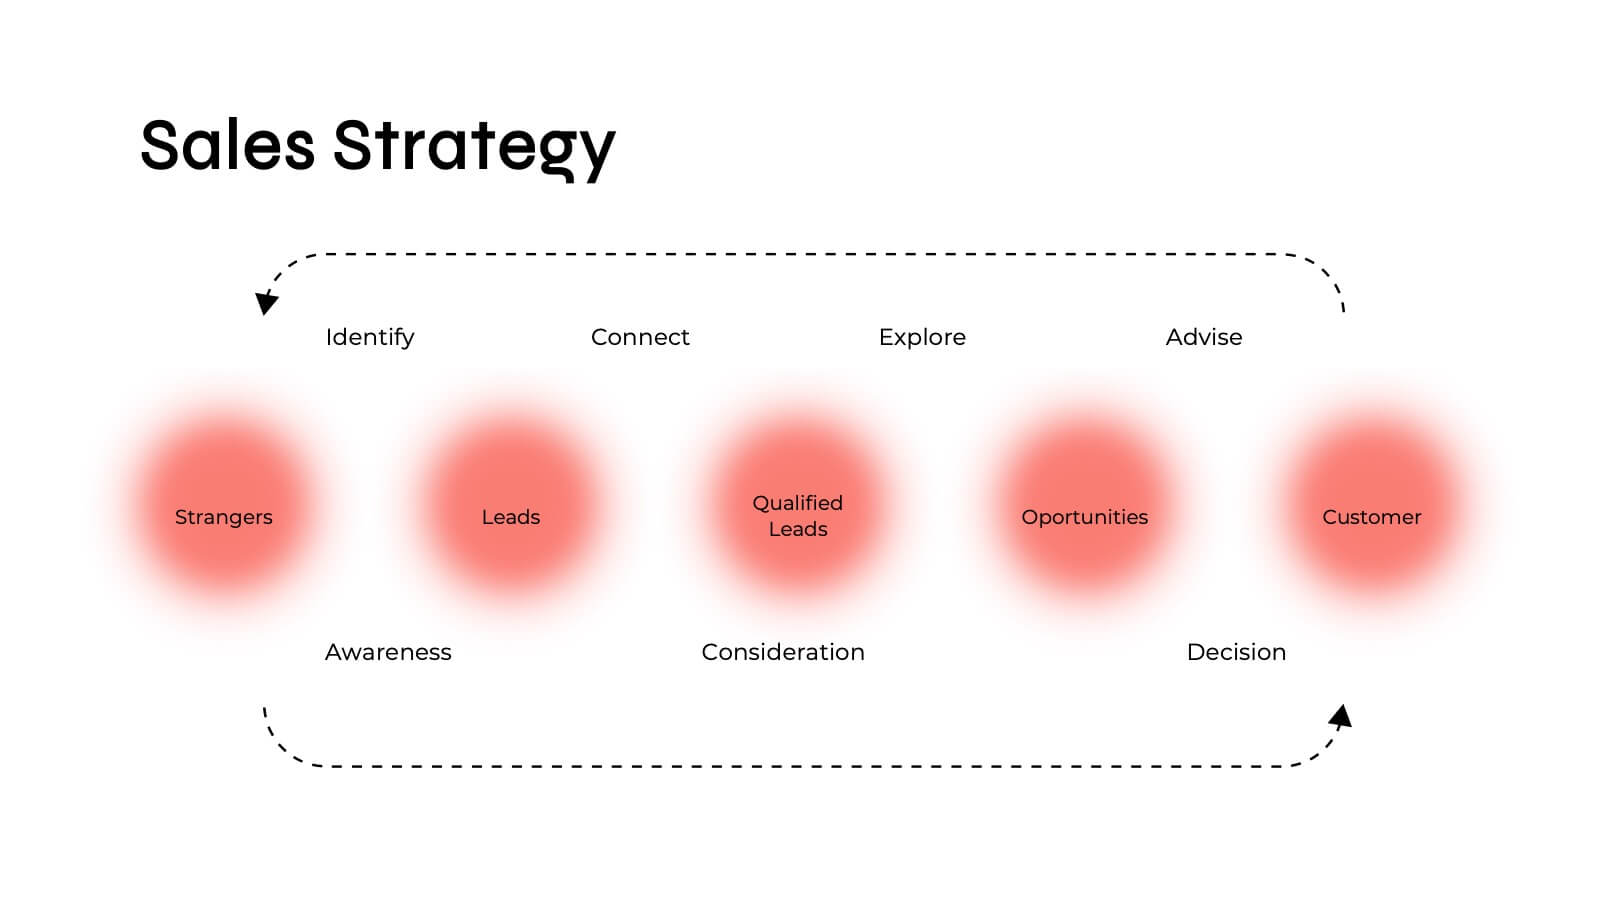
Business Strategy Infographic Presentation Template
A business strategy is a detailed plan that lays your goals, accomplishments and direction for the whole organization. A strategic plan will bring stability to your business and make it more profitable. This template can be used to inform your business on how essential a business strategy is. With this template, your business will learn that creating a strategy will help gain a better understanding of their organization's current strengths and weaknesses. This template is easy to use, includes helpful illustrations and allows you to add tips for managing your business more effectively.


6 slides
Office Scenes Season Infographic
"Office Scenes" typically refer to the environments and activities that take place within an office setting. This Infographic template is a visual representation that showcases different scenarios and activities that commonly take place in an office environment. This type of infographic can be used to illustrate various aspects of office life, work culture, and interactions. This template provide insights into the day-to-day activities and culture of your workplace. Fully customizable and compatible with Powerpoint, Keynote, and Google Slides. Include your company logo or branding elements in the infographic.


2 slides
Small Business Success Illustrations
Get your business on the right track with our small business success illustrations pack! These illustrations will help you with your next business presentation and make it more engaging and catchy. Fully compatible with Powerpoint, Keynote, and Google Slides. You can use these in your website, blog or social media posts. Turn your vision into a reality—download the small business success illustrations pack today!


7 slides
Root Cause Analysis for Problem Solving Presentation
Identify and Resolve Issues Effectively with this Root Cause Analysis for Problem Solving presentation template. Designed to streamline complex problem-solving, this layout features clear visual markers, structured iconography, and step-by-step segmentation to help teams analyze causes, pinpoint bottlenecks, and implement solutions efficiently. Ideal for project managers, business analysts, and operational teams, this template is fully customizable and works seamlessly in PowerPoint, Keynote, and Google Slides, ensuring a professional and engaging presentation experience.


5 slides
Construction Sector and Careers Infographics
Construction Infographics provide information and data related to the construction industry. This template is a visually appealing and informative design that allows you to present key information about the construction industry and various career opportunities within it. This template provides a comprehensive platform to showcase the different aspects of the industry and the diverse career paths available. Compatible with Powerpoint, Keynote, and Google Slides, ensuring easy customization and flexibility. The infographics feature construction-themed illustrations and icons, to captures the attention of your audience and add visual interest.


4 slides
Social Media Content Strategy Presentation
Engage your audience with this Social Media Content Strategy Presentation. Featuring side-by-side thumbs-up icons, this template visually contrasts two key focus areas—ideal for comparing campaign goals, content pillars, or platform strategies. Each section includes editable text blocks to outline insights clearly. Fully customizable and compatible with PowerPoint, Keynote, and Google Slides.


7 slides
Digital KPI Dashboard Infographic
A KPI Dashboard is a visual representation of the most important performance metrics or KPIs that track the progress of an organization or business activities. This infographic template is designed to showcase the KPIs and metrics that are crucial for evaluating the success of digital marketing efforts. This template provides an overview of various digital marketing KPIs in an easy-to-understand format. The template utilizes eye-catching charts, graphs, and diagrams to present digital marketing data in a visually appealing way. Bar graphs, line charts, pie charts, and other visual elements make it easy to grasp the performance trends at a glance.


6 slides
Stock Market Predictions Infographic
Stock market predictions refer to attempts to forecast the future performance of stock prices and overall market trends. This infographic template visually presents insights and predictions about the future performance of the stock market, based on various indicators and factors. This template involves evaluating a company's financial health, earnings, revenue, assets, liabilities, and management to determine its intrinsic value. Fully customizable and compatible with Powerpoint, Keynote, and Google Slides. You can choose a color palette that conveys the stock market and professionalism, typically using shades of blue and red.


6 slides
Platform-Specific Social Strategy Presentation
Break down your marketing approach by channel using this clear, platform-focused timeline. Highlight strategies for TikTok, Facebook, Instagram, X, and email in a linear, easy-to-read format. Ideal for digital marketers, content teams, and social media managers. Fully editable in PowerPoint, Keynote, and Google Slides to match your brand and strategy.


5 slides
Global Nonprofit Help Infographics
A global nonprofit organization is a type of organization that operates on an international scale and focuses on making a positive impact on a global scale. These vertical infographics focuses on the impact and importance of nonprofit organizations worldwide. This is ideal for showcasing the achievements and goals of nonprofits in addressing various global issues, such as poverty, healthcare, and environmental conservation. The infographics include a collection of captivating icons and illustrations related to nonprofit work. These slides allow you to present compelling stories, case studies, and success stories that demonstrate the real-world impact of nonprofit work.


8 slides
Marketing Campaign Performance Presentation
Showcase campaign metrics in style with this Marketing Campaign Performance layout. Featuring four icon-labeled data cards at the top and two integrated charts below (pie and bar), this slide offers a snapshot of performance insights—ideal for comparing reach, engagement, and conversion data across platforms. Fully editable and compatible with PowerPoint, Keynote, and Google Slides.


6 slides
SEO Ads and Social Media Planning Presentation
Boost your online presence with the SEO, Ads, and Social Media Planning Presentation. This layout features engaging iconography and a central post mockup to highlight content strategy, paid advertising, engagement metrics, and platform-specific insights. Ideal for marketing teams and campaign proposals. Fully editable in PowerPoint, Keynote, and Google Slides.