


Features
- 20 Unique Slides
- Fully editable and easy to edit in Microsoft Powerpoint, Keynote and Google Slides
- 16:9 widescreen layout
- Clean and professional designs
- Export to JPG, PDF or send by email


Do you have any questions?
Recommend


21 slides
Literati Research Proposal Presentation
Present your research proposal with confidence using this professionally crafted template, designed to streamline complex ideas into a cohesive, engaging narrative. With a modern design and dynamic visuals, it ensures your research objectives and findings are communicated effectively. The template includes sections for your introduction, background, methodology, data collection, analysis, and key findings, giving your proposal a logical structure. Use the literature review and data visualization slides to back up your arguments with credible sources and compelling graphics. Dedicated slides for conclusions, recommendations, and implications allow you to outline the impact of your research clearly. Fully editable in PowerPoint, Google Slides, and Keynote, this template adapts effortlessly to your needs. Perfect for academic, corporate, or professional research presentations, it combines sleek design with functionality to ensure your proposal resonates with your audience. Take your research to the next level with a template that reflects your dedication to excellence.


6 slides
12-Month Calendar Overview Presentation
Kick off your planning with a clean, colorful layout that makes every month easy to visualize at a glance. This presentation helps you map timelines, milestones, and deadlines in a structured format ideal for yearly planning. Fully editable and compatible with PowerPoint, Keynote, and Google Slides.


4 slides
Differentiation through Blue Ocean Framework Presentation
Make waves with this bold, eye-catching layout built to show what sets your strategy apart. This presentation template explores how to stand out in untapped markets using a simple comparison framework, perfect for teams shifting from competition to innovation. Easily editable and ready for PowerPoint, Keynote, and Google Slides.


5 slides
Big Data Analytics Process Presentation
Visualize your data journey with this clean and professional slide layout. Featuring four circular icons around a central cloud graphic, it’s ideal for showcasing data collection, processing, analysis, and storage. Perfect for tech briefings or analytics teams. Fully editable and compatible with PowerPoint, Keynote, and Google Slides.


21 slides
Versa Product Development Plan Presentation
Bring your product ideas to life with this sleek and professional presentation template. It covers every stage of the development process: from product overviews, features, and competitive analysis to pricing strategies, marketing plans, and technical specifications. Visually striking sections like distribution channels and production processes ensure a clear and structured roadmap for your team and stakeholders. Fully customizable and compatible with PowerPoint, Keynote, and Google Slides.


4 slides
Aviation Industry Overview Presentation
Bring your data in for a smooth takeoff with this clean and modern visual layout. Perfect for presenting industry insights, market trends, or operational performance, this design helps convey complex information with clarity and flow. Fully editable and compatible with PowerPoint, Keynote, and Google Slides for seamless customization.


4 slides
Healthcare Access and Preventive Care Presentation
Bring your health strategy to life with this engaging heart-themed infographic slide. Perfect for illustrating patient access points, wellness checkpoints, or preventive initiatives, each segment is cleanly organized with icons and text. Ideal for medical presentations, this template works seamlessly in PowerPoint, Keynote, and Google Slides for total flexibility.


22 slides
Nimbus Business Development Proposal Presentation
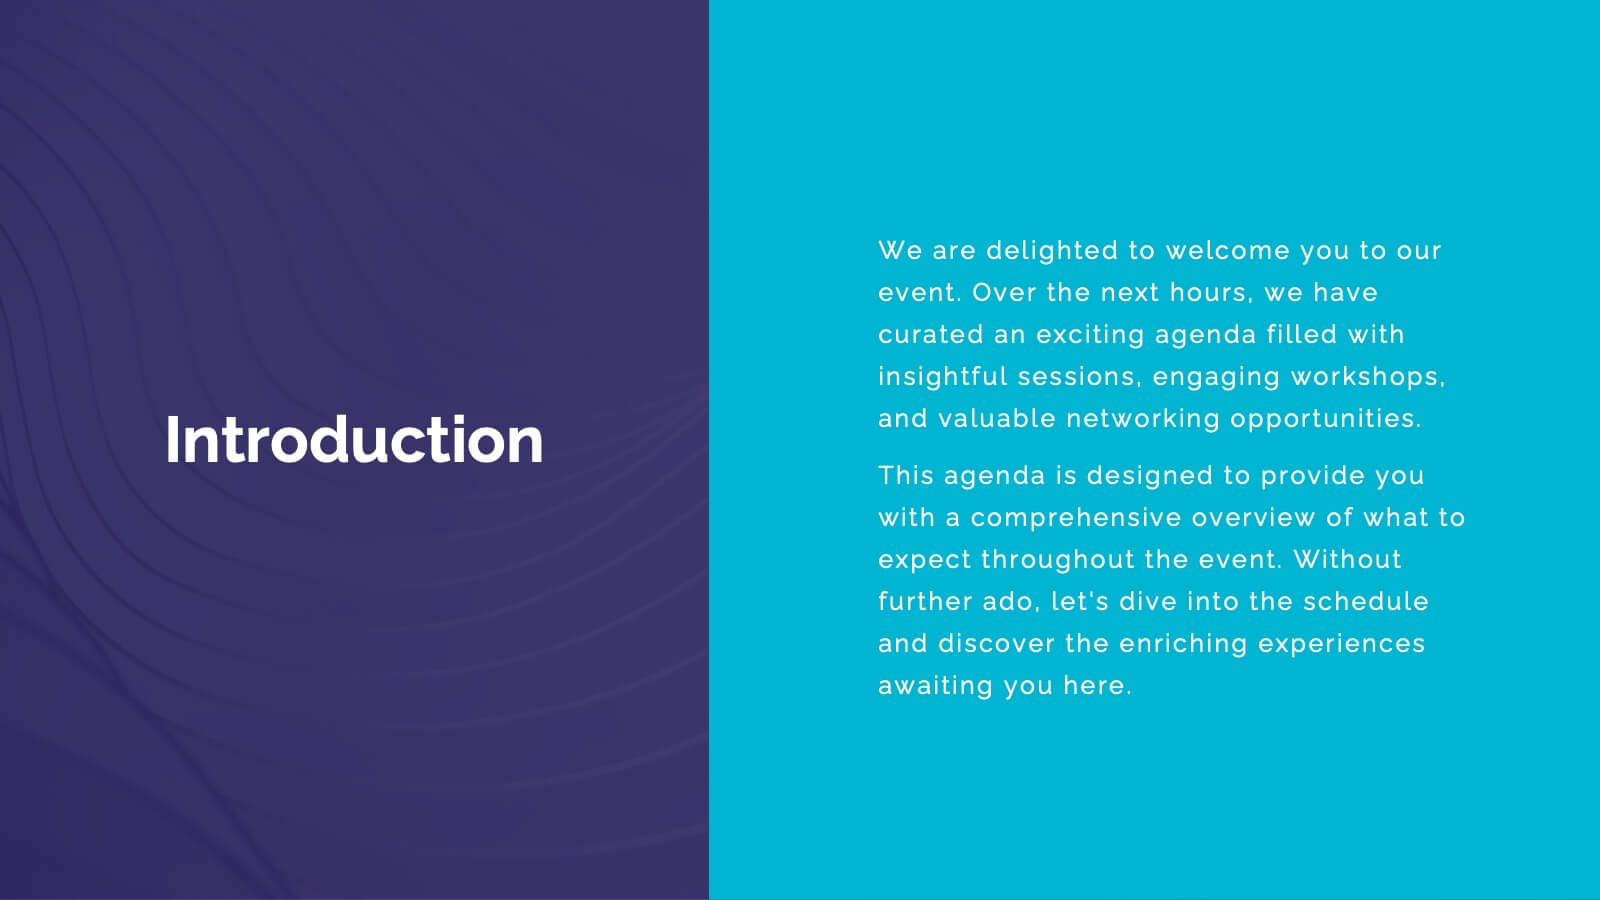
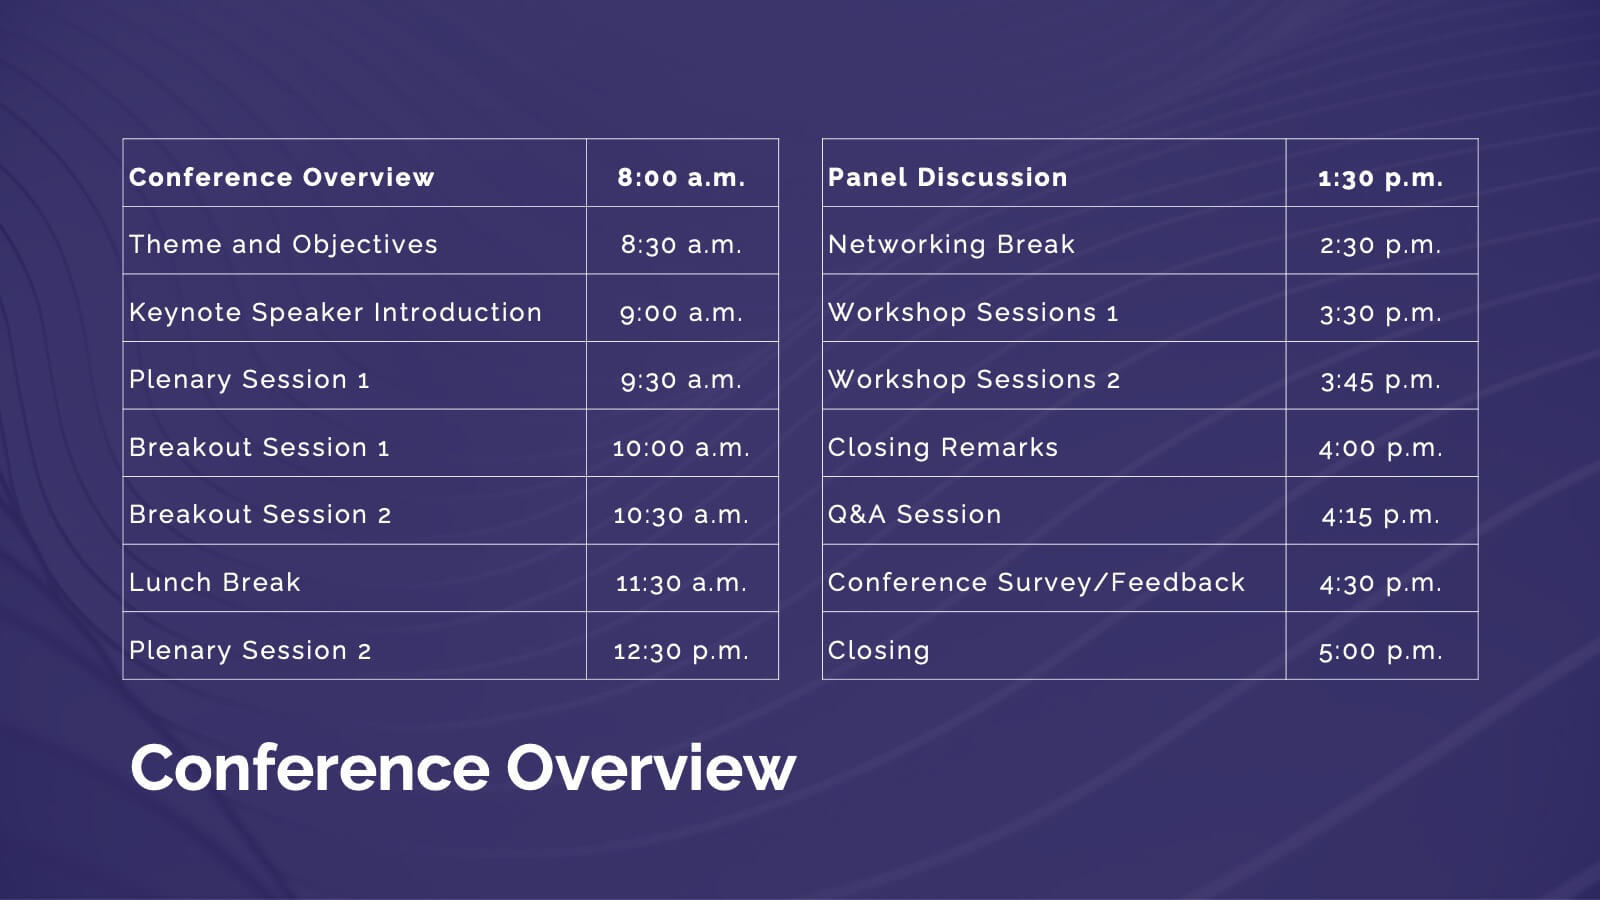
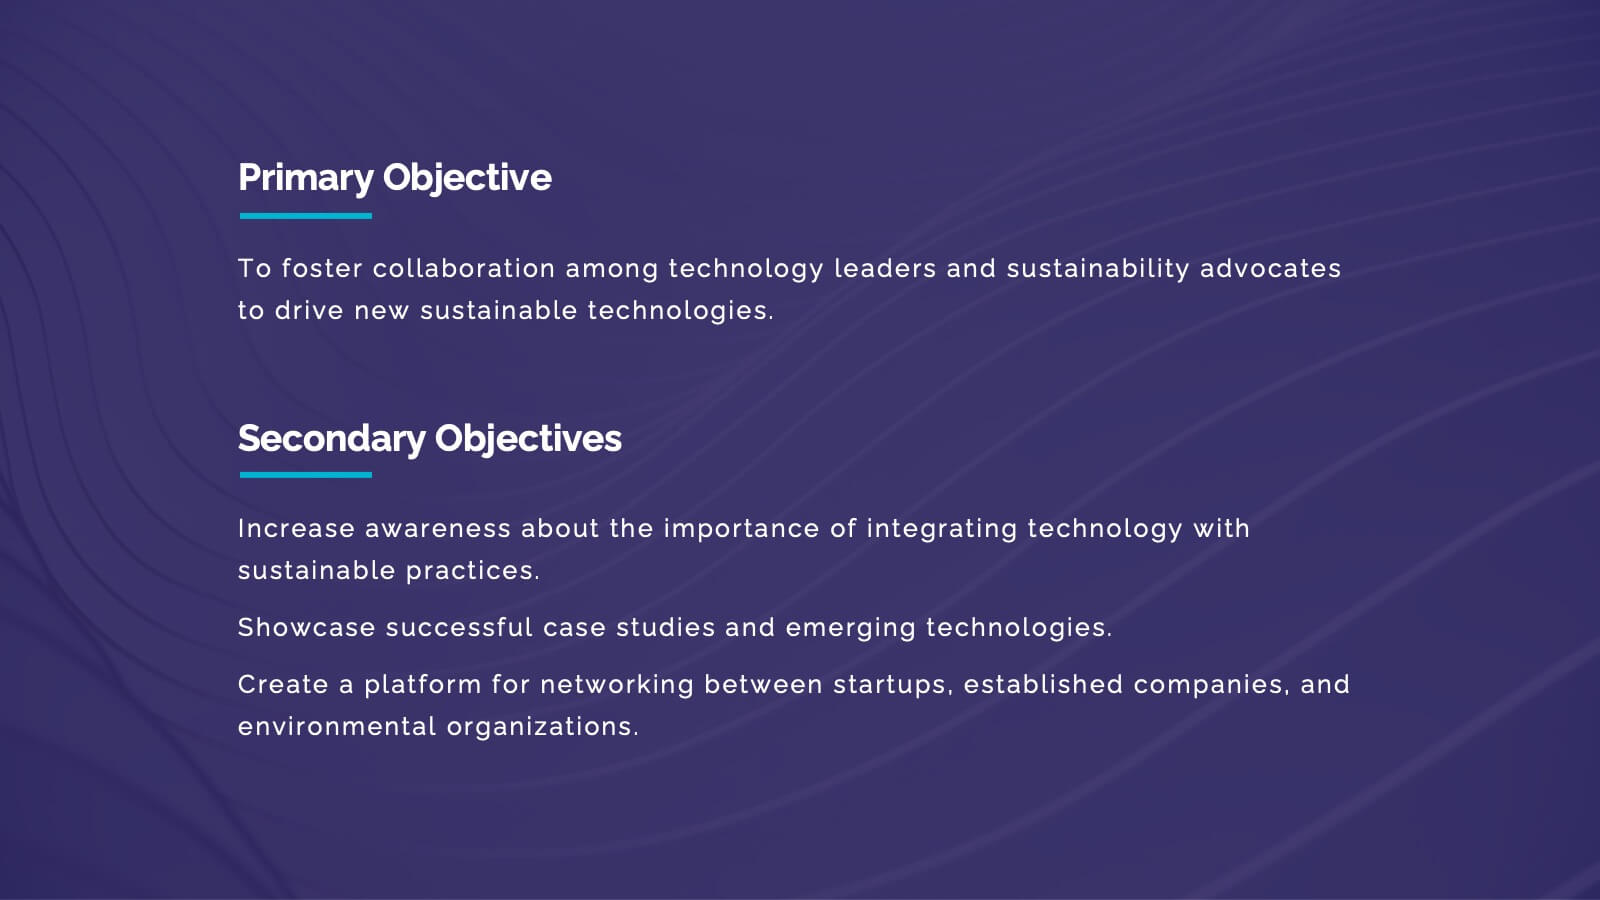
Boost your business presentations with this vibrant, professional template designed for business development proposals. Perfect for detailing conference overviews, themes, objectives, and keynotes, it features a clean and engaging layout. Highlight critical sessions and networking opportunities to captivate your audience. Compatible with PowerPoint, Keynote, and Google Slides, it ensures seamless presentations on any platform.


4 slides
Key Business Insights Executive Summary
Present your insights like a pro with this dynamic, timeline-inspired slide that makes key data points easy to follow. Designed to highlight four major takeaways or milestones, this visual format is ideal for summarizing business progress, strategy updates, or operational highlights. Fully editable in PowerPoint, Keynote, and Google Slides.


10 slides
Risk Management in Insurance
Visualize your insurance risk strategies with this engaging umbrella-themed presentation. Designed to illustrate layered risk coverage or multi-step assessments, this slide set is ideal for analysts, agents, or consultants. Each section is clearly numbered and color-coded for easy understanding. Fully editable in PowerPoint, Keynote, and Google Slides.


6 slides
Weekly Gantt Planning Slide Presentation
Jump into your week with a layout that makes planning feel effortless and visually clear. This presentation helps teams map tasks across each day, track progress, and organize priorities with a clean, modern weekly timeline. Perfect for project updates and team coordination. Fully compatible with PowerPoint, Keynote, and Google Slides.


5 slides
5G Use Cases and Industry Applications Presentation
Unlock the possibilities of next-generation connectivity with a clear, visual explainer designed to showcase how different industries benefit from faster, smarter networks. This presentation breaks down key applications, technology shifts, and real-world 5G impact in an easy, engaging format. Fully compatible with PowerPoint, Keynote, and Google Slides.


8 slides
Business Growth Strategies Presentation
Take your vision from concept to expansion with a sleek, modern presentation designed to highlight progress and future potential. Ideal for showcasing goals, performance metrics, and market strategies, it keeps your ideas structured and engaging. Fully compatible with PowerPoint, Keynote, and Google Slides for effortless customization and presentation delivery.


8 slides
Winning Strategies for Professional Success Presentation
Showcase your top performers, strategic milestones, or ranked insights with this podium-style template. Featuring vibrant visuals and structured layout, it’s ideal for performance reviews, leadership presentations, and competitive analysis. Fully editable in PowerPoint, Keynote, and Google Slides—perfect for professional success stories, rankings, and progress highlights.


6 slides
7S Framework for Organizational Alignment Presentation
Present a cohesive organizational strategy using the 7S Framework slide. With hexagonal visuals highlighting key elements—Strategy, Structure, Systems, Shared Values, Style, Staff, and Skills—this template simplifies complex alignment concepts. Ideal for leadership, consulting, or HR presentations. Fully editable for PowerPoint, Google Slides, and Keynote to match your brand.


5 slides
Multiphase Planning with Strategy Wheel Presentation
Visualize your project’s lifecycle with this five-part strategy wheel layout. Each labeled segment highlights a phase in your planning process, ideal for showcasing sequential steps or stages. Fully editable in PowerPoint, Keynote, and Google Slides, this template simplifies complex workflows while maintaining a clean, professional design for strategic presentations.


21 slides
Illume Detailed Project Execution Plan Presentation
Get ready to wow your audience with this dynamic Project Execution Plan template! Bursting with sleek design, it transforms your project timelines, deliverables, and stakeholder analysis into a stunning visual journey. Keep everyone engaged while you showcase your strategy with flair and finesse. Perfect for PowerPoint, Keynote, and Google Slides!