


Features
- 10 Unique slides
- Fully editable and easy to edit in Microsoft Powerpoint, Keynote and Google Slides
- 16:9 widescreen layout
- Clean and professional designs
- Export to JPG, PDF or send by email


Do you have any questions?
Recommend


4 slides
Innovative Business Solution Strategy
Present fresh, impactful ideas with this innovative business solution strategy slide. Featuring a creative lightbulb design, this template helps you showcase strategic solutions, key initiatives, or breakthrough concepts in a visually organized way. Perfect for startups, innovation workshops, and business growth meetings. Fully editable and compatible with PowerPoint, Keynote, and Google Slides.


6 slides
Business Process Flowchart Presentation
Streamline your workflow with the Business Process Flowchart presentation. This structured and visually engaging template helps you map out processes, optimize efficiency, and improve communication within your team. Designed for business analysts, managers, and strategists, this fully editable slide ensures clarity in decision-making and operations. Compatible with PowerPoint, Keynote, and Google Slides.
20 slides
Beacon Content Marketing Pitch Deck Presentation
Ignite your marketing strategies with this dynamic and sleek content marketing pitch deck! Filled with modern design and comprehensive insights, this template is perfect for showcasing trends, influencer marketing, and emerging technologies. Make your brand's story stand out while captivating your audience. Fully compatible with PowerPoint, Keynote, and Google Slides!


6 slides
Weekly Project Status Update Presentation
Keep your team aligned and your goals on track with this clear, structured layout designed to summarize weekly progress, milestones, and deliverables. Perfect for project managers and team leads, it turns updates into visuals that are easy to follow. Fully compatible with PowerPoint, Keynote, and Google Slides for smooth customization.


5 slides
Customer Perceived Value Analysis Presentation
Capture the essence of customer perception with this visually engaging template. Designed for businesses aiming to assess and enhance value propositions, it breaks down key insights into digestible segments. Perfect for marketing strategies and consumer behavior analysis, this template is fully compatible with PowerPoint, Keynote, and Google Slides for seamless customization.

22 slides
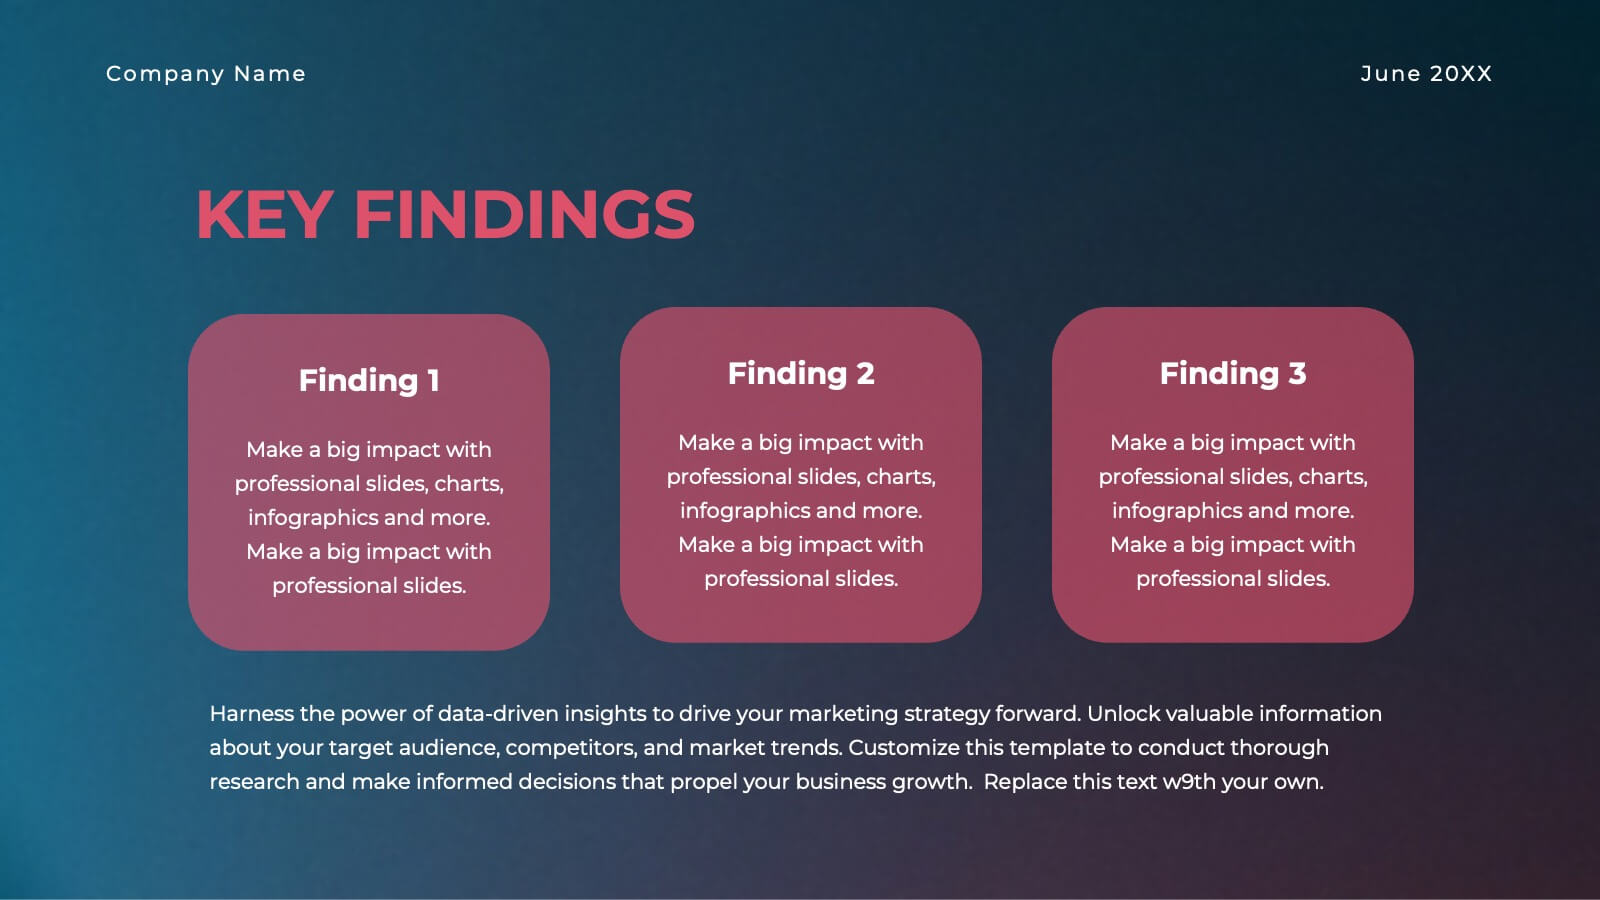
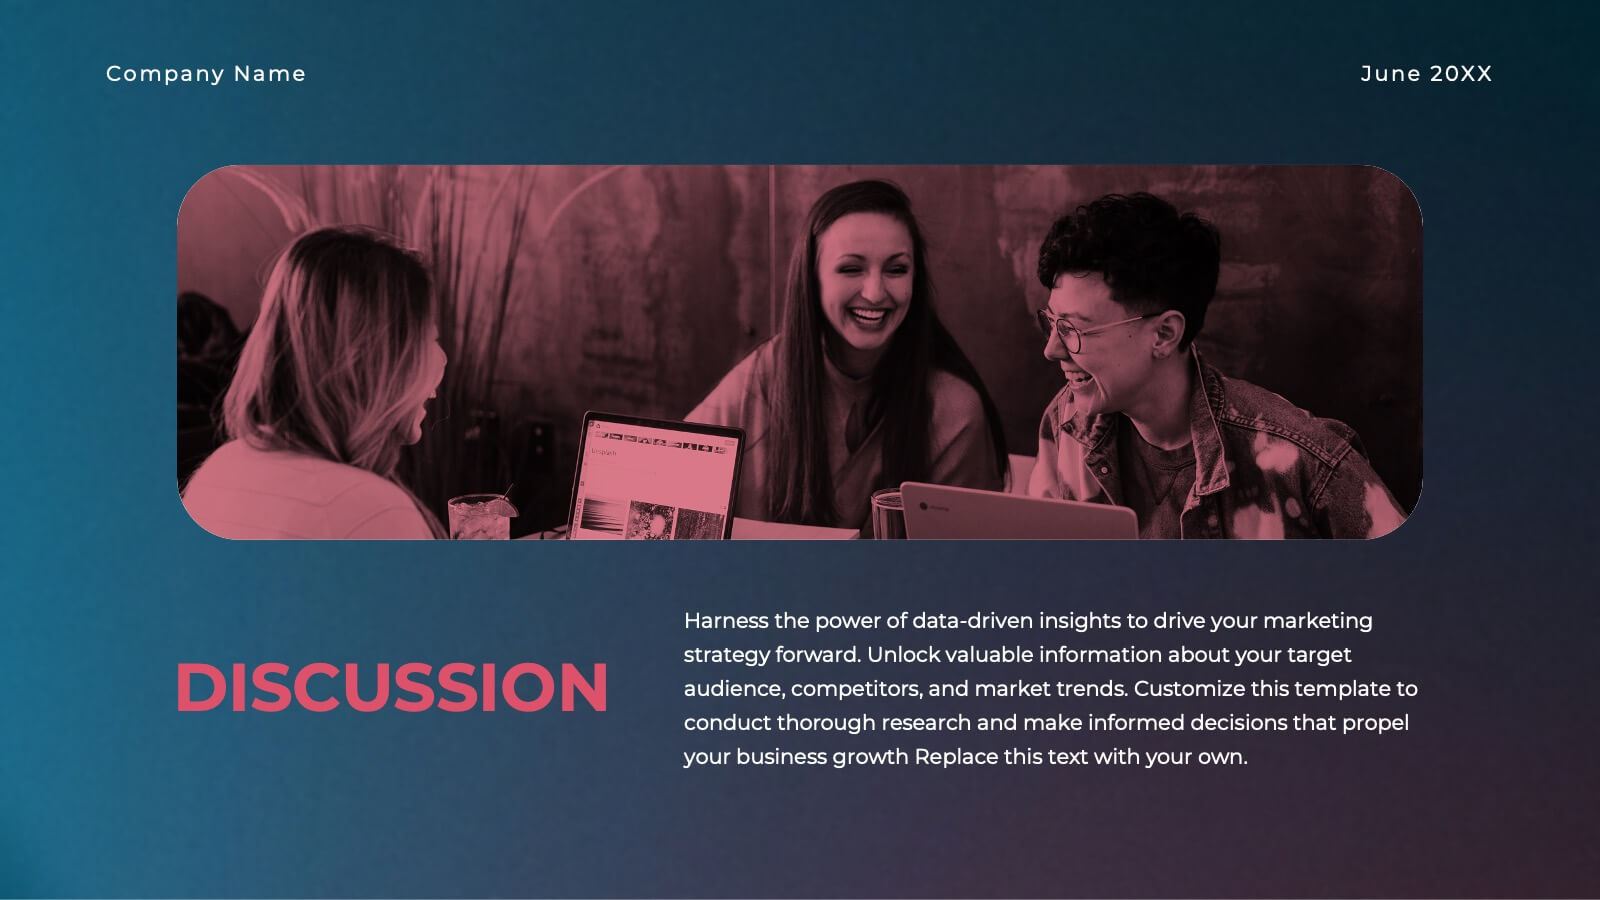
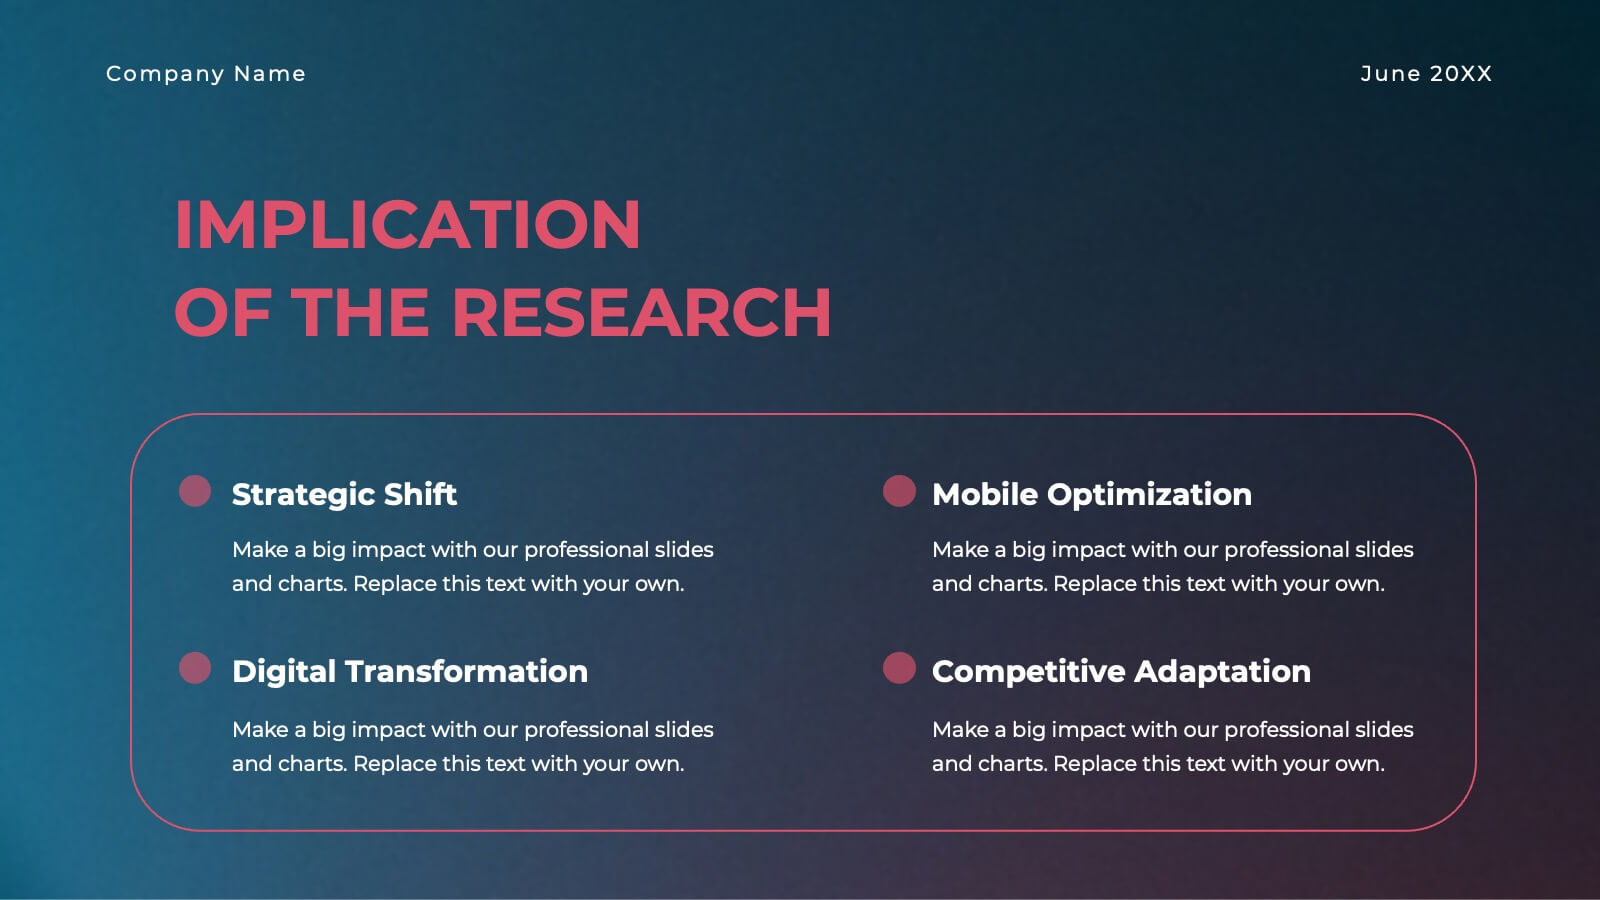
Gold Research Proposal Presentation
Present your research with impact using this sleek and modern research proposal template! Featuring sections for objectives, data collection, analysis, key findings, and recommendations, this template helps organize your research clearly and professionally. Fully customizable and compatible with PowerPoint, Keynote, and Google Slides, it's ideal for any research presentation.
23 slides
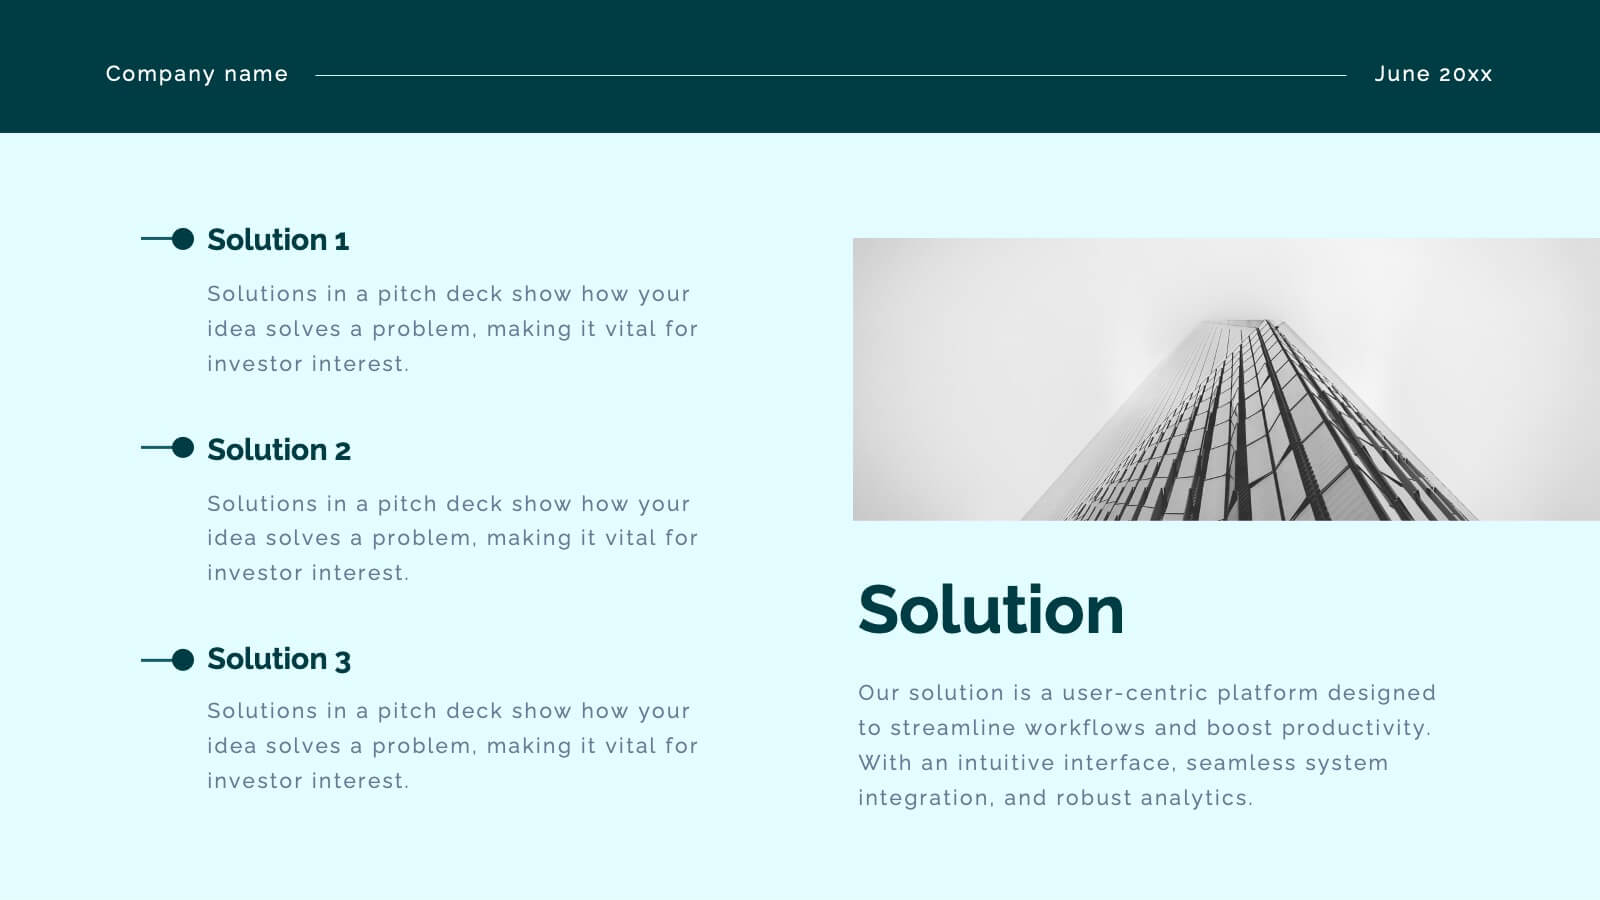
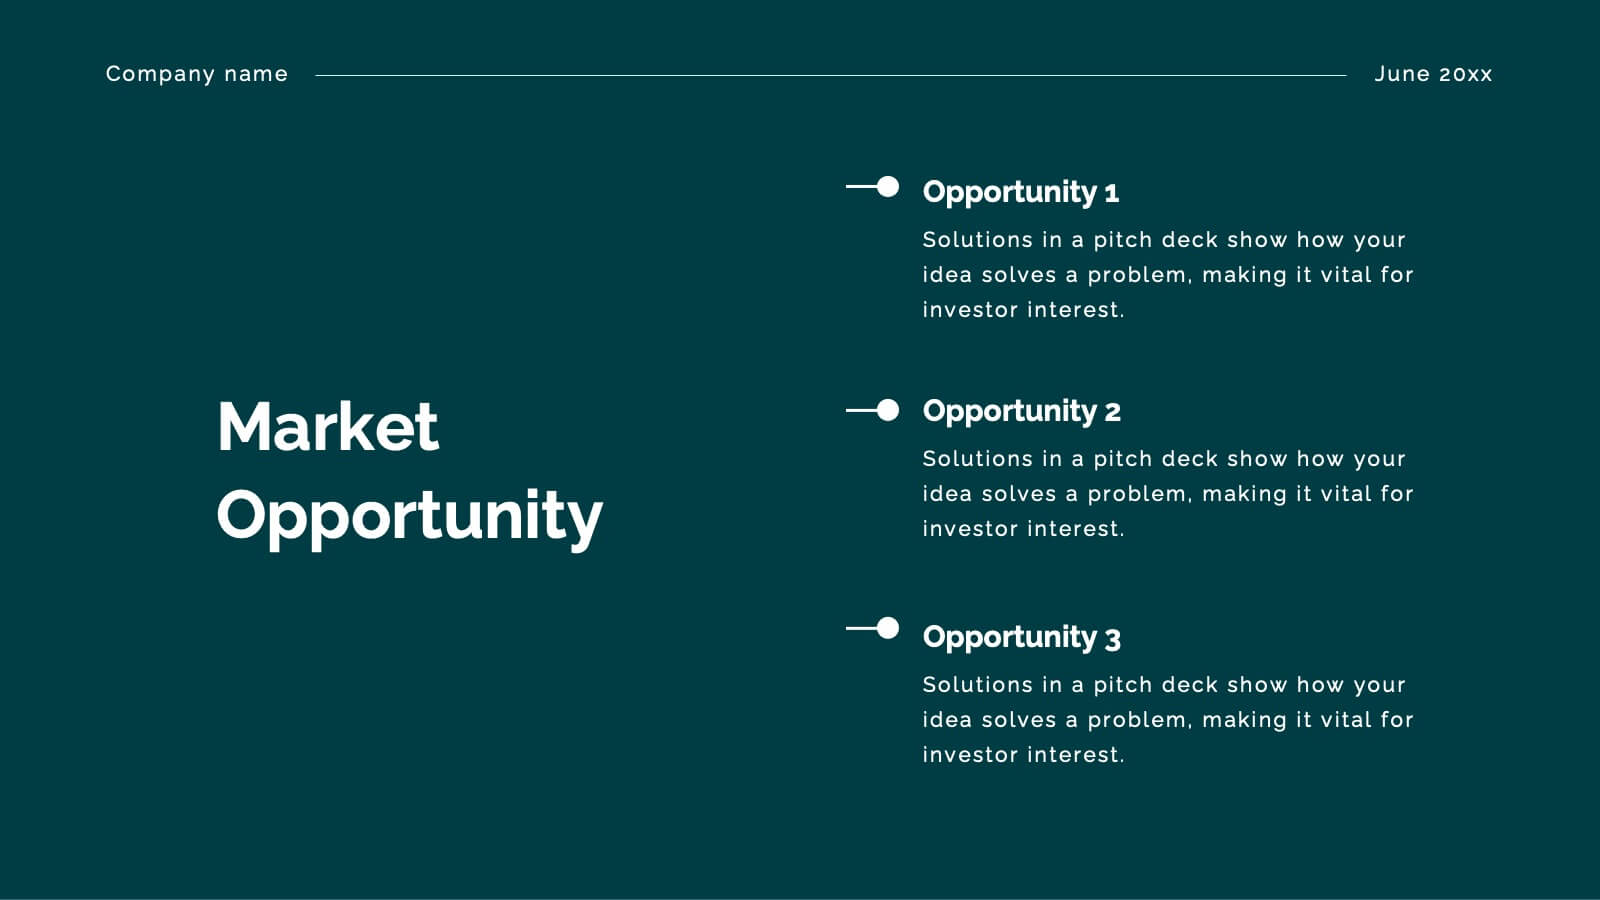
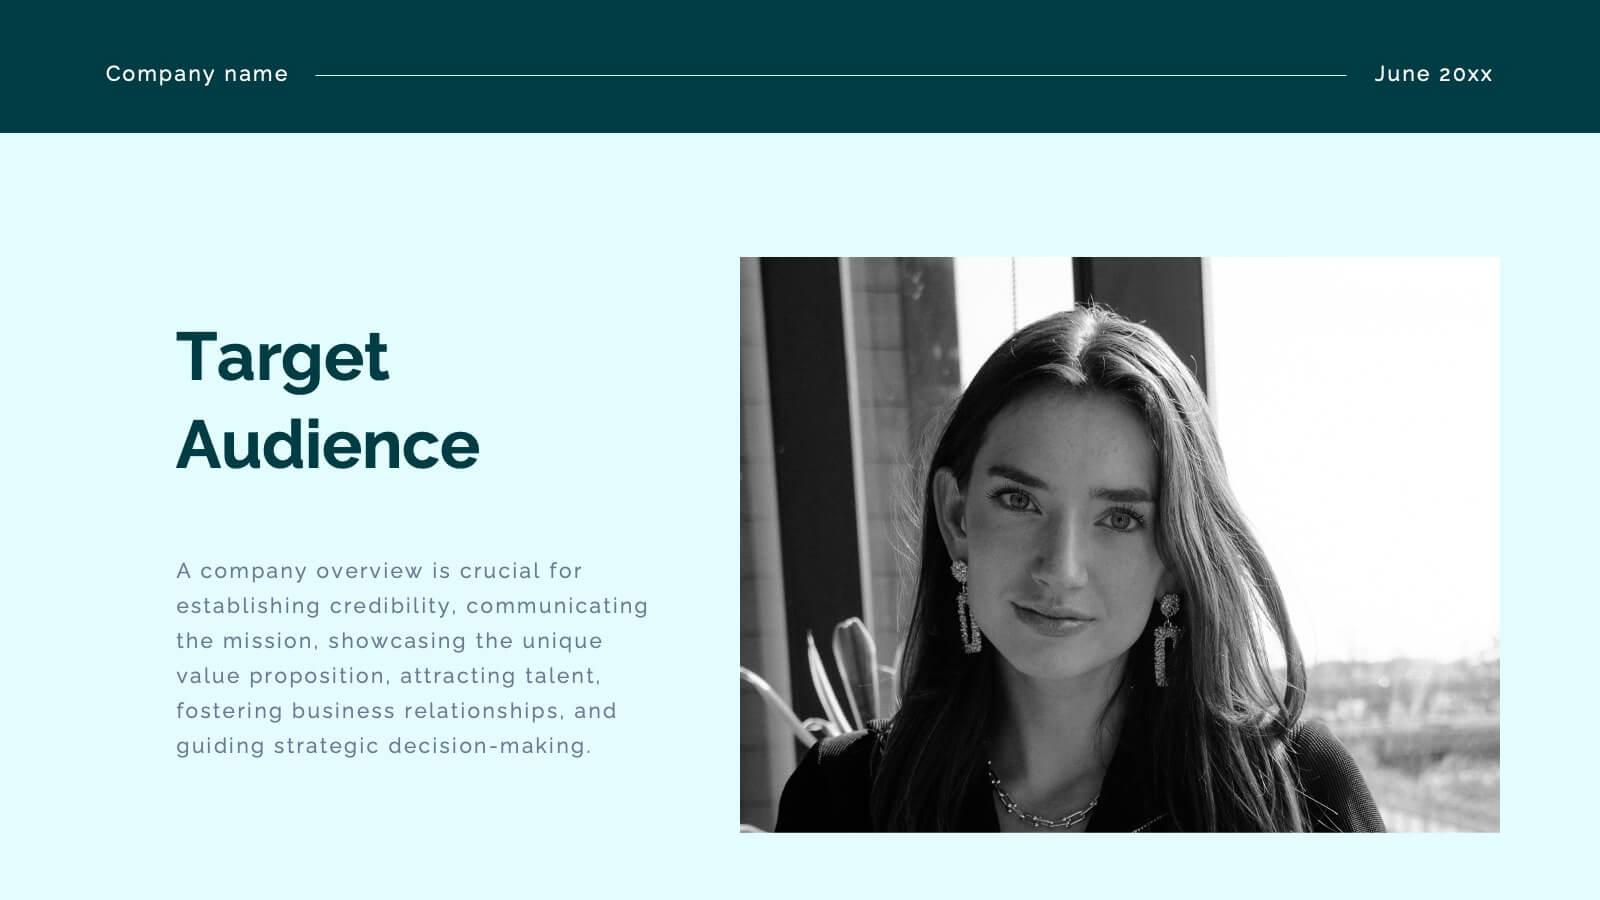
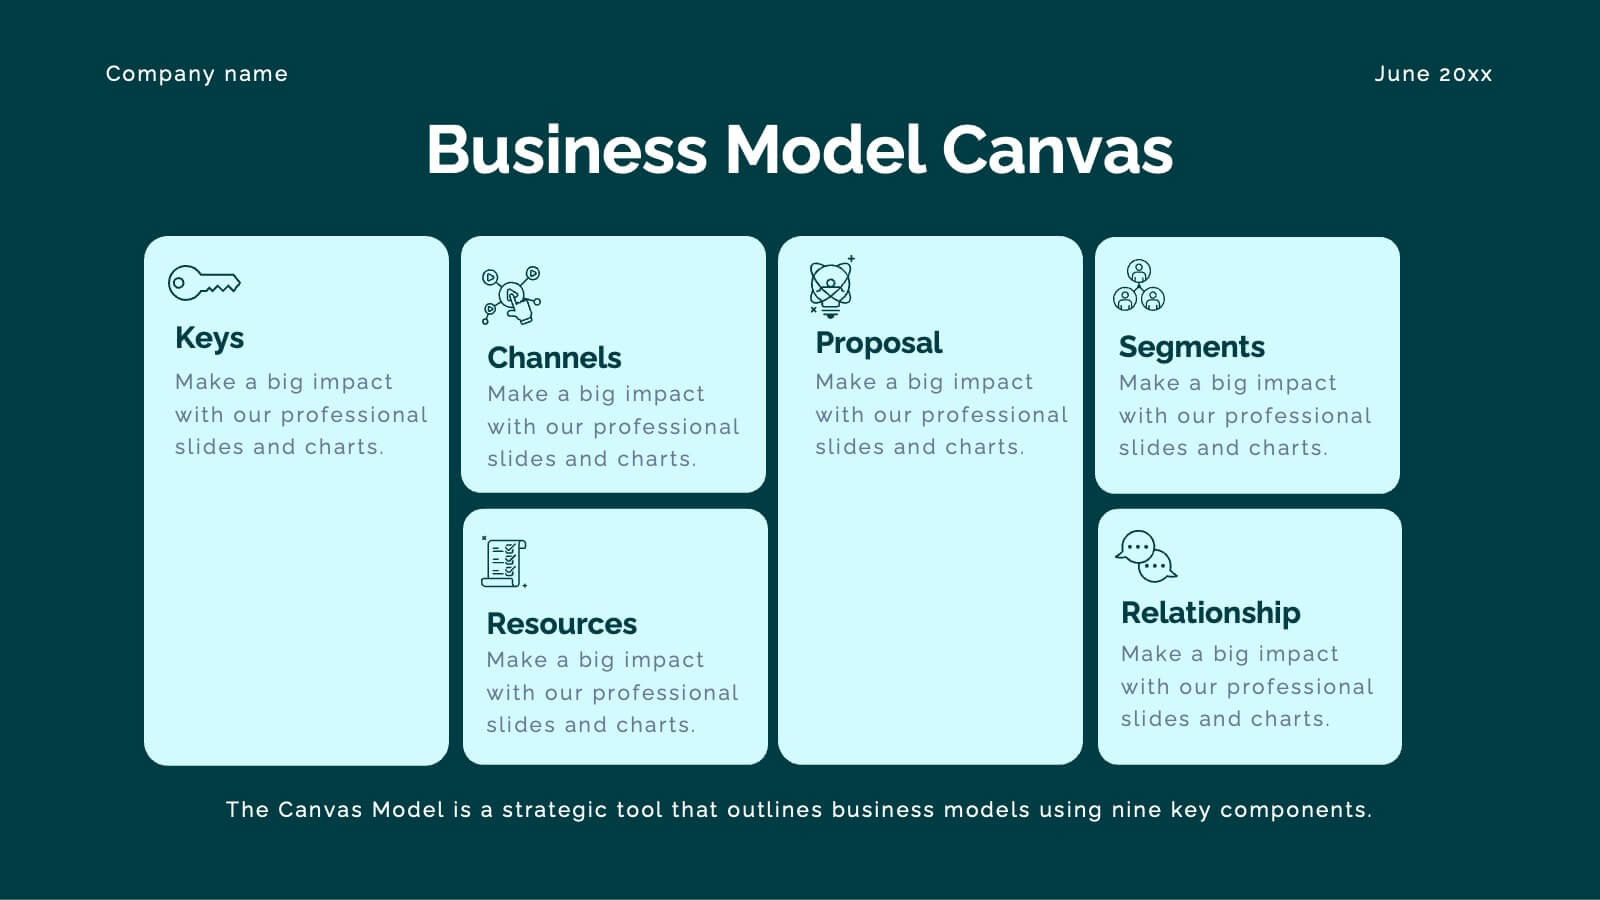
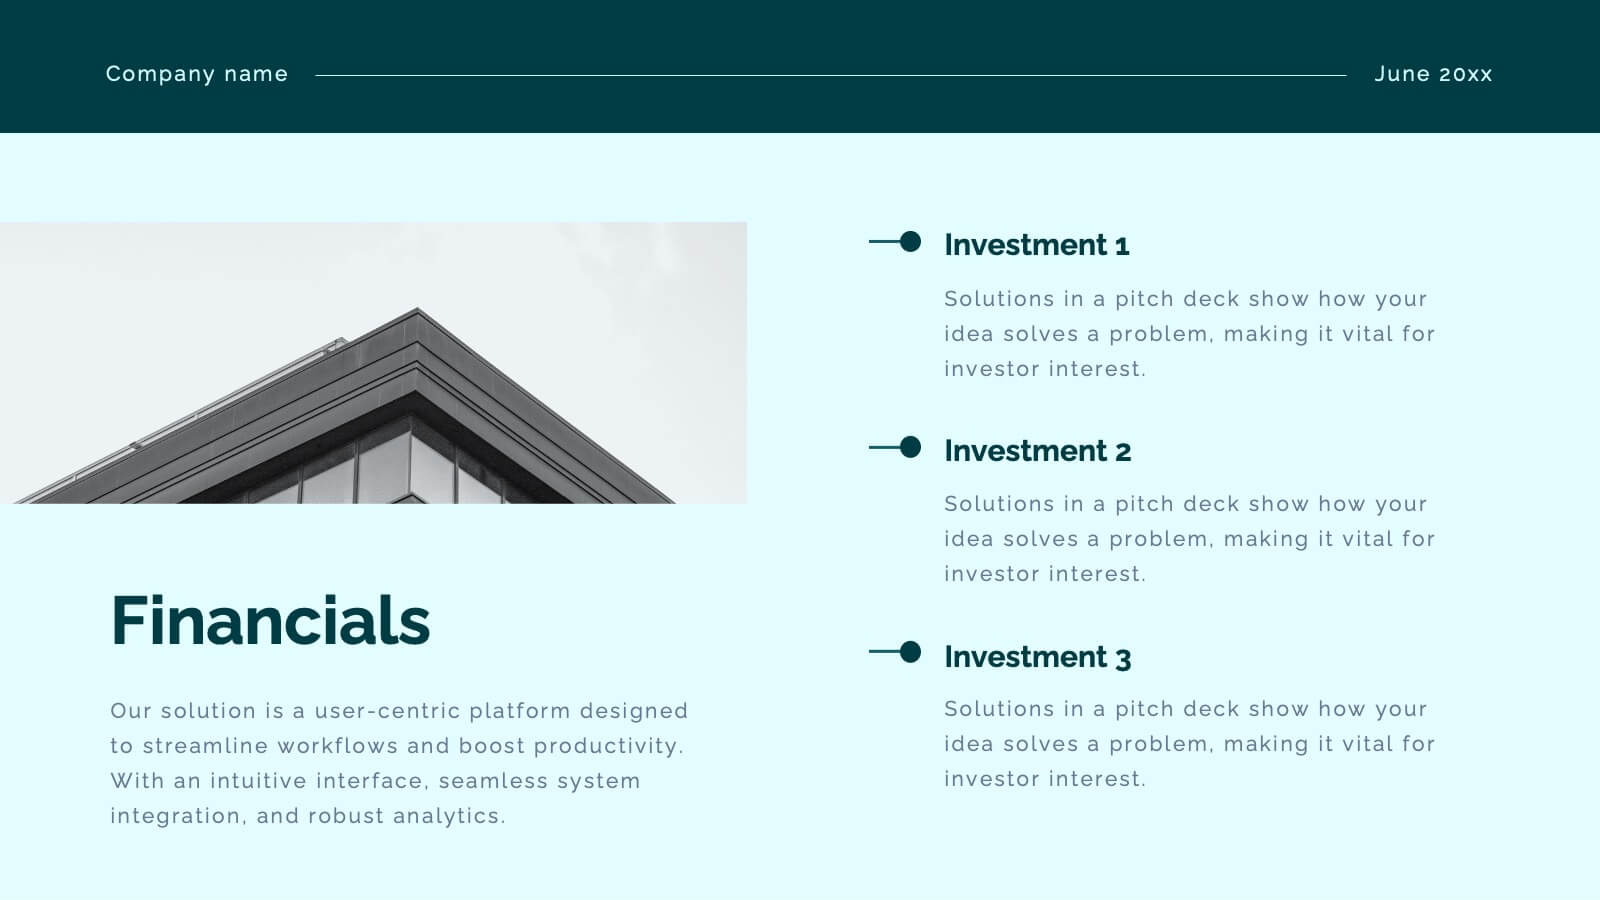
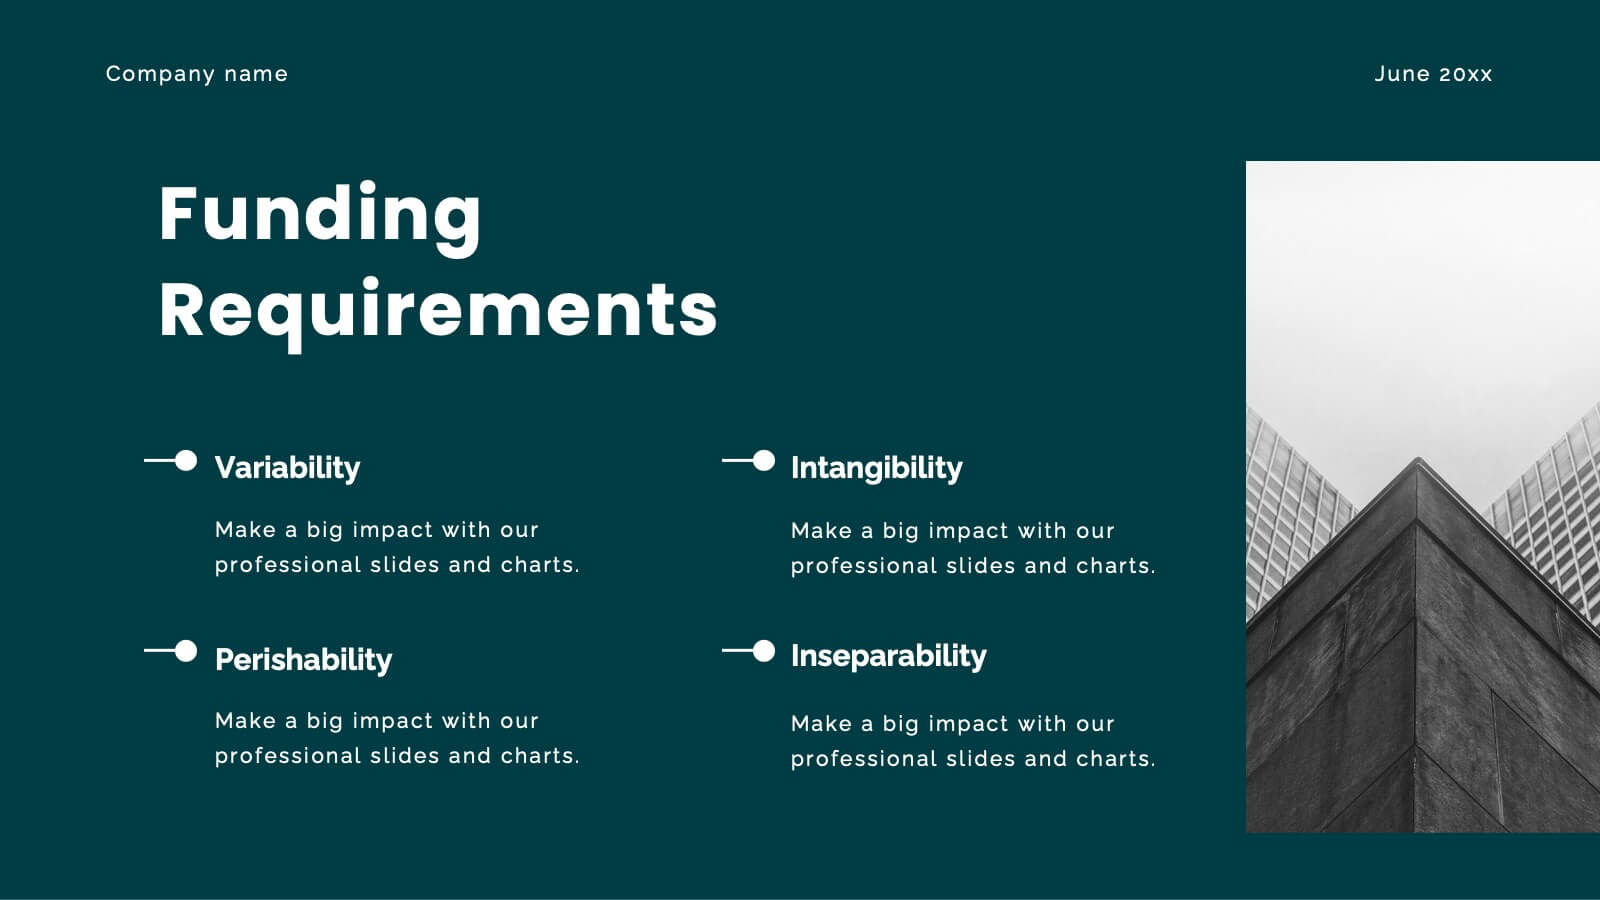
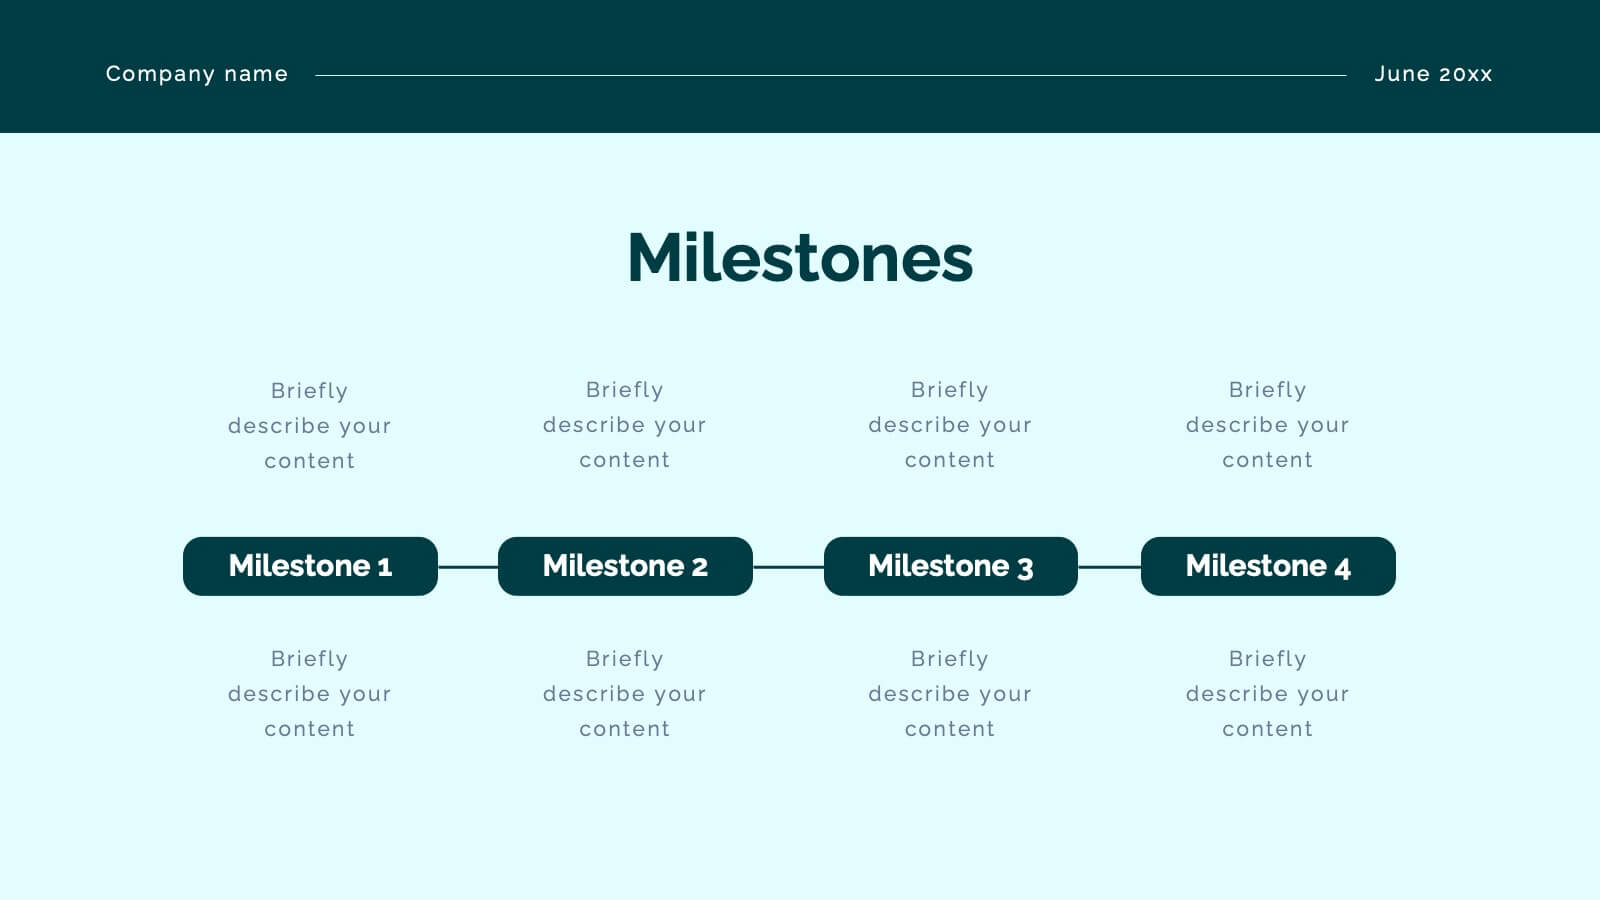
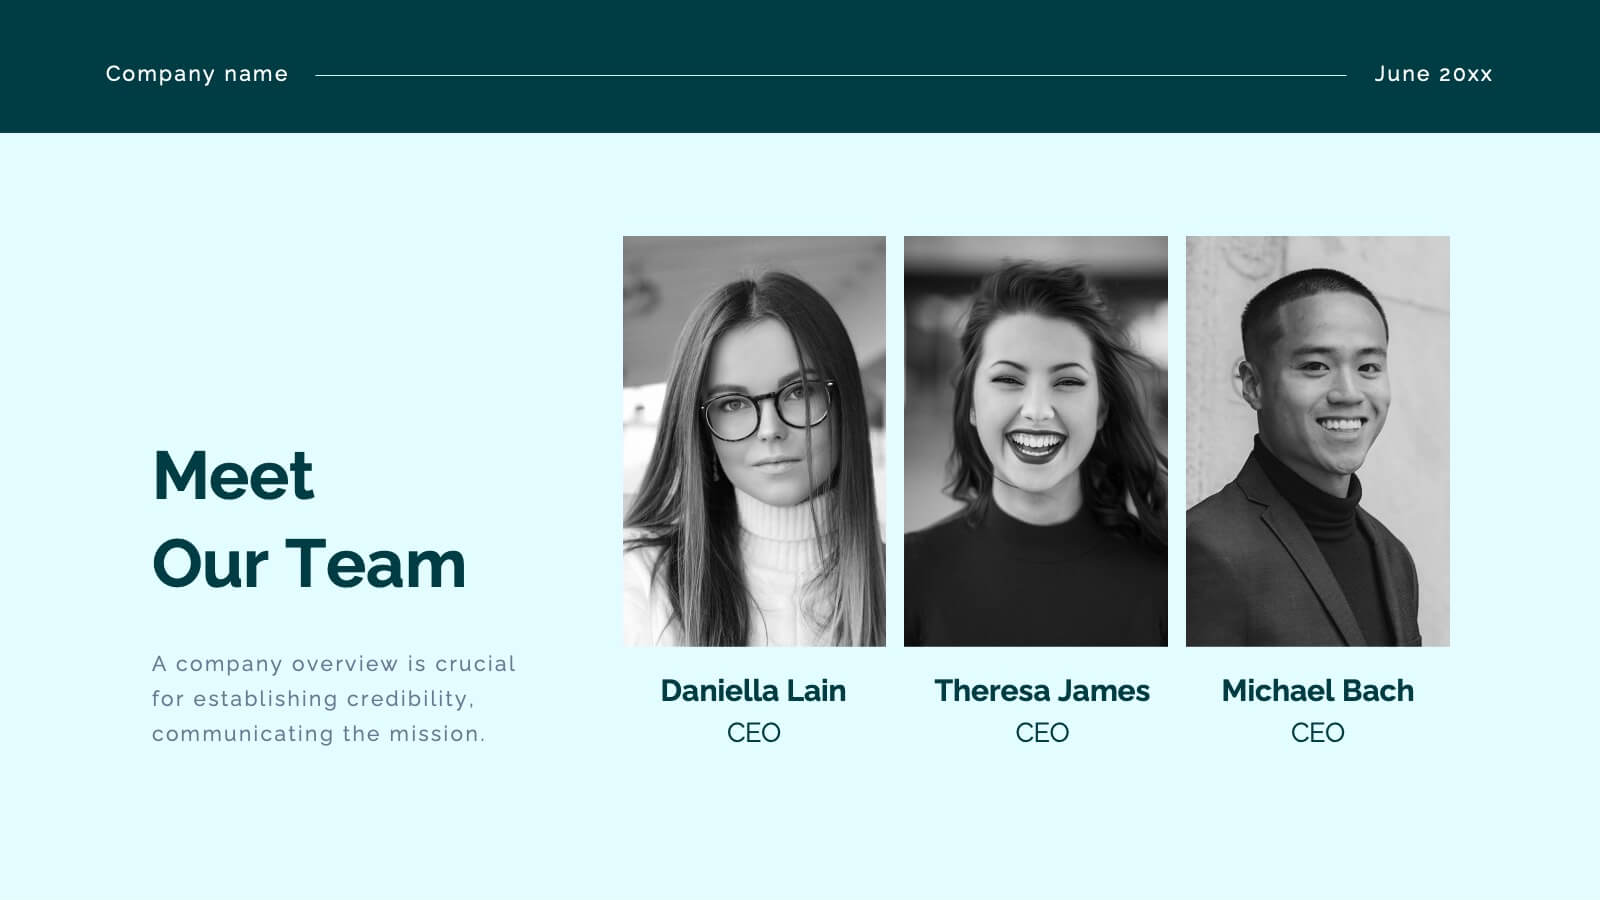
Crest Investor Pitch Presentation Presentation
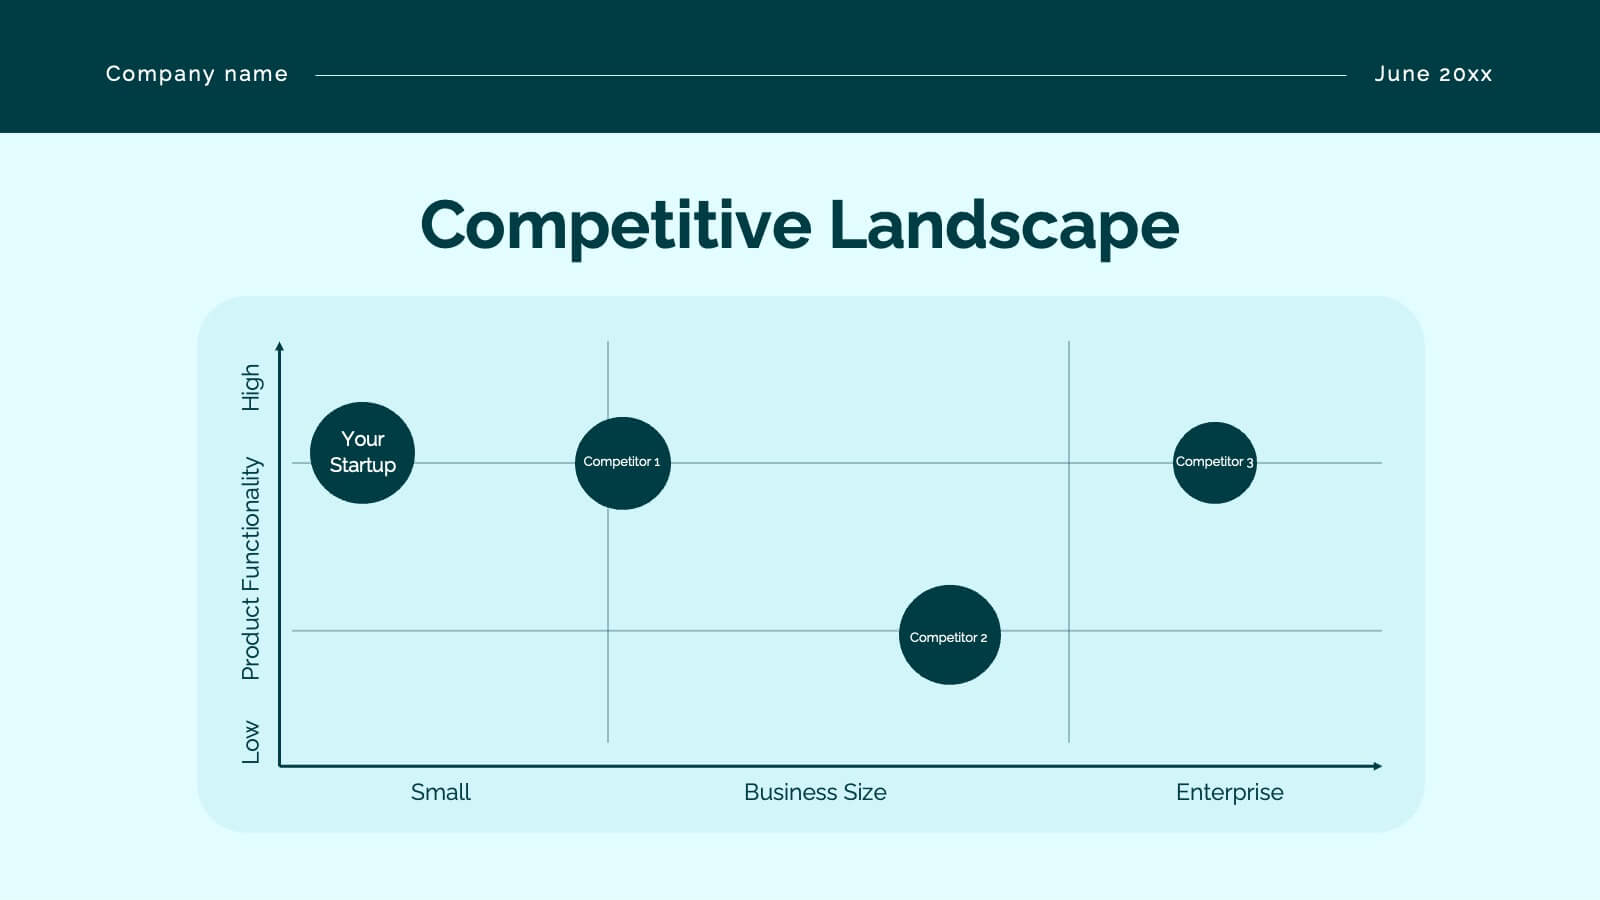
Unleash your potential with this powerful pitch deck template! Tailored for presenting innovative business ideas, it features slides for company overview, market opportunity, competitive landscape, and financial projections. Clearly communicate your value proposition and impress investors with professional design and concise content. Compatible with PowerPoint, Keynote, and Google Slides for seamless presentations on any platform.


6 slides
Engagement Survey Results Infographics
Effectively communicate your engagement survey results with our Engagement Survey Results infographic template. This template is fully compatible with popular presentation software like PowerPoint, Keynote, and Google Slides, allowing you to easily customize it to illustrate and convey your survey findings. The Engagement Survey Results infographic template offers a visually engaging platform to present survey data, key findings, and insights related to employee or customer engagement. Whether you're an HR professional, manager, or business leader, this template provides a user-friendly canvas to create informative presentations and reports on engagement survey outcomes. Optimize your communication of survey results with this SEO-optimized Engagement Survey Results infographic template, thoughtfully designed for clarity and ease of use. Customize it to showcase survey methodology, response rates, visualizations of data, and action plans based on the findings, ensuring that your audience gains a comprehensive understanding of the survey results and their implications. Start crafting your personalized infographic today to effectively communicate engagement survey outcomes.


4 slides
Budget Projection with Predictive Analysis Presentation
Visualize future financial outcomes with clarity using the Budget Projection with Predictive Analysis Presentation. This modern funnel-style layout helps break down key stages of budget forecasting, making it easy to communicate progressions and data-driven insights. Perfect for financial planning, reporting, or strategic reviews. Fully editable in PowerPoint, Google Slides, Keynote, and Canva.


21 slides
Ceres Financial Report Presentation
This financial report template is designed to showcase performance metrics, sales analysis, project progress, and strategic insights with clarity and professionalism. Featuring slides for operational updates, competitor insights, and recommendations for improvement, it ensures a comprehensive financial overview. Compatible with PowerPoint, Keynote, and Google Slides for flexible presentations.


4 slides
HR Management Strategy Presentation
An engaging, structured design that turns complex planning into a clear, visual story. This presentation guides audiences through essential strategic steps, helping teams understand goals, processes, and people-centered initiatives with ease. Clean icons and modern layouts keep every point focused and professional. Fully compatible with PowerPoint, Keynote, and Google Slides.


7 slides
Thank You Card Infographic
Celebrate the art of gratitude with this sophisticated collection, perfectly blending contemporary design with a personal touch. Each layout is crafted with aesthetic finesse, featuring subtle color palettes, elegant typography, and thoughtful placement of visual elements that enhance the warmth of your message. Offering a variety of designs from minimalist to richly textured backgrounds, this collection provides a unique backdrop for expressing thanks. Customize these cards for any occasion, whether it's professional gratitude towards colleagues and clients, or personal appreciation for friends and family. Ideal for both digital expressions and printed notes, this set ensures your message of thanks is received with the sentiment it’s intended. It’s a wonderful way to convey appreciation and leave a memorable impression on its recipients.


7 slides
Objective Statement Infographic
An objective is a specific and measurable goal or target that an individual, team, or organization aims to achieve within a defined period. This infographic template serves as a roadmap, guiding actions and decisions toward a desired outcome. Our objective statement infographic isn't just a canvas; it's a launchpad for your goals and aspirations. Fully customizable and compatible with Powerpoint, Keynote, and Google Slides. This infographic is bold, vibrant, and strategically designed, this will propel your objectives into the spotlight, ensuring clarity and resonance for your audience.


8 slides
Core Pillars of Business Success Presentation
Highlight your company’s foundation with the Core Pillars of Business Success presentation. This slide features four bold, column-style visuals labeled A through D—each representing a critical component of your business strategy. Ideal for illustrating structure, vision, and stability, it helps communicate growth factors like leadership, innovation, operations, and finance. Fully editable in PowerPoint, Keynote, and Google Slides, it's perfect for consultants, executives, and strategic planners.


5 slides
Employee Feedback Survey Report Presentation
Deliver clear insights into team sentiment with this employee rating slide. Designed with star rating visuals and thumbs-up iconography, it's perfect for showcasing staff satisfaction, engagement, and performance reviews. Easy to customize in PowerPoint, Keynote, and Google Slides.
6 slides
Key Project Milestone Tracker Presentation
Stay on top of project timelines with this clean and colorful milestone tracker. Ideal for Gantt-style overviews, this slide helps teams visualize progress across months for multiple tasks. Compatible with PowerPoint, Keynote, and Google Slides for seamless editing.


5 slides
Customer Loyalty Program Strategy
Design a winning rewards system with this engaging loyalty program infographic. Featuring a vertical layout with five customizable stages alongside a gift icon, this slide is perfect for outlining incentives, customer tiers, or retention plans. Fully editable in PowerPoint, Keynote, and Google Slides.