


Features
- 22 Unique Slides
- Fully editable and easy to edit in Microsoft Powerpoint, Keynote and Google Slides
- 16:9 widescreen layout
- Clean and professional designs
- Export to JPG, PDF or send by email


Do you have any questions?
Recommend


4 slides
Mobile and Laptop Mockup Devices
Present your digital products with style using this modern mockup slide. Featuring a realistic laptop and smartphone duo, this layout is perfect for showcasing websites, apps, or UI designs. Fully editable in PowerPoint, Keynote, and Google Slides—customize text, colors, and layout with ease.


3 slides
Business Revenue Break-Even Strategy Presentation
Understand profitability with the Business Revenue Break-Even Strategy template. This visual tool illustrates the break-even point, helping businesses analyze costs, revenue, and profitability. Ideal for financial planning, it simplifies complex data into an easy-to-read format. Fully customizable and compatible with PowerPoint, Keynote, and Google Slides for seamless presentations.


20 slides
Labyrinth Project Proposal Presentation
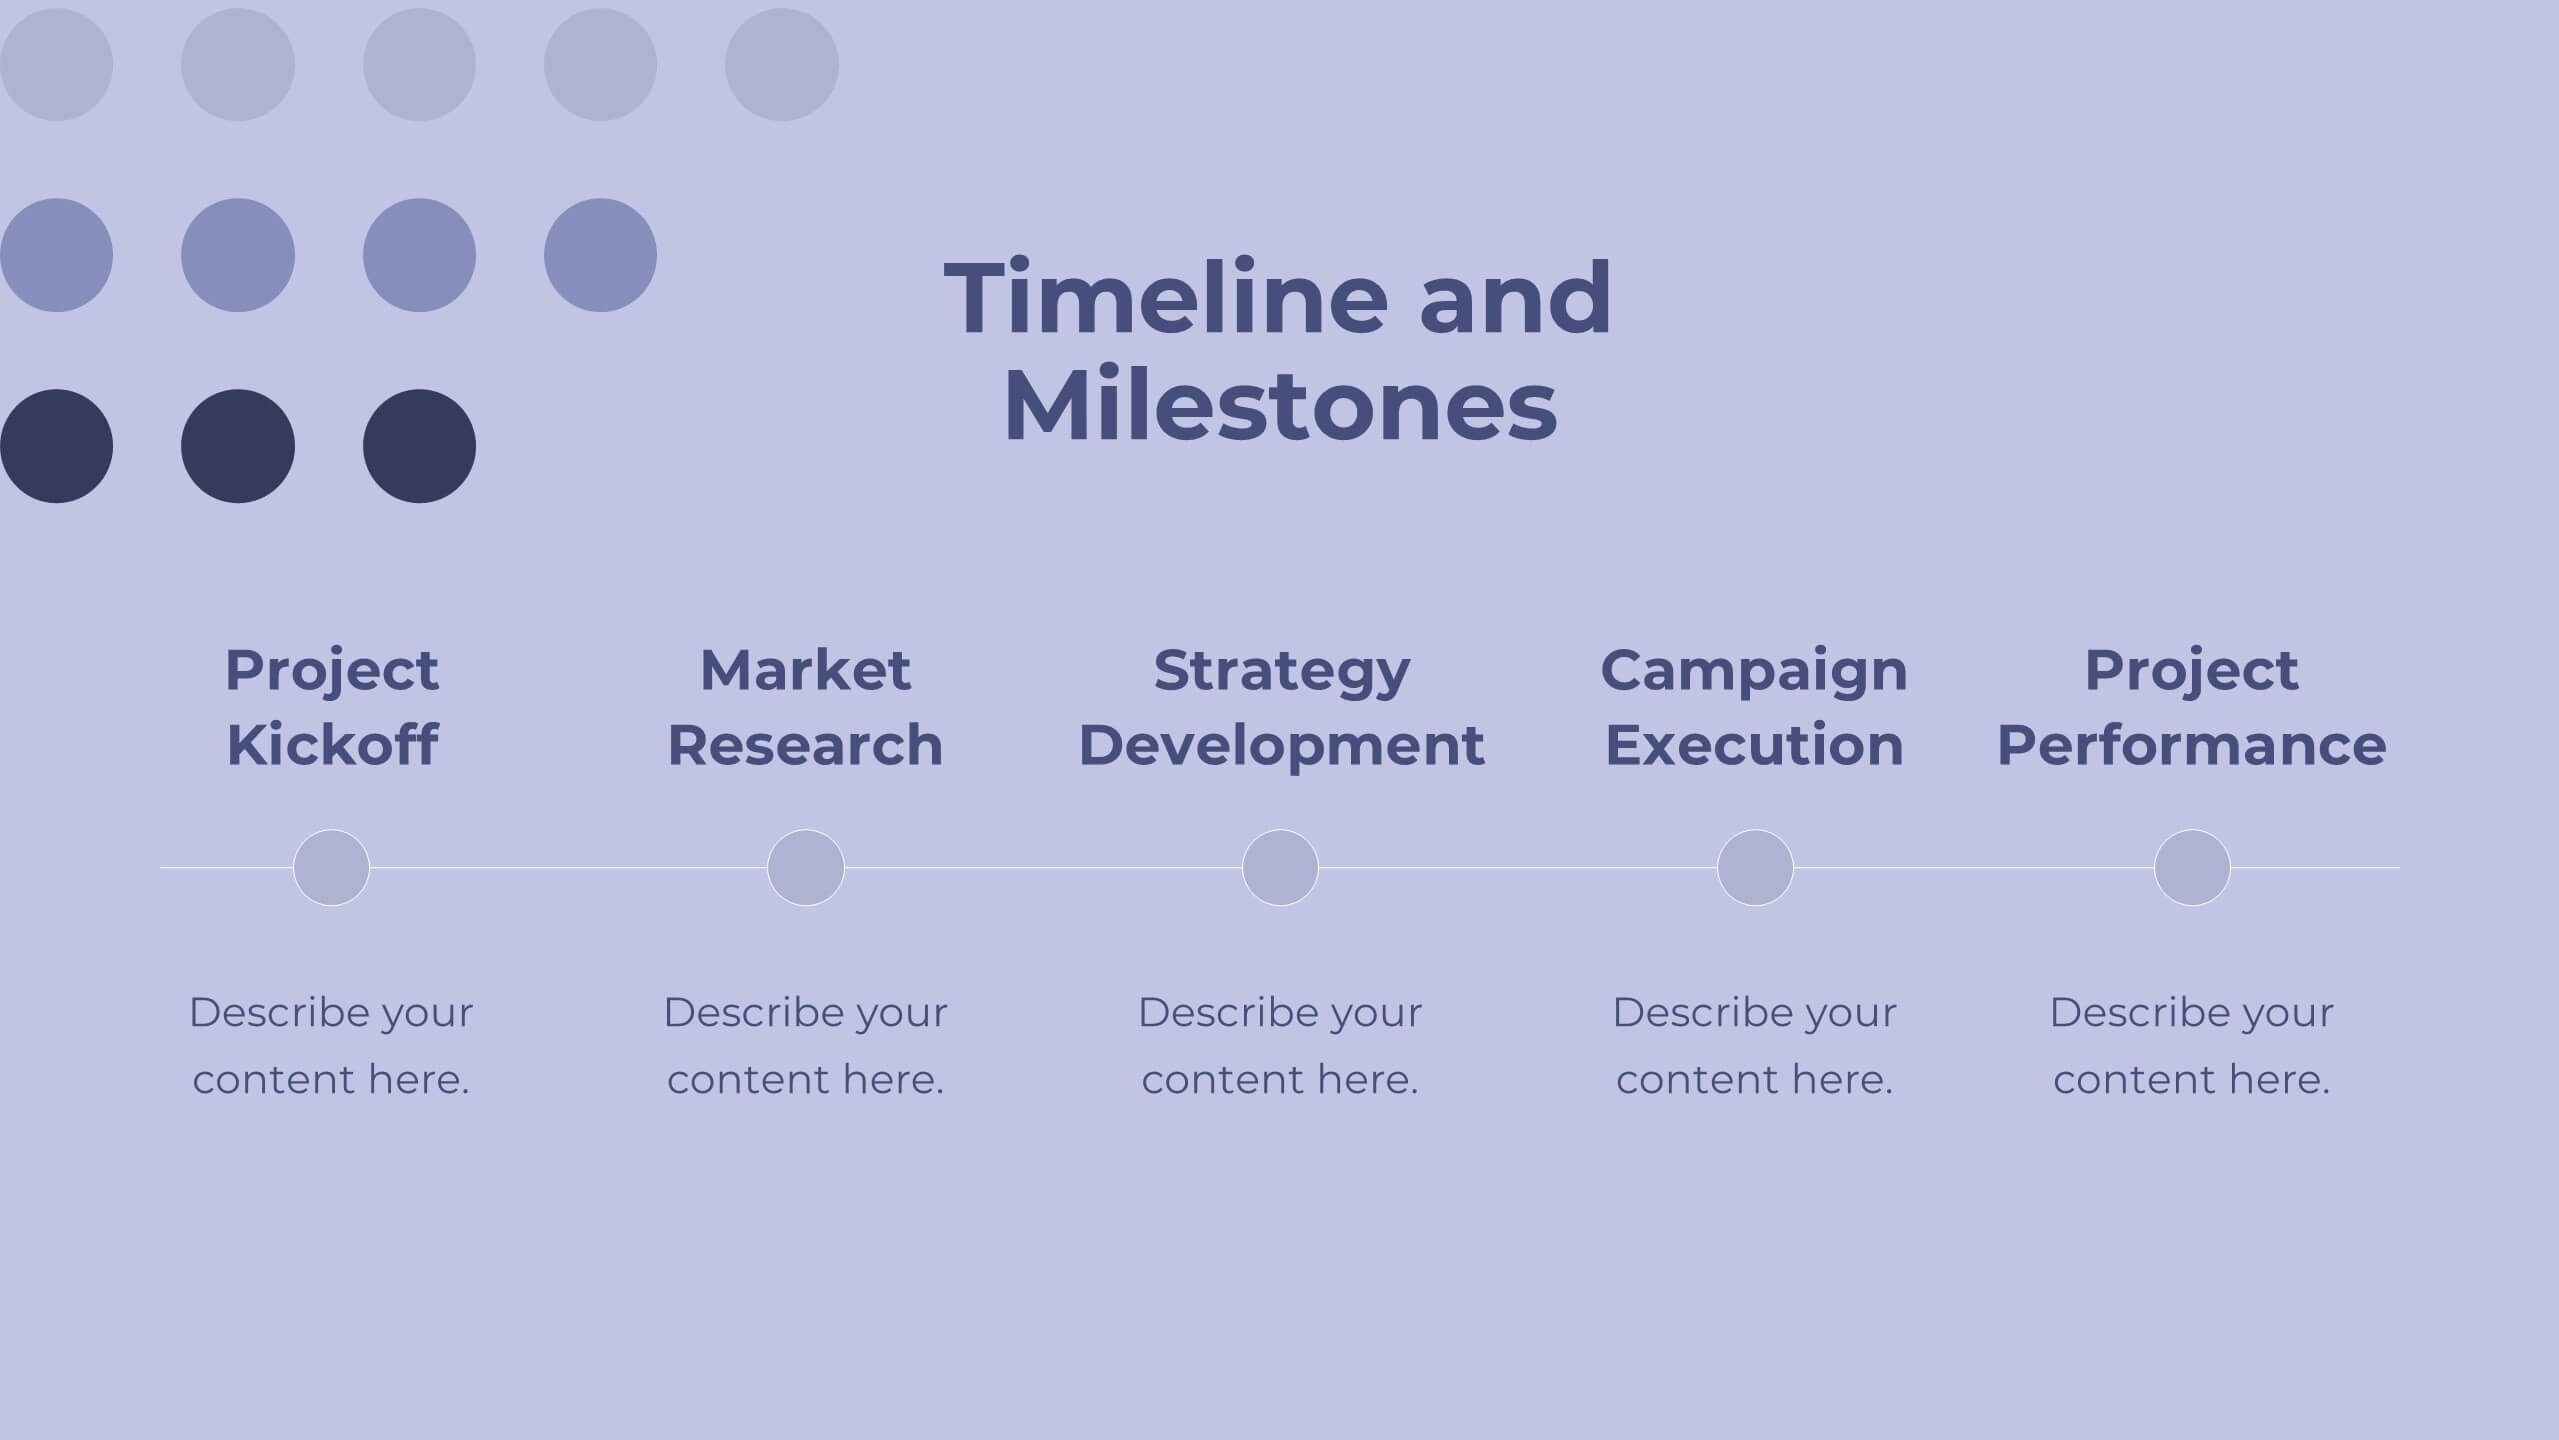
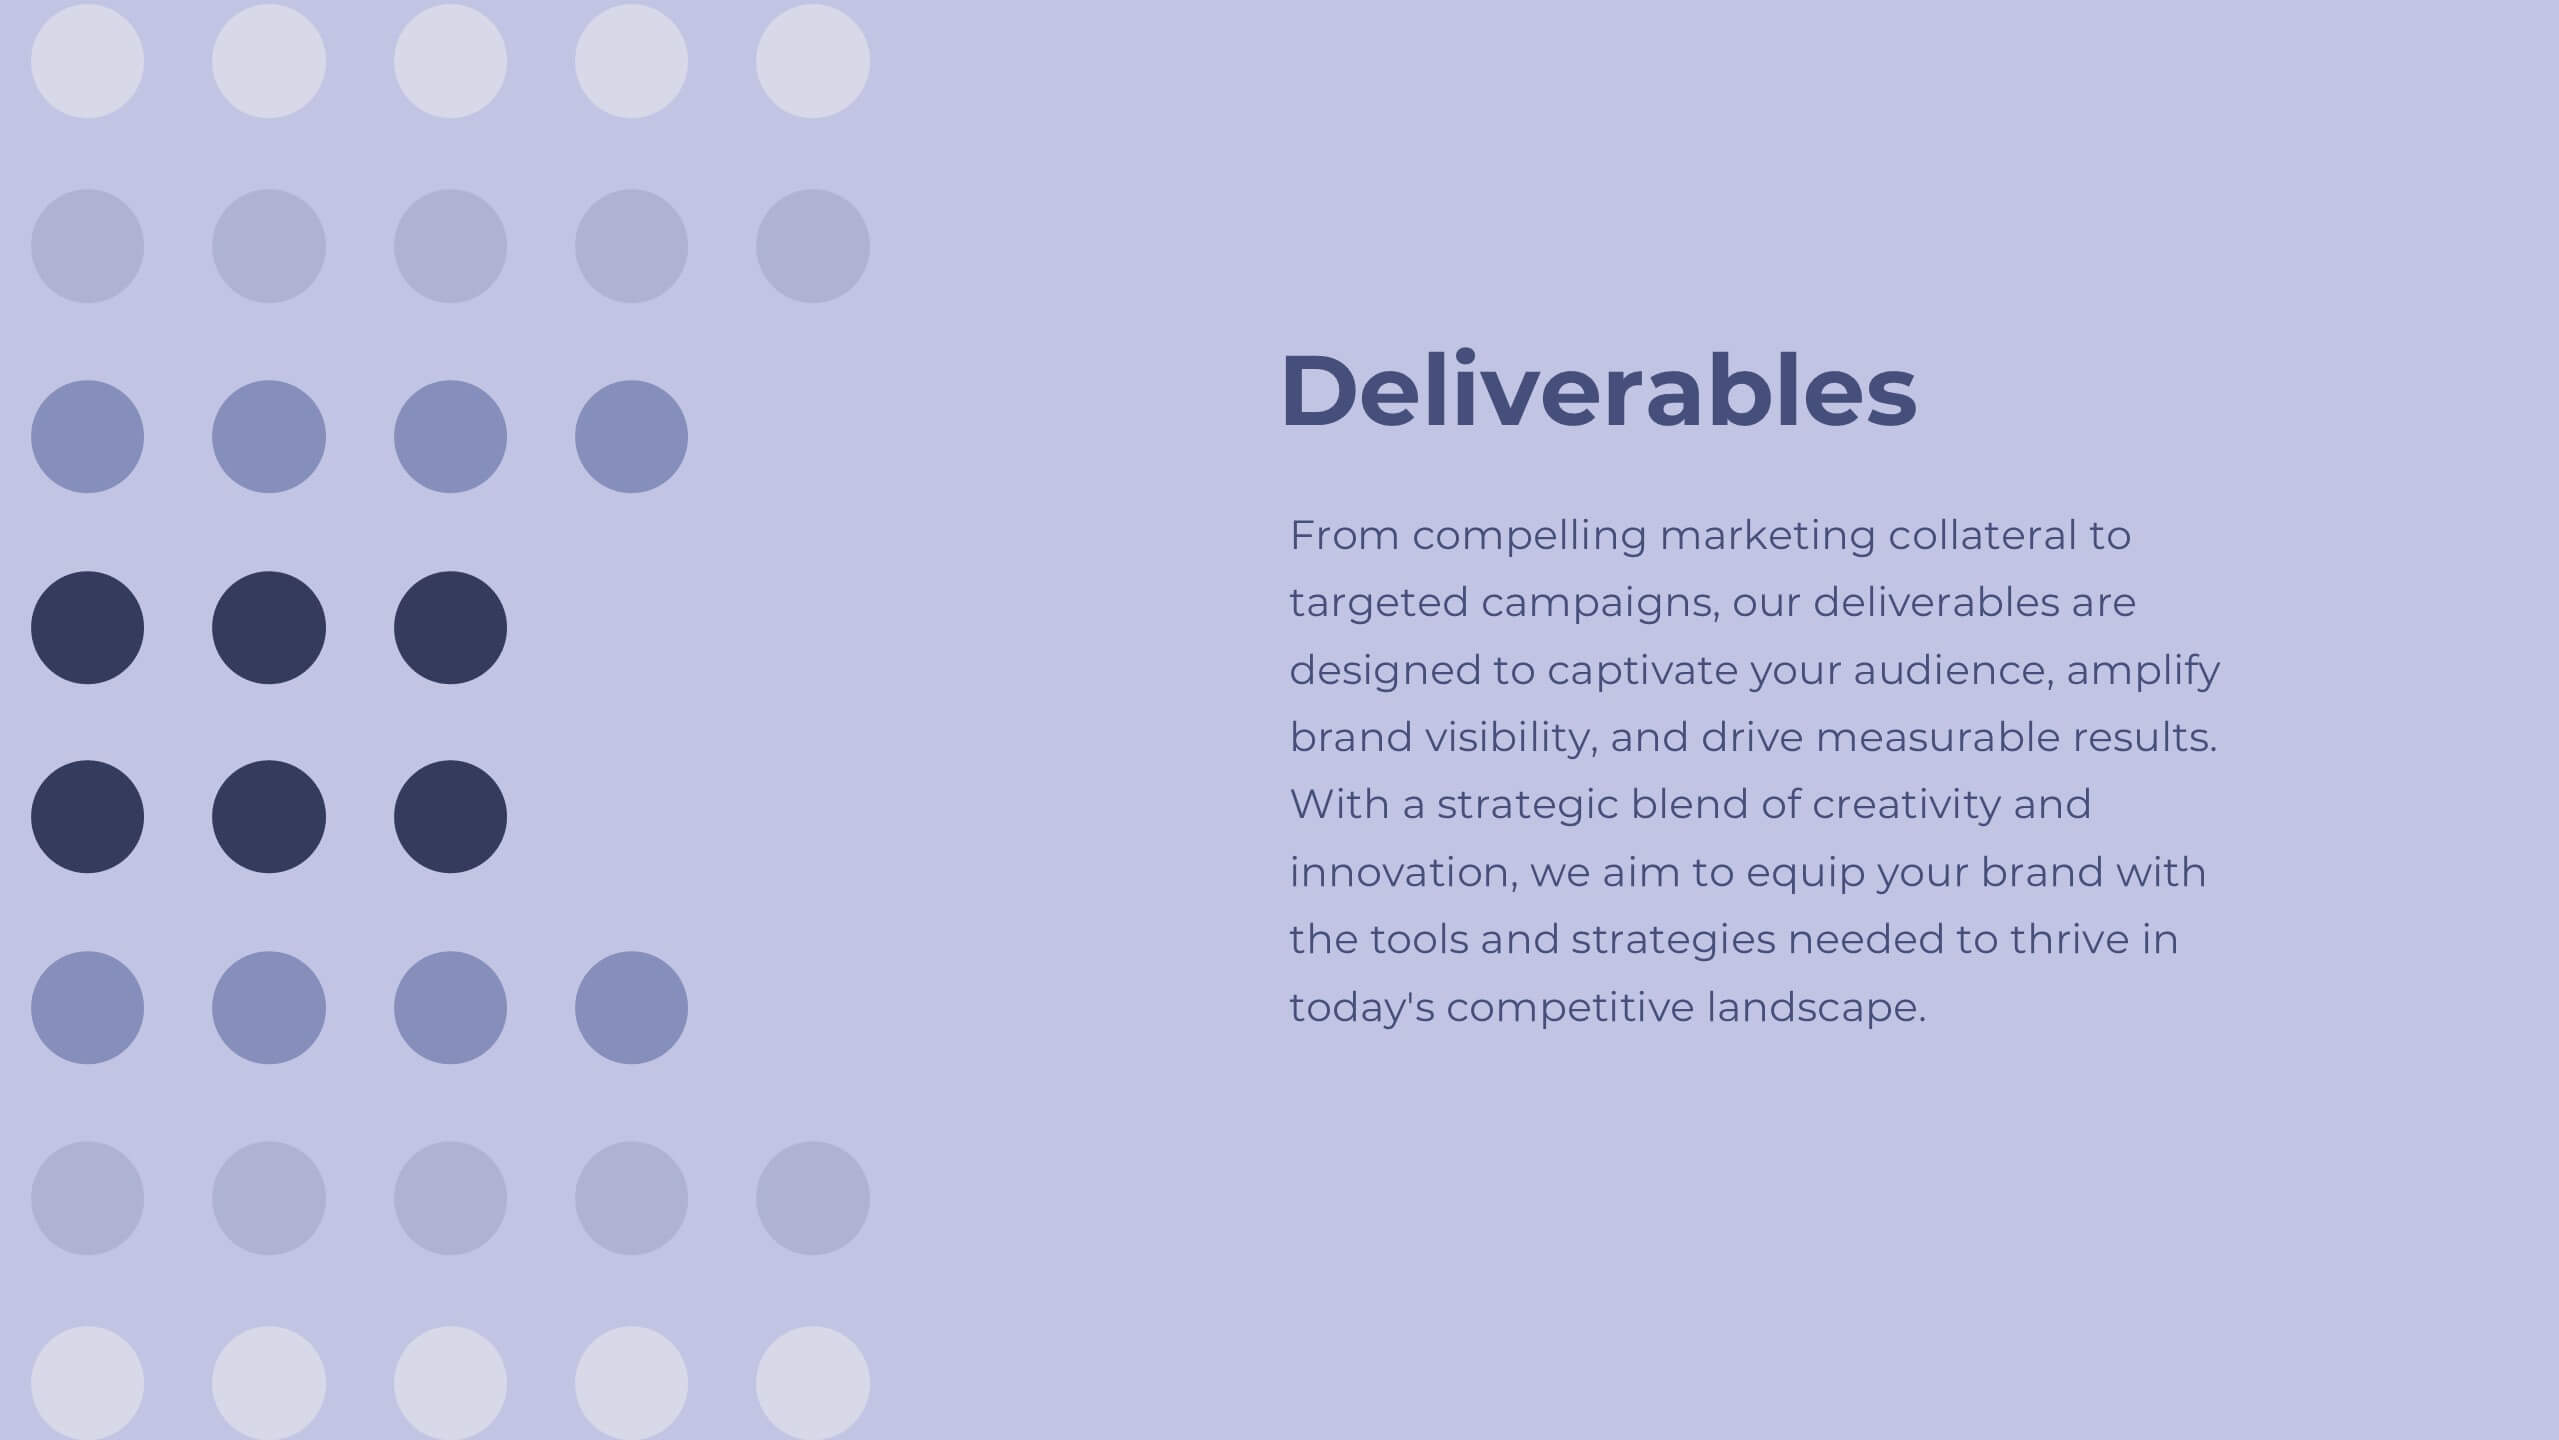
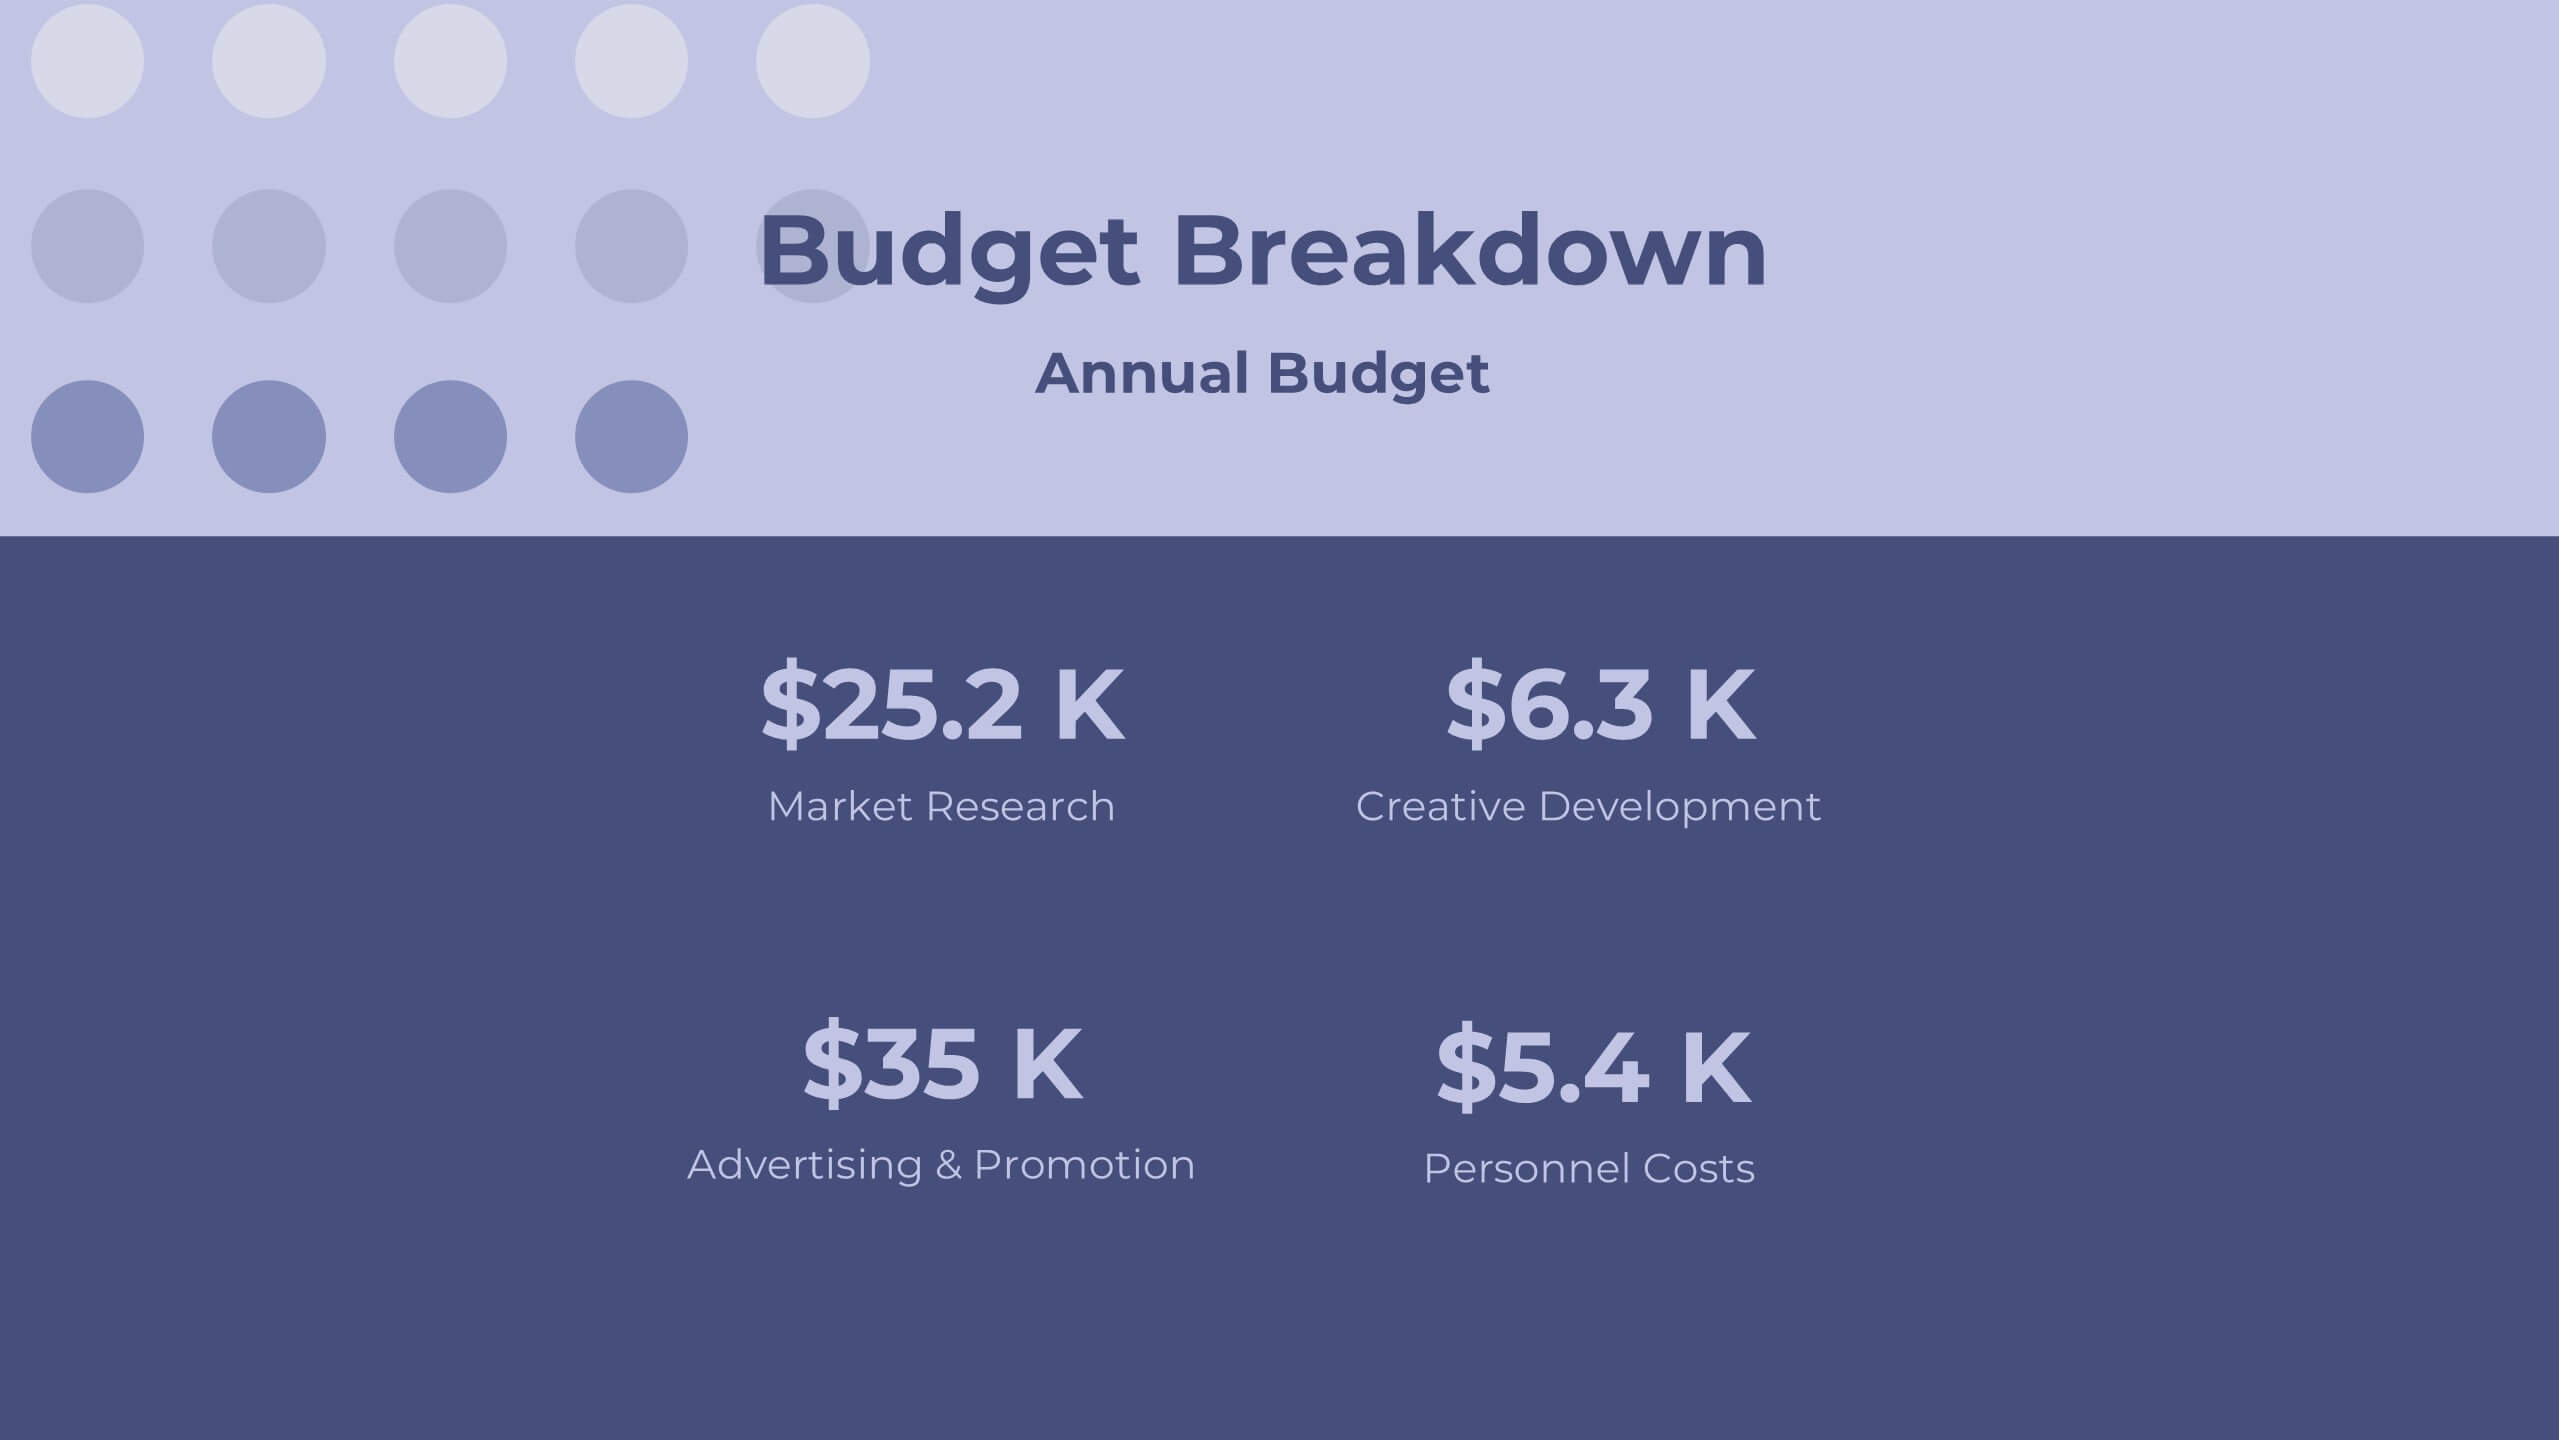
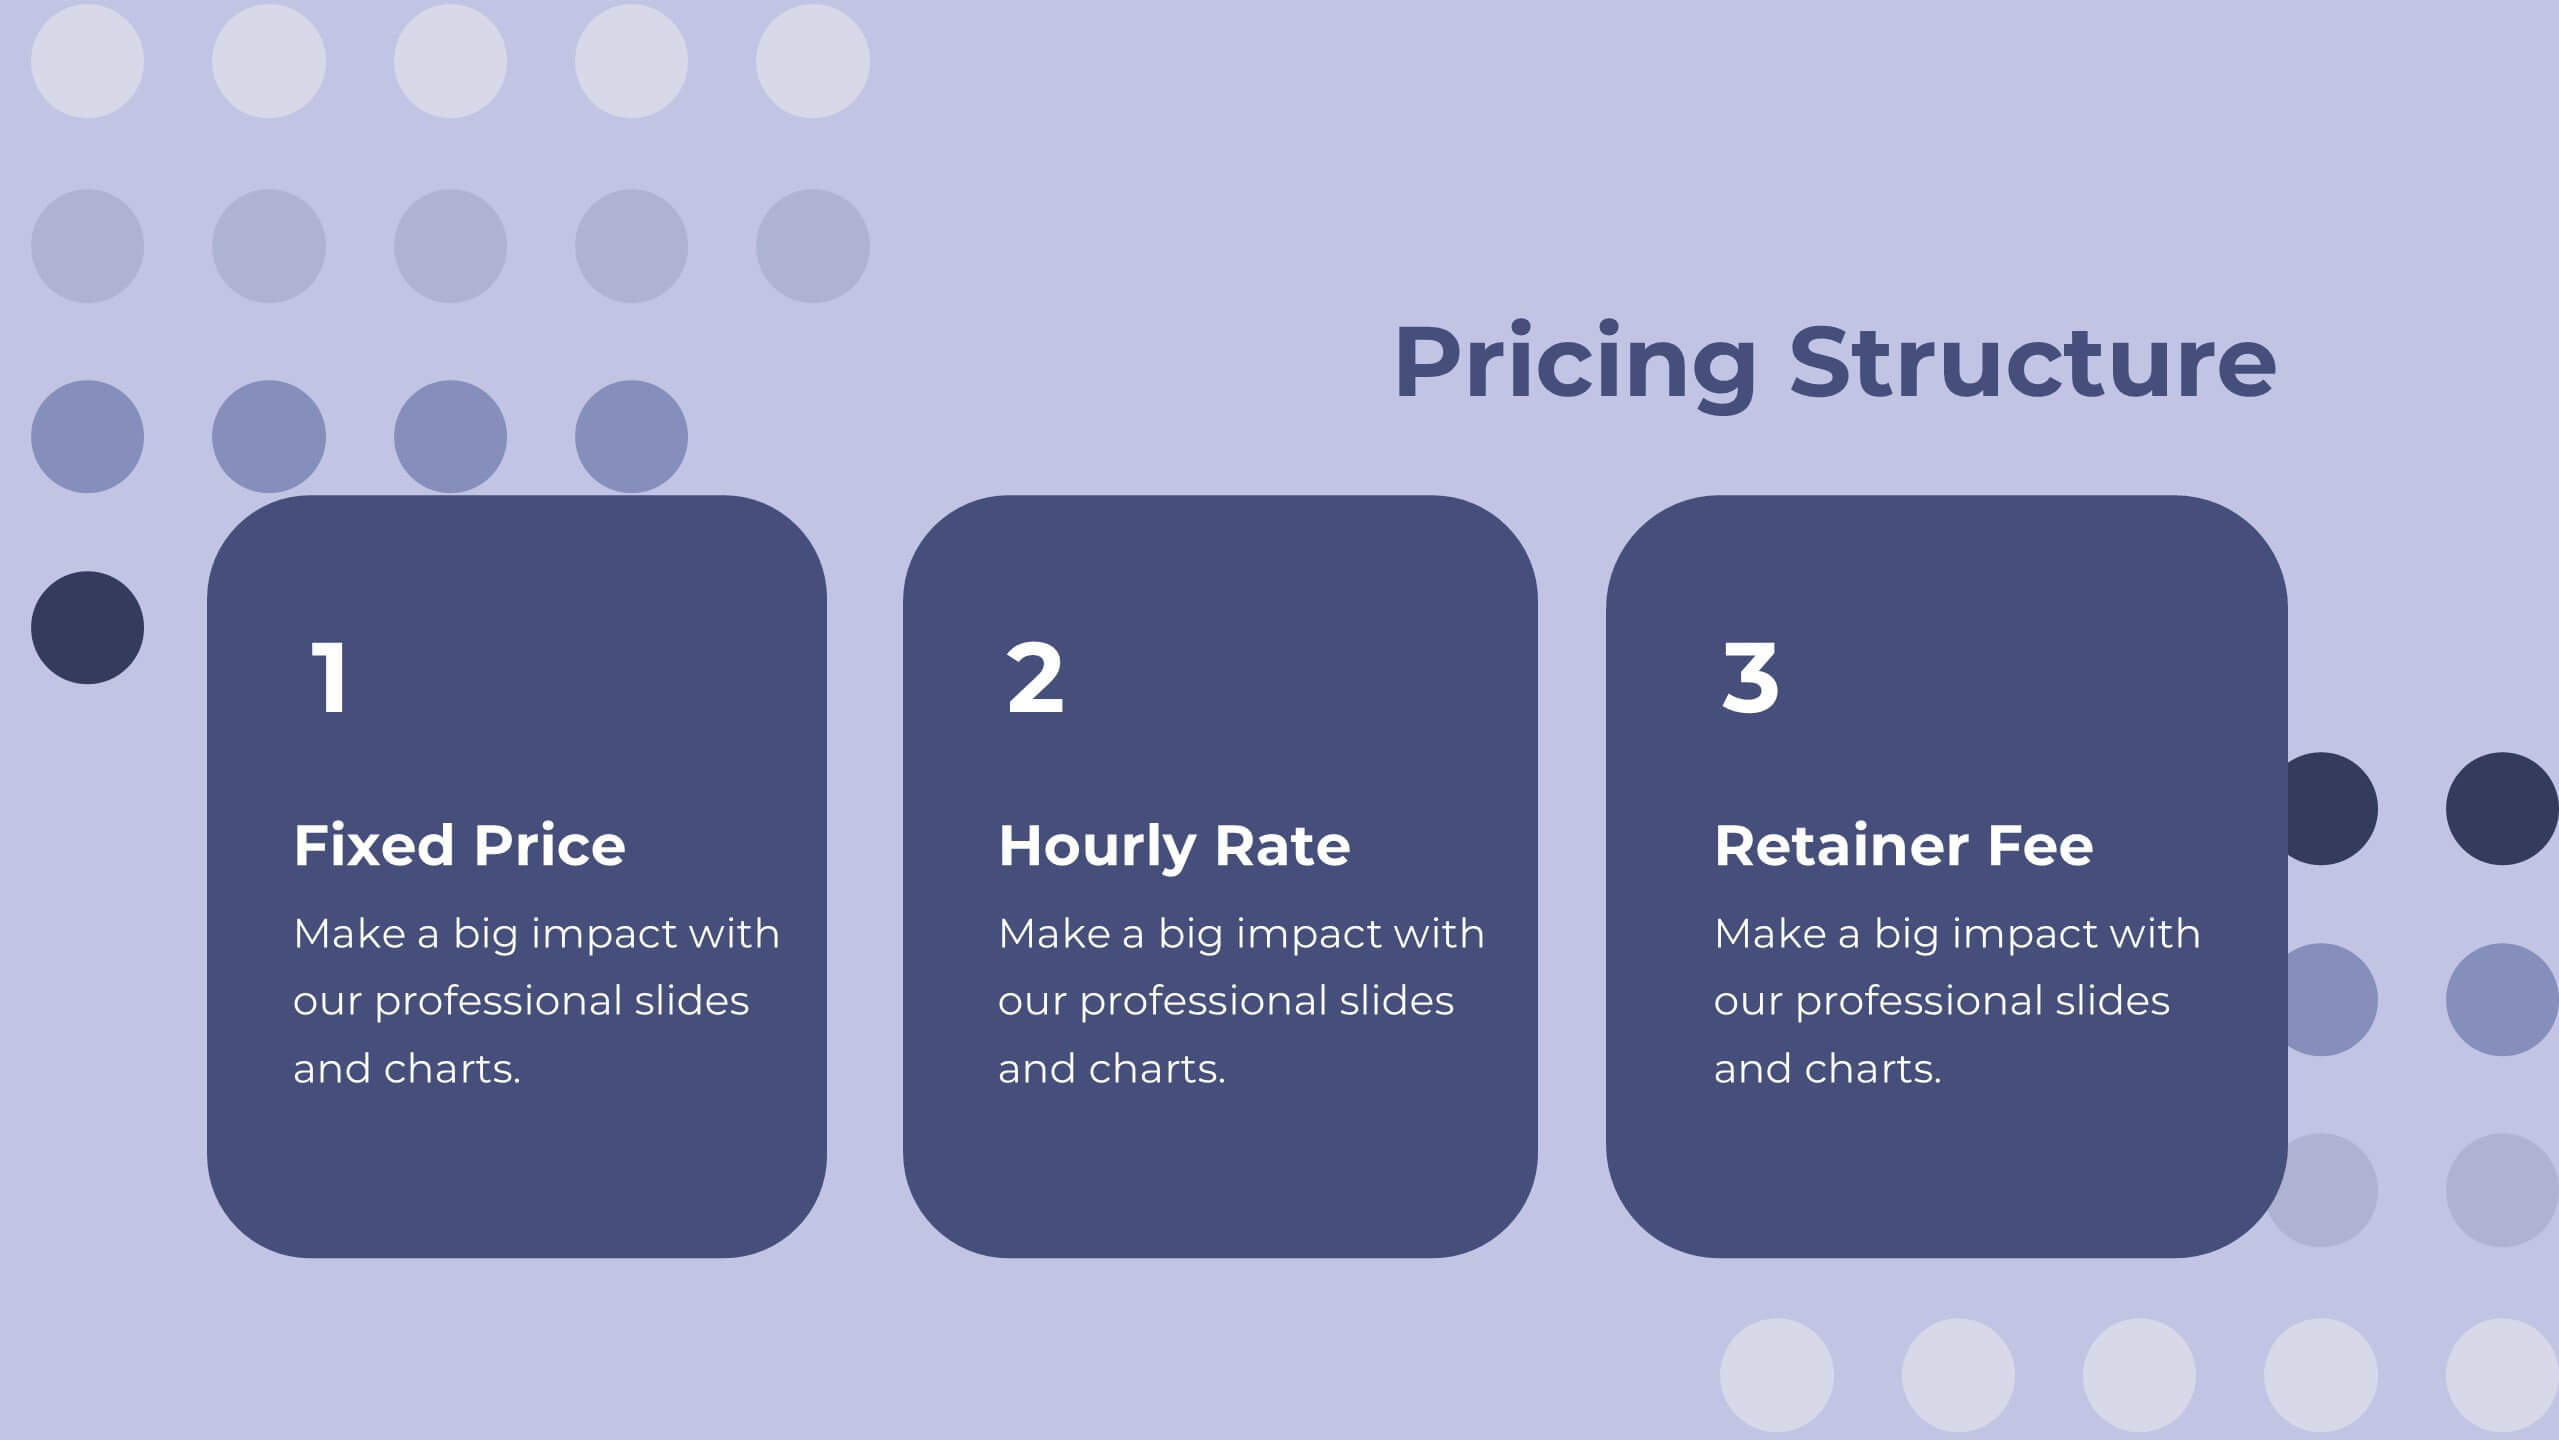
Present your project proposal with this clean and professional template! Covering sections such as objectives, scope of work, timeline, and budget breakdown, it helps you convey your plan clearly and effectively. Fully customizable and compatible with PowerPoint, Keynote, and Google Slides, it’s perfect for delivering impactful proposals to clients.


6 slides
Business Cloud Transformation Strategy Presentation
Streamline your cloud transition with this Business Cloud Transformation Strategy template. Perfect for IT leaders, cloud architects, and business executives, this slide provides a visual roadmap for migrating, integrating, and optimizing cloud solutions. With a modern, data-driven layout, it highlights key transformation phases, challenges, and benefits. Fully customizable and compatible with PowerPoint, Keynote, and Google Slides for professional presentations.


5 slides
Identifying Core Issues with Cause Mapping Presentation
Pinpoint the origin of your challenges with the Identifying Core Issues with Cause Mapping Presentation. This diagram is designed to break down problems step-by-step using a clean, logical flow format. Ideal for root cause analysis, risk reviews, and strategic audits, it helps teams visualize contributing factors and map out relationships. Fully editable in PowerPoint, Keynote, and Google Slides.


6 slides
5-Step SEO Marketing Funnel Presentation
Ignite your marketing story with a bold, flowing visual that makes every step feel purposeful and easy to follow. This presentation breaks down each stage of the SEO funnel, helping you explain strategy, performance, and conversion paths with clarity. Fully compatible with PowerPoint, Keynote, and Google Slides.


23 slides
Quest Corporate Strategy Proposal Presentation
Unlock success with this powerful corporate strategy template! Detail strategic objectives, market trends, and growth opportunities. Ideal for business leaders aiming to drive growth. Compatible with PowerPoint, Keynote, and Google Slides, this template ensures your strategy is clear, professional, and compelling. Make your vision a reality with impactful presentations.


8 slides
Business Challenge & Solution Presentation
Address complex issues with clarity using this business challenges and solutions presentation. Featuring a chess knight visual, it helps outline problems and corresponding strategies. Ideal for strategic planning, risk management, and executive briefings. Fully customizable in PowerPoint, Keynote, and Google Slides to fit your corporate or consulting presentation needs.


5 slides
Ecological Impact Reduction Strategies Presentation
Present your sustainability efforts with the Ecological Impact Reduction Strategies Presentation. This tree-inspired layout is perfect for outlining key eco-friendly initiatives, from waste management to energy efficiency. Clean visuals and editable elements make it easy to adapt for environmental proposals, reports, or team planning. Fully customizable in Canva, PowerPoint, or Google Slides.


6 slides
Market Challenges and Resilience Strategy Presentation
Tackle volatility with clarity using the Market Challenges and Resilience Strategy presentation. This slide features a modern smartphone graphic surrounded by six key strategy zones, each with its own icon and text area—ideal for outlining market pressures, competitive moves, or adaptive responses. Use it to communicate resilience frameworks, digital transformation steps, or scenario planning. Fully customizable in PowerPoint, Keynote, and Google Slides.


10 slides
Customer Market Segmentation Strategy Presentation
Define and visualize your audience with the Customer Market Segmentation Strategy Presentation. This slide layout helps you categorize customer types using clean iconography and a central persona model. Ideal for marketing teams, sales strategists, or startup pitches. Customize easily in Canva, PowerPoint, Google Slides, or Keynote.


6 slides
Product Life Cycle Stages and Management Presentation
Visualize the journey from product development to market maturity with this modern, conveyor-style layout. Designed to represent five sequential phases, this presentation is perfect for product managers, marketing teams, or business strategists explaining launch strategies, performance tracking, or growth planning. Fully editable in PowerPoint, Keynote, and Google Slides.


4 slides
USA, Canada & Mexico Business Reach Presentation
Showcase your regional presence with the USA, Canada & Mexico Business Reach Presentation. This slide helps you pinpoint key business activities or initiatives across North America using colorful map markers and customizable icons. Ideal for market updates or growth plans. Fully editable in Canva, PowerPoint, and Google Slides.


5 slides
Safety Compliance Overview Presentation
Keep your organization protected and compliant with this modern and visual presentation design. Ideal for outlining safety protocols, training programs, and regulatory standards, it helps simplify complex processes into clear, engaging visuals. Fully customizable and compatible with PowerPoint, Keynote, and Google Slides for professional and polished presentations.


8 slides
Core Pillars of Business Success Presentation
Highlight your company’s foundation with the Core Pillars of Business Success presentation. This slide features four bold, column-style visuals labeled A through D—each representing a critical component of your business strategy. Ideal for illustrating structure, vision, and stability, it helps communicate growth factors like leadership, innovation, operations, and finance. Fully editable in PowerPoint, Keynote, and Google Slides, it's perfect for consultants, executives, and strategic planners.


6 slides
Business Strategy Wheel Presentation
Bring your ideas full circle with this dynamic and colorful presentation design. Perfect for illustrating key strategies, continuous improvement cycles, or interconnected business concepts, it transforms complex processes into simple, engaging visuals. Fully customizable and compatible with PowerPoint, Keynote, and Google Slides for effortless editing and professional presentation.


4 slides
Corporate Growth and Strategy Map Presentation
Visualize your business development path with this layered strategy map. Ideal for showcasing organizational goals, strategic initiatives, and cascading growth stages. Each level is clearly structured for easy customization, making it perfect for leadership planning, corporate roadmaps, or strategic reviews in PowerPoint, Keynote, or Google Slides.