


Features
- 8 Unique slides
- Fully editable and easy to edit in Microsoft Powerpoint, Keynote and Google Slides
- 16:9 widescreen layout
- Clean and professional designs
- Export to JPG, PDF or send by email


Do you have any questions?
Recommend


6 slides
Numerical Data Infographic Presentation
Present complex data in a visually engaging way with the Numerical Data Infographic Presentation template. Featuring bar charts, percentage indicators, and segmented data visuals, this template makes statistical analysis clear and digestible. Perfect for business reports, analytics presentations, and performance reviews, this fully editable set is compatible with PowerPoint, Keynote, and Google Slides.


6 slides
Emerging Tech Trends and Tools Presentation
Stay ahead of the curve with this Emerging Tech Trends and Tools Presentation. Featuring a sleek computer-based layout with six data points, this template is ideal for showcasing innovations, tools, or future-focused strategies. Easily customizable in Canva, PowerPoint, and Google Slides for a professional and modern tech presentation.

22 slides
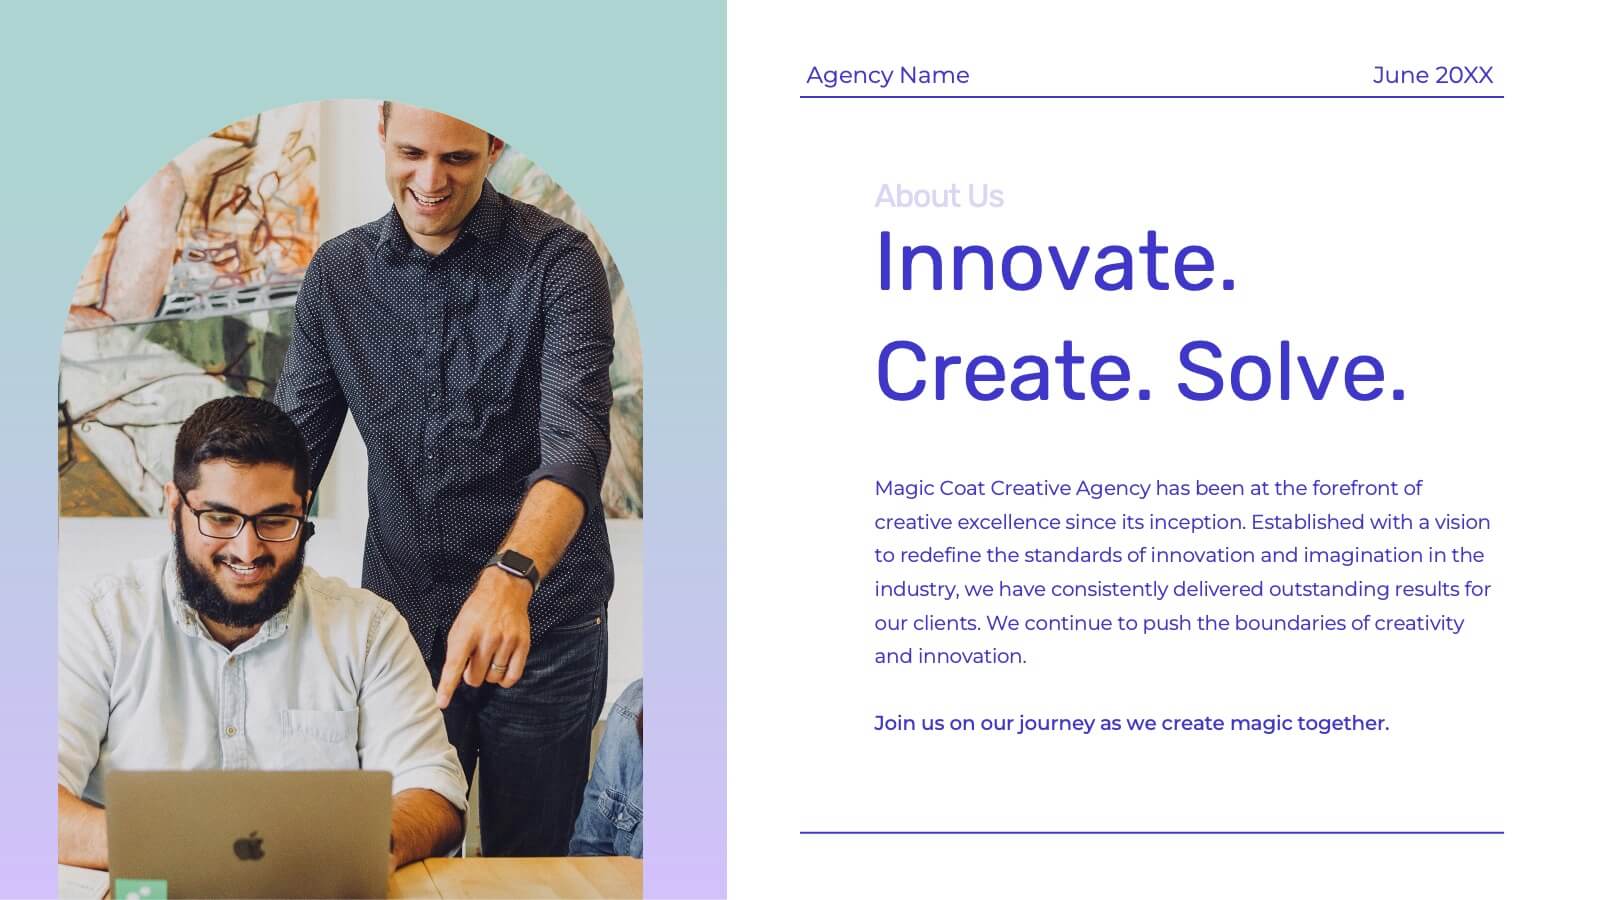
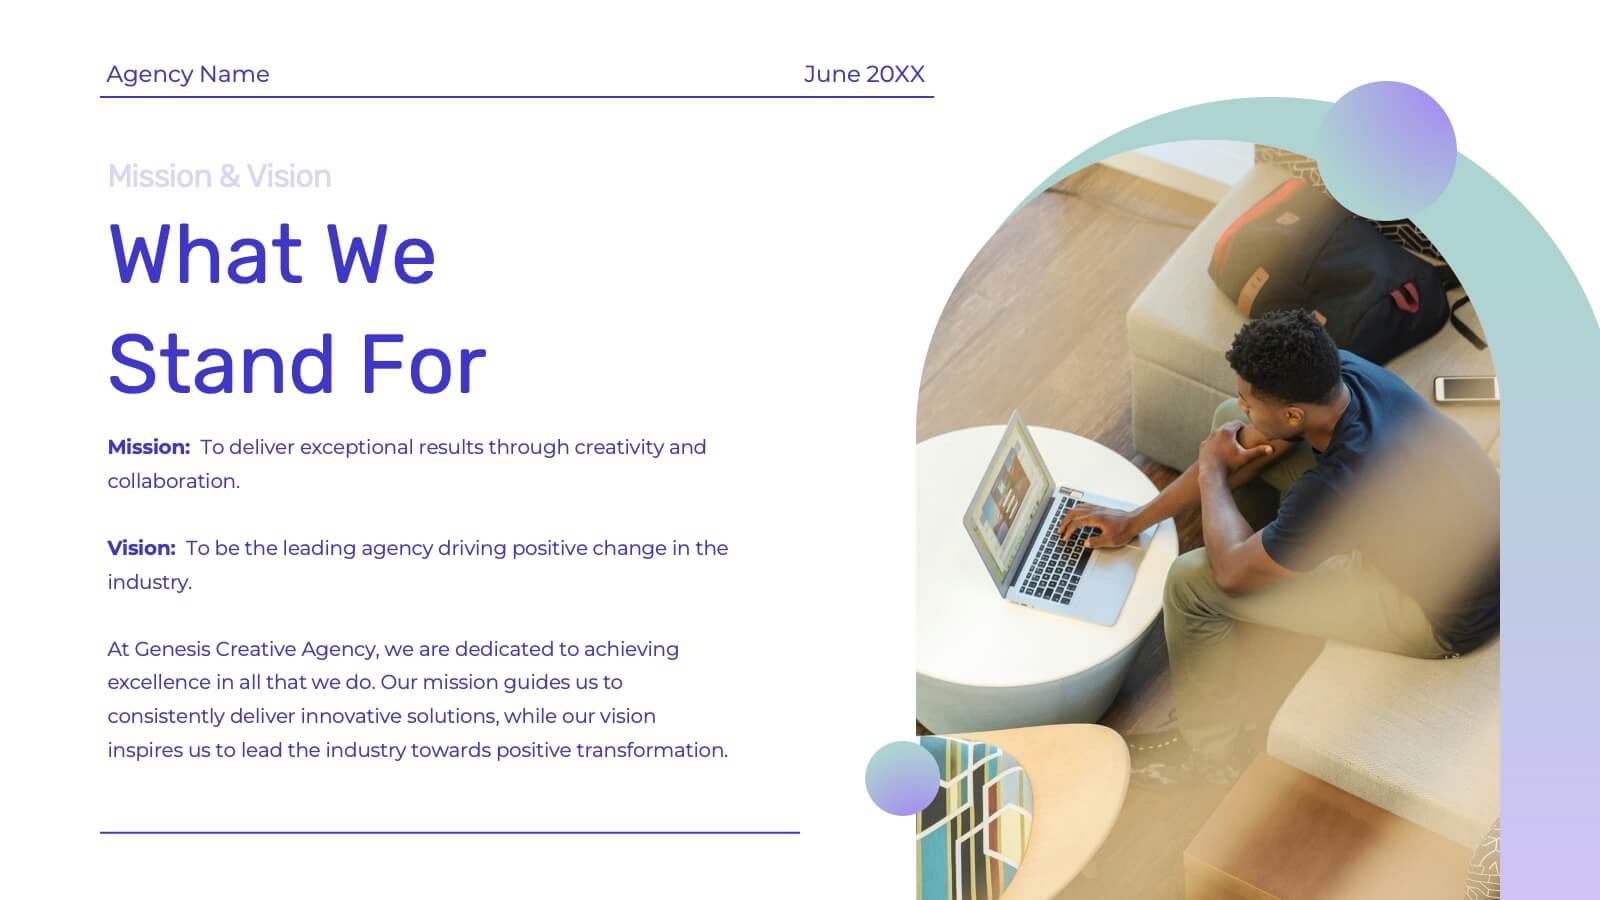
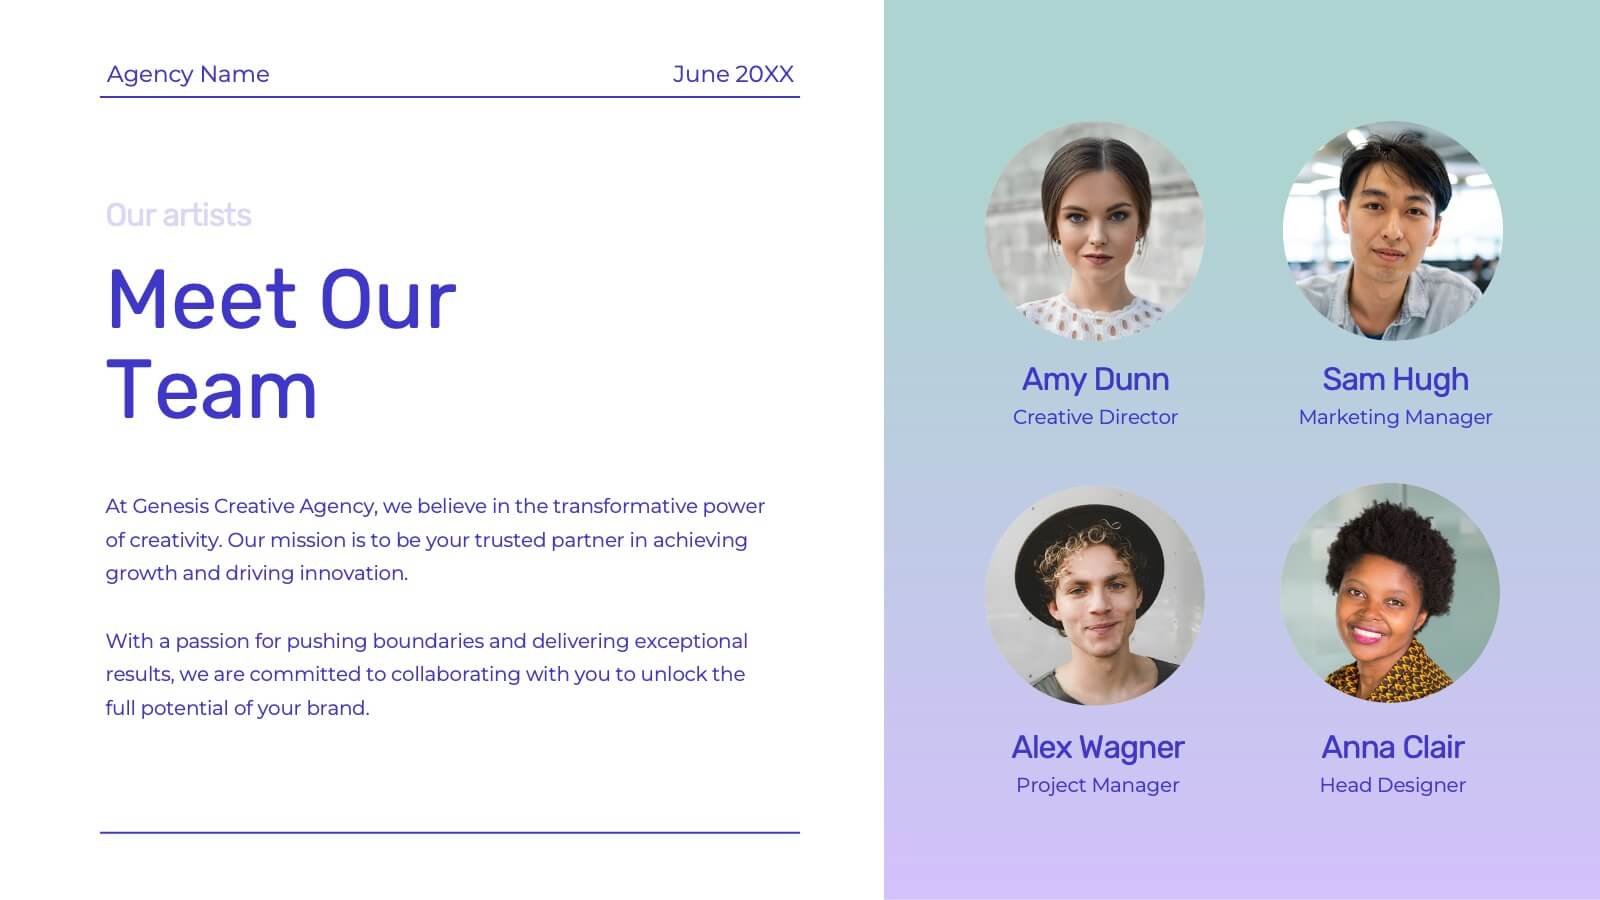
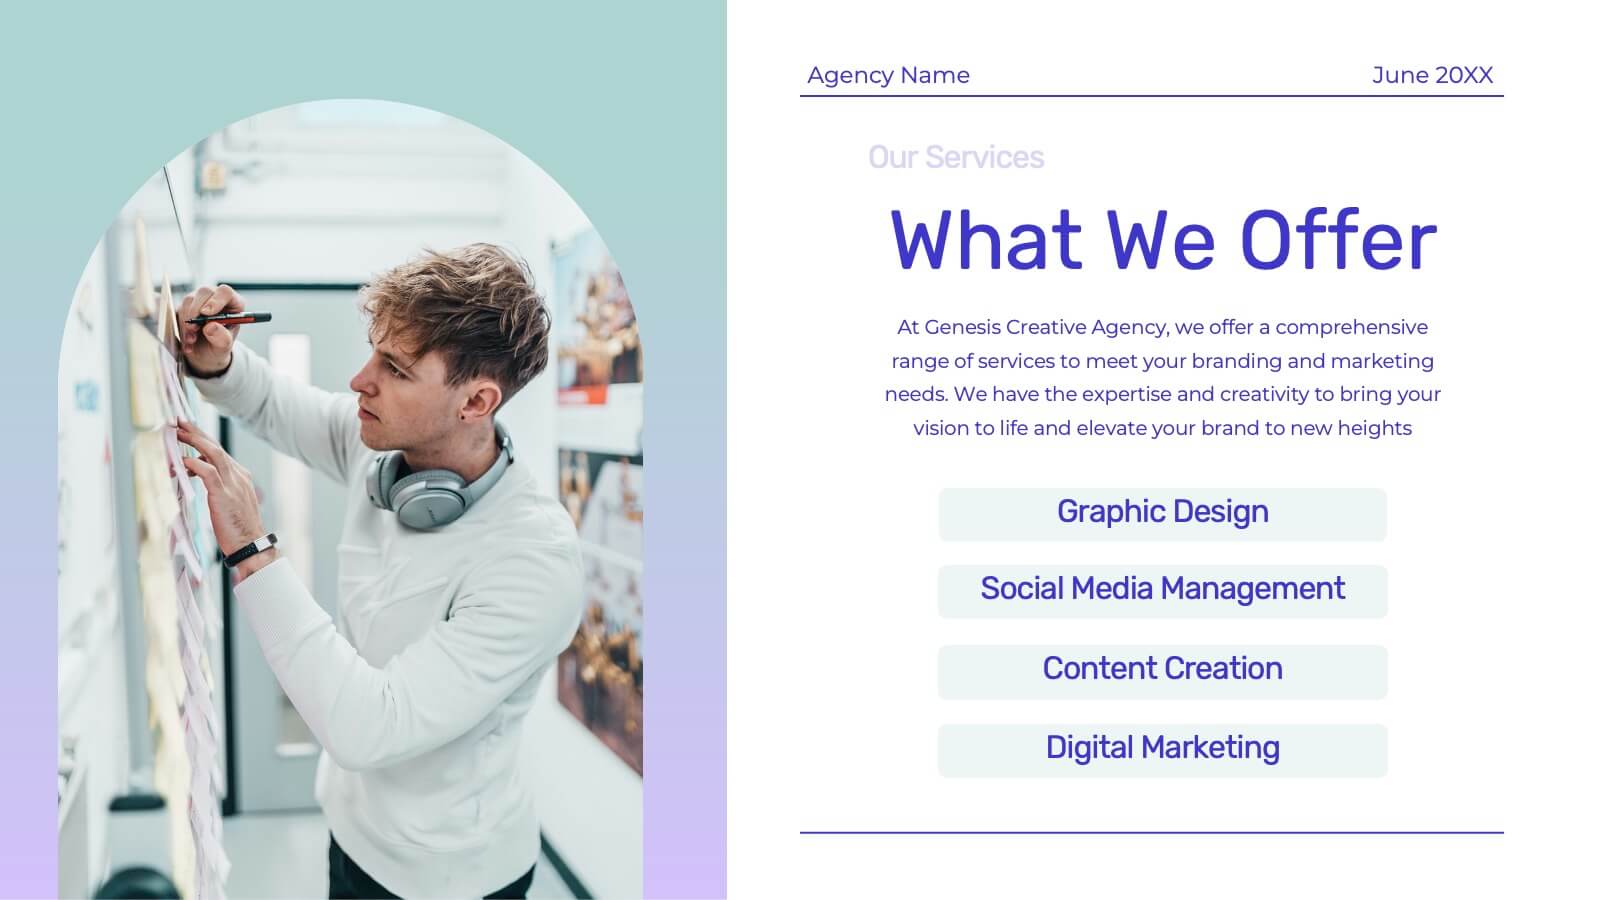
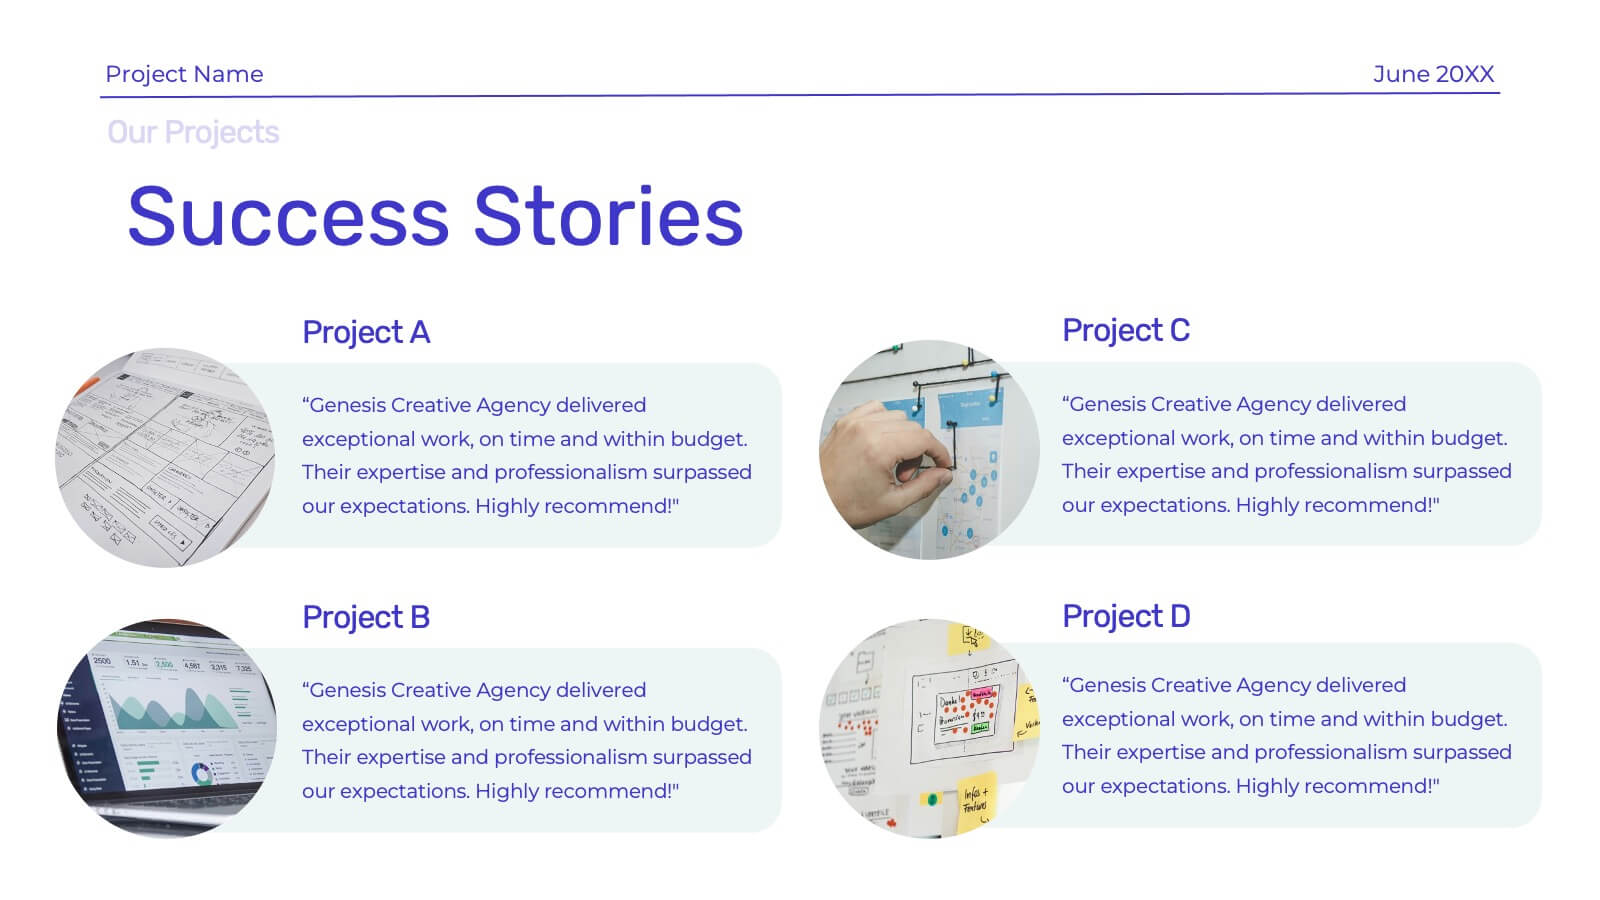
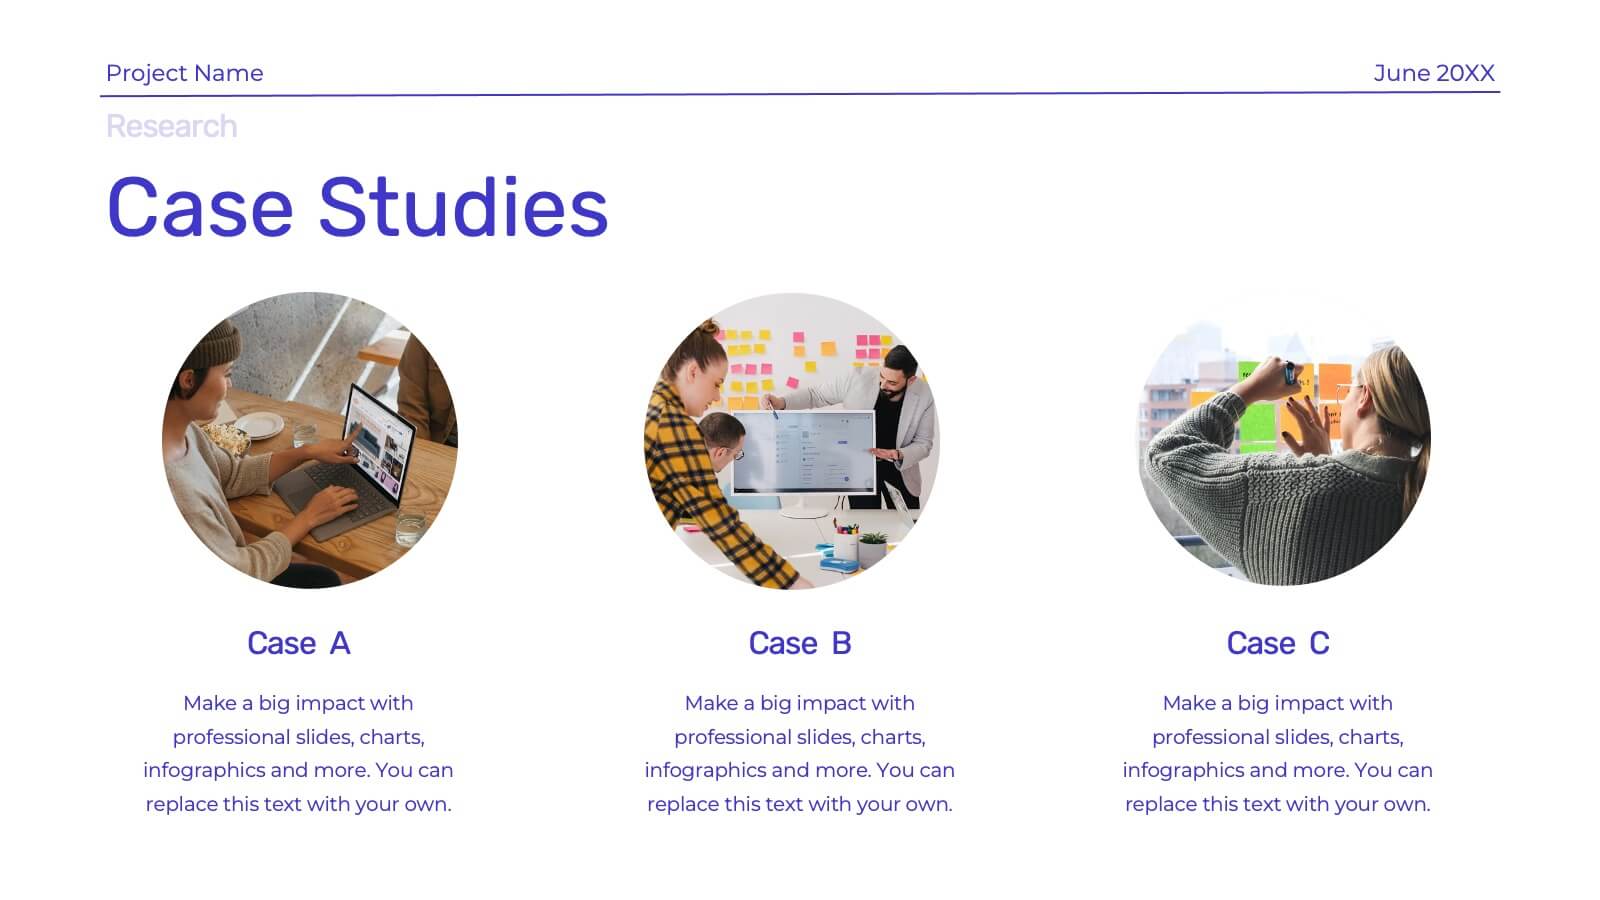
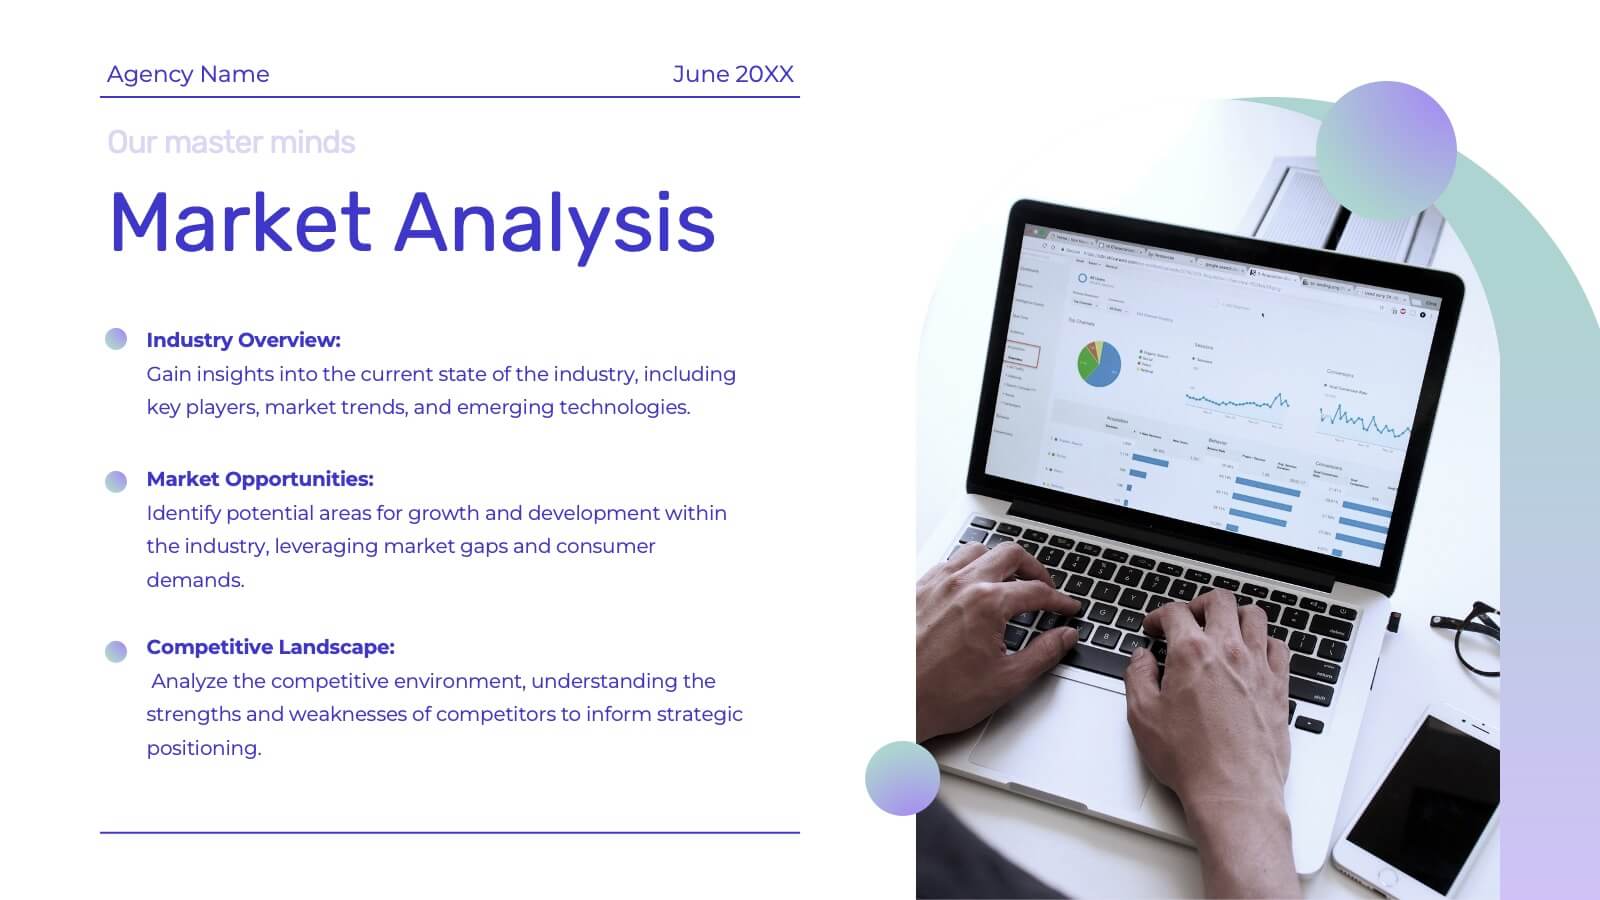
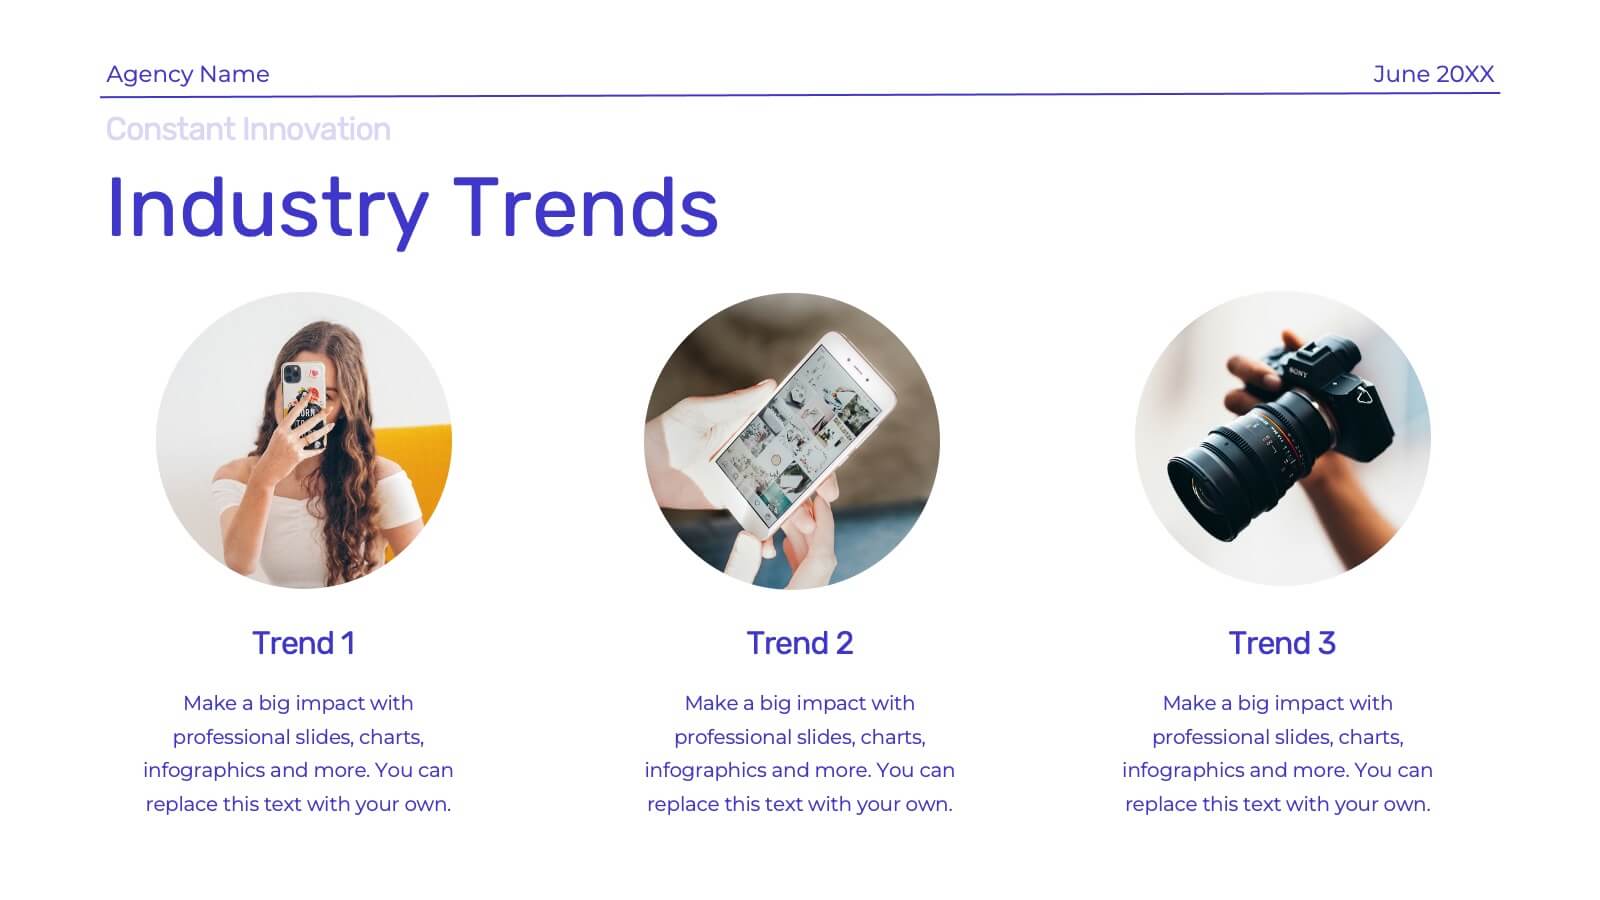
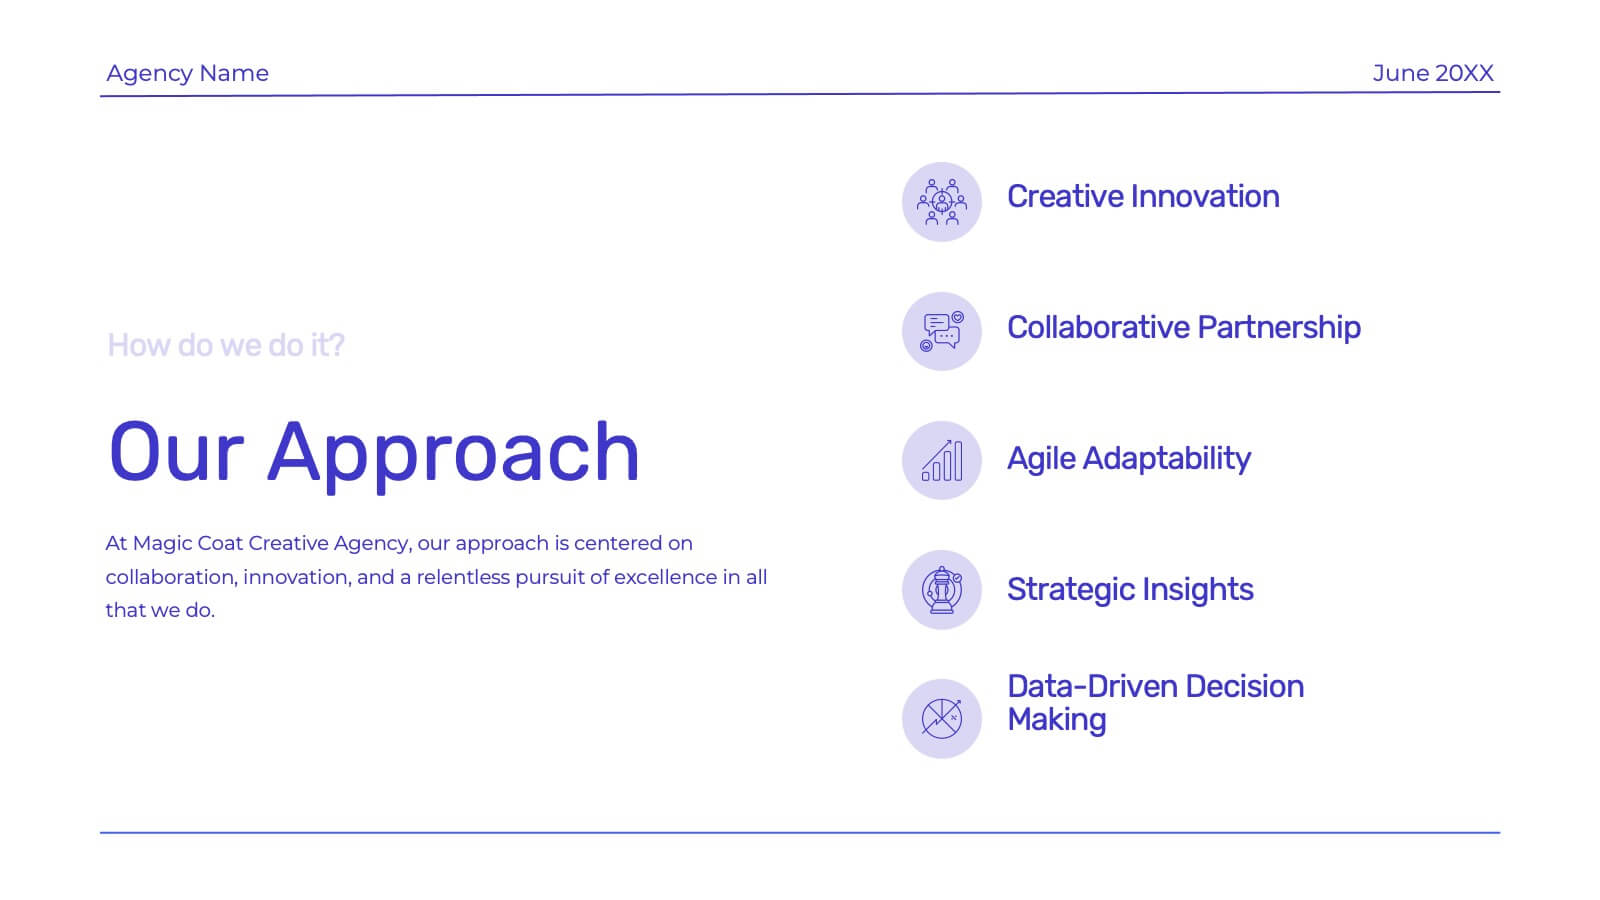
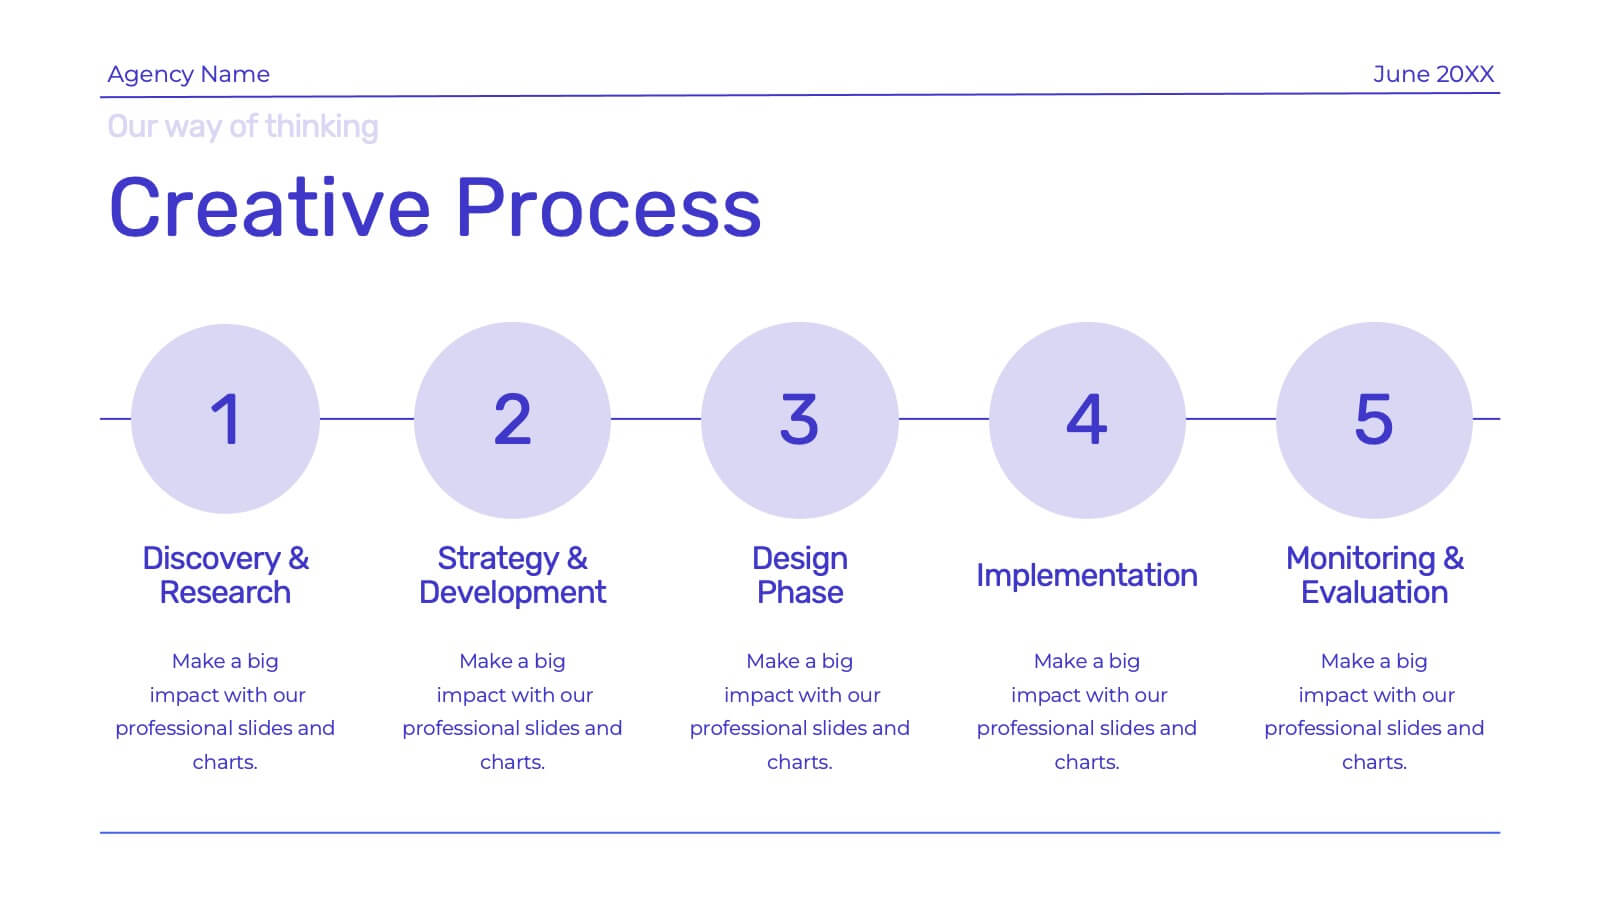
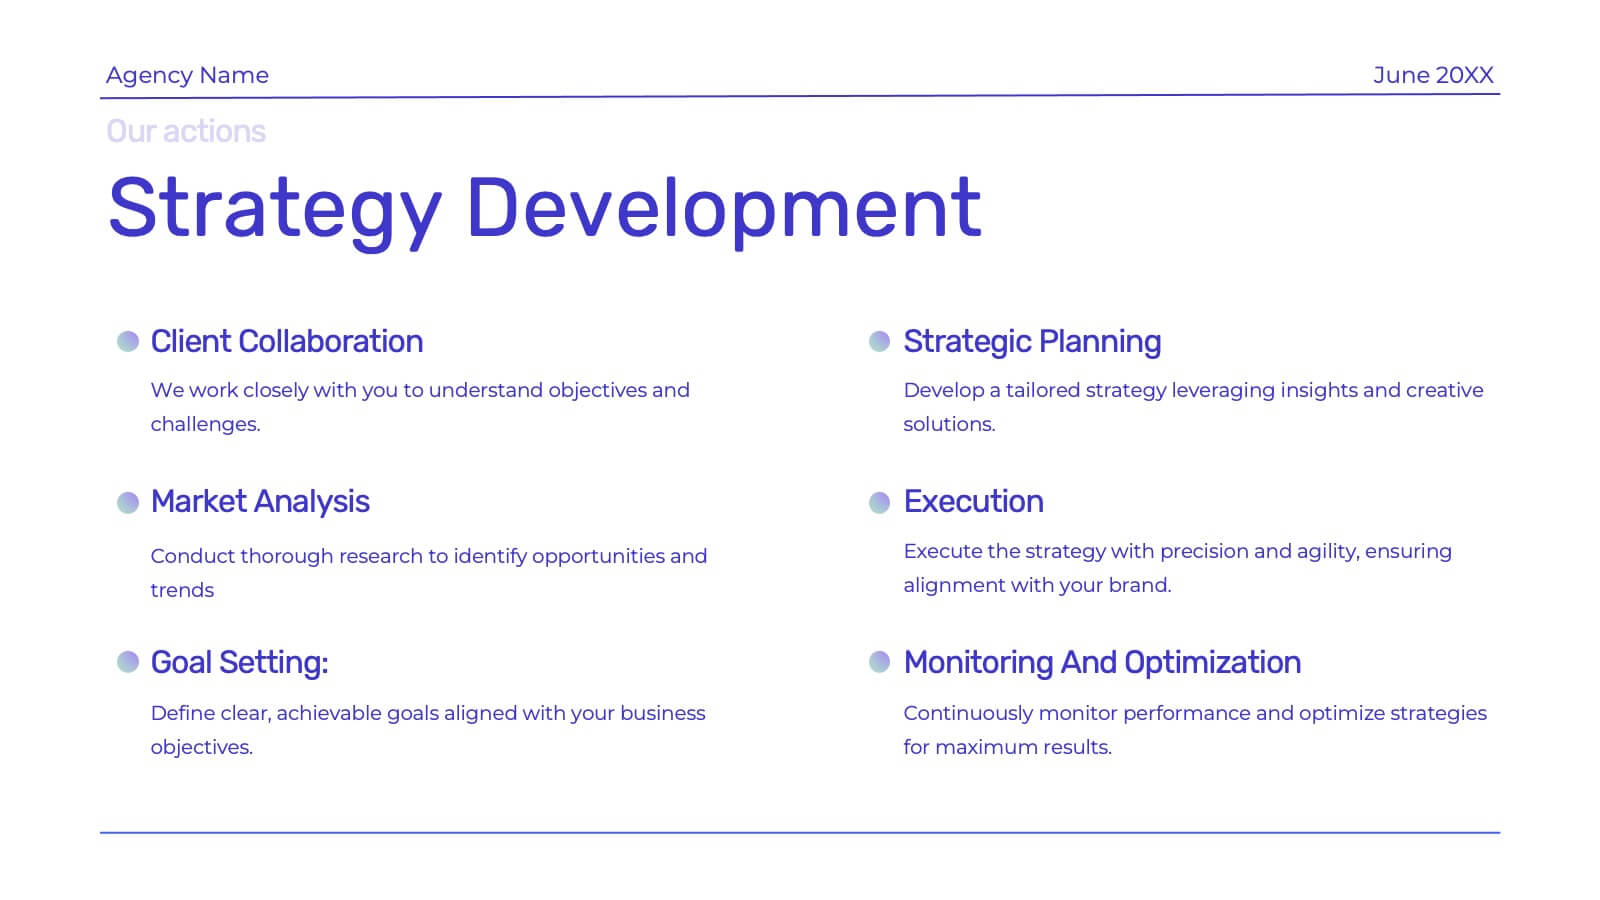
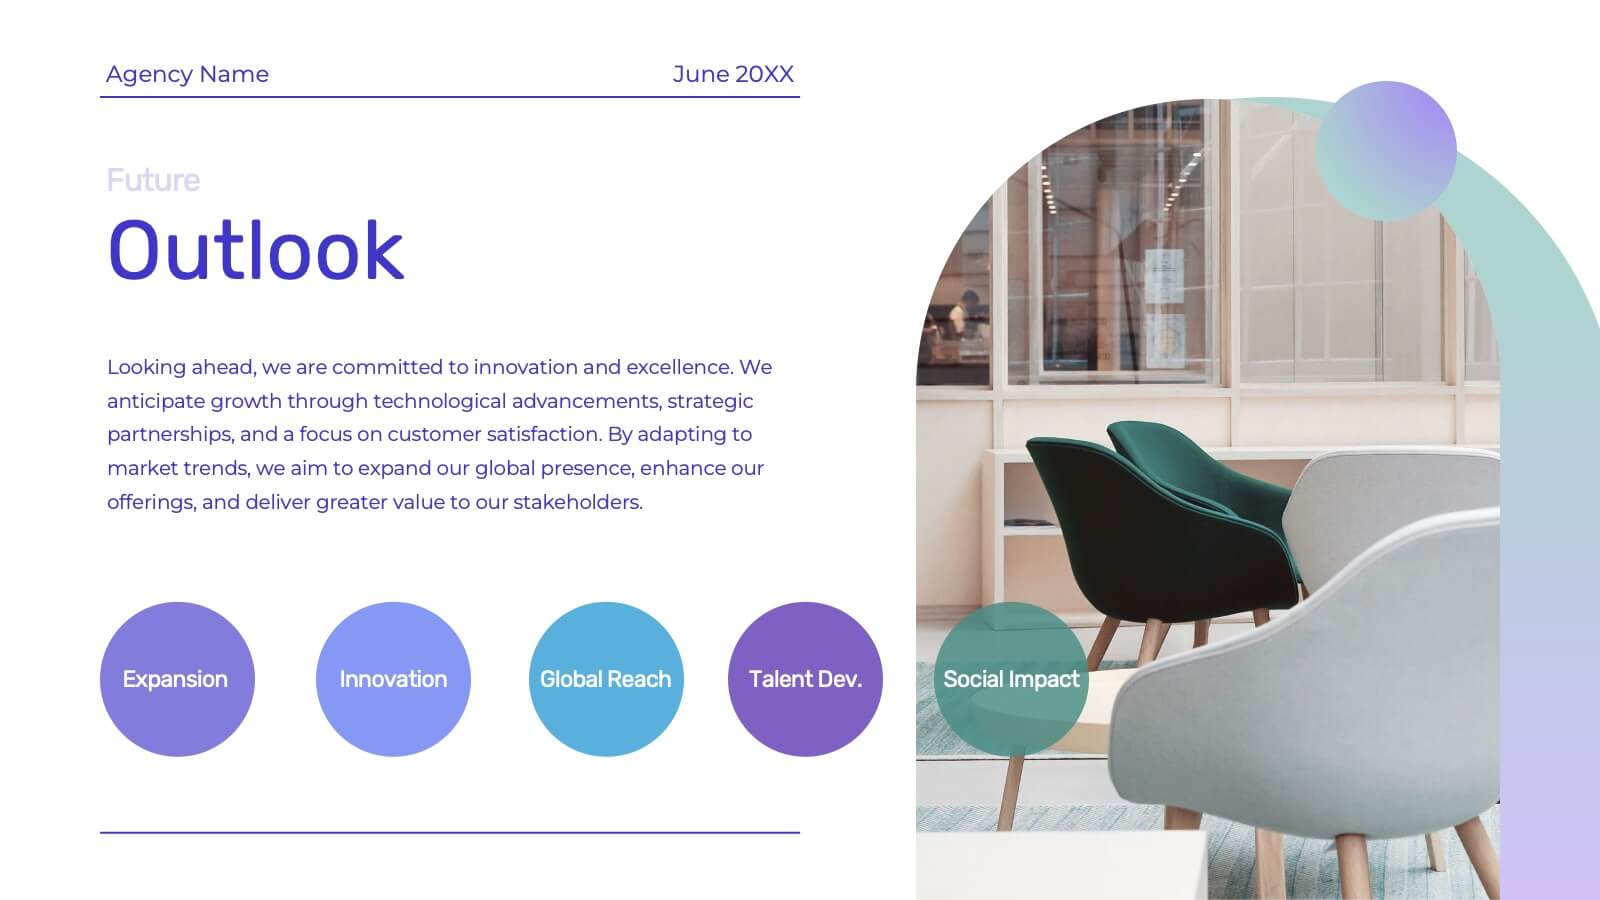
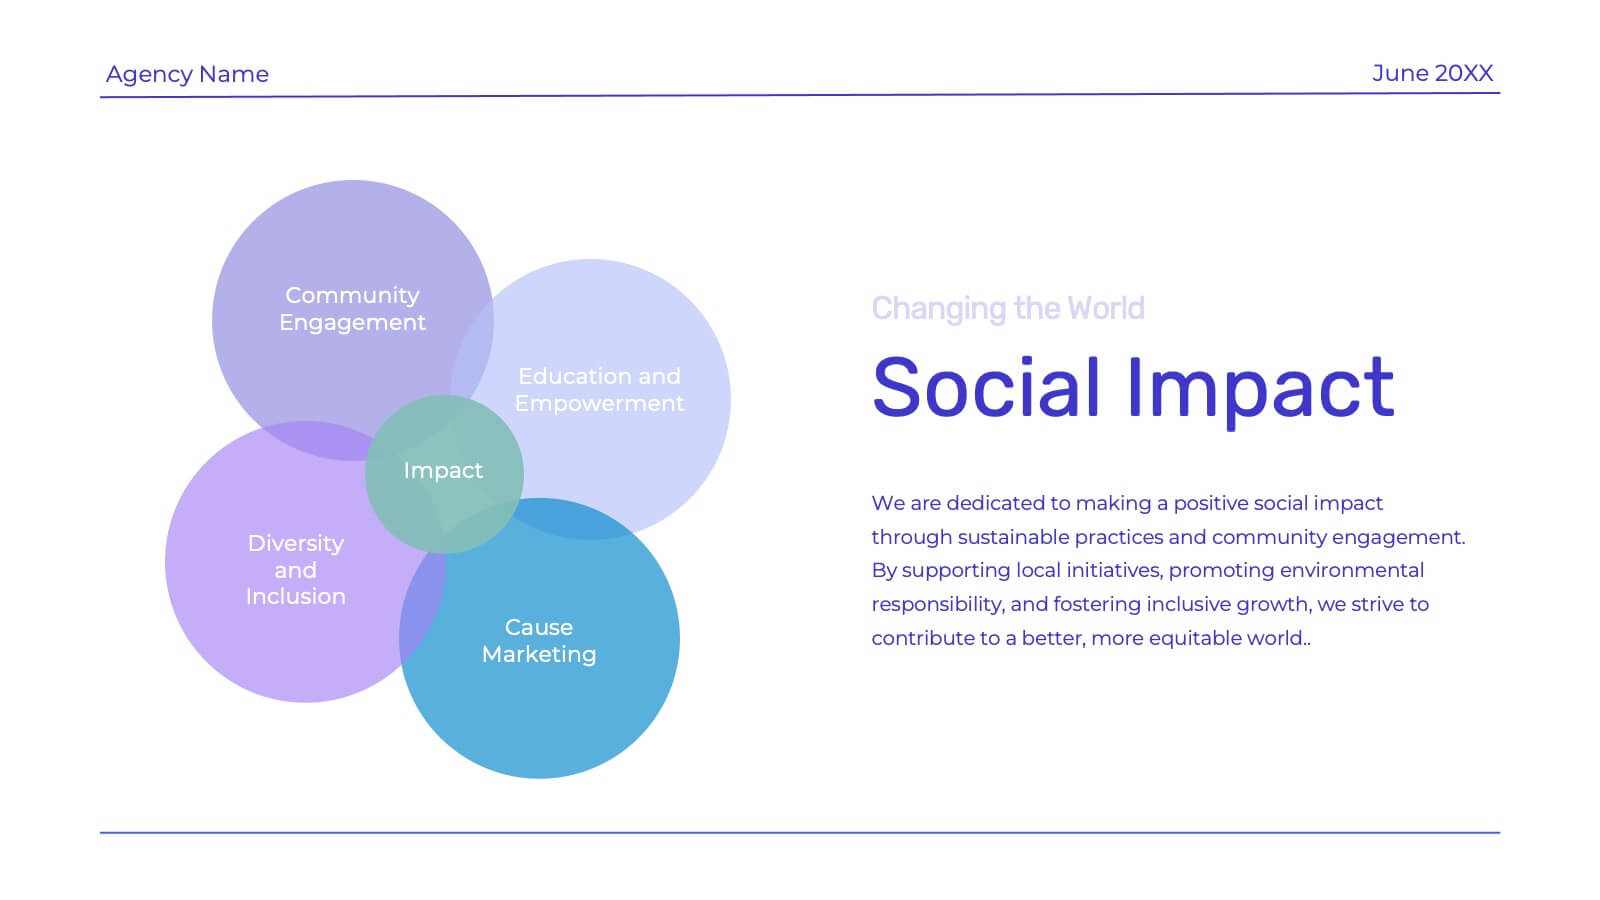
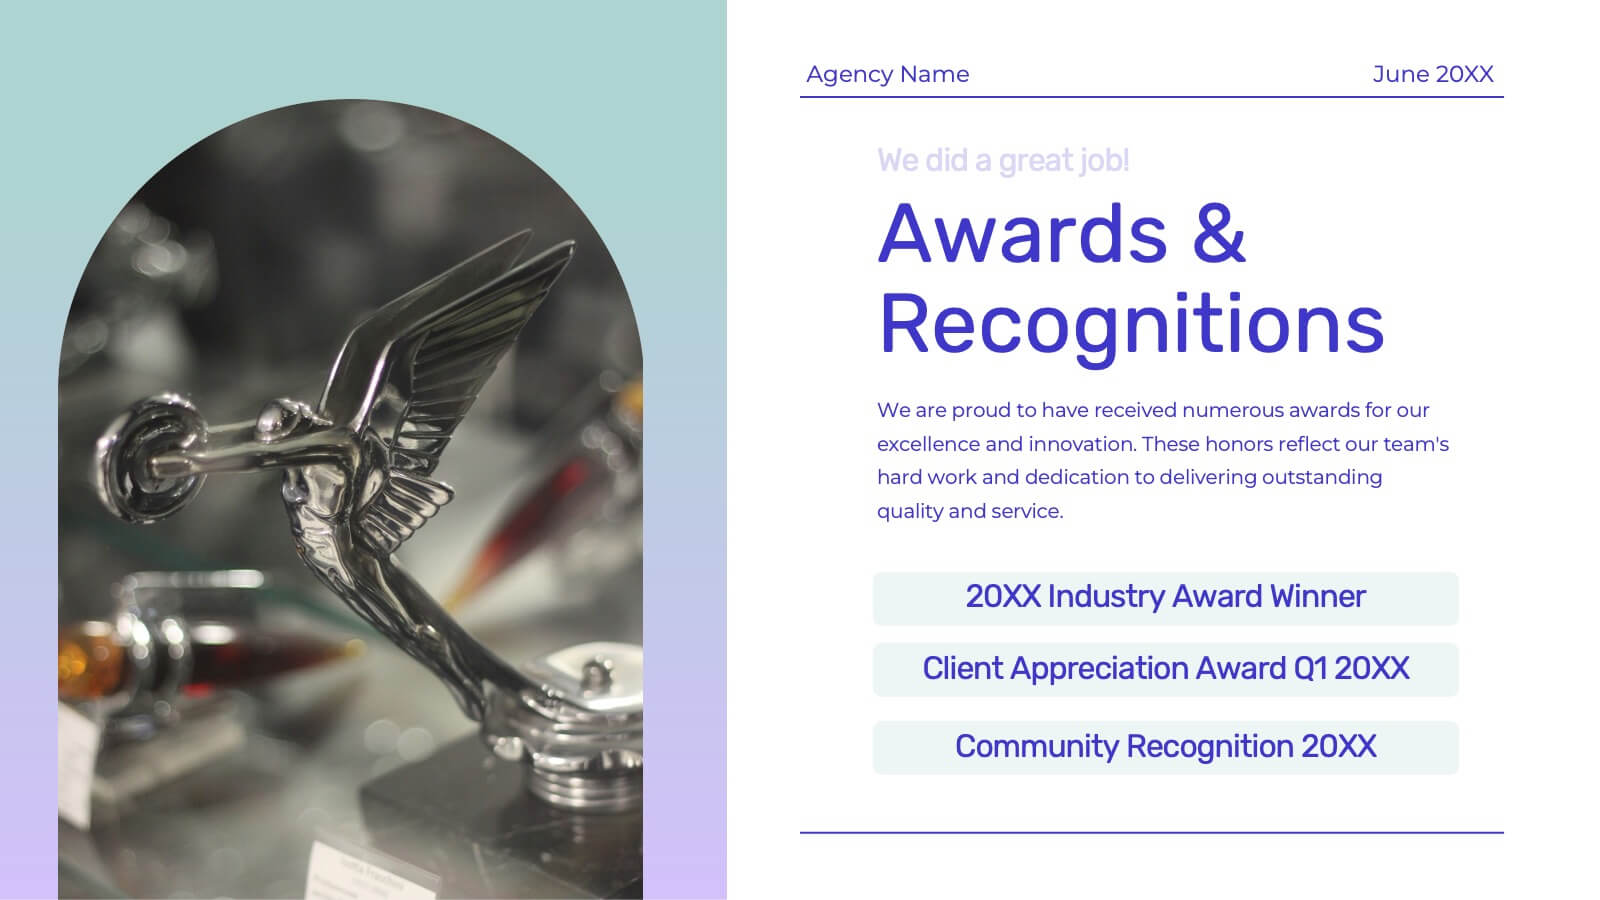
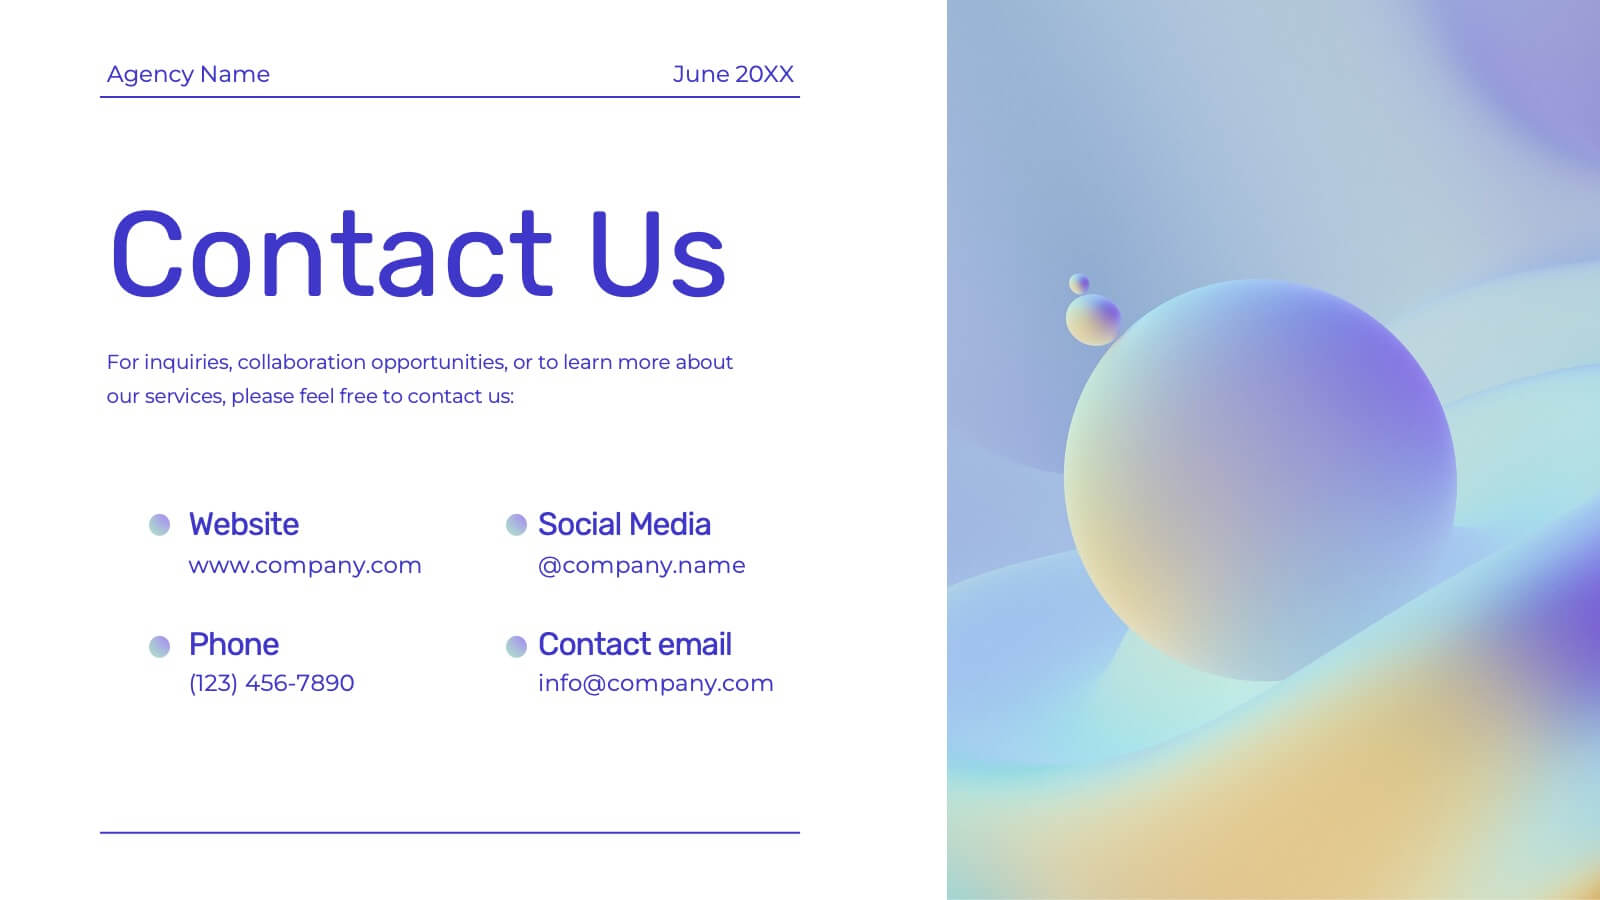
Genesis Creative Agency Pitch Deck Presentation
Showcase your creative agency’s strengths with this vibrant template. Highlight your team, services, success stories, and unique approach. Ideal for case studies, market analysis, and campaign execution. Fully compatible with PowerPoint, Keynote, and Google Slides.


5 slides
Customer Satisfaction Survey Ratings Presentation
Present customer insights with clarity using this Customer Satisfaction Survey Ratings slide. Designed with a vertical timeline beside a thumbs-up icon, it’s perfect for showcasing key survey data, feedback percentages, or sentiment trends. Each rating step includes editable text and color-coded markers for easy comparison. Compatible with PowerPoint, Canva, and Google Slides.


20 slides
Cometis Small Business Pitch Deck Presentation
Introduce your business effectively with this pitch deck template, crafted for small businesses seeking impactful presentations. From company overview to objectives and strategies, this design is tailored to highlight your key messages. Dive into sections such as business highlights, team introductions, and future goals while maintaining a professional flow. This template includes callout slides, break announcements, and customizable placeholders for your brand visuals and content. Ideal for pitching ideas to stakeholders or presenting at workshops, it ensures clarity and engagement. Compatible with PowerPoint, Google Slides, and Keynote, it offers flexibility across platforms.


6 slides
SMART Goals Breakdown Presentation
Bring clarity and momentum to your planning with this clean, easy-to-follow slide that breaks down each step of the SMART framework. It helps audiences understand how goals become actionable through structure and measurement. Perfect for training, strategy, or coaching sessions. Fully compatible with PowerPoint, Keynote, and Google Slides.


5 slides
Product Life Cycle Diagram Presentation
Bring your business insights to life with this dynamic visual layout designed to simplify complex growth stages. Ideal for showcasing product performance, innovation timelines, or strategic planning, it transforms data into a clear, engaging narrative. Fully editable and compatible with PowerPoint, Keynote, and Google Slides for professional use.


14 slides
Business Expense and Cost Control Presentation
Optimize your financial strategy with the Business Expense and Cost Control Presentation template. This slide helps visualize cost management, spending efficiency, and budgeting strategies with a clear, data-driven layout. Ideal for financial planners, business analysts, and executives aiming to streamline operational expenses. Fully customizable in PowerPoint, Keynote, and Google Slides.


7 slides
Medical Group Infographic
introducing our medical group infographic, a seamless blend of clinical precision and informative clarity. Designed predominantly in a calming palette of white and healing green, this infographic effectively encapsulates the diverse facets of a medical group. Through a series of graphics, specialized medical icons, and dedicated image placeholders, one can effortlessly convey intricate medical processes or healthcare strategies. This template is ideally suited for healthcare administrators, medical educators, hospital marketing teams, and anyone striving to present complex medical group data in a simplified, digestible manner.


7 slides
Pillar Points Infographic Presentation
A Pillar Infographic presents information on a specific topic or subject in a clear and organized manner. It consists of several sections or "pillars" that are interconnected and support the overall message of the infographic. In this template each pillar can be used to represent different aspects of the topic being discussed. Each section contains relevant data, statistics, and other information that illustrates the aspect. This can be used in marketing and advertising to promote products or services, as well as in education and journalism to explain complex ideas in a visually appealing way.


5 slides
Project Management Framework
Guide your team through every project phase with this step-by-step framework presentation. Designed with a five-stage visual flow, this layout helps clearly communicate key milestones, tasks, and deliverables. Each stage is color-coded for easy tracking and includes editable text and icons. Perfect for planning, strategy, and agile workflows. Fully compatible with PowerPoint, Keynote, and Google Slides.


24 slides
Momentum Investor Pitch Presentation
The Momentum Pitch Deck is your ultimate tool for propelling your business ideas into action! This vibrant and dynamic template is crafted to captivate your audience and clearly convey your company's vision, strategy, and growth potential. Start with an engaging overview, followed by a problem statement that pinpoints the core challenges your solution addresses. Use the market opportunity and competitive landscape slides to showcase the potential for success. The business model canvas and unique selling proposition sections help illustrate how your business stands out from the competition. Highlight your revenue model, marketing strategy, and sales approach to show your path to profitability. Additionally, the template includes sections for technology and innovation, team introduction, and risk analysis, ensuring a comprehensive presentation. Whether you're pitching to investors or stakeholders, this template is fully compatible with PowerPoint, Keynote, and Google Slides, making it the perfect choice for any pitch deck.


5 slides
Future of 5G Technology Infographics
Embrace the telecommunications revolution with the future of 5G technology infographics template. This vibrant, creatively styled vertical layout is designed to captivate and educate, making it an ideal companion for tech enthusiasts and educators alike. The template, adorned in a dynamic spectrum of purple, orange, blue, and green, simplifies the complex narrative of 5G evolution. Compatible with Powerpoint, Keynote, and Google Slides. It features intuitive graphics, engaging icons, and image placeholders, all to highlight 5G's possibilities and its impact on global connectivity. It's the perfect medium for illustrating the sophisticated architecture.


8 slides
Geographic Data for Europe Slide Presentation
Visualize key regional data clearly with the Geographic Data for Europe Slide Presentation. This editable map layout highlights specific European countries alongside icon-based text boxes, perfect for presenting statistics, demographics, or business metrics. Use color-coded markers to tell a geographic story with visual clarity. Compatible with PowerPoint, Keynote, Google Slides, and Canva.


4 slides
Human-Centered Design Thinking Strategy Presentation
Put people at the heart of your process with this Human-Centered Design Thinking Strategy Presentation. Ideal for visualizing empathy-driven innovation, this template allows you to clearly present two key perspectives or user segments using stylized silhouette graphics and percentage breakdowns. Great for product development pitches, UX design reviews, or customer journey storytelling. Compatible with PowerPoint, Keynote, and Google Slides.


7 slides
Survey Results Infographic Presentation Template
Your survey results are the most important part of the research process. Now you can present your findings to colleagues and clients in a professional and impactful way with this survey results template. This infographic design allows you to organize your results with ease. Designed to help you easily transform your survey results into an eye-catching, professional presentation. It includes everything a successful presentation needs with standard shapes and text boxes that are easy to customize. This is a great starter template for anyone looking to create an impressive report in minutes.


5 slides
Contracts and Law Capacity Infographics
In the context of contracts and law, "capacity" refers to a person's legal ability to enter into a contract and be bound by its terms. These colorful infographics are designed to simplify the complex concepts of contracts and law capacity for the audience. This infographic template aims to provide essential information about the legal aspects of contracts and the concept of capacity in a visually appealing manner. This section provides a clear definition of contracts and highlights the essential elements. The template incorporates engaging infographics, icons, and illustrations to visualize key concepts and make the information more memorable.