


Features
- 7 Unique slides
- Fully editable and easy to edit in Microsoft Powerpoint, Keynote and Google Slides
- 16:9 widescreen layout
- Clean and professional designs
- Export to JPG, PDF or send by email


Do you have any questions?
Recommend


10 slides
Business Relationship Management Presentation
Navigate the nuances of professional partnerships with the "Business Relationship Management" presentation templates. These layouts offer a structured approach to delineating the roles and interactions within business relationships, making them an essential tool for managers and team leaders. Designed to be compatible with PowerPoint, Keynote, and Google Slides, these templates provide a clear pathway for discussing and managing business relationships effectively.


21 slides
Vibrant Startup Pitch Deck Presentation
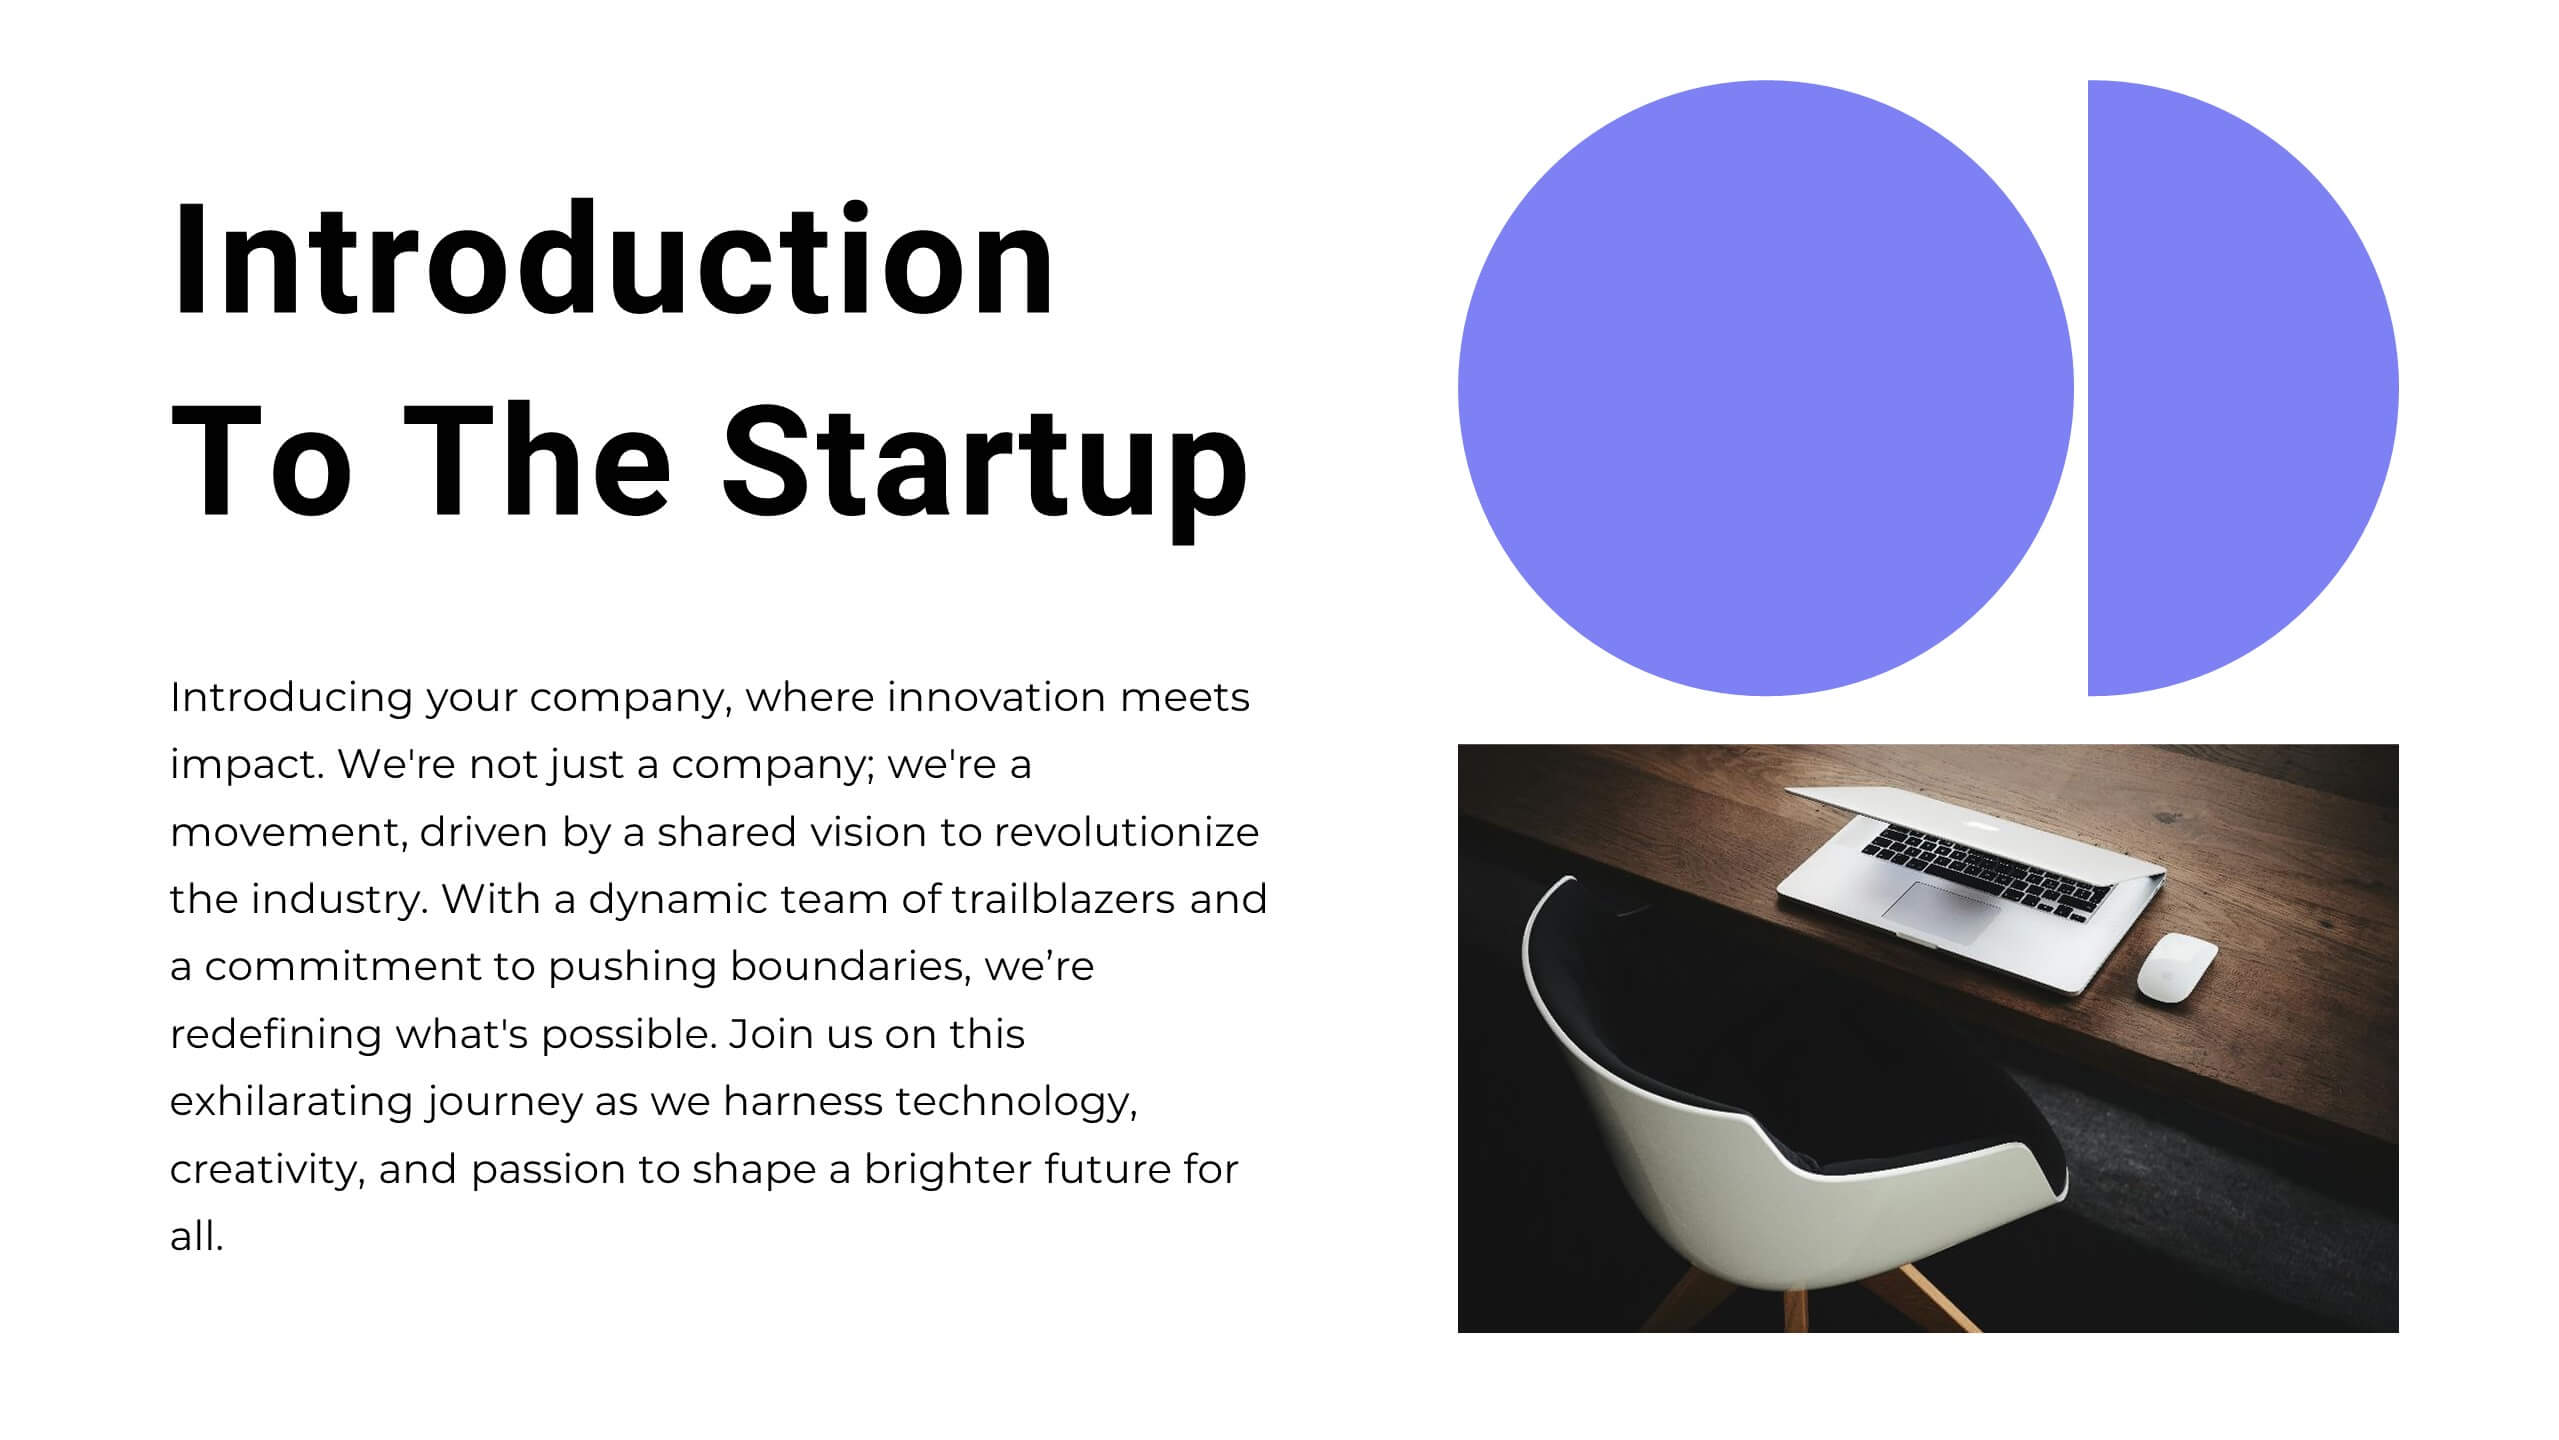
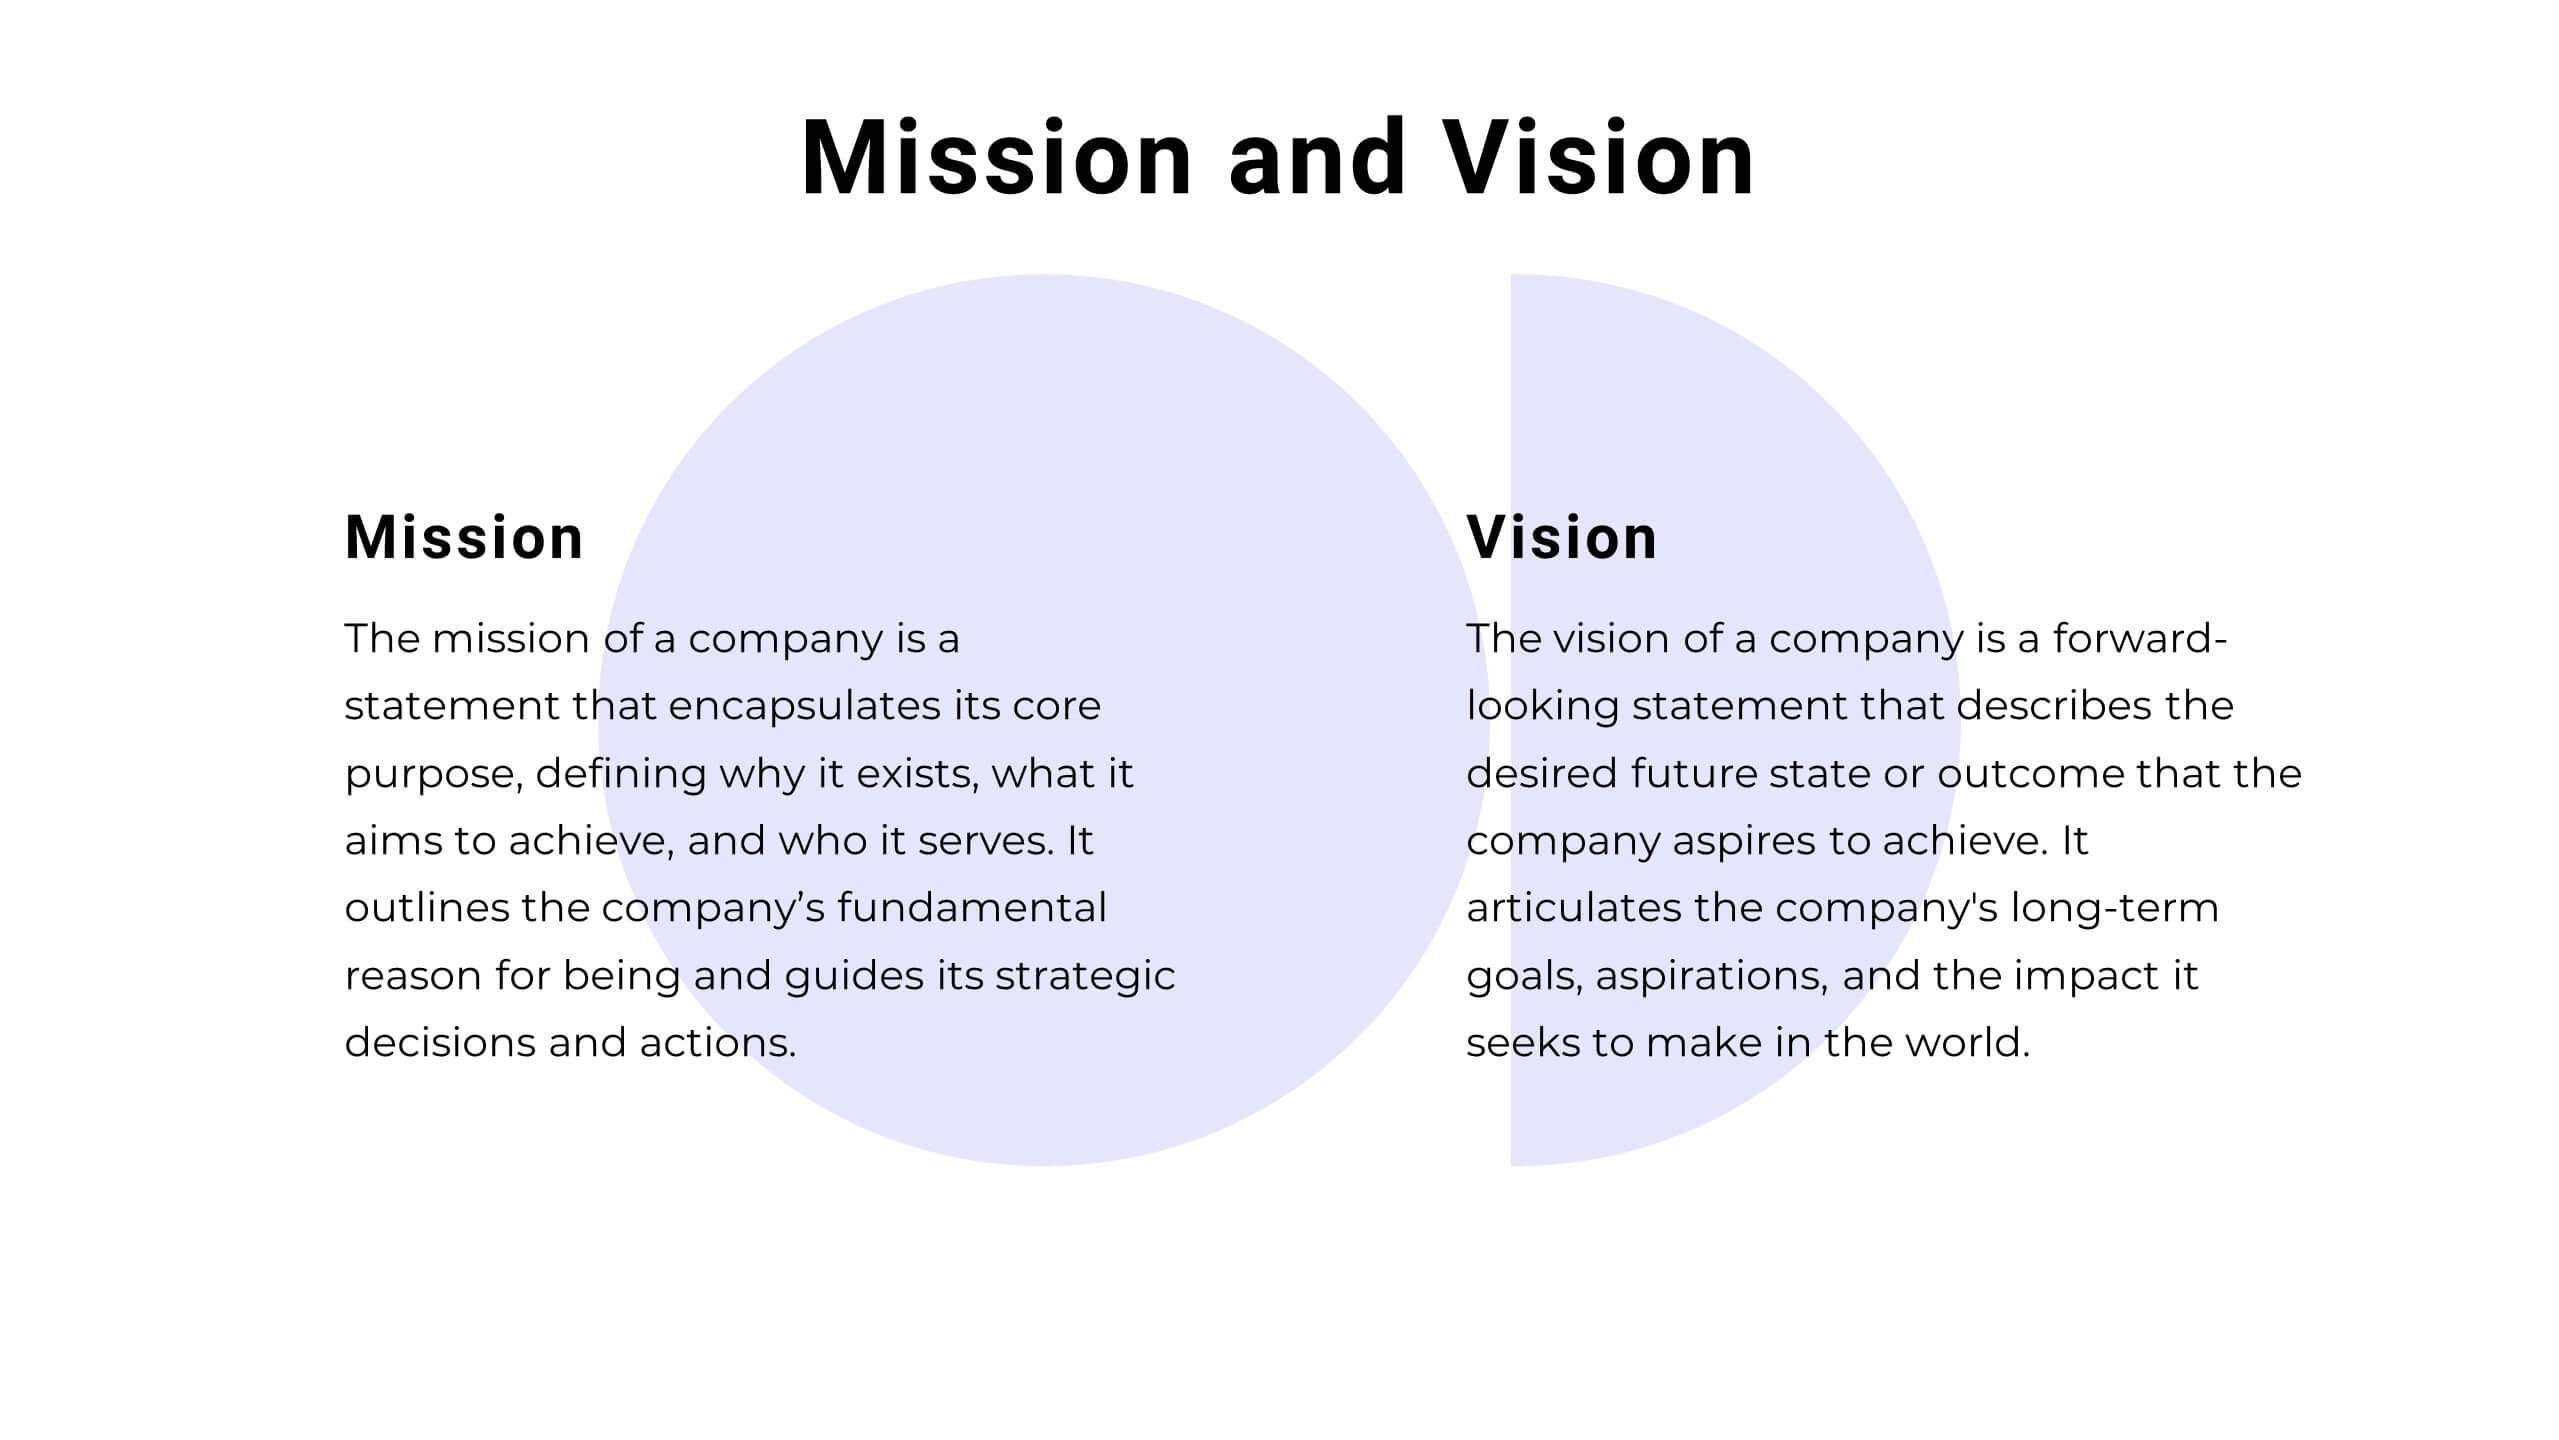
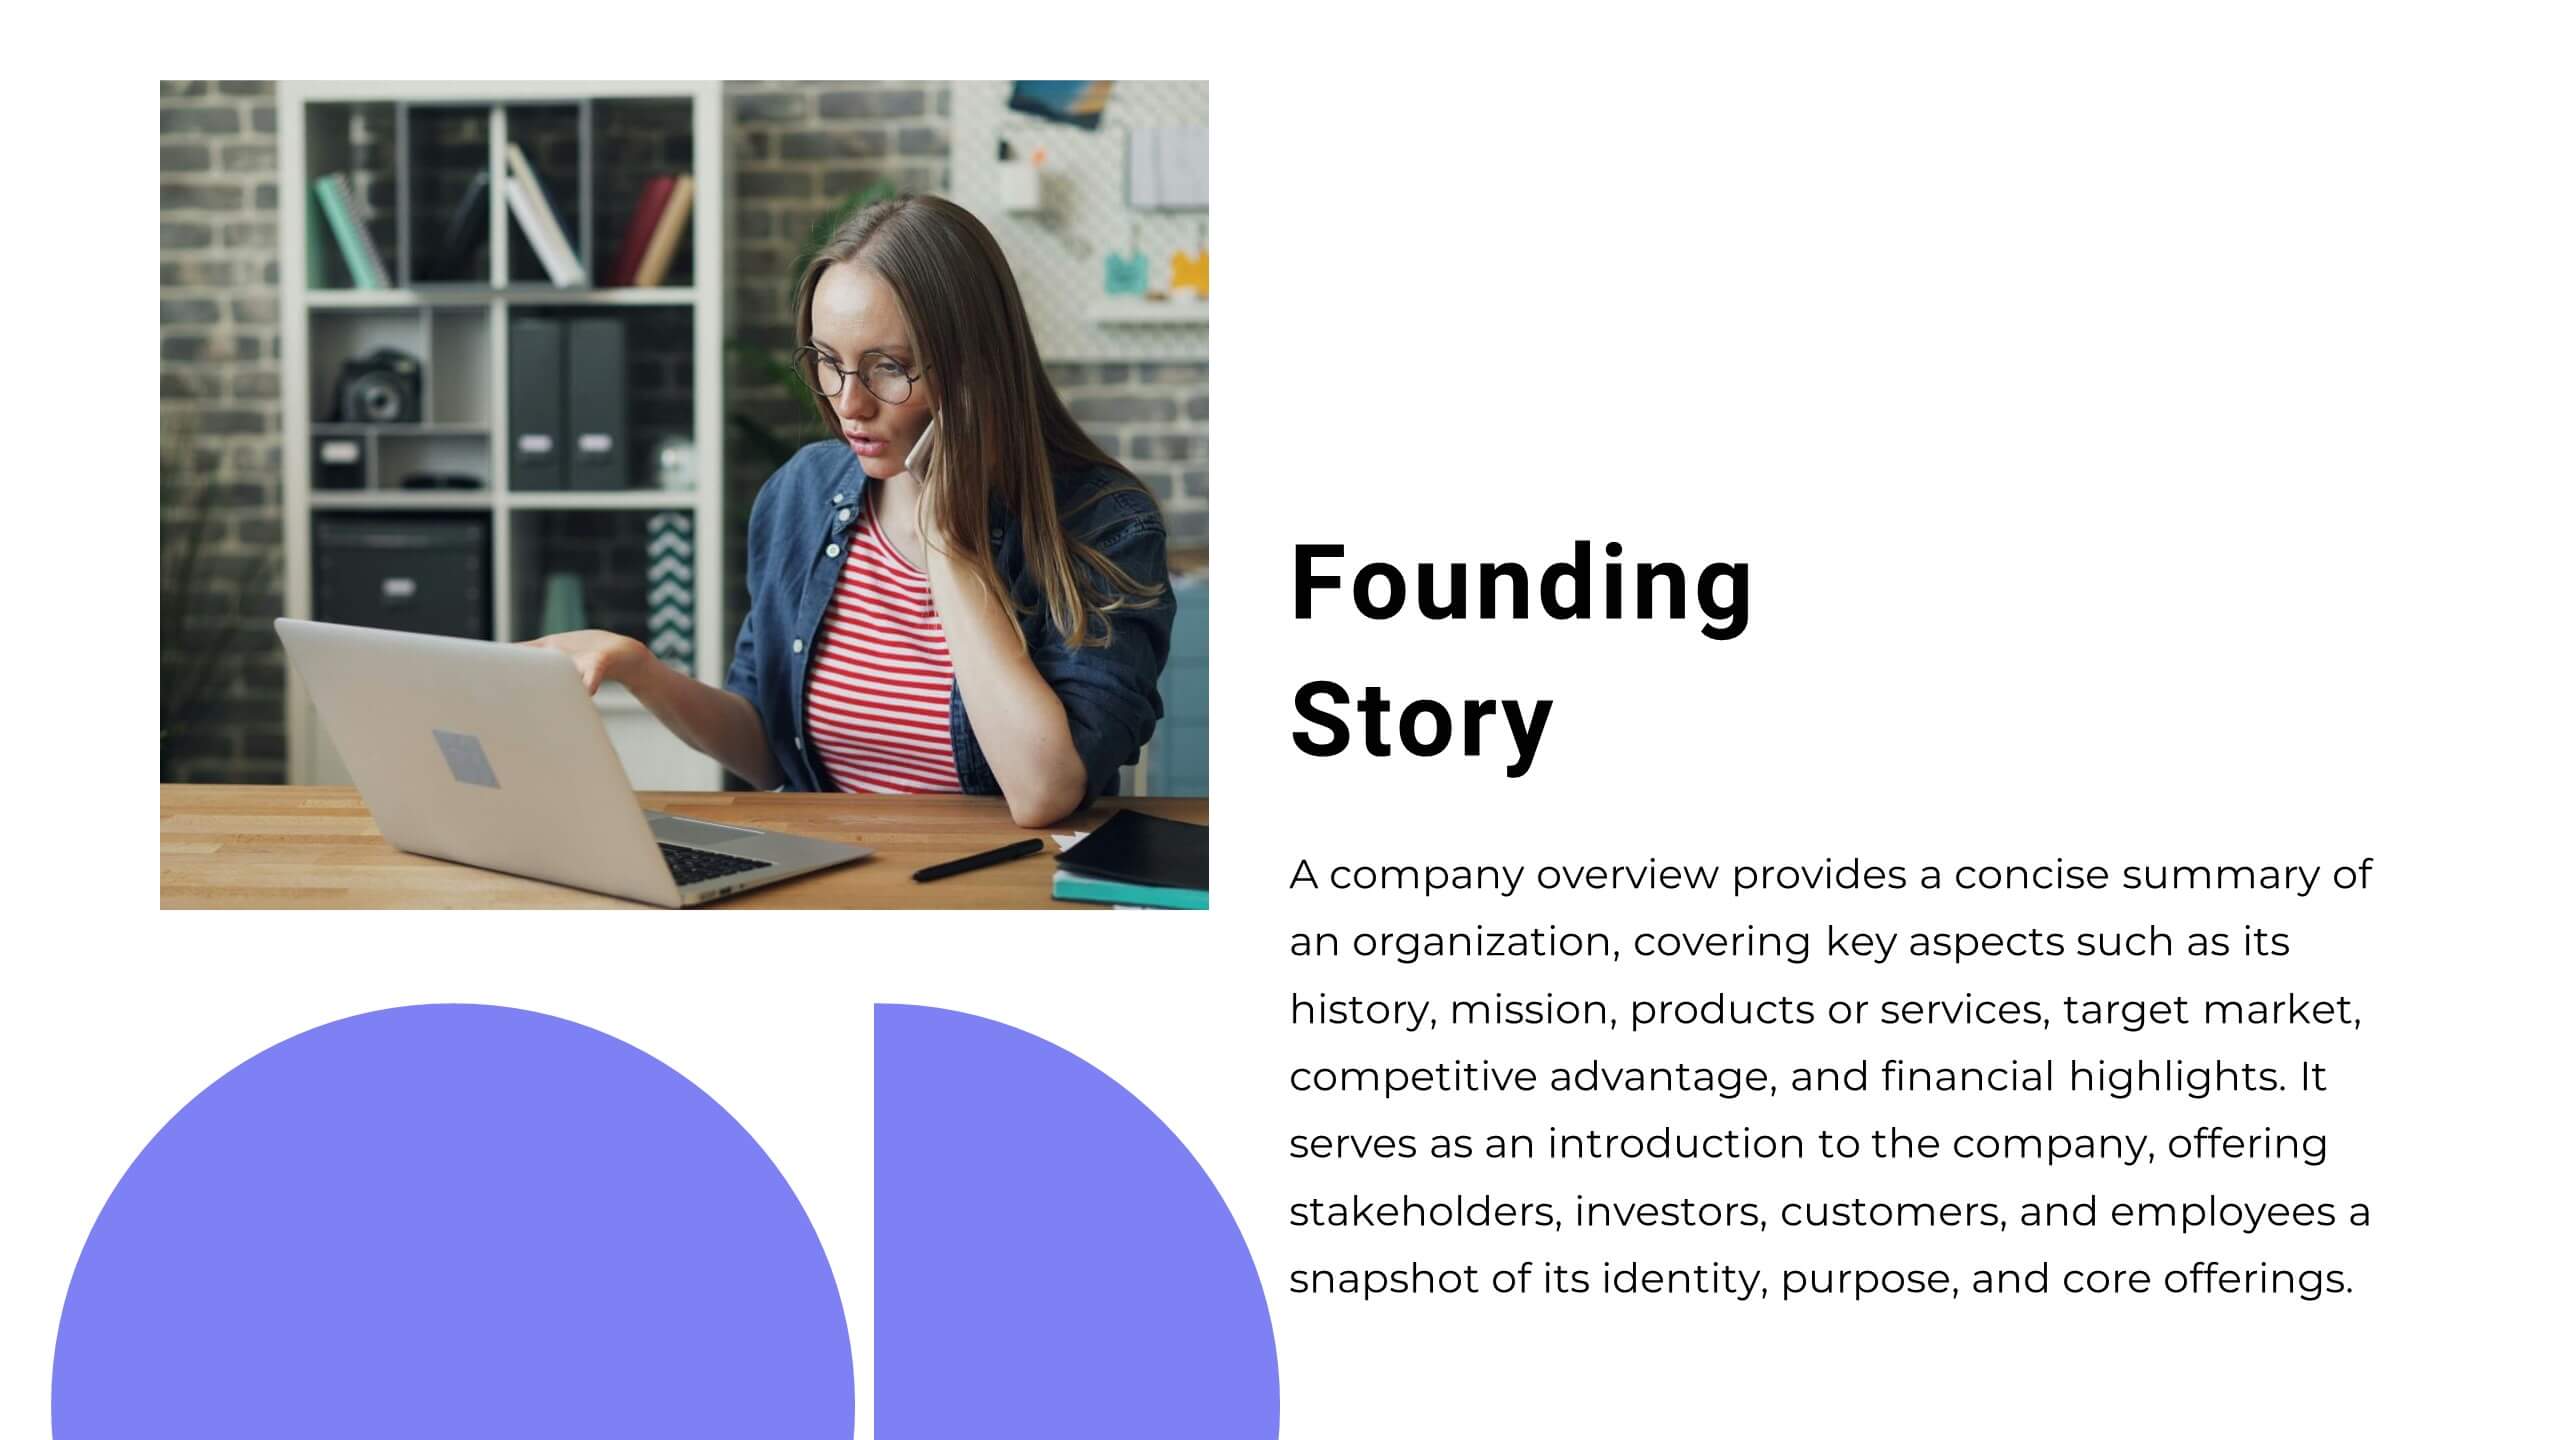
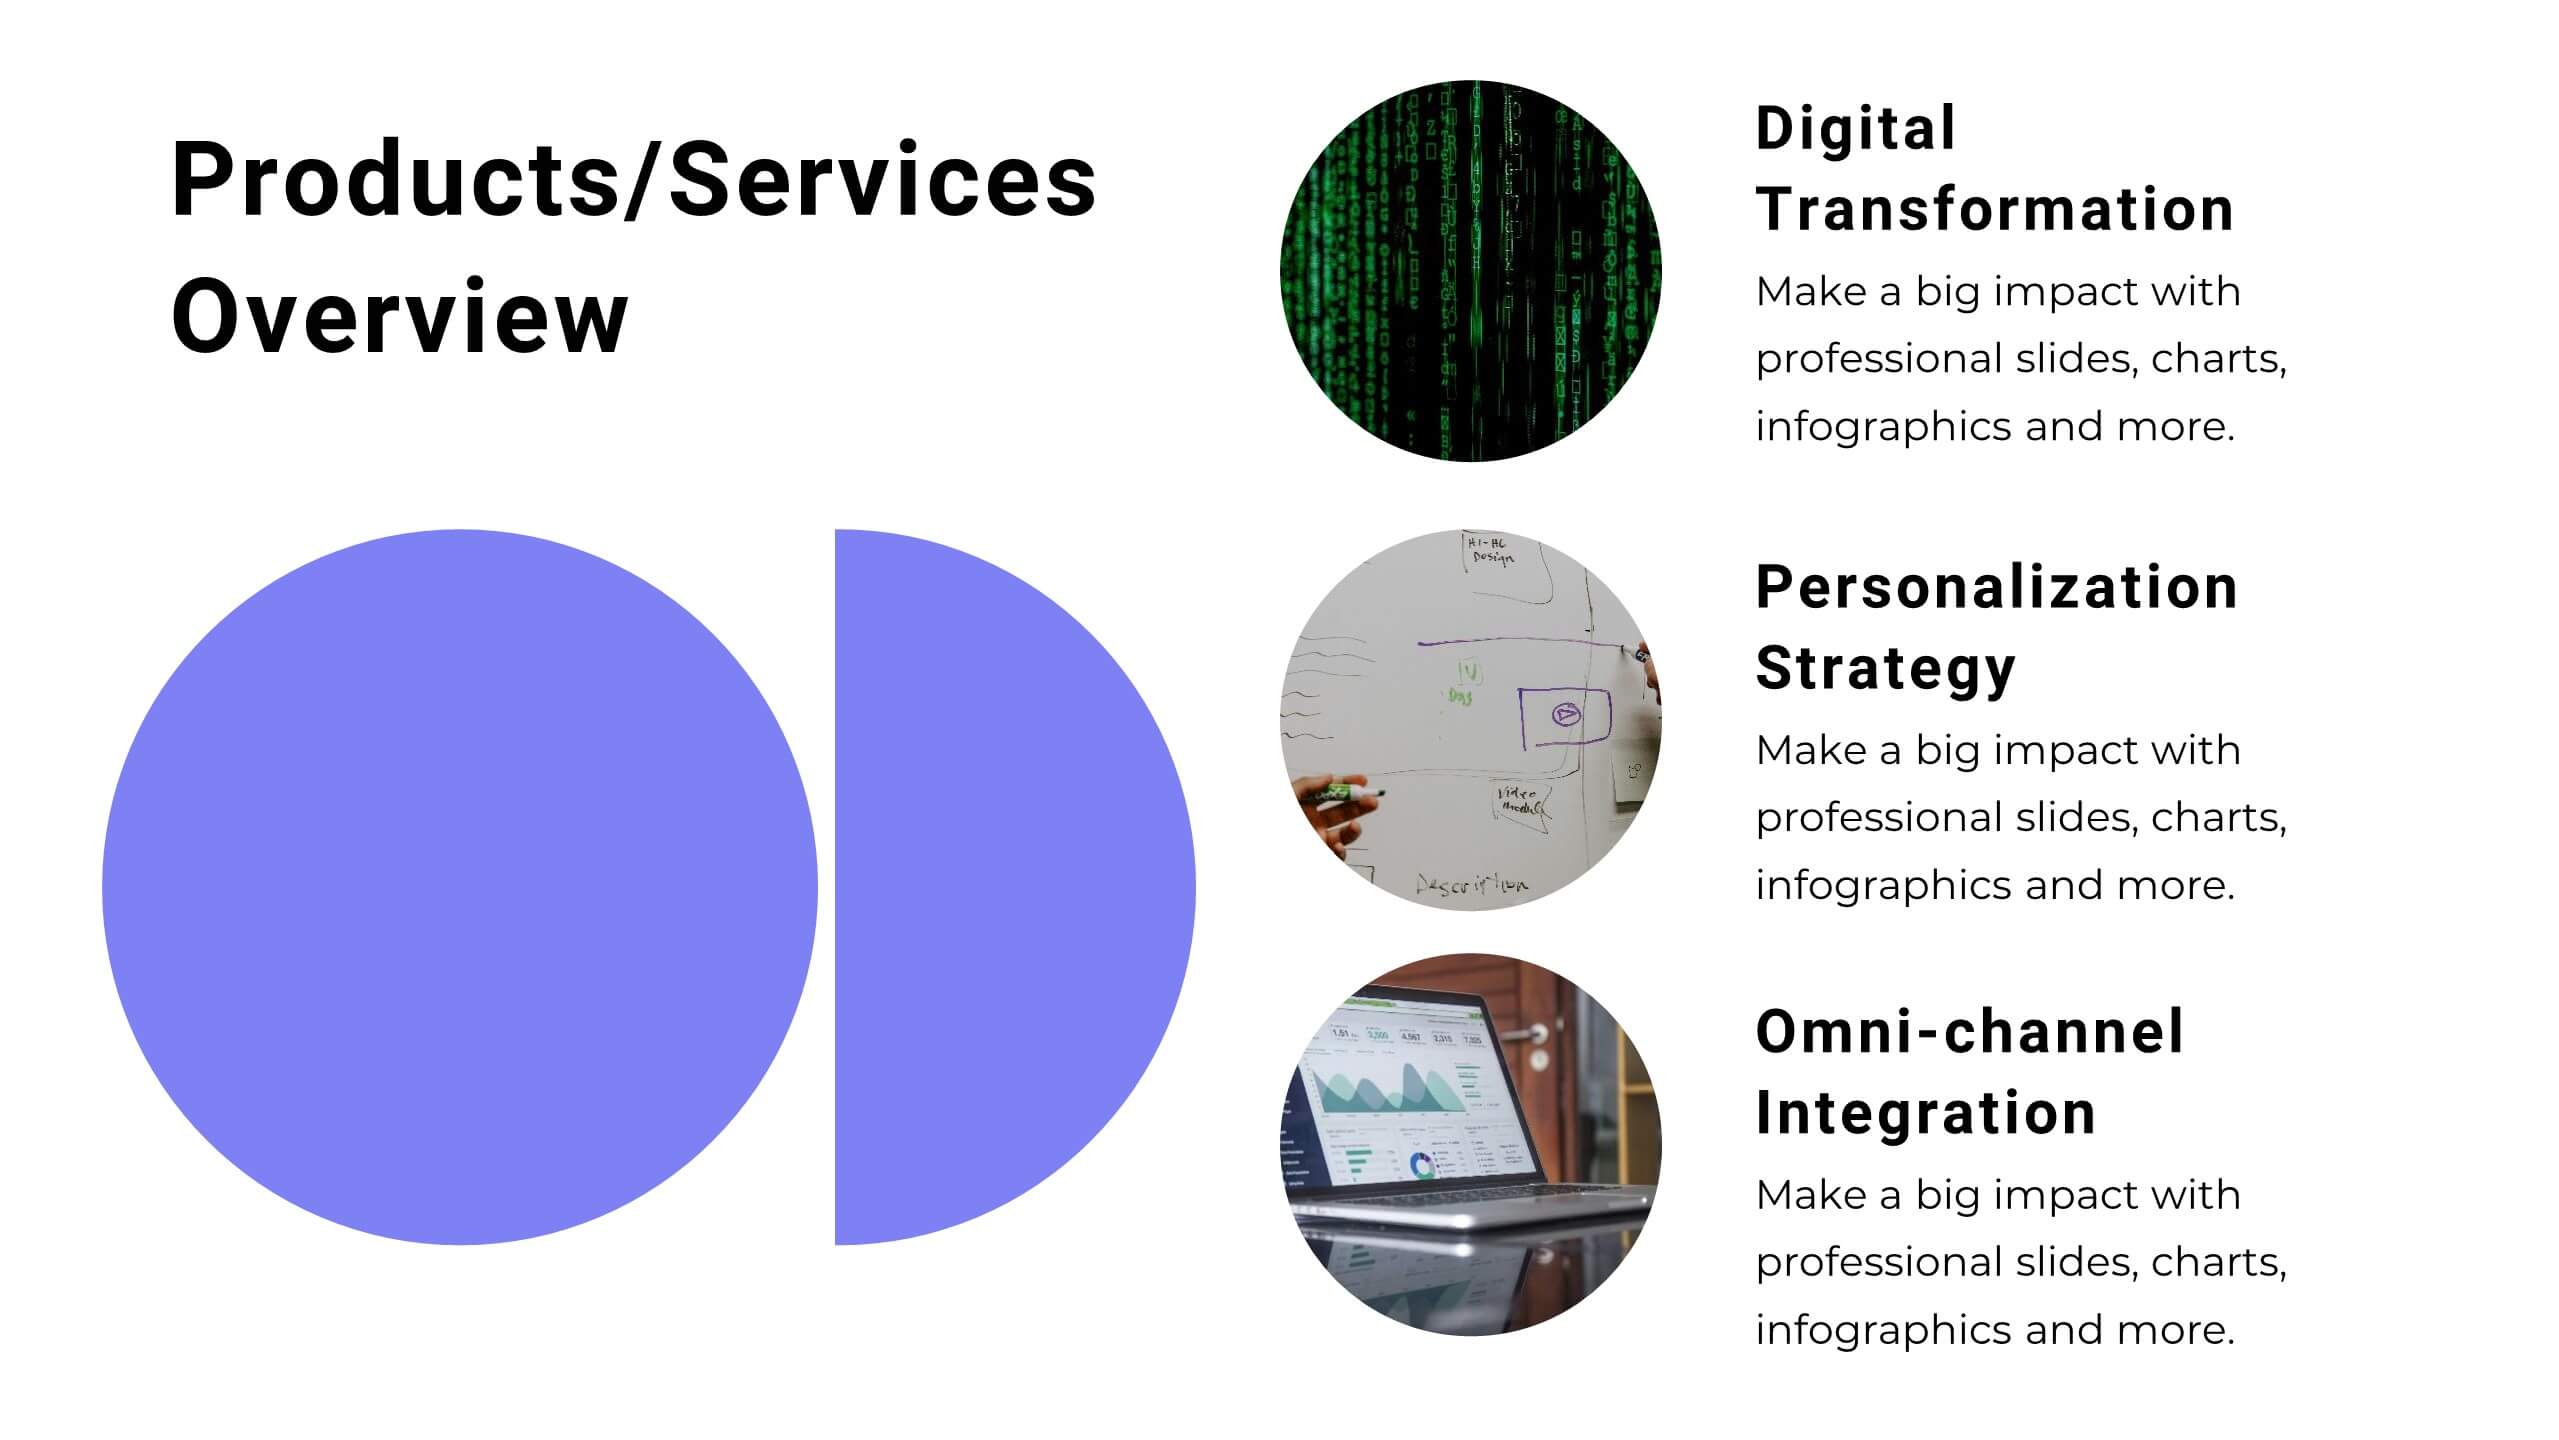
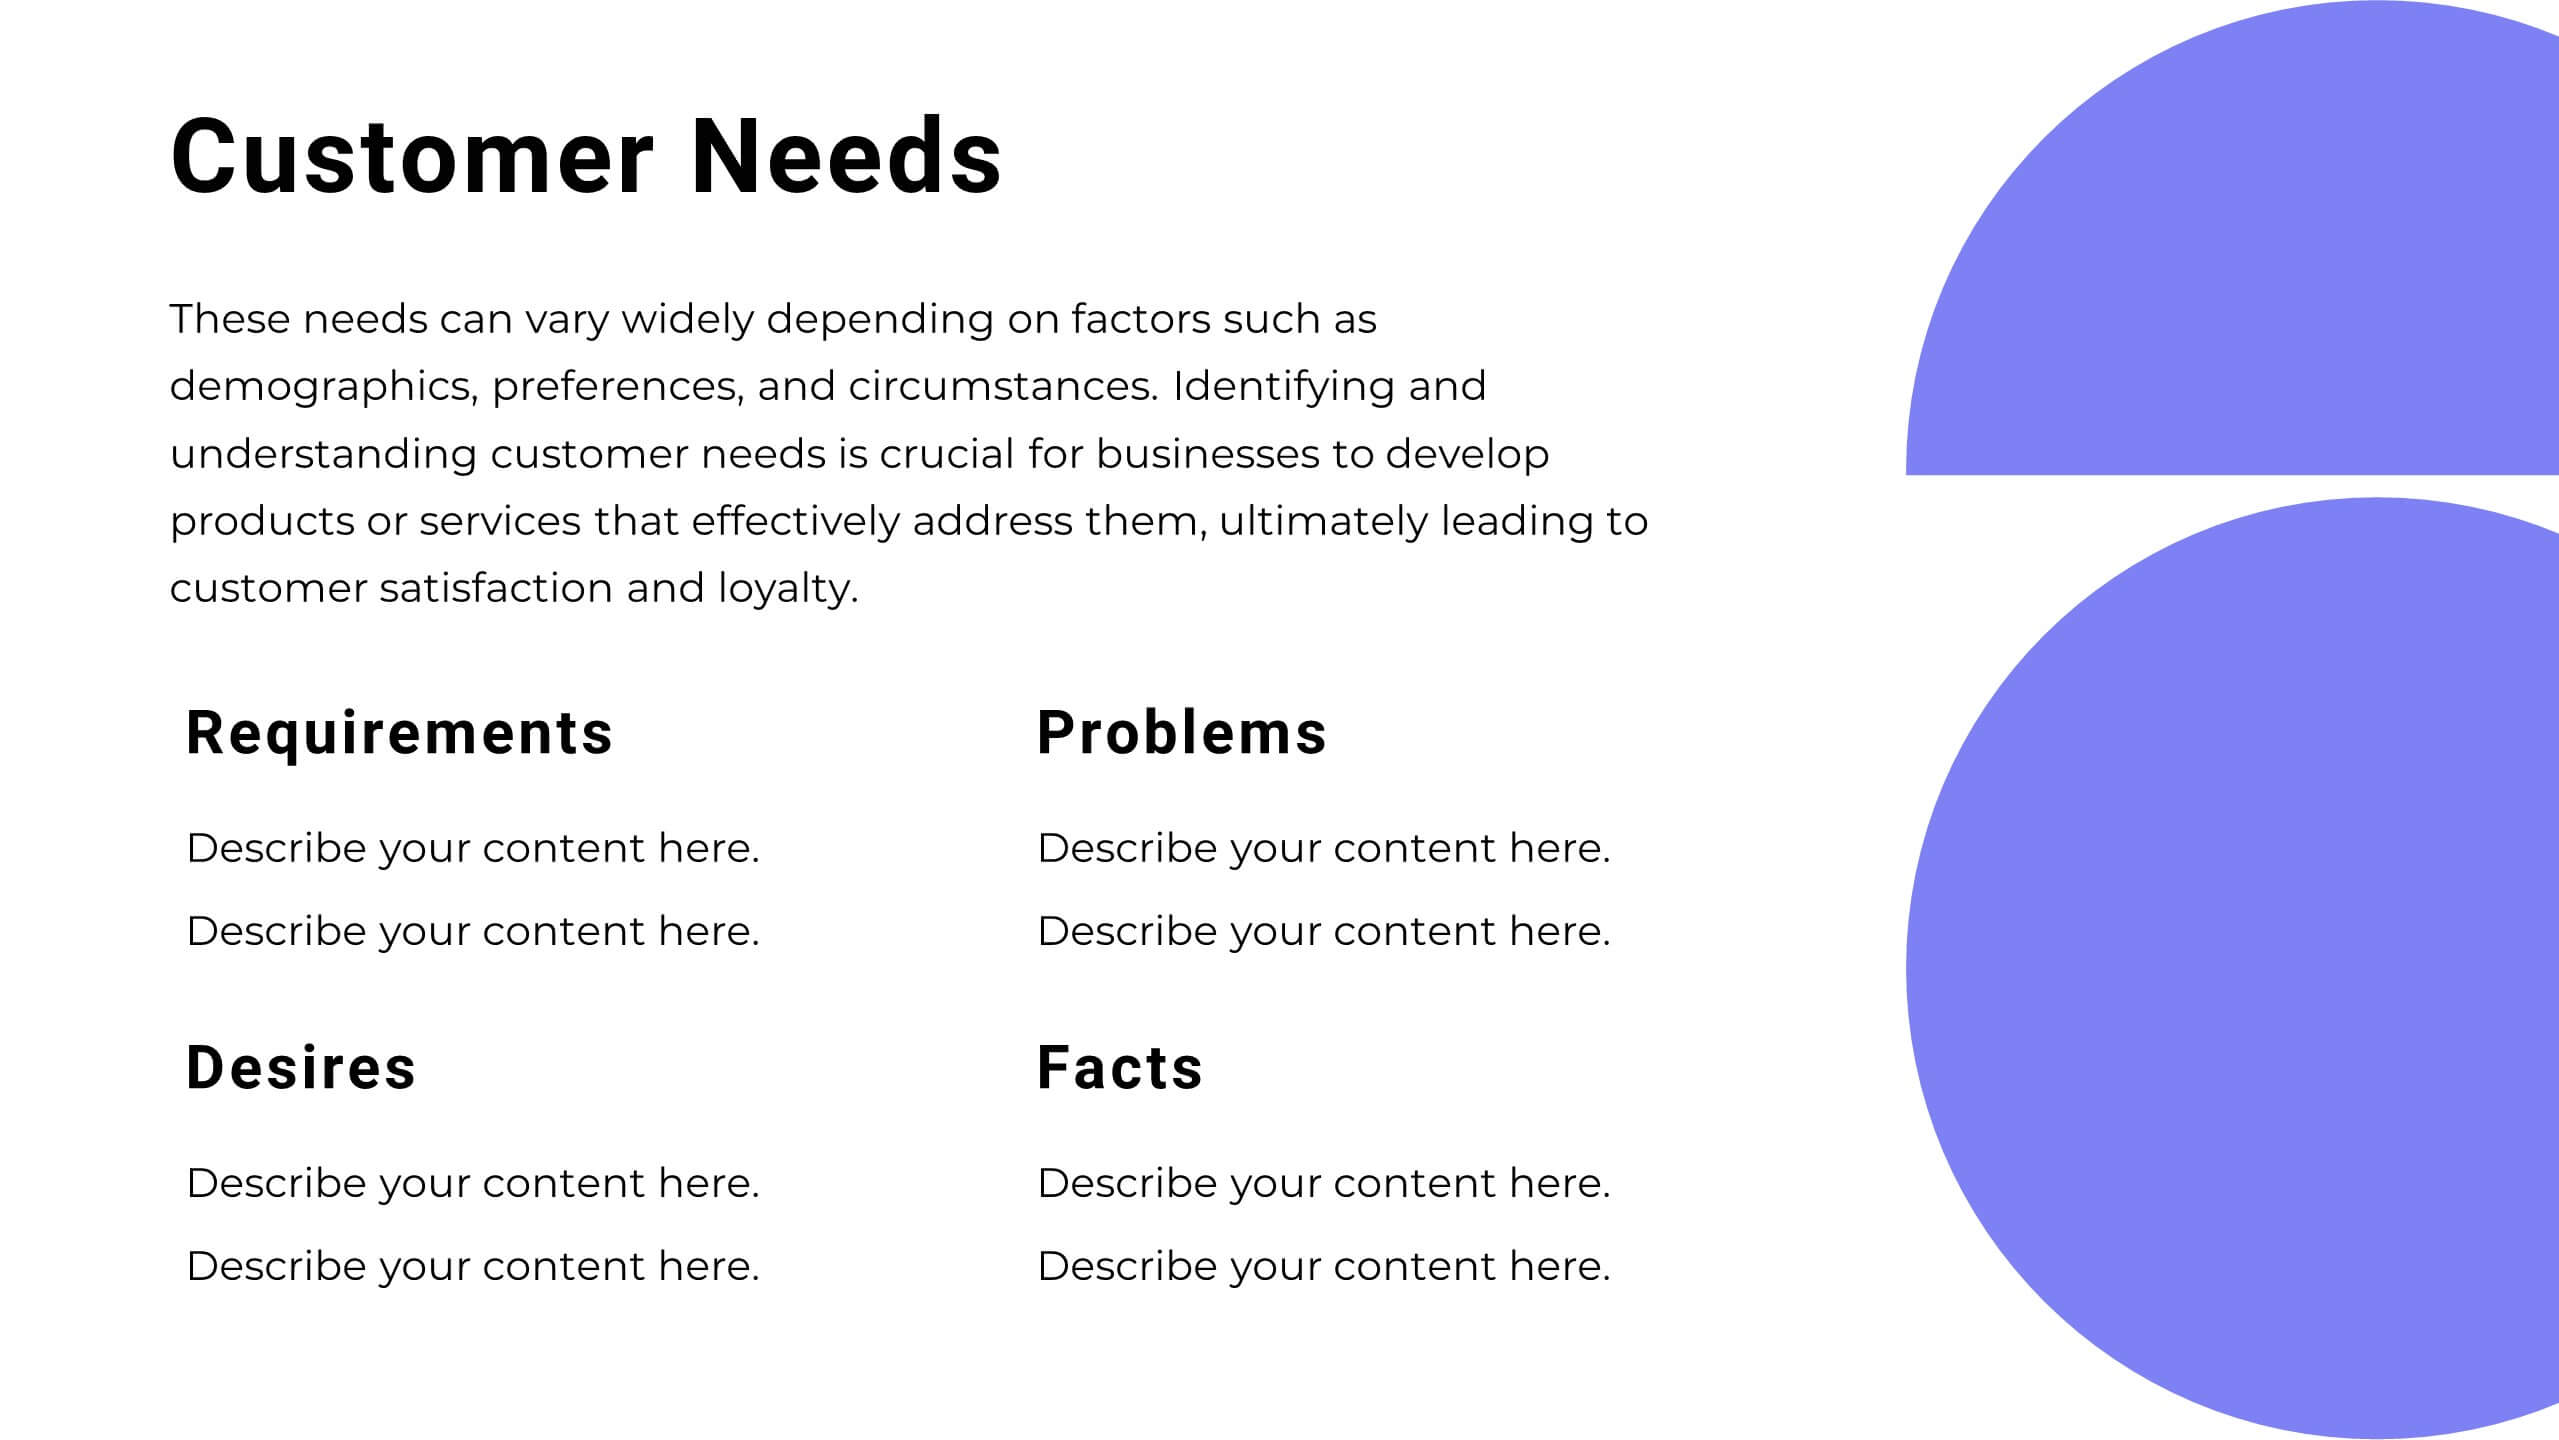
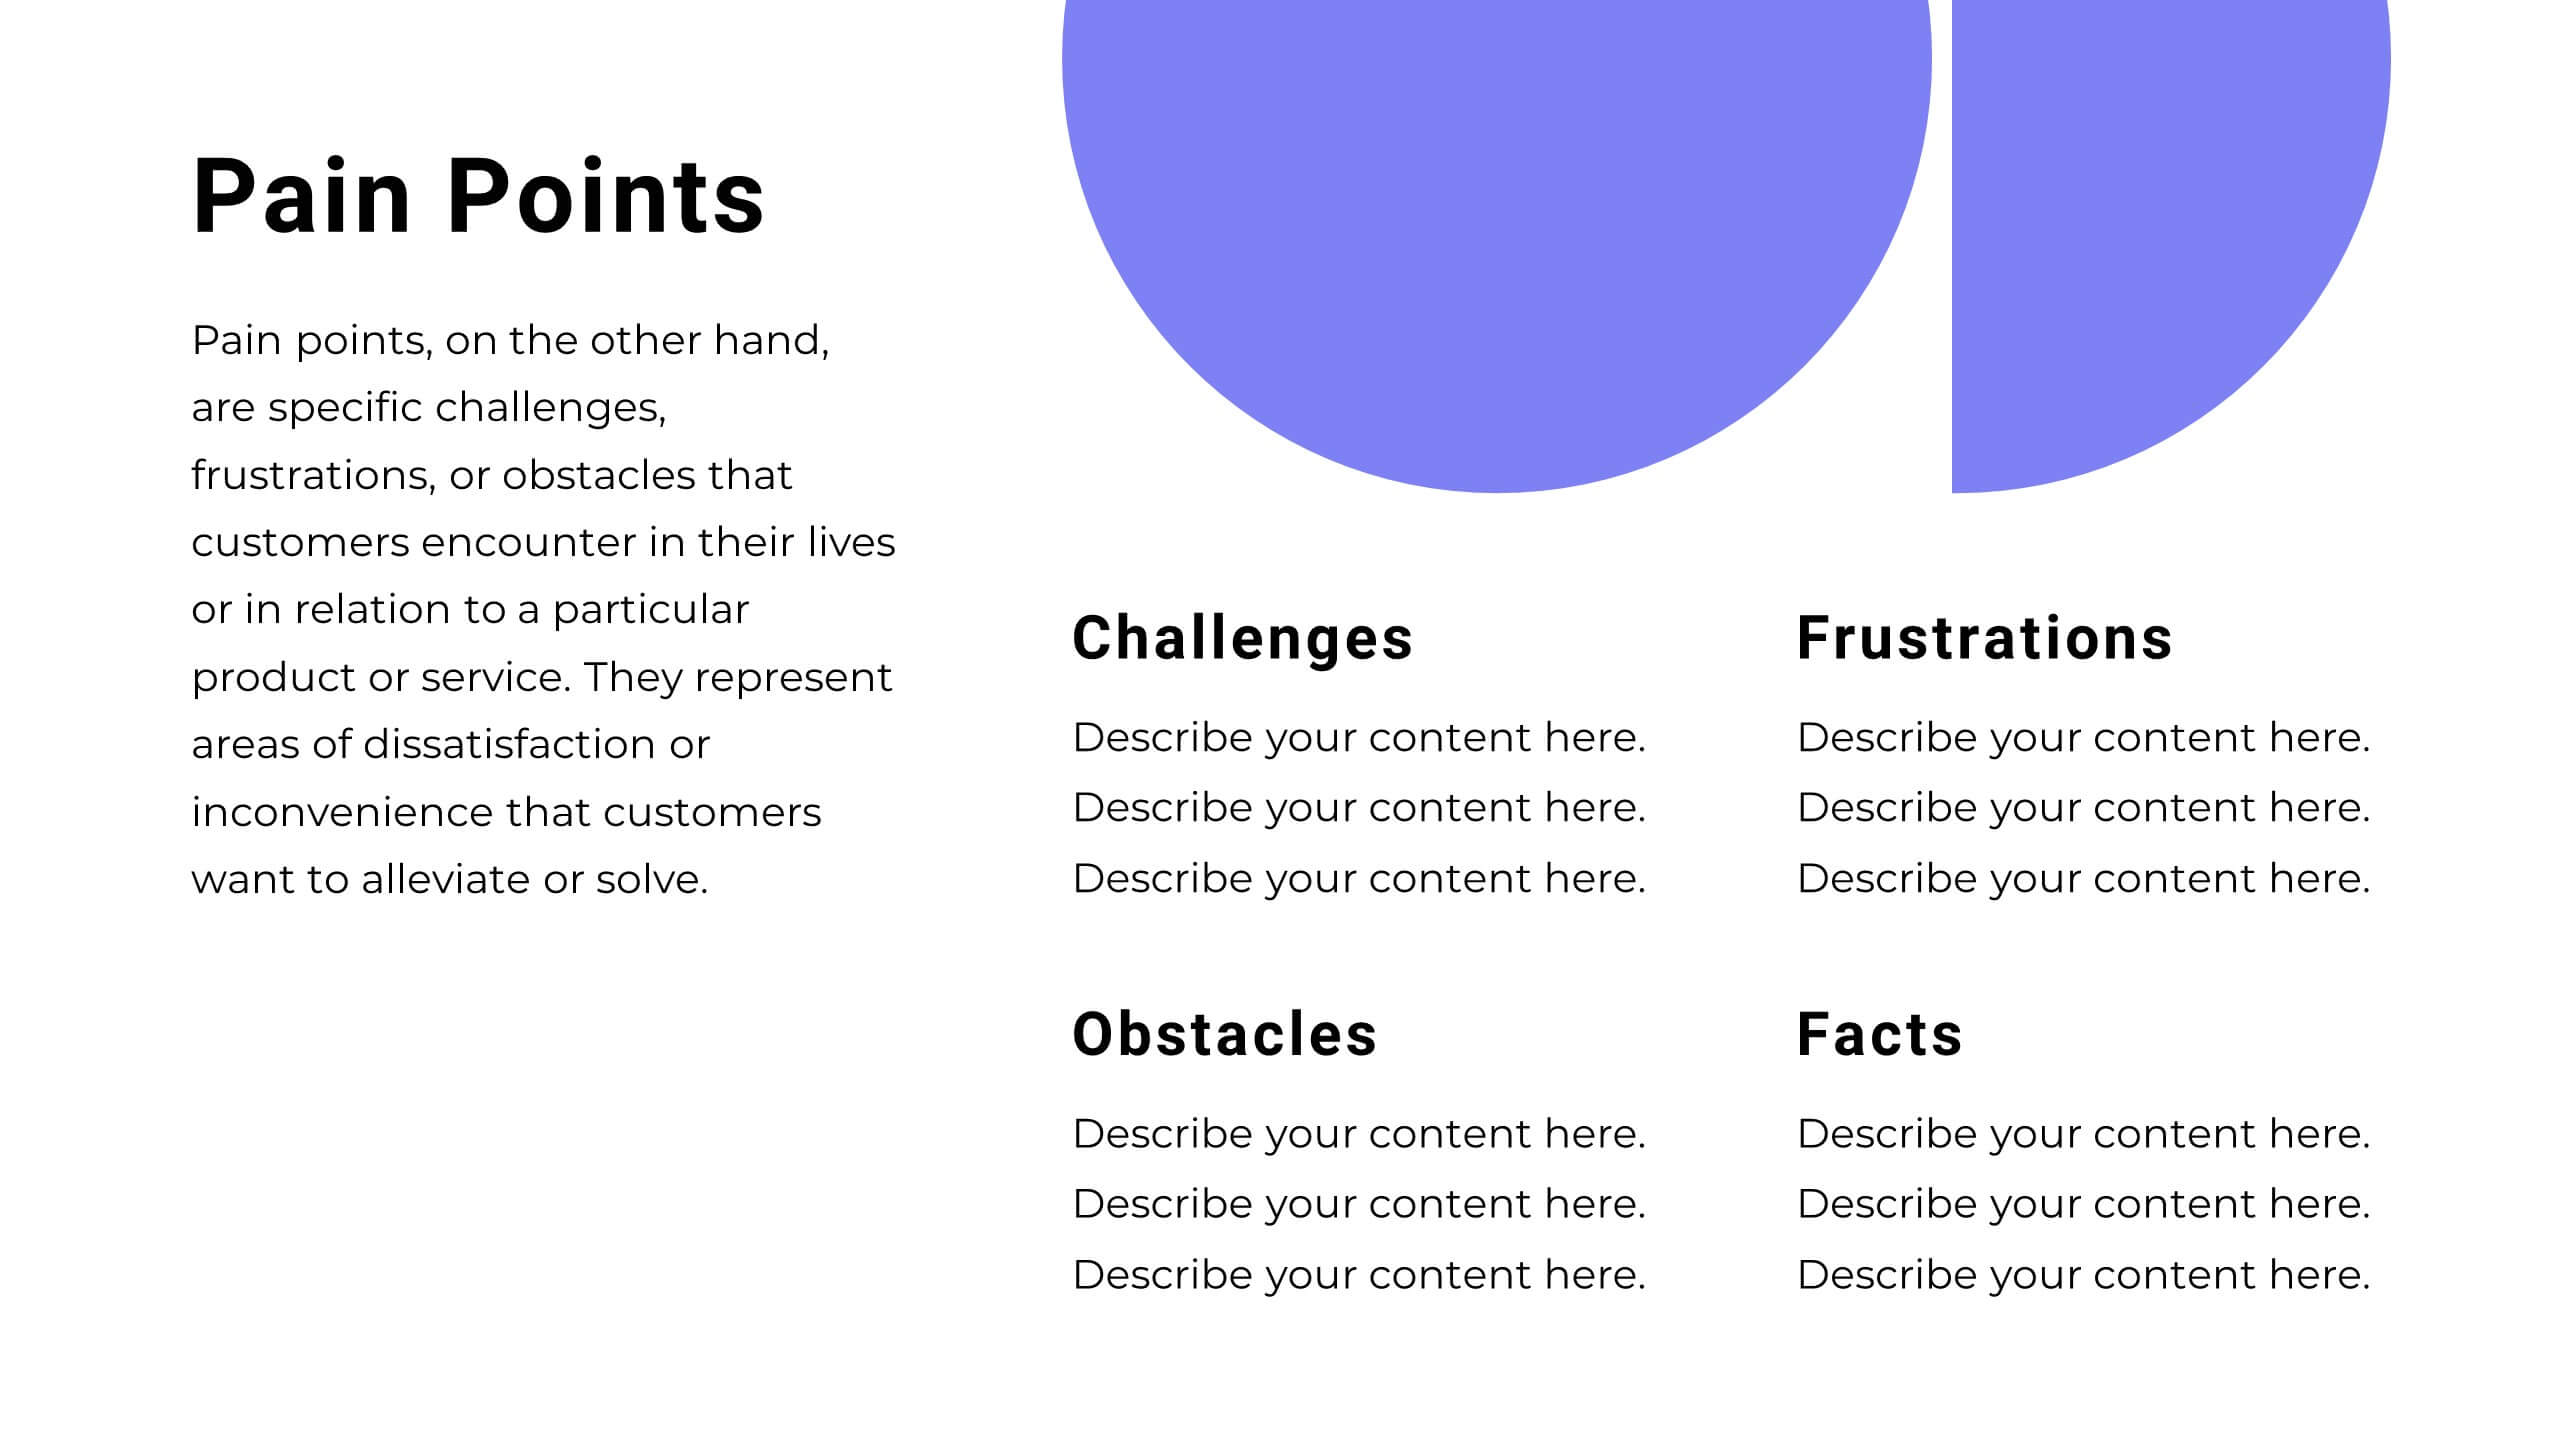
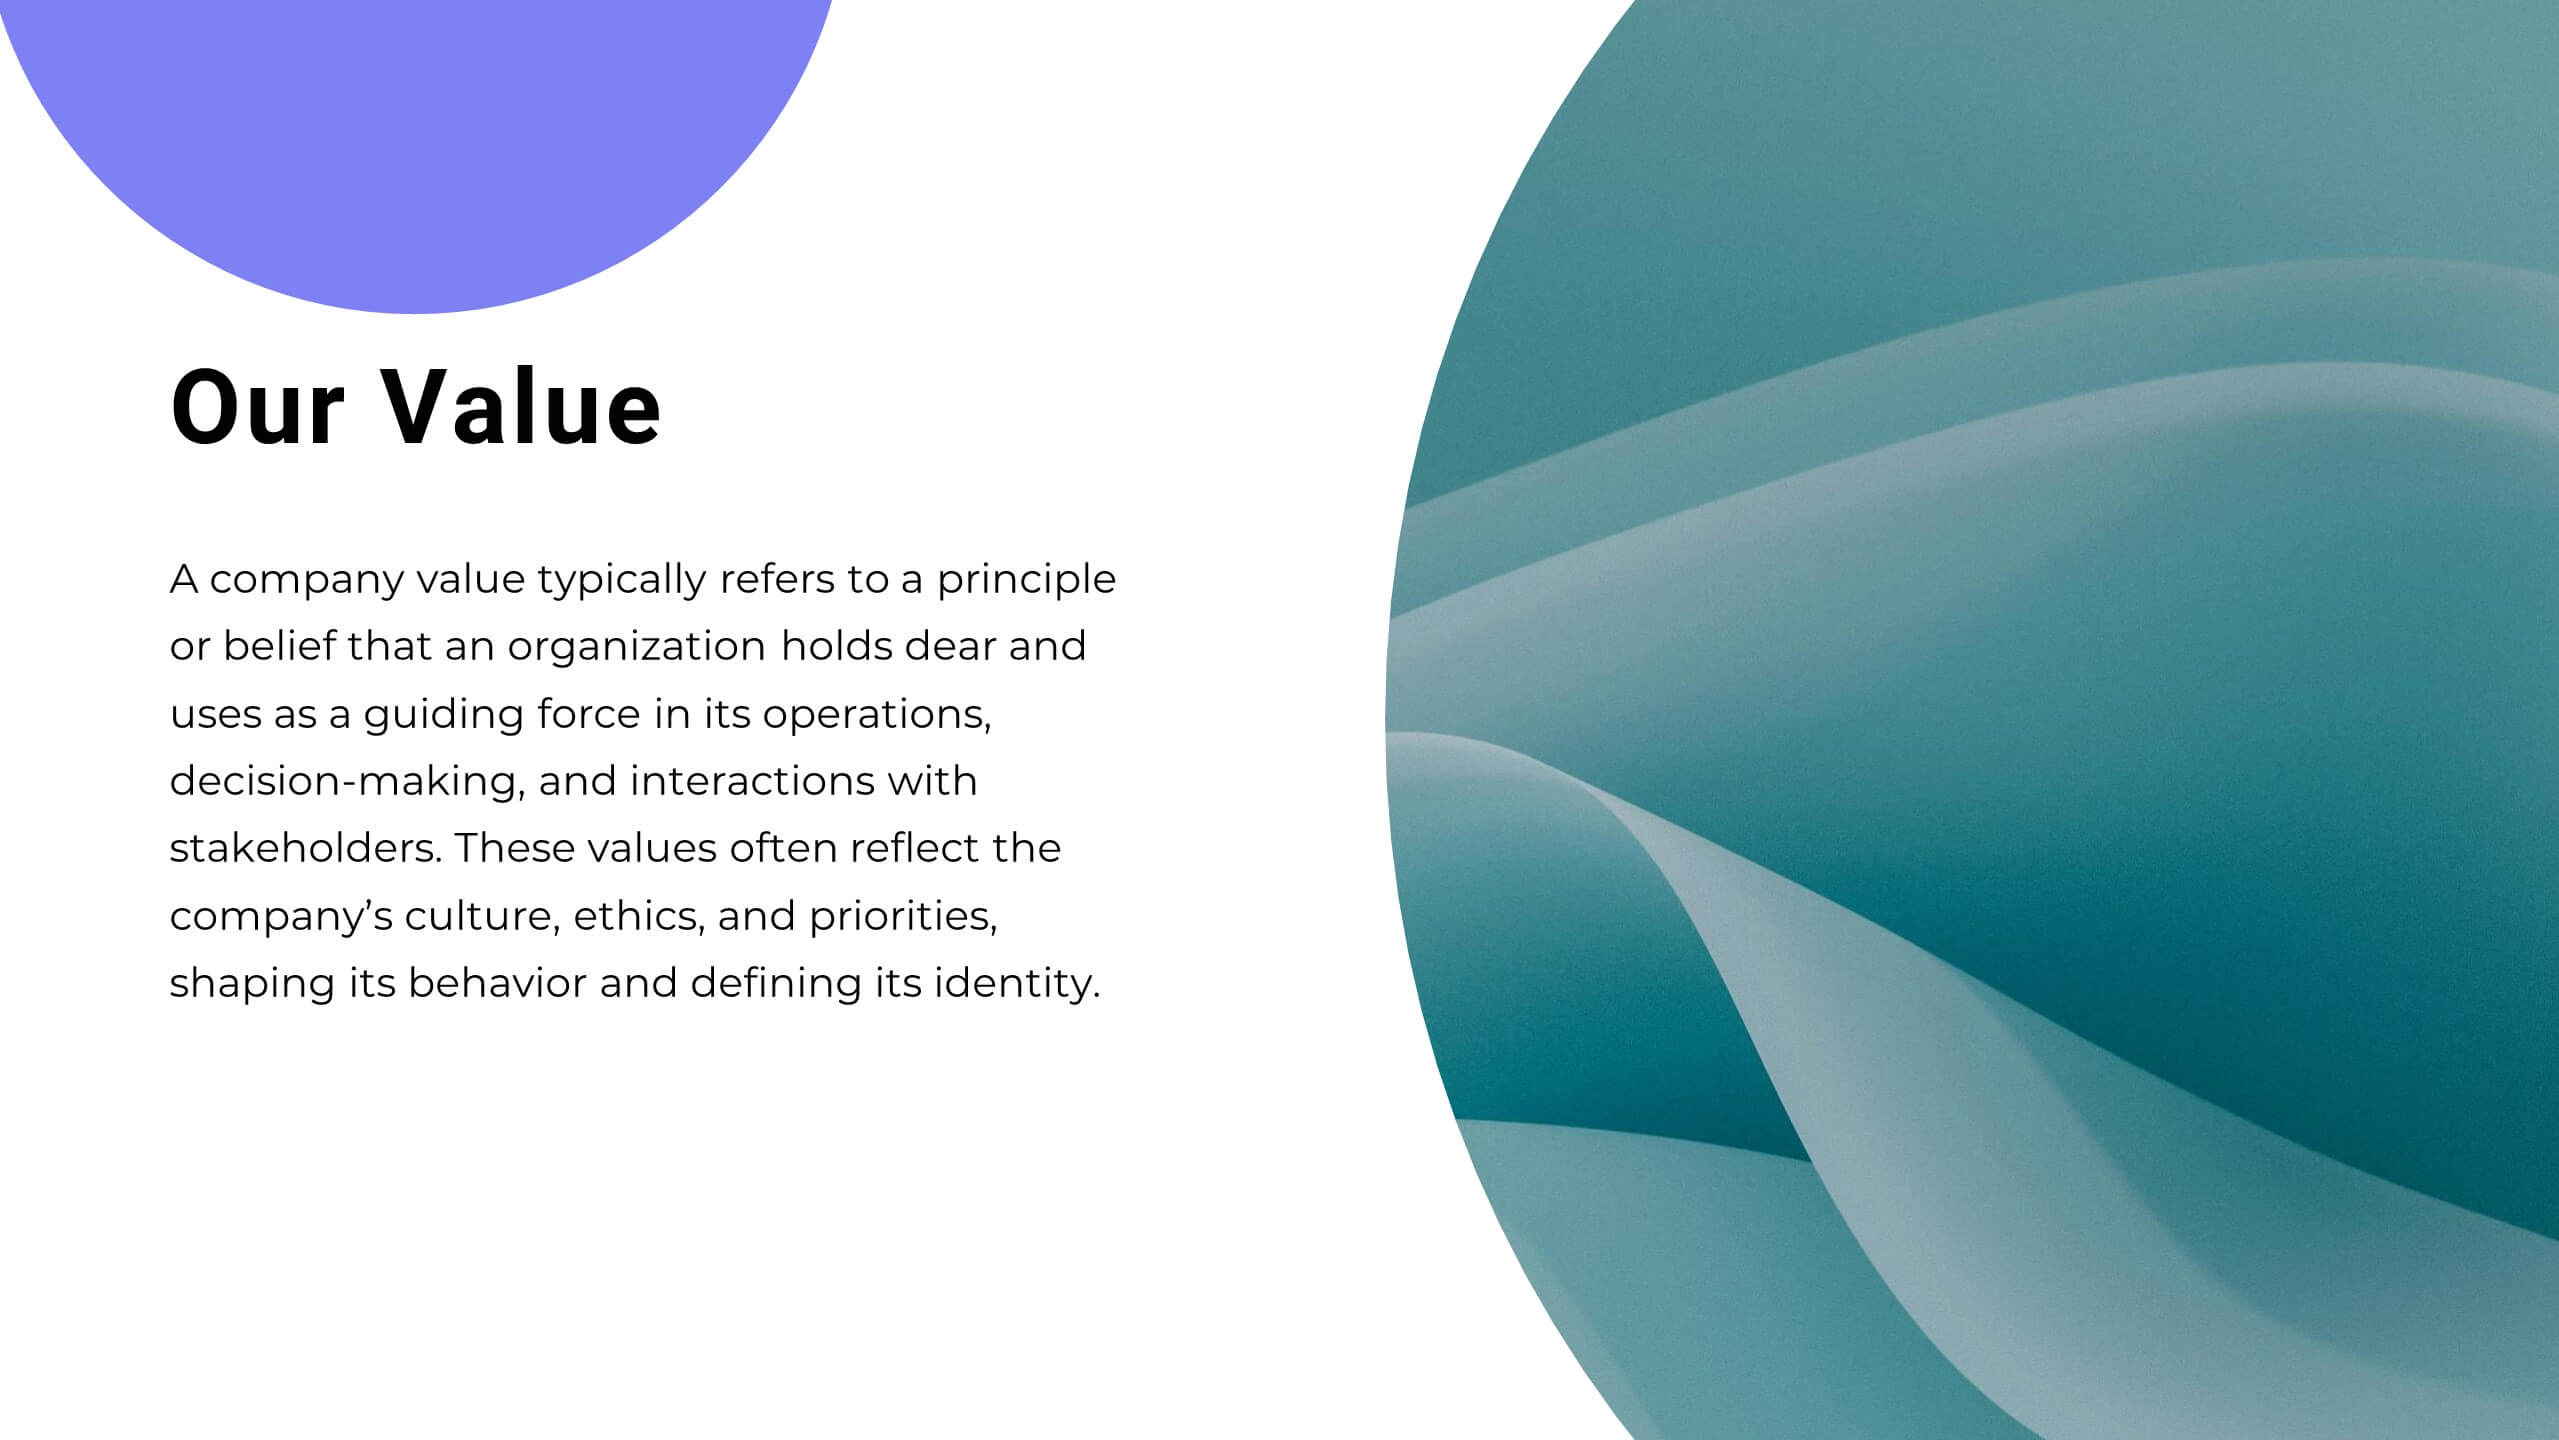
This dynamic and modern Startup Pitch Deck template is perfect for showcasing your startup's vision, strategy, and growth potential. Featuring a sleek design with bold visuals, this template guides you through key sections such as mission and vision, product/service overview, target market, and financial projections. It’s tailored to help you tell a compelling story that resonates with investors and stakeholders. The template is fully customizable in PowerPoint, Keynote, or Google Slides, ensuring you can adapt it to your specific needs and create a memorable presentation that leaves a lasting impression.


2 slides
Creative Gratitude Slide Presentation
Express gratitude in style with this creative thank-you slide template! Featuring bold typography and modern geometric elements, this design adds a unique touch to your presentations. Ideal for business pitches, creative projects, and professional meetings. Fully customizable and compatible with PowerPoint, Keynote, and Google Slides for effortless personalization.


4 slides
Iceberg Metaphor Diagram Presentation
Make your message feel deeper and more intriguing with a visual that instantly shows there’s more beneath the surface. This presentation helps you highlight hidden factors, core insights, and layered data using a clear, structured iceberg illustration. Ideal for strategy, analysis, and storytelling. Fully compatible with PowerPoint, Keynote, and Google Slides.


12 slides
Real Estate House Market Trends Presentation
Analyze Real Estate House Market Trends with this insightful presentation template. Featuring a house-shaped hexagonal layout, this design helps illustrate key factors such as market demand, property values, investment opportunities, and housing policies. Ideal for real estate professionals, investors, and analysts looking to present market insights with clarity and impact. Fully customizable and compatible with PowerPoint, Keynote, and Google Slides.


8 slides
Customer Feedback and Review
Highlight real user opinions with this Customer Feedback and Review presentation. Designed to showcase testimonials, star ratings, and satisfaction percentages, each slide offers a clean, card-style layout perfect for product reviews, client testimonials, or user surveys. Fully customizable in PowerPoint, Keynote, and Google Slides.


6 slides
Real Estate Property Market Overview Presentation
Present key property market insights using this structured, easy-to-follow layout. The slide features six labeled sections flanking a central house graphic—ideal for highlighting data points, regional comparisons, or investment factors. Fully customizable in Canva, PowerPoint, and Google Slides, making it perfect for real estate reports, pitches, or client presentations.


6 slides
4 Stage Roadmap Template
Navigate your projects with clarity using our "4 Stage Roadmap Template." This engaging presentation template offers a unique, pathway-like design to outline the progression of any project through four distinct stages. Each step is visually differentiated, making it easy to follow and understand the sequence and dependencies of tasks. Perfect for project managers and teams, this template ensures your strategic milestones are visually aligned and easy to communicate. Compatible with PowerPoint, Keynote, and Google Slides, it's an essential tool for effective project visualization and management.


10 slides
Farming Technologies and Crop Management
Present cutting-edge insights with the Farming Technologies and Crop Management Presentation. This visually compelling slide uses wind turbine illustrations to symbolize innovation in agriculture. Ideal for showcasing smart farming tools, sustainable practices, and crop optimization strategies. Fully editable and compatible with PowerPoint, Keynote, and Google Slides.


6 slides
Year-End Review and Financial Report Presentation
Summarize your business year clearly with the Year-End Review and Financial Report Presentation. This clean, modern layout uses quarterly donut charts and monthly timelines to help visualize performance at a glance. Ideal for financial recaps and executive meetings. Fully editable in Canva, PowerPoint, and Google Slides for easy updates and branding.


6 slides
Real Estate and Building Development
Visualize the complete property development process with this modern, keyhole-inspired presentation design. Ideal for real estate developers, architects, and construction planners, this slide clearly outlines six project stages—from concept to completion—using bold icons and a radial layout. Editable in PowerPoint, Keynote, and Google Slides.


6 slides
Meeting Planner Infographics
Efficiently plan and organize meetings with our Meeting Planner infographic template. This template is fully compatible with popular presentation software like PowerPoint, Keynote, and Google Slides, allowing you to easily customize it to illustrate and communicate the key steps and strategies for effective meeting planning. The Meeting Planner infographic template offers a visually engaging platform to outline the meeting planning process, including scheduling, agenda creation, participant coordination, and follow-up actions. Whether you're a project manager, event planner, or business professional, this template provides a user-friendly canvas to create informative presentations and educational materials on meeting planning best practices. Optimize your meeting planning skills and efficiency with this SEO-optimized Meeting Planner infographic template, thoughtfully designed for clarity and ease of use. Customize it to showcase tips for successful meetings, tools for scheduling, and strategies for engaging participants, ensuring that your audience becomes more proficient in planning and executing productive meetings. Start crafting your personalized infographic today to become a more effective Meeting Planner.


4 slides
Differentiation through Blue Ocean Framework Presentation
Make waves with this bold, eye-catching layout built to show what sets your strategy apart. This presentation template explores how to stand out in untapped markets using a simple comparison framework, perfect for teams shifting from competition to innovation. Easily editable and ready for PowerPoint, Keynote, and Google Slides.


7 slides
Medical Insurance Infographic
The Medical Insurance Infographic provides a clear and concise visualization of insurance policy features, coverage details, and benefits. Ideal for insurance companies, healthcare professionals, and policyholders, this infographic simplifies complex insurance information into digestible segments. With a clean and professional design, the infographic outlines key insurance concepts such as premium rates, deductibles, copayments, and coverage limits. It also offers a visual comparison of different plans, aiding customers in making informed decisions regarding their healthcare coverage. Customizable for different audiences, this SEO-optimized infographic can be used on websites, in marketing materials, or during consultations to enhance understanding of medical insurance options. Employ our Medical Insurance Infographic to effectively communicate the value of insurance plans and help individuals navigate their healthcare needs with confidence.


5 slides
Risk and Obstacle Mapping Presentation
Turn up the heat on problem-solving with this vibrant template designed to visualize risks and roadblocks clearly. Use this layout to assess, categorize, and communicate potential business obstacles with precision. It's ideal for risk analysis presentations and strategy meetings. Fully compatible with PowerPoint, Keynote, and Google Slides for easy editing.


10 slides
Logistics and Procurement Supply Chain
Streamline your supply chain narrative with this clean, visual timeline layout. Perfect for operations managers, logistics planners, or procurement leads, this slide breaks down each stage of the supply chain process with color-coded segments and intuitive icons. Fully editable in PowerPoint, Keynote, and Google Slides.


26 slides
Strategic Business Networking Presentation
Craft a compelling narrative on strategic business networking with this sleek template. It's tailor-made for effortless use on PowerPoint, Keynote, and Google Slides. The design focuses on clear communication of networking strategies through vibrant slides. It includes team introductions, data-rich infographics, and inspirational quotes, suitable for professionals in any field. Customize it to suit your presentation needs, ensuring your message on the importance of connections resonates. This template is an excellent choice for both team meetings and larger conferences. It’s designed to be user-friendly, facilitating a seamless experience for your audience. Engage and educate with ease, thanks to the template's professional and clean design. It's an essential tool for anyone looking to illustrate the value of networking in business. Choose simplicity and effectiveness for your next presentation and watch as your strategic networking insights captivate your peers.