


Features
- 6 Unique slides
- Fully editable and easy to edit in Microsoft Powerpoint, Keynote and Google Slides
- 16:9 widescreen layout
- Clean and professional designs
- Export to JPG, PDF or send by email


Do you have any questions?
Recommend


5 slides
Innovative Concept Pitch Presentation
Present your big ideas with impact using this lightbulb puzzle infographic. Perfect for concept development, product ideation, or startup pitches. The layered segments help structure your content clearly. Fully customizable in PowerPoint, Keynote, and Google Slides—ideal for innovation roadmaps, creative planning, or visualizing business concepts.


7 slides
One-Page Startup Model Canvas
Launch and refine your business idea with clarity using the One-Page Startup Model Canvas Presentation. This slide presents all key startup elements—Partners, Activities, Value Propositions, Customer Segments, Revenue Streams, and more—in a smart puzzle-piece layout that simplifies complex planning. Perfect for founders and pitch decks. Fully customizable in PowerPoint, Keynote, and Google Slides.


26 slides
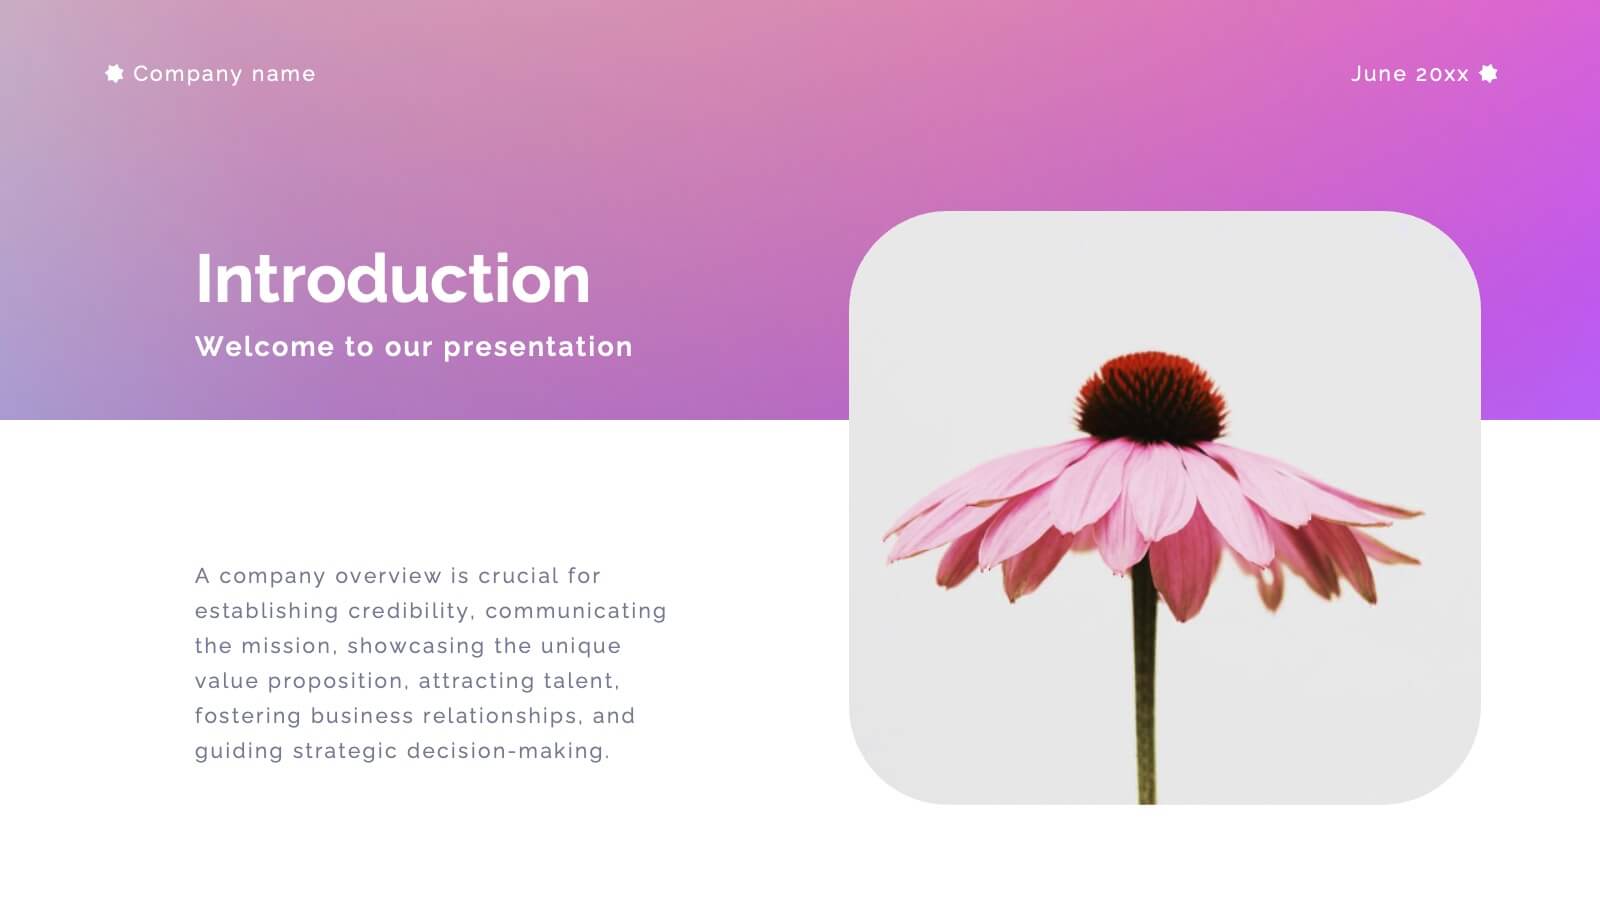
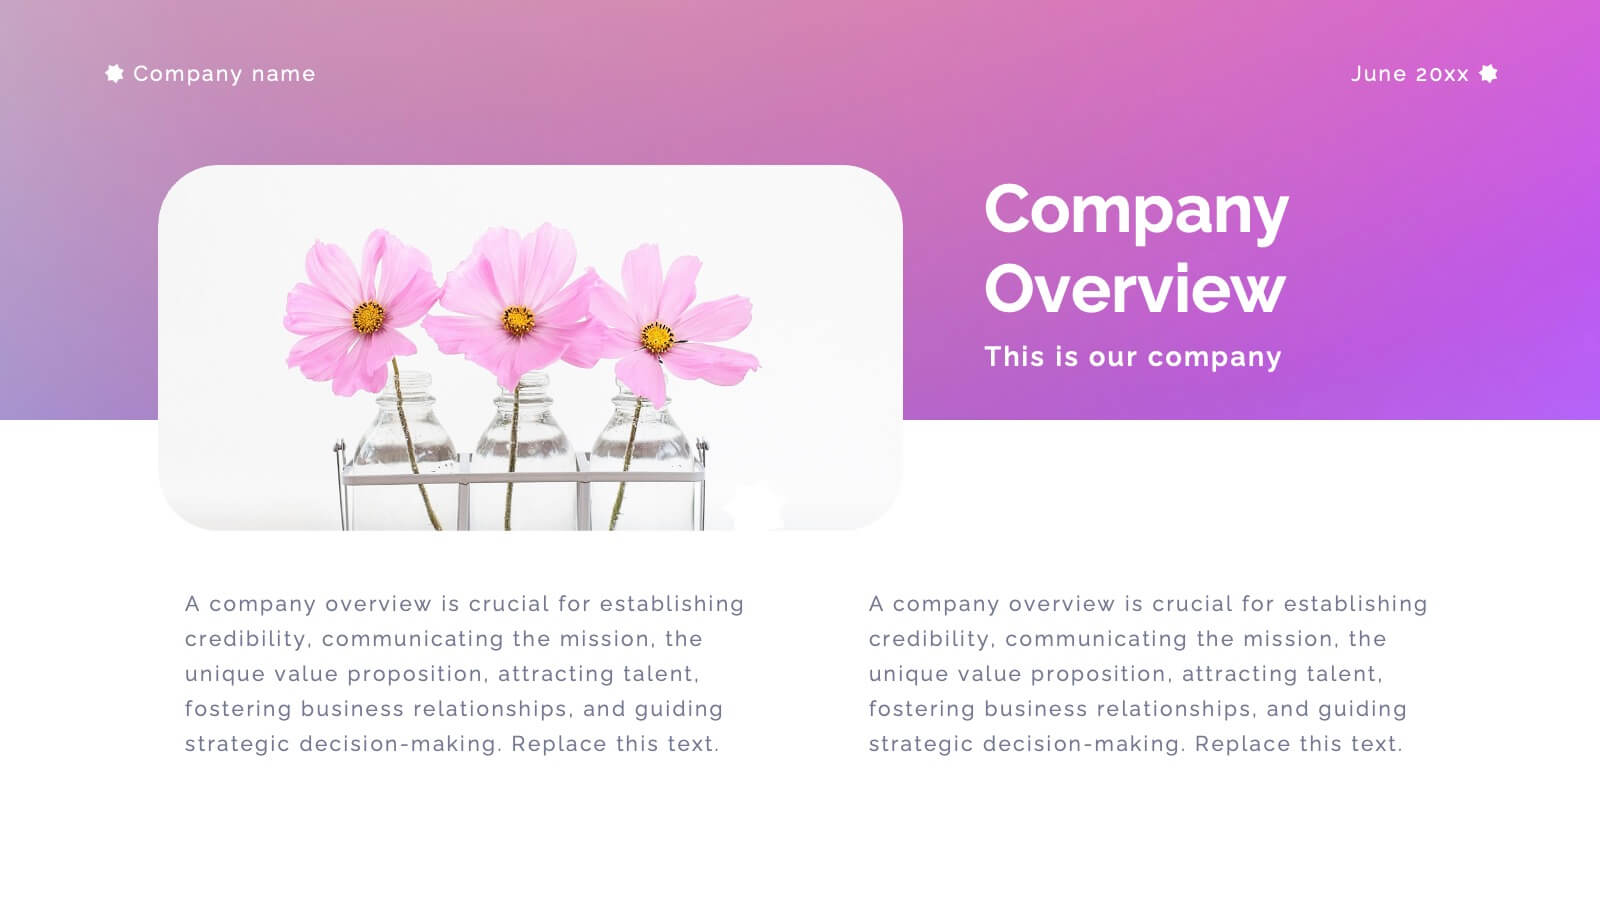
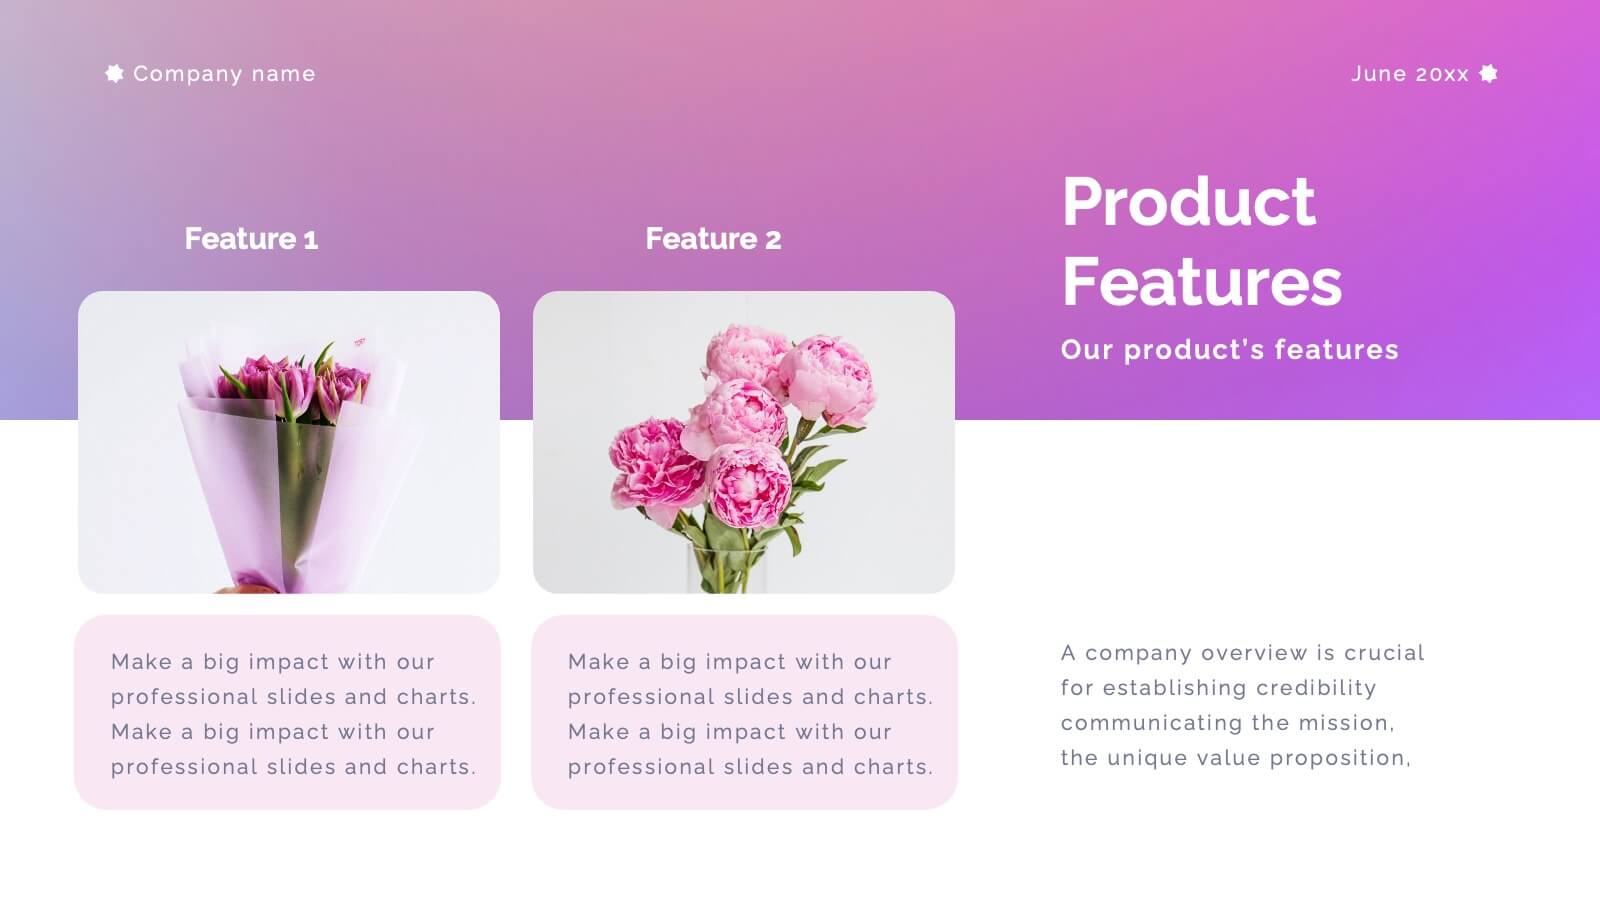
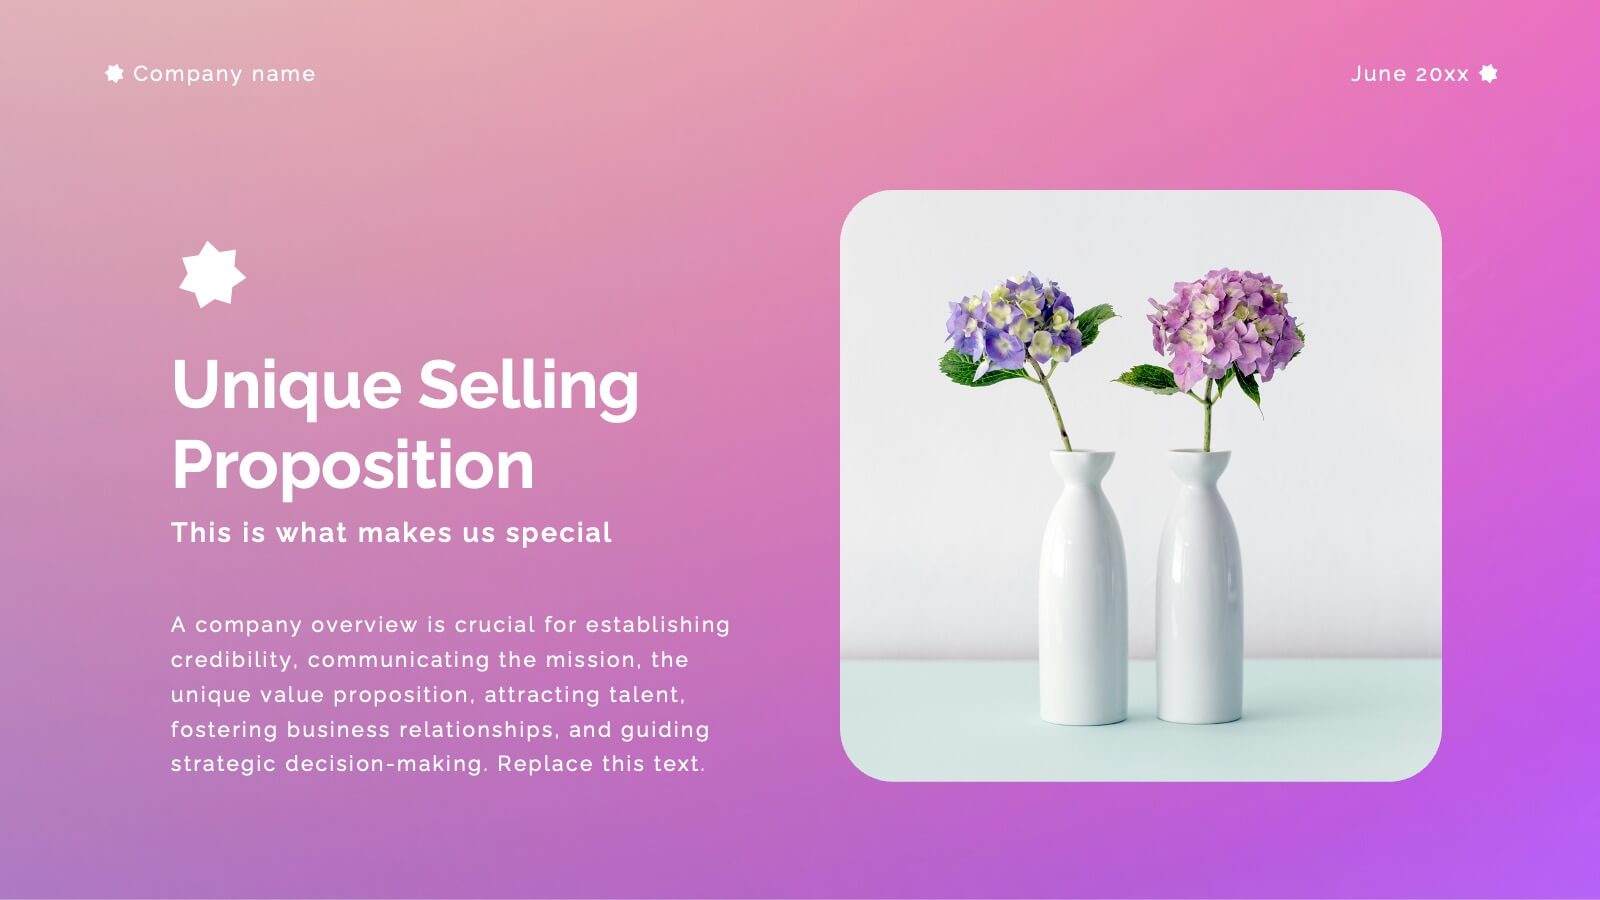
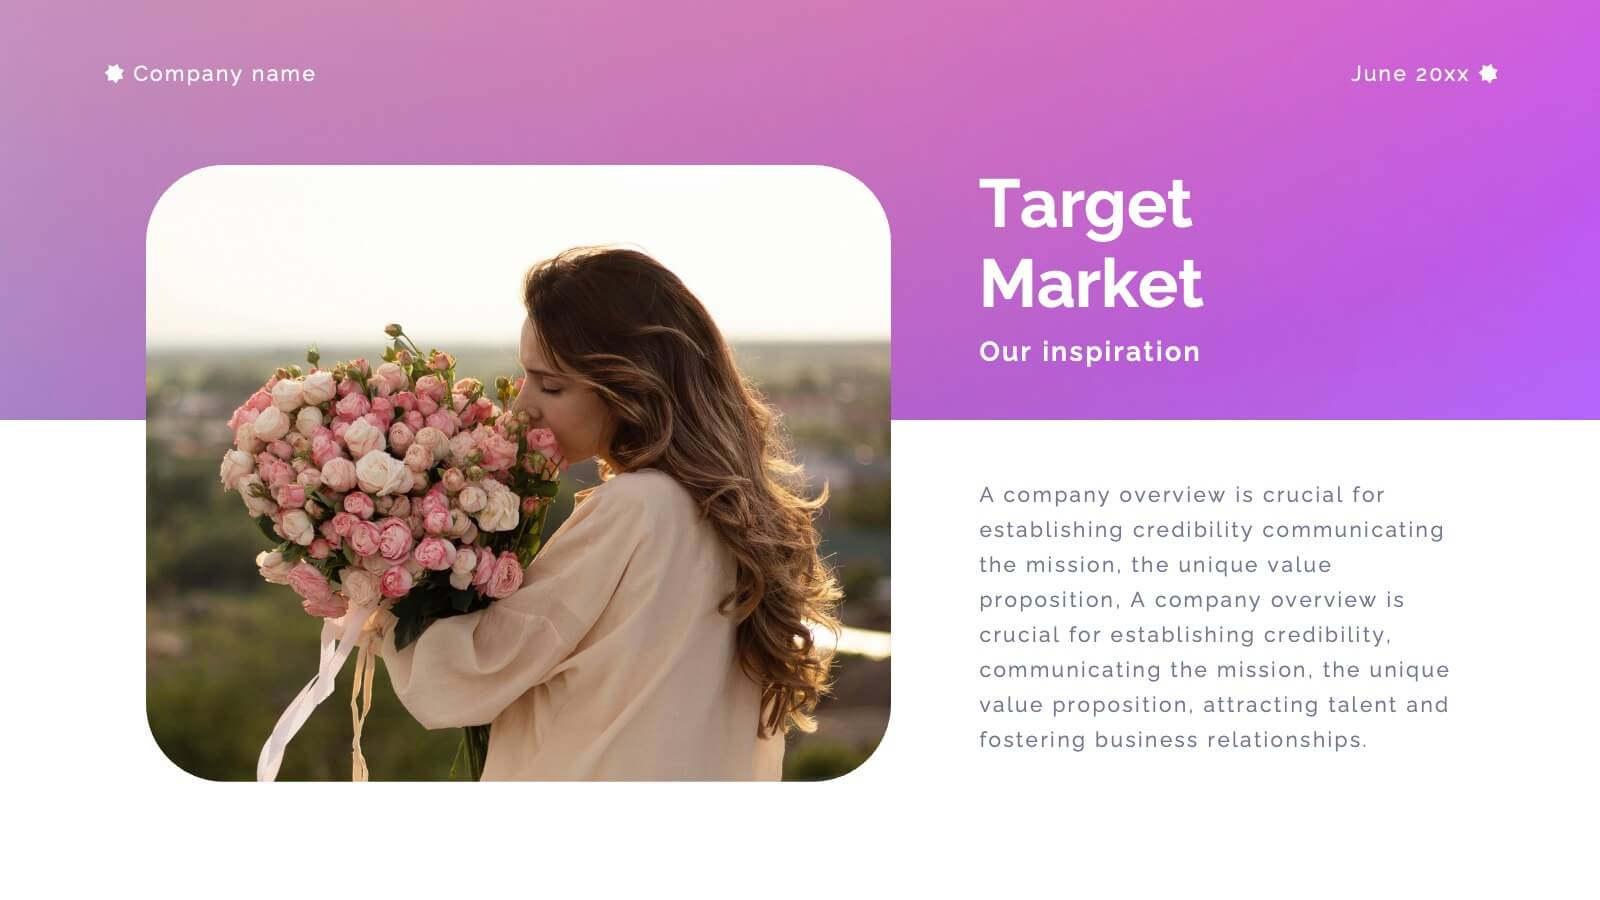
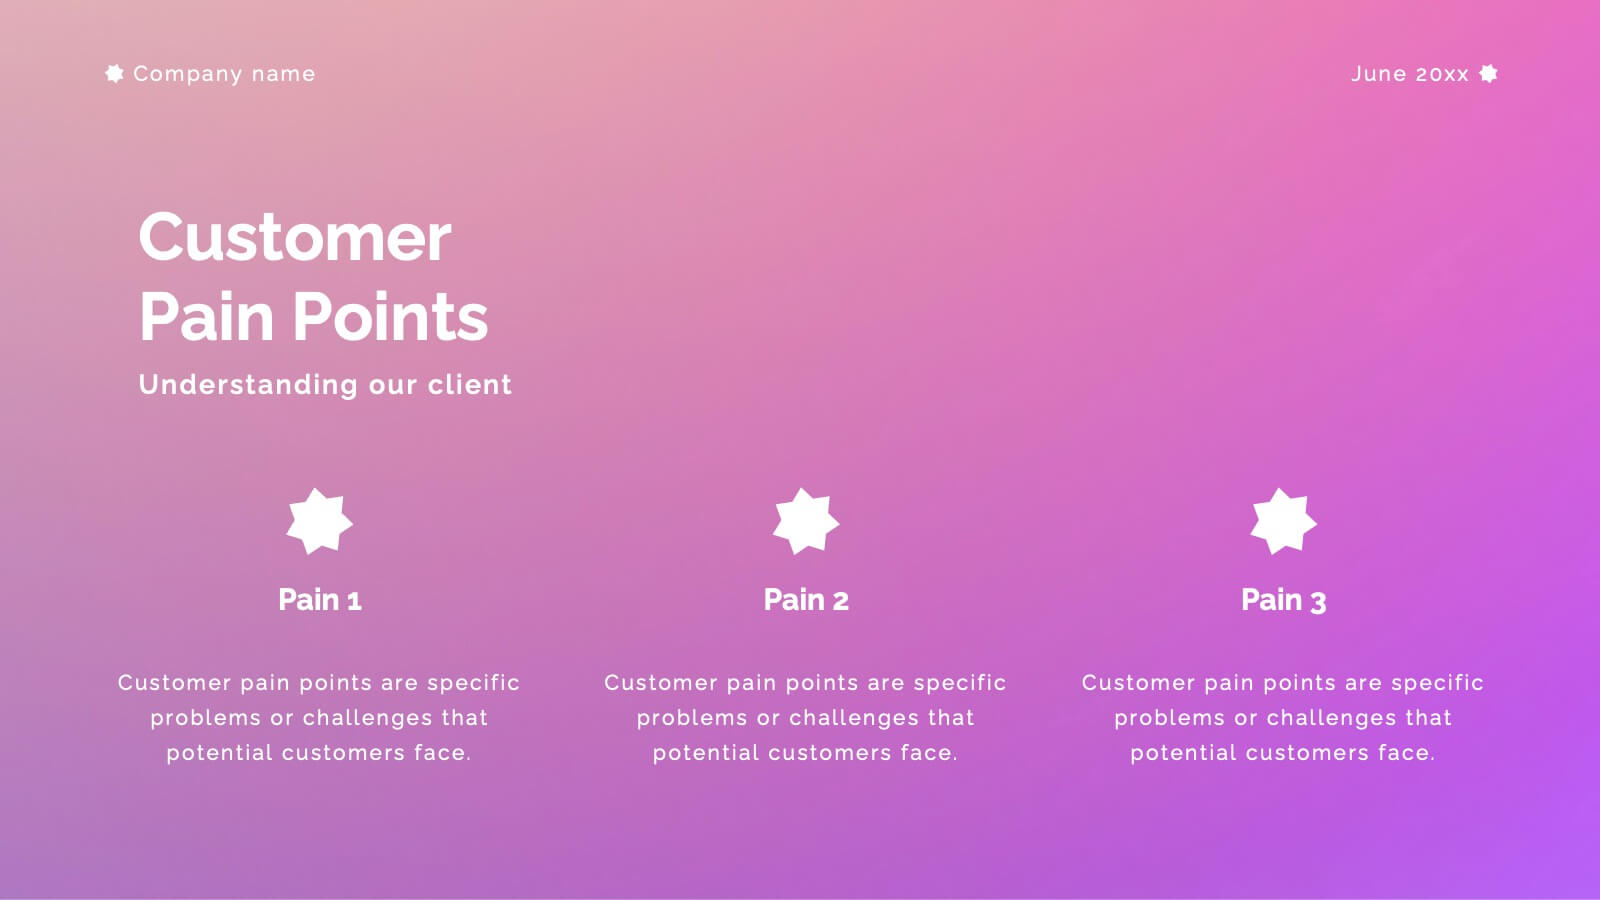
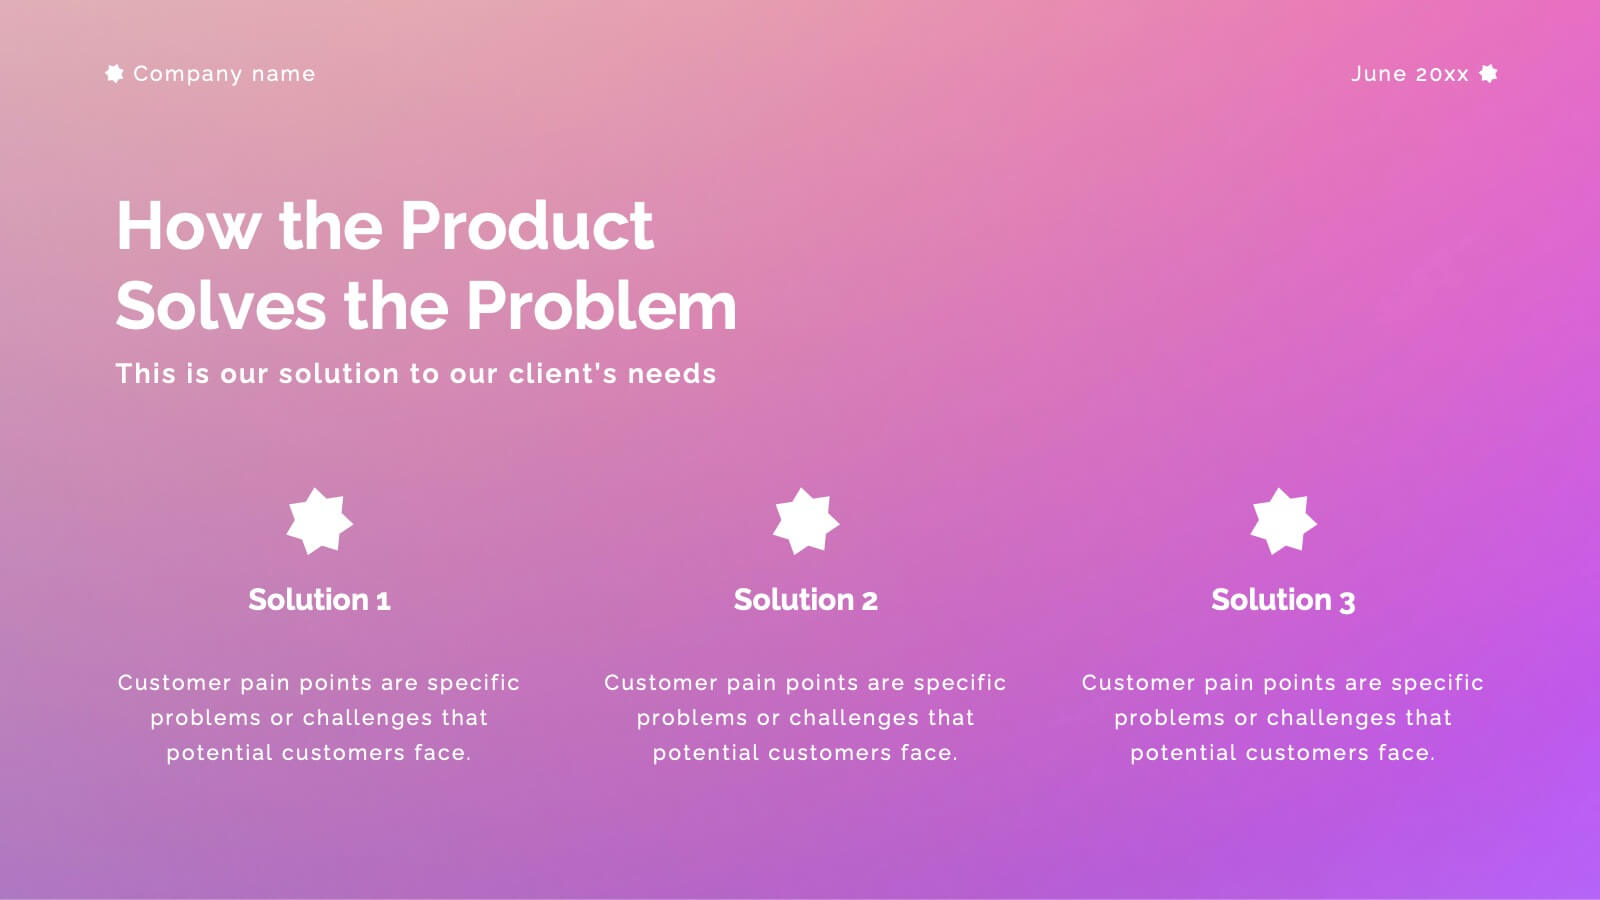
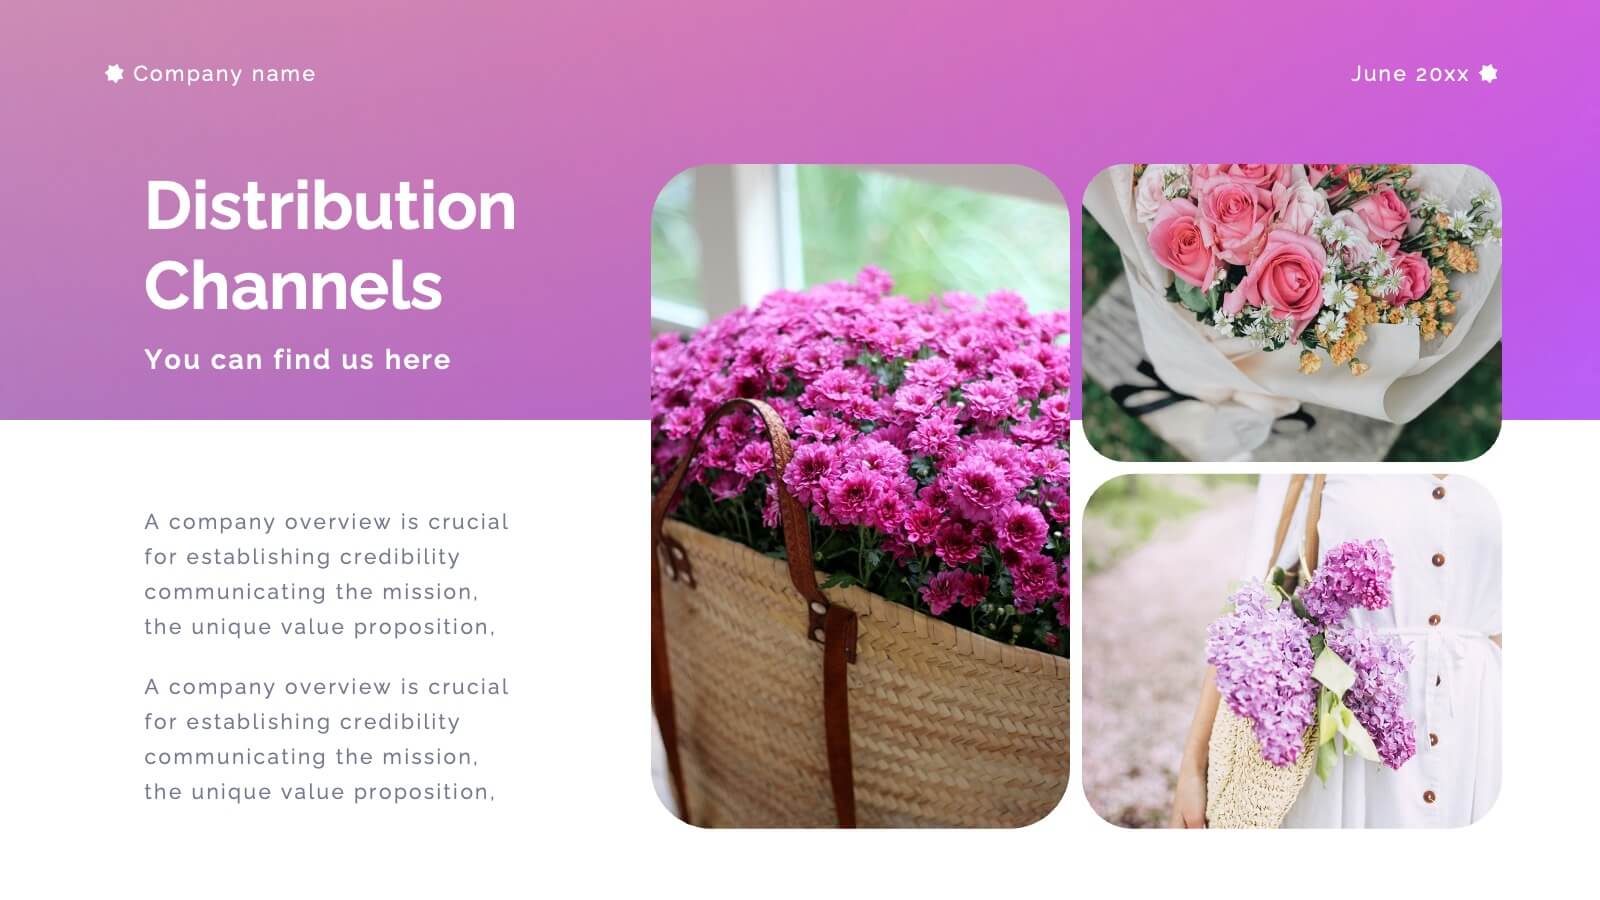
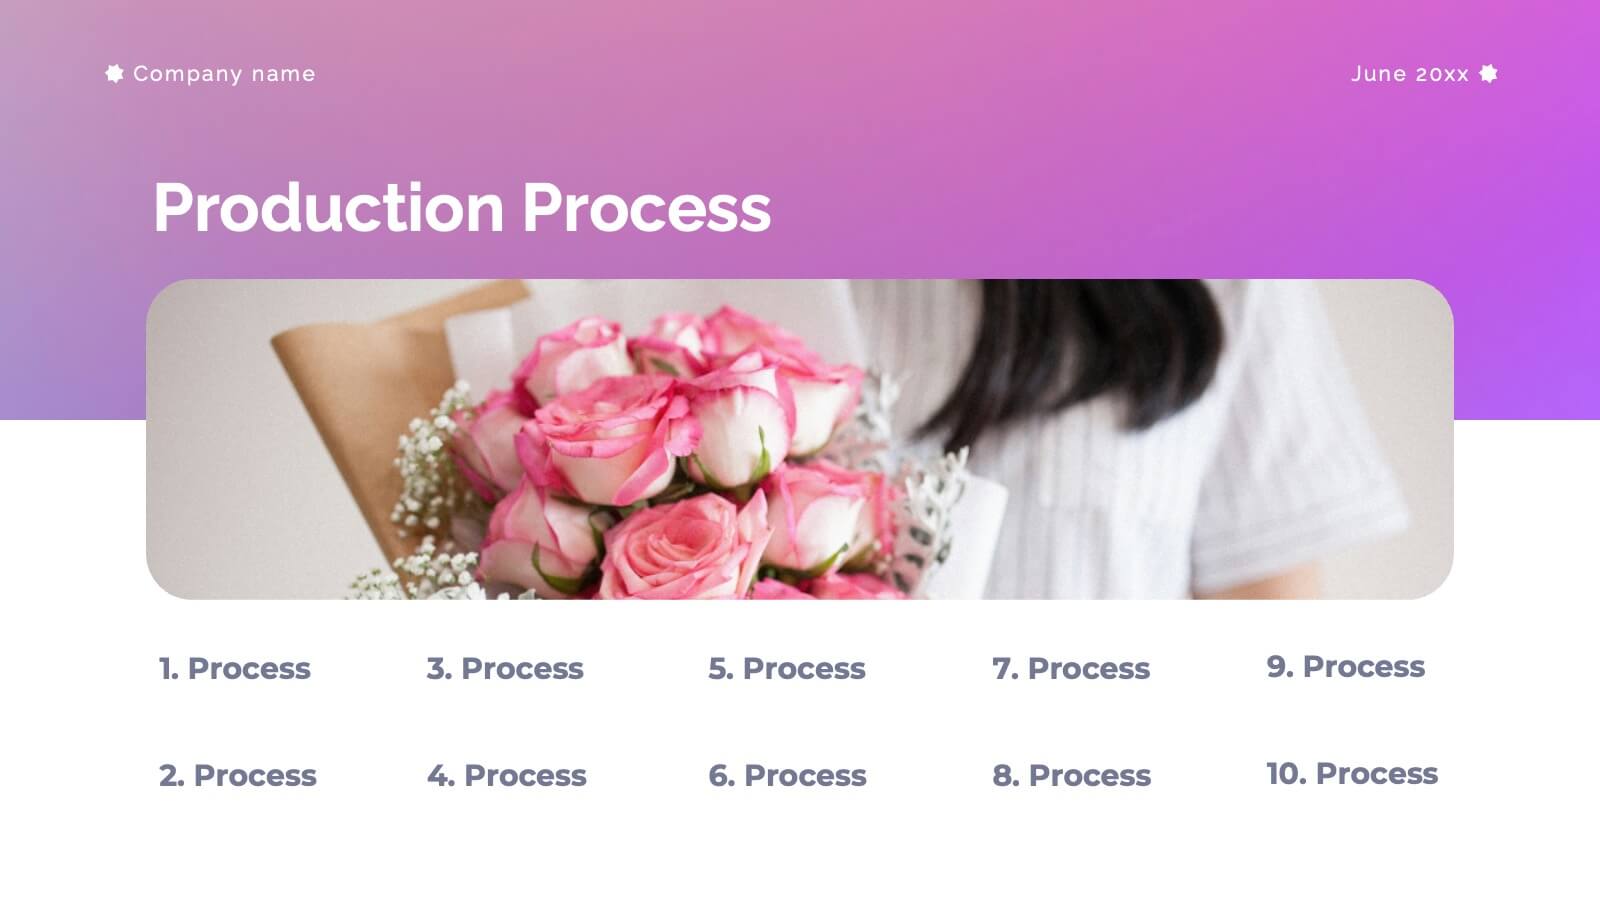
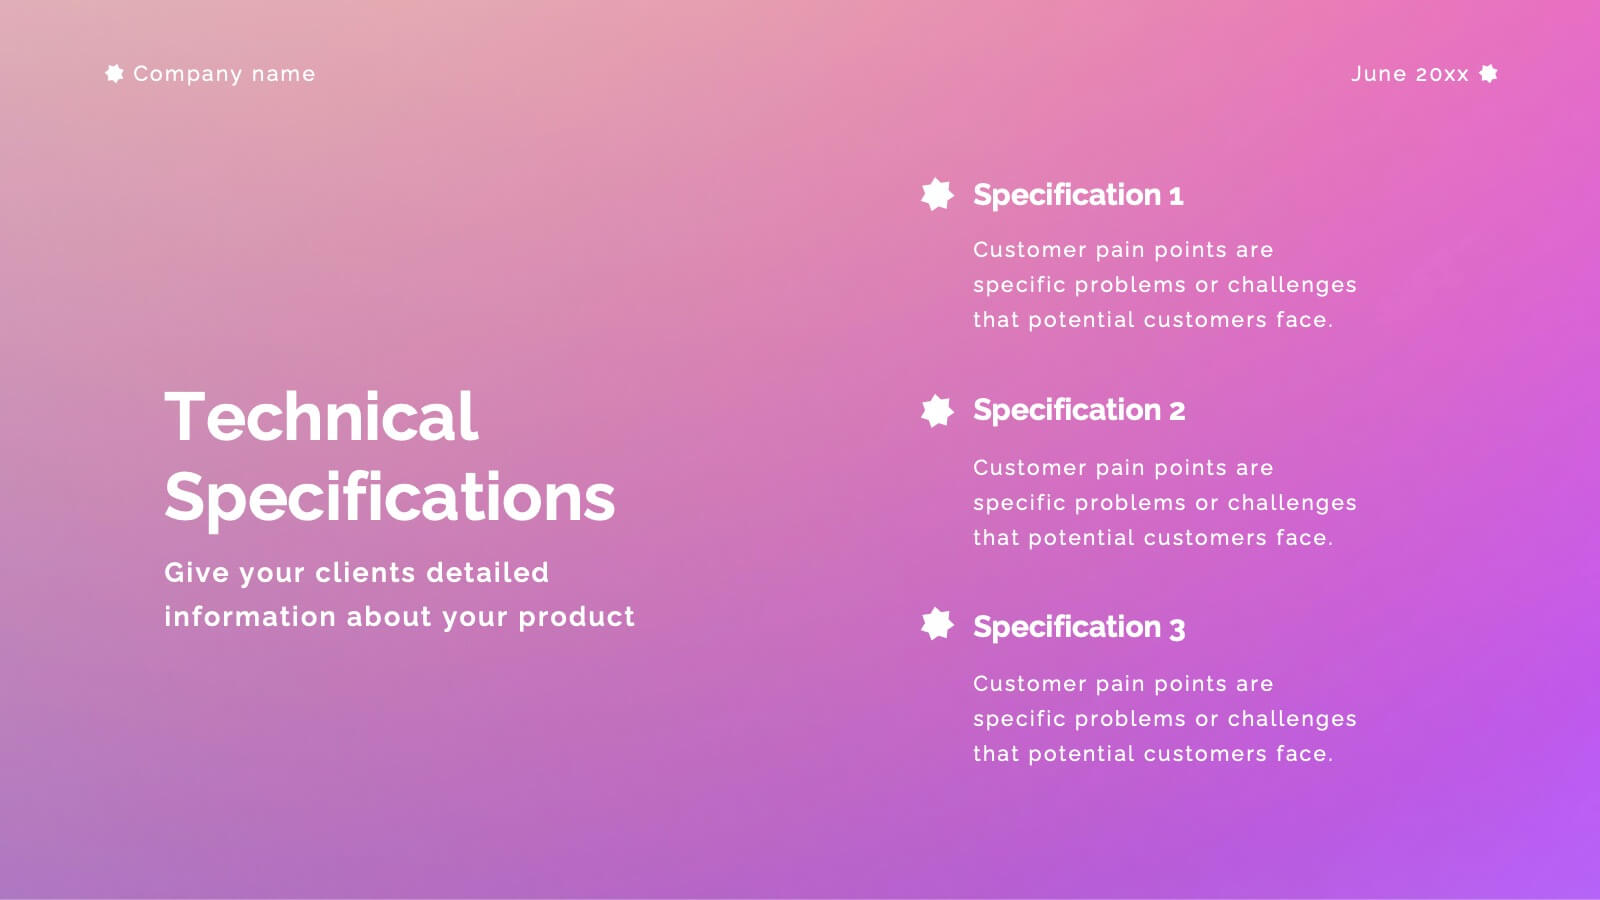
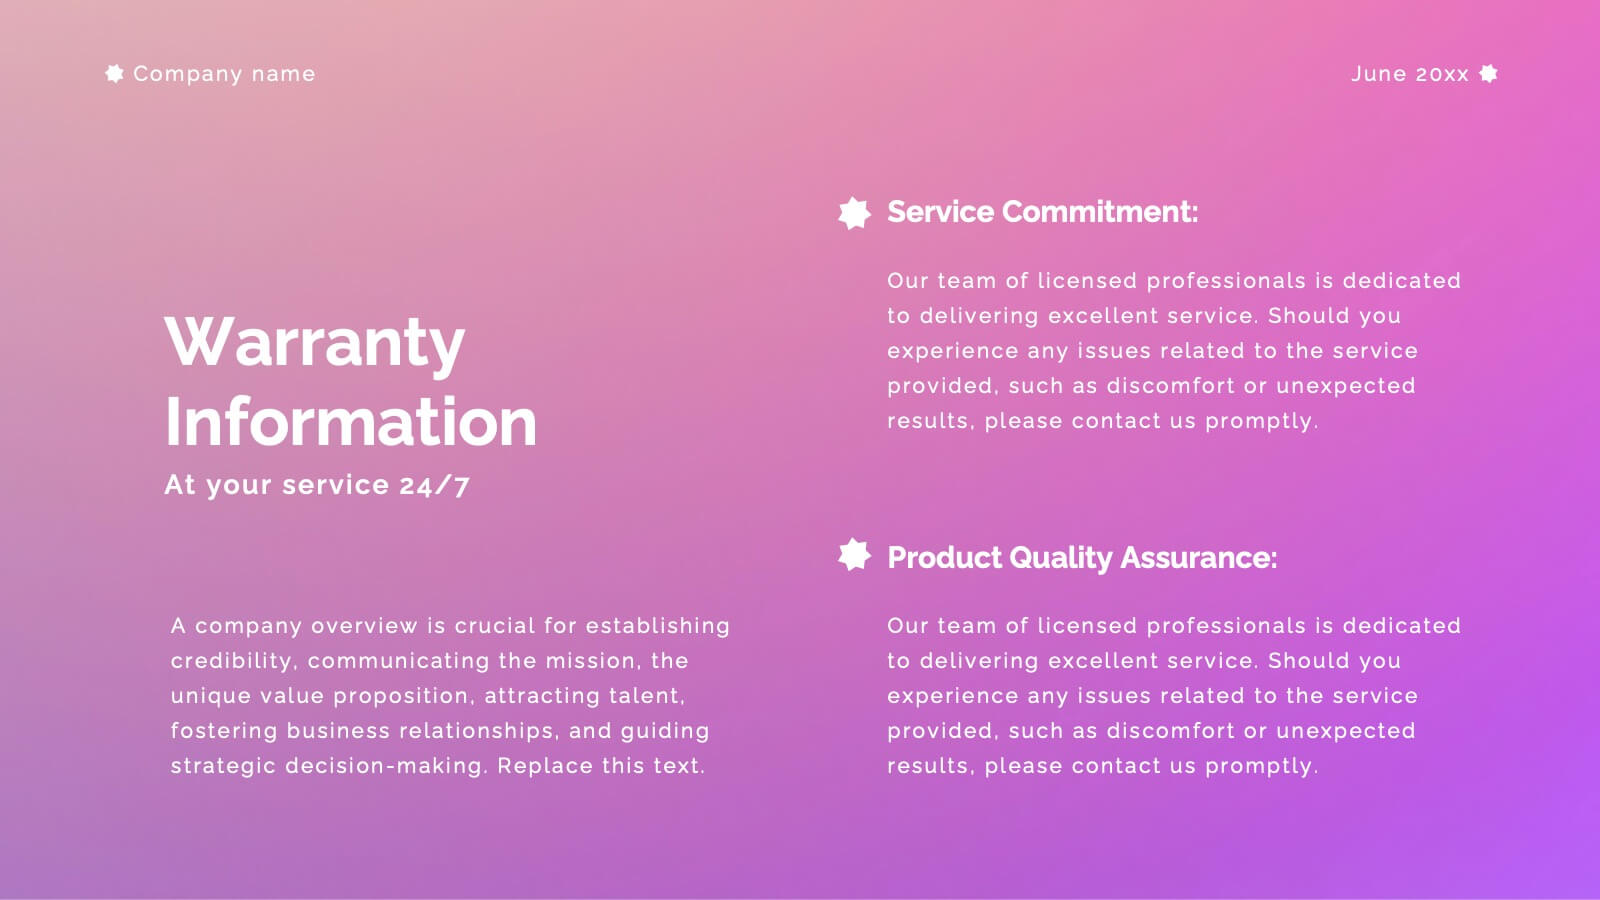
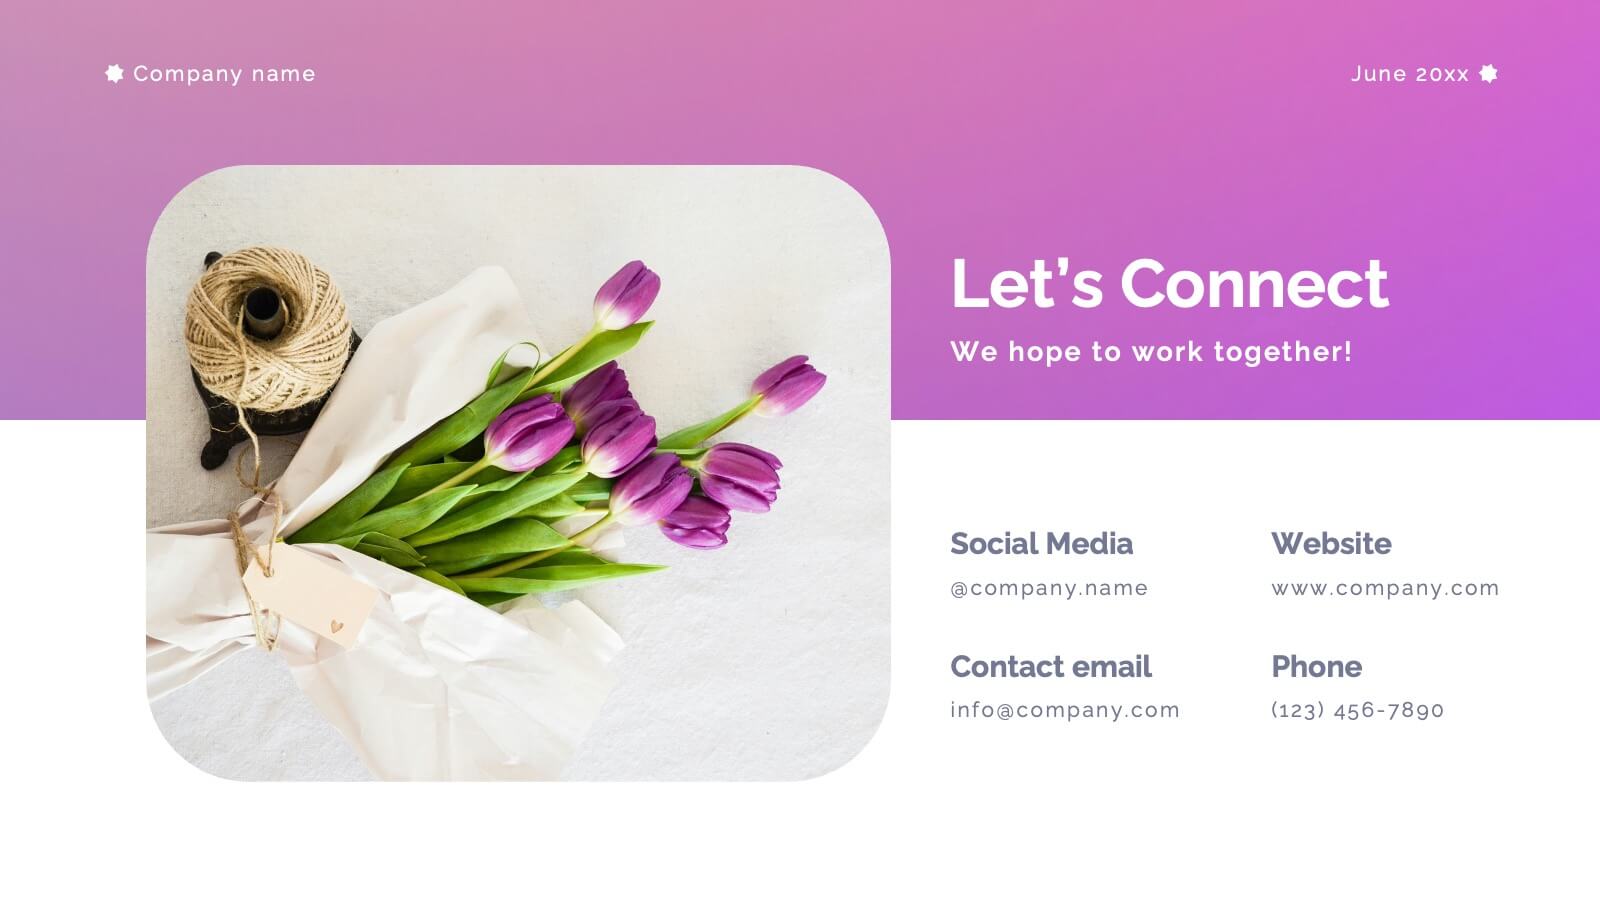
Flower Shop and Blossoms Presentation
A flower shop, also known as a floral boutique, is a retail establishment that sells fresh flowers, floral arrangements, and related products. This presentation template has a charming design that celebrates the beauty and elegance of flowers. This template is perfect for florists, flower shops, garden enthusiasts, or anyone looking to create a captivating presentation about flowers, floral arrangements, or the art of floristry. The presentation features visually stunning floral icons with colorful and artistic arrangements, creating a delightful and inviting atmosphere. This template is fully customizable and compatible with Powerpoint, Keynote, and Google Slides.
23 slides
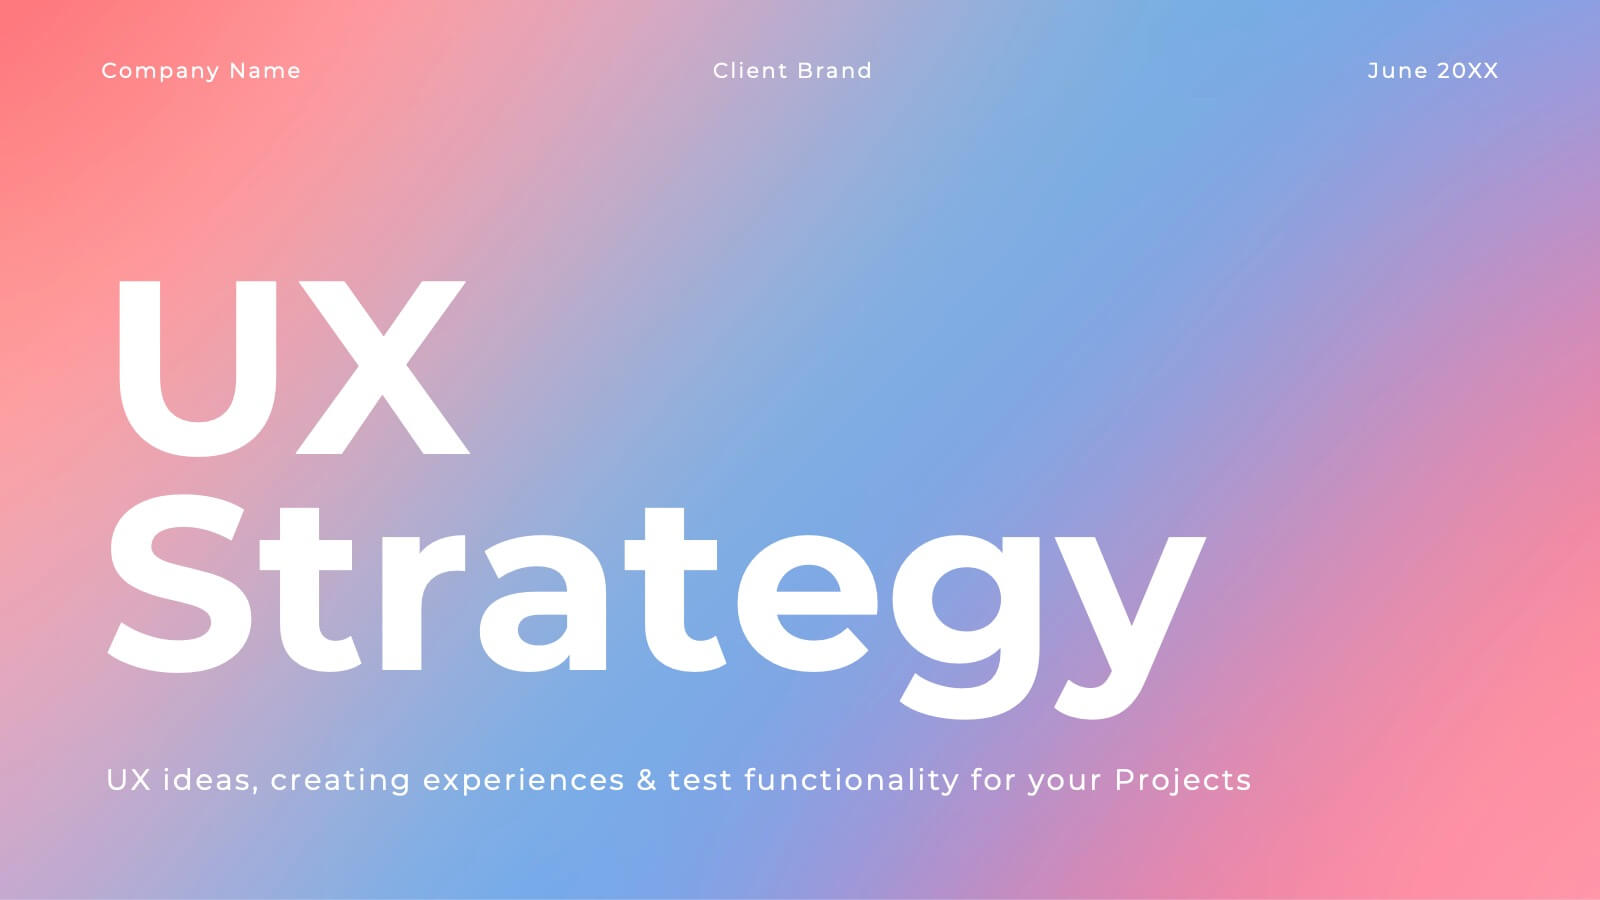
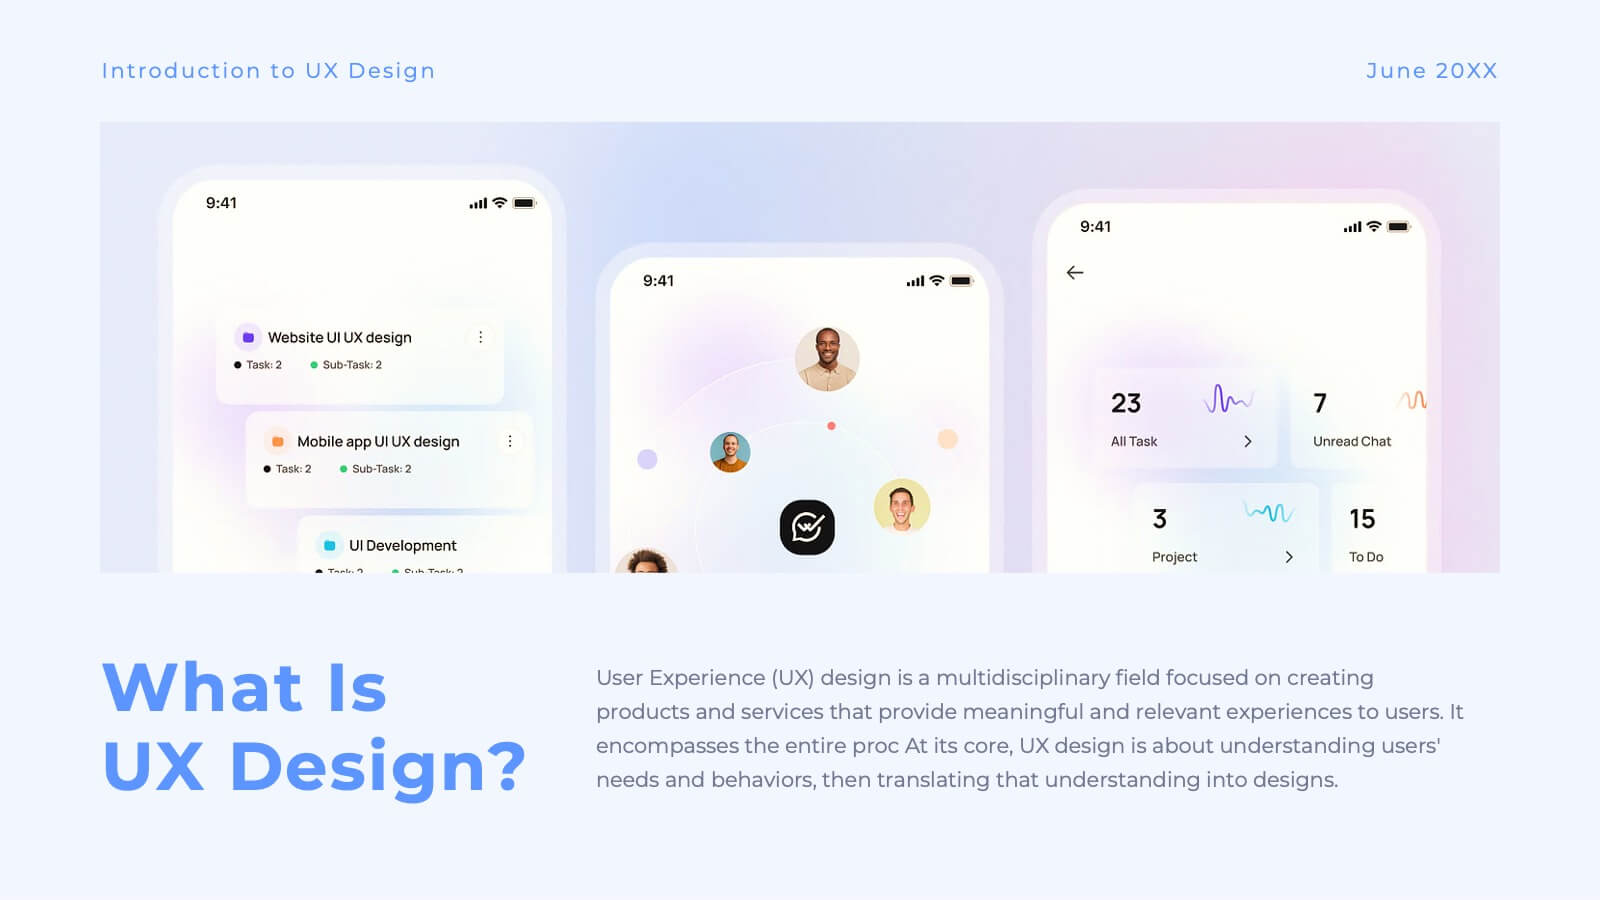
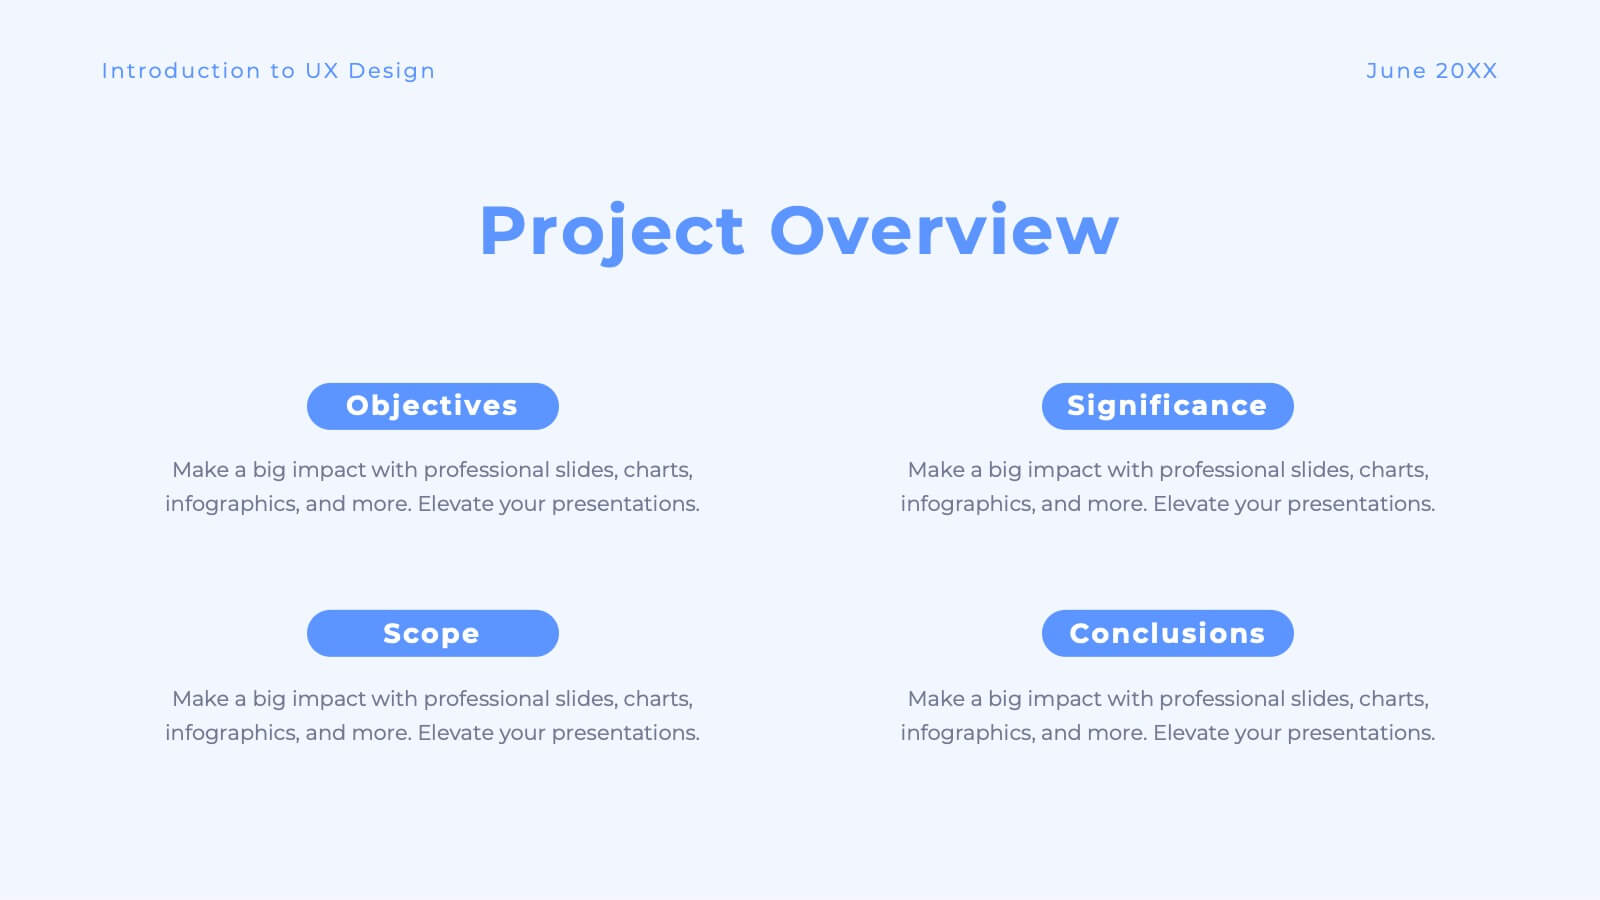
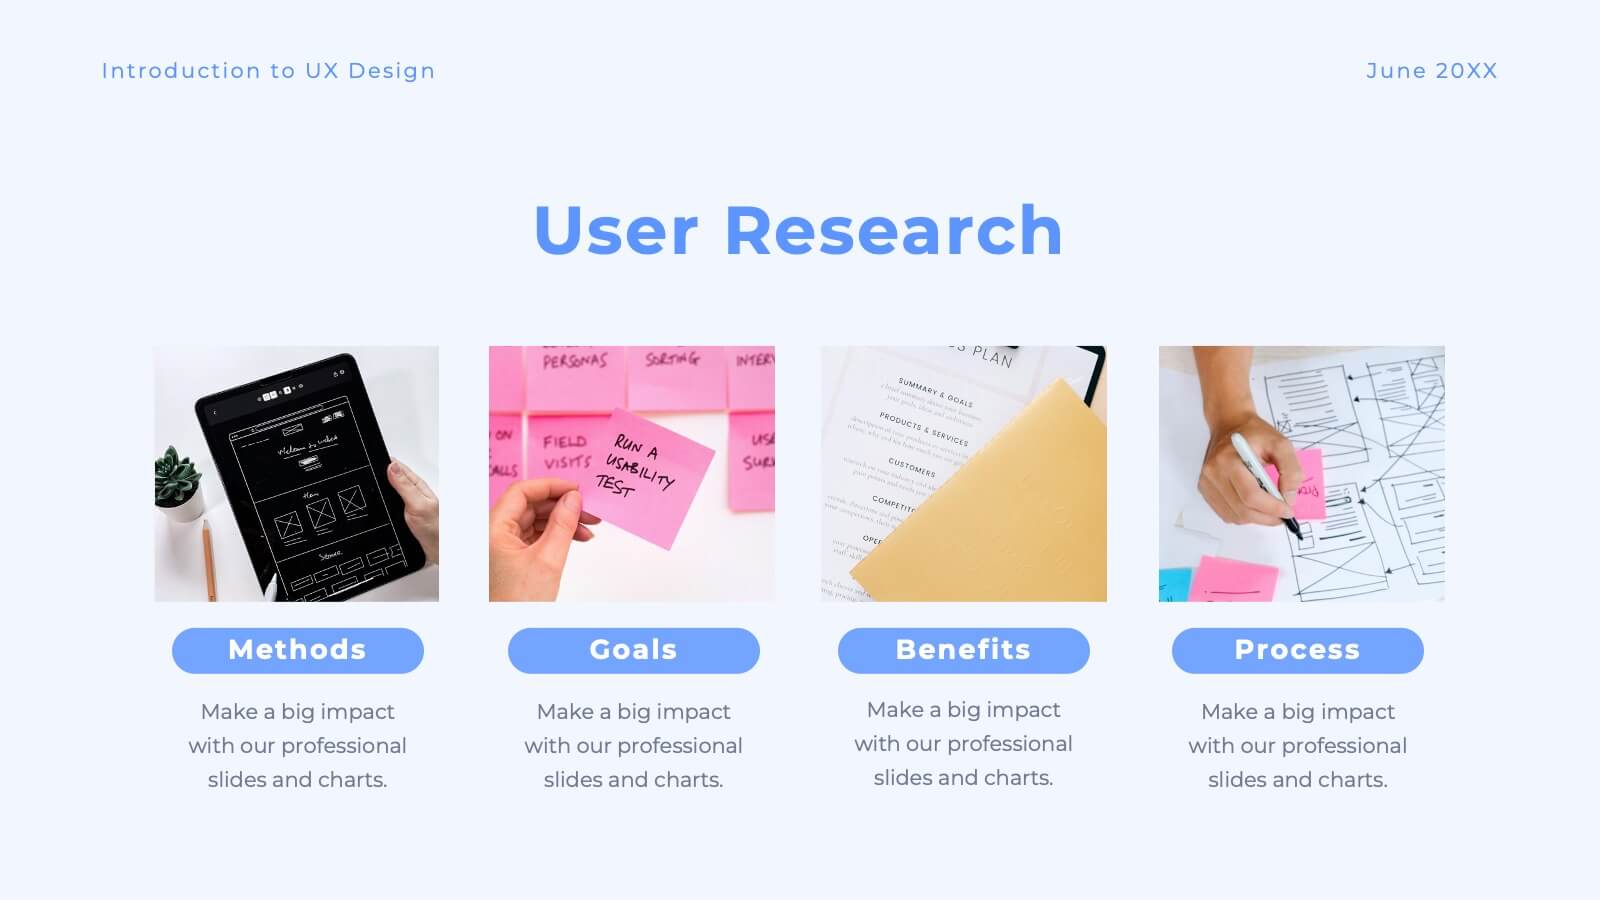
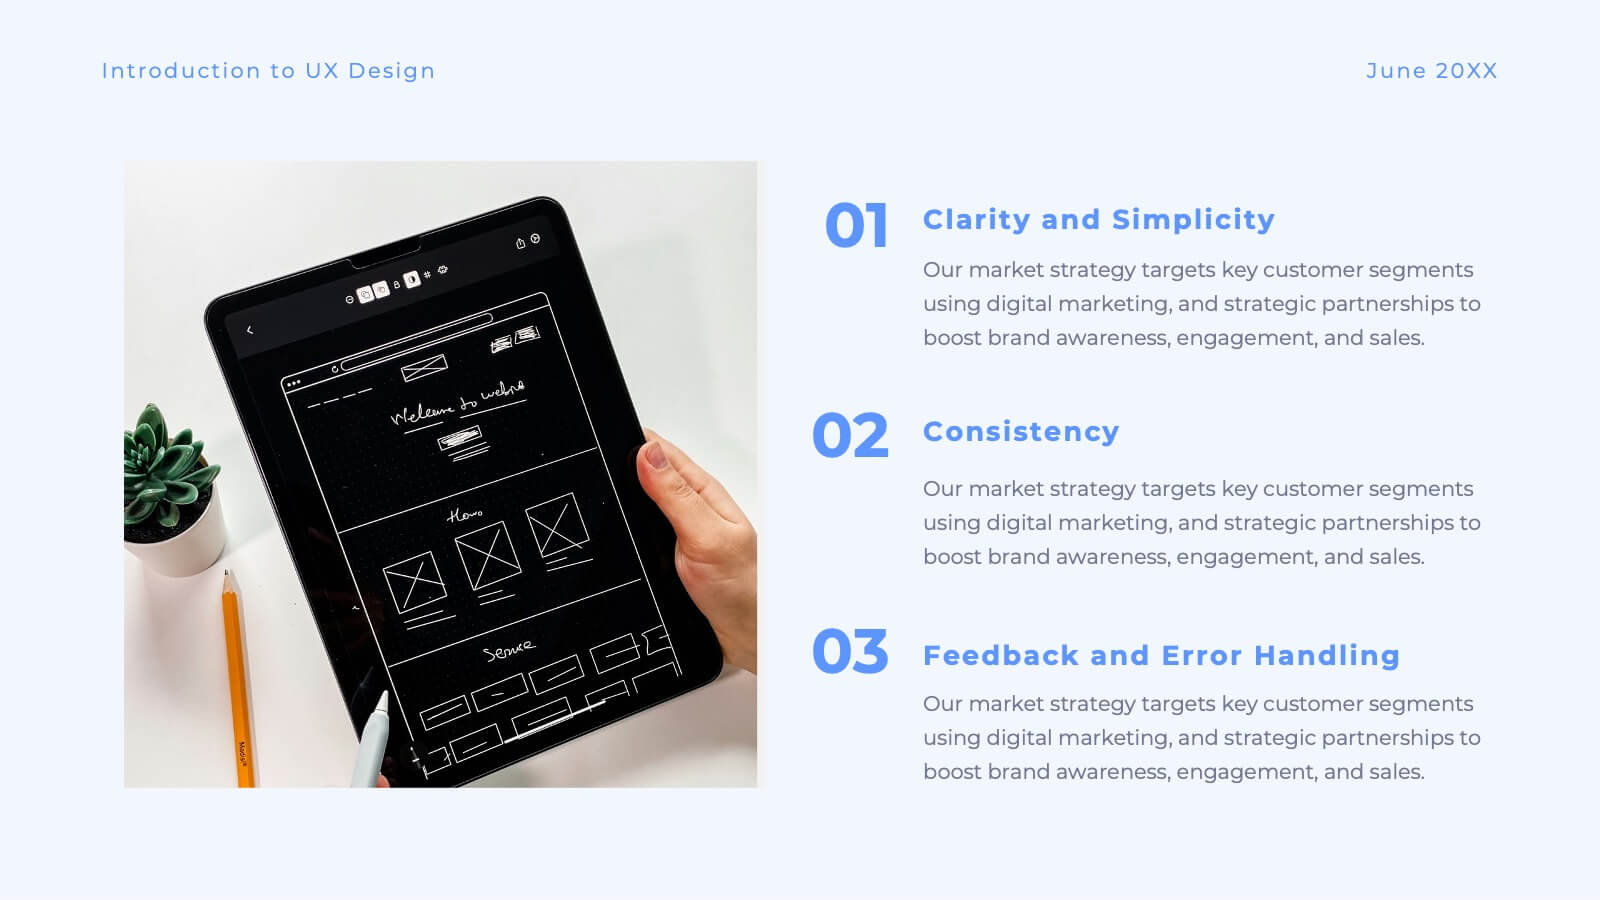
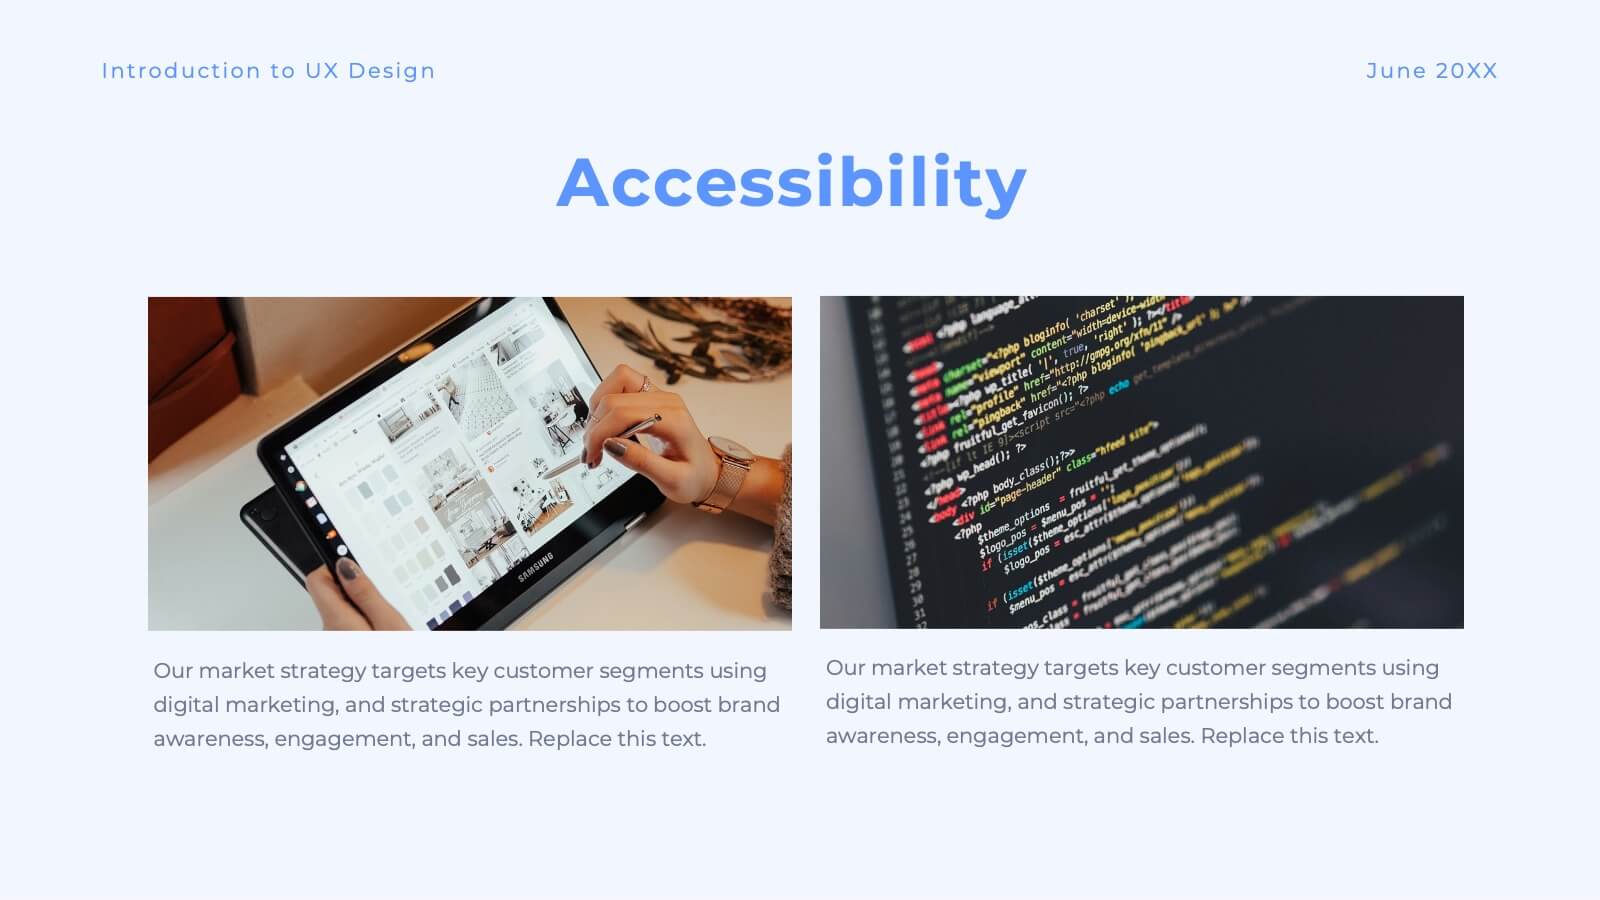
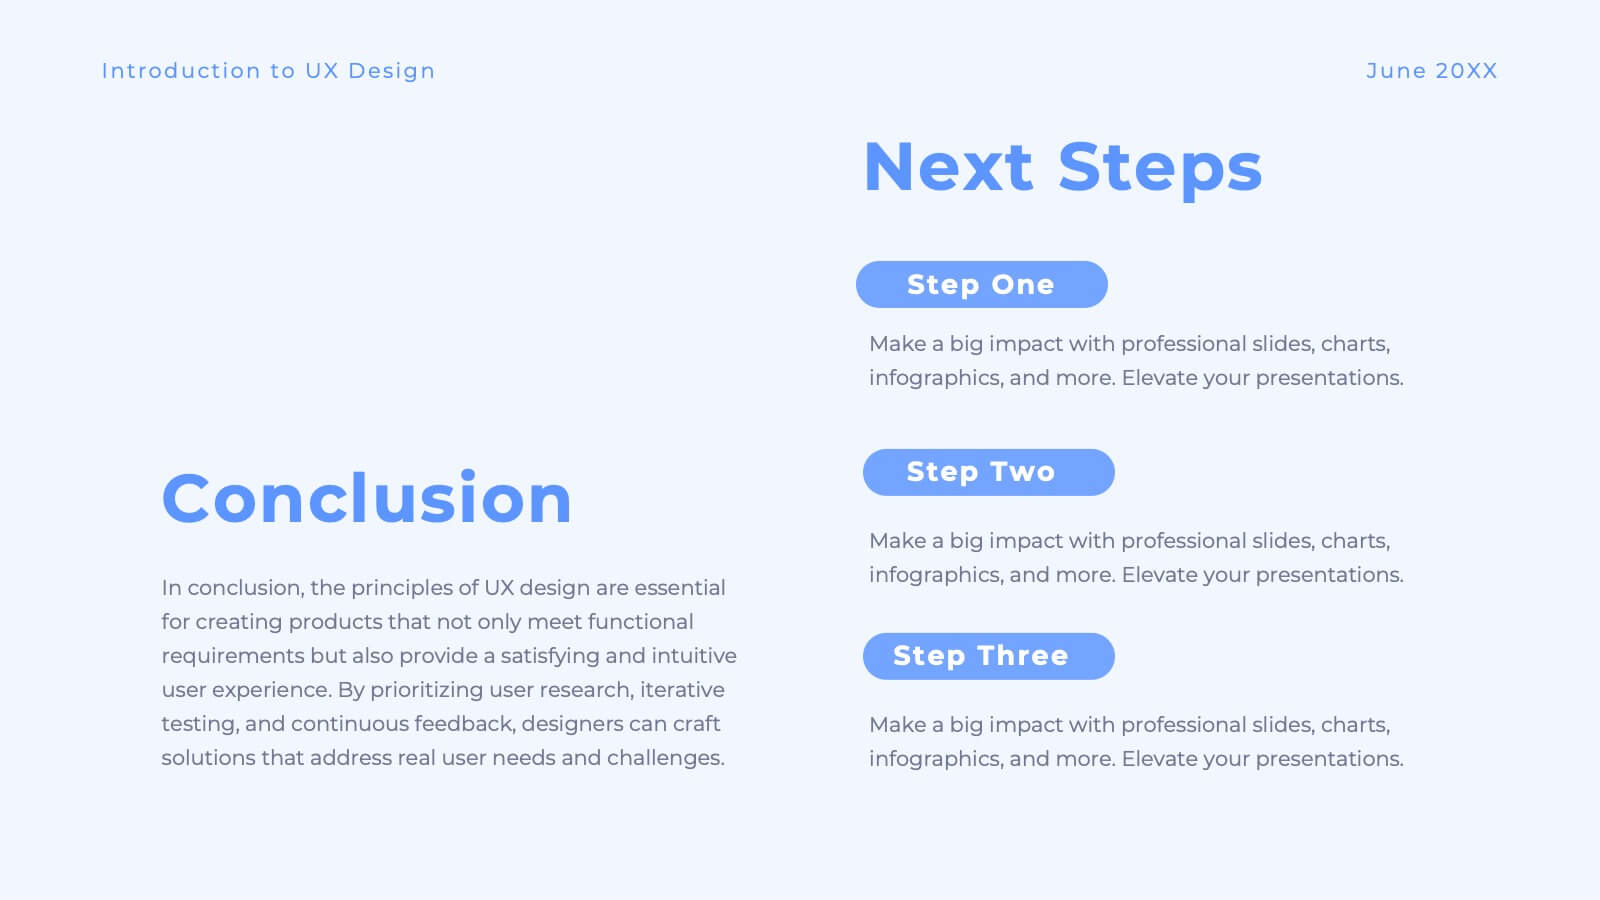
Luster UX Strategy Plan Presentation
Enhance user experience with this comprehensive UX strategy template! Perfect for outlining user research, personas, and design principles. Ideal for UX/UI designers aiming to present their strategies effectively. Compatible with PowerPoint, Keynote, and Google Slides, this template ensures your UX presentations are clear, professional, and impactful. Create exceptional user experiences today!


20 slides
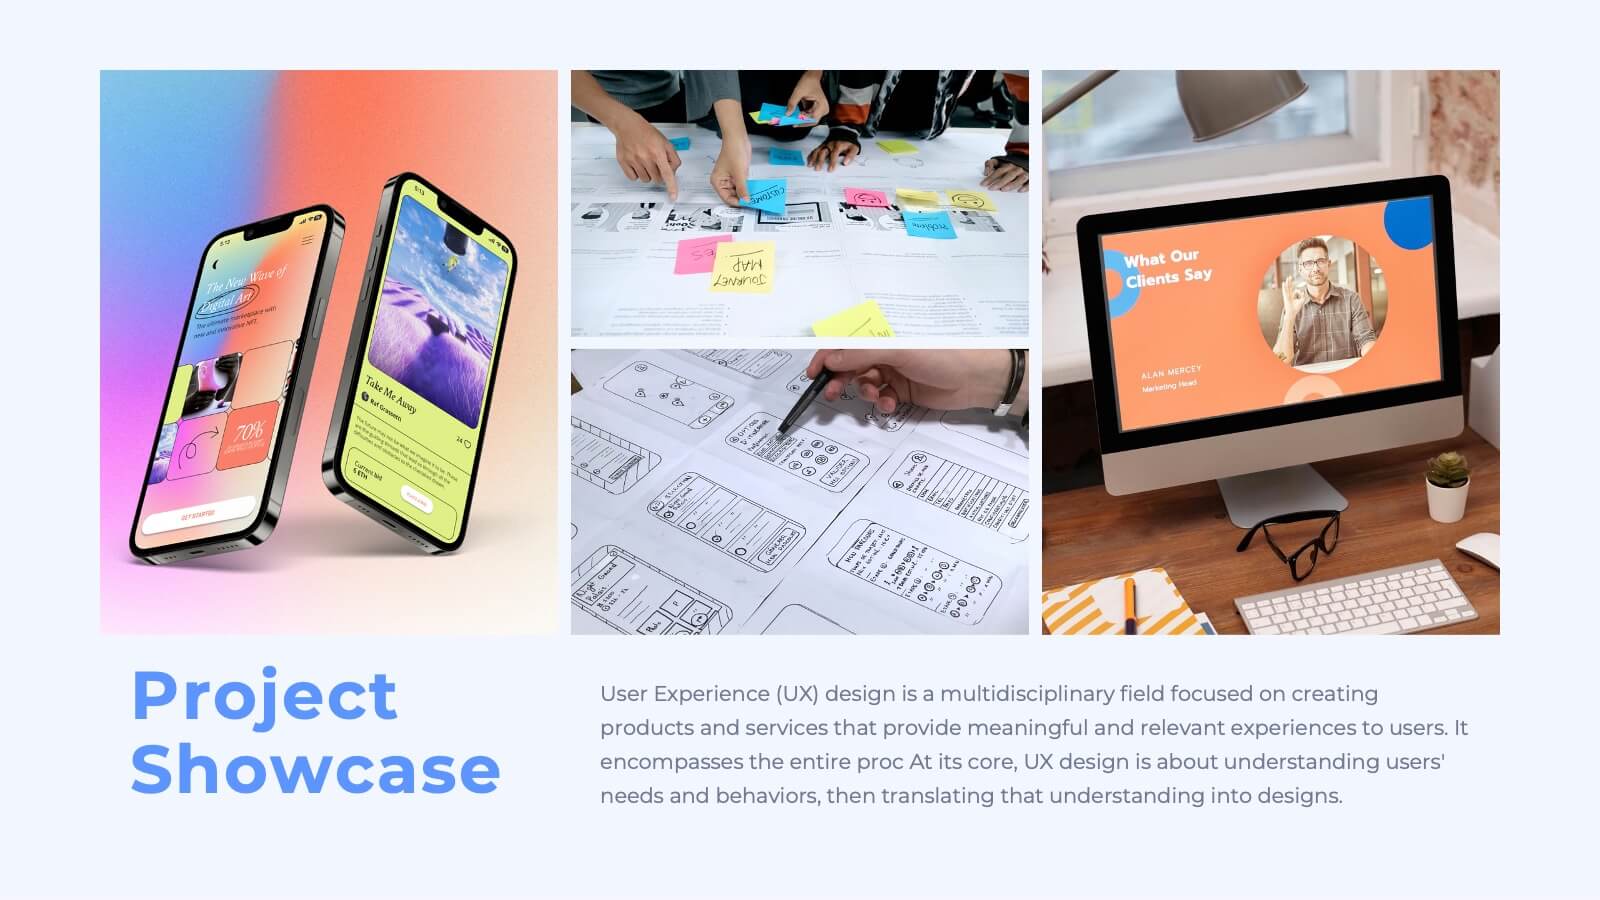
Noctara Professional Portfolio Showcase Presentation
Display your portfolio with flair using this bold and modern presentation template. Designed for professionals, it includes slides for portfolio overviews, philosophies, and featured works, allowing you to effectively highlight your expertise and creative process. With sections for services offered, pricing and fees, and client testimonials, this template enables you to present your offerings in a clear and organized manner. The clean and dynamic design ensures your work takes center stage, making it ideal for creative professionals, agencies, and freelancers. Fully editable and compatible with PowerPoint, Google Slides, and Keynote, this template provides the flexibility you need to personalize it to your style and branding. Perfect for impressing clients or potential collaborators.


10 slides
Modern Agriculture Industry Trends Presentation
Stay ahead in the evolving agricultural landscape with the Modern Agriculture Industry Trends infographic. This visually compelling template highlights key advancements, sustainability efforts, and technology-driven solutions shaping the industry. Fully editable and compatible with PowerPoint, Keynote, and Google Slides.


5 slides
Business Innovations Strategy Presentation
Bring your next big idea to life with this modern, visually engaging presentation. Perfect for showcasing creative strategies, innovation frameworks, and growth opportunities, it helps you present your concepts with clarity and flow. Fully customizable and compatible with PowerPoint, Keynote, and Google Slides for a smooth professional experience.


5 slides
New Venture Pitch Deck Structure Presentation
Outline your pitch with clarity using the New Venture Pitch Deck Structure Presentation. Designed for startups and entrepreneurs, this vertical timeline layout helps you present key sections like business model, problem/solution, and go-to-market strategy. Fully editable in PowerPoint, Canva, and Google Slides to fit your branding needs.


26 slides
Sophia Presentation Template
Sophia is a feminine template with a colorful presentation that is simple, clean and organized to make any information stand out. Sophia is suitable for personal projects as well as anyone looking for a presentation for their business. It's equipped to keep your content and layout consistent. The theme is eye catching with the colors, images and font. Anyone who has a bakery would love this template. Editing features make it easy to customize for your own needs by adding company logos, product information and other relevant details on your template. It is lightweight, fast and easy to use.


5 slides
Employee Onboarding HR Presentation
Start your presentation with energy and clarity using this clean, engaging slide designed to simplify every step of the onboarding journey. It helps explain employee integration, training stages, and team alignment in a way that feels intuitive and visually organized. Fully compatible with PowerPoint, Keynote, and Google Slides.


7 slides
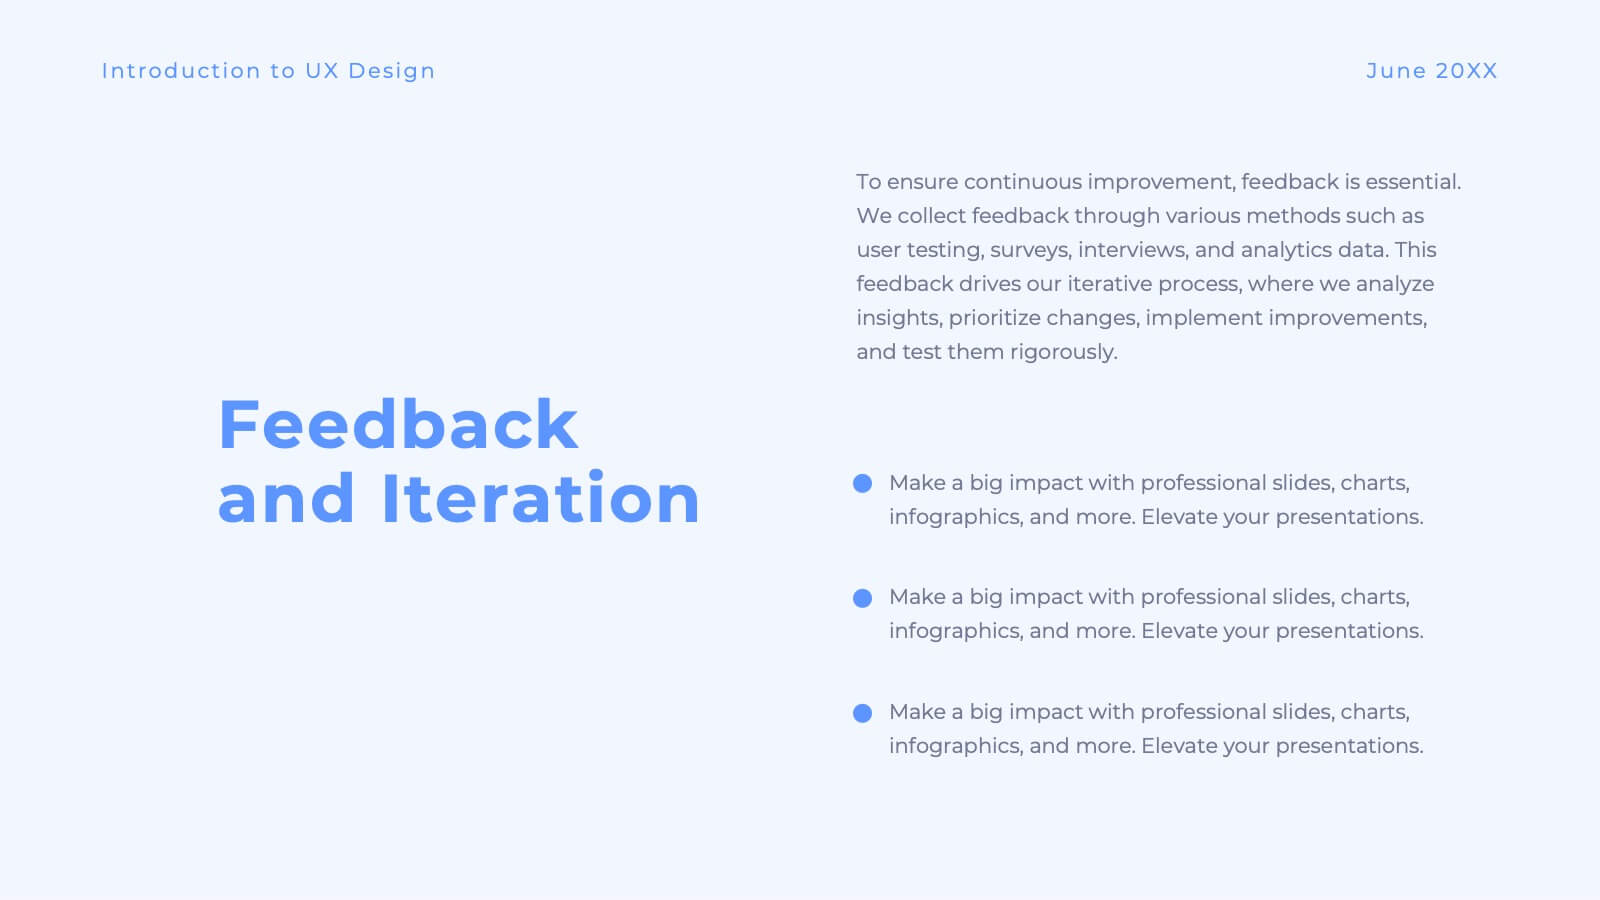
Feedback Management Infographic
Boost your presentation's impact with our Feedback Management infographic, optimized for Powerpoint, Keynote, and Google Slides. This infographic is an essential asset for professionals looking to present feedback data compellingly and concisely. Designed to convey customer satisfaction metrics and responses effectively, it's perfect for market researchers, customer service managers, and business analysts. The Feedback Management infographic is constructed to visually communicate the importance of customer insights and how they drive business improvements. It transforms complex data into an easy-to-understand format, which is crucial for making informed decisions based on customer feedback. The infographic's structured design assists audiences in comprehending the collected feedback at a glance, highlighting key figures and trends. Whether you're reporting on survey results or showcasing customer reviews, this infographic ensures your data is presented clearly. Compatible with leading presentation software, it allows for smooth integration into your slides, ensuring your feedback analysis stands out. Incorporate this infographic into your presentations to effectively display feedback management data and make a lasting impression.


6 slides
Business Challenges and Solutions Presentation
Address challenges with strategic solutions using this Business Challenges and Solutions template. Featuring a clear side-by-side layout, this design helps visualize business obstacles and their corresponding solutions for effective decision-making. Perfect for problem-solving discussions, strategy meetings, and brainstorming sessions, this template ensures your content remains structured and impactful. Fully customizable for PowerPoint, Keynote, and Google Slides.


4 slides
Team Relationship Structure Presentation
Show your organization’s hierarchy with clarity and style using this modern visual layout. Ideal for illustrating team dynamics, reporting lines, or company roles, it helps simplify complex structures into easy-to-follow visuals. Fully customizable and compatible with PowerPoint, Keynote, and Google Slides for seamless editing and professional presentation design.


21 slides
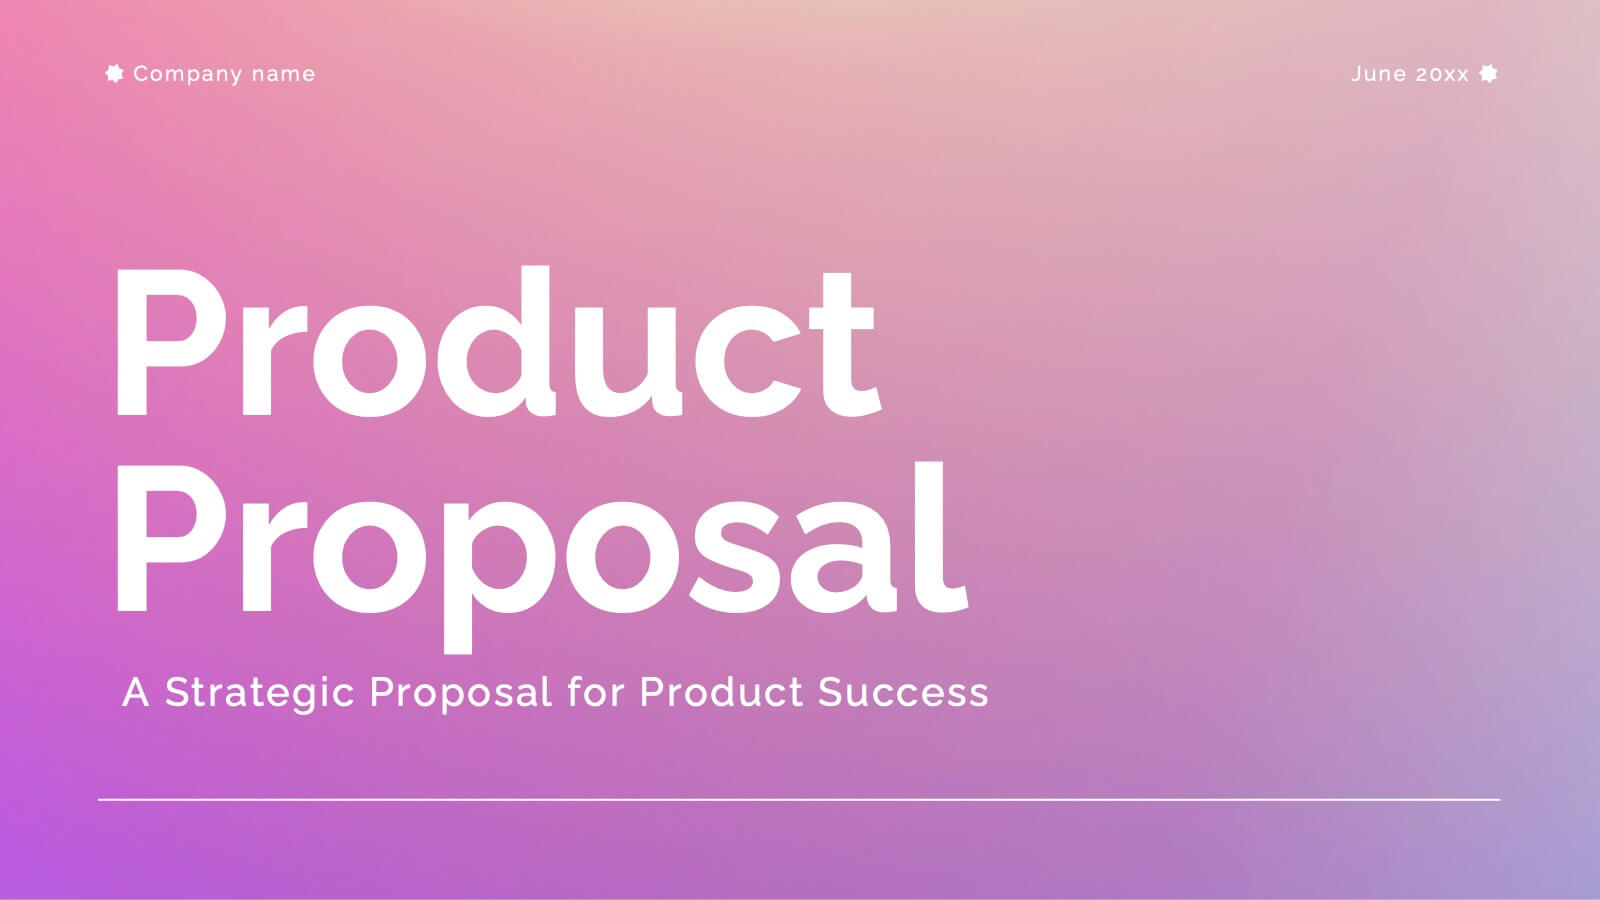
Aventurine New Product Proposal Presentation
Showcase your product in style with this vibrant and modern product proposal template! It covers everything from product features to target market, pricing strategy, and marketing plans. Designed for clarity and impact, it's perfect for pitching your product. Fully customizable, and compatible with PowerPoint, Keynote, and Google Slides for seamless presentations.


3 slides
Designing a Loyalty Program Presentation
Build stronger customer connections with a sleek, modern layout that highlights how reward systems drive retention and engagement. This design is perfect for visualizing loyalty strategies, program tiers, and user benefits with clarity and style. Fully editable and compatible with PowerPoint, Keynote, and Google Slides for effortless customization.


20 slides
Falcon Digital Marketing Strategy Plan Presentation
Develop a winning marketing strategy with this dynamic template. Dive into current trends, consumer behavior, and innovative techniques. Perfect for social media, influencer marketing, and data-driven campaigns. Fully compatible with PowerPoint, Keynote, and Google Slides.


21 slides
Vortexia Small Business Pitch Deck Presentation
Deliver an impressive pitch with a modern and sleek presentation template tailored for small businesses. Dive into critical aspects like team updates, current projects overview, and key achievements to showcase progress and potential. Address challenges and solutions in a structured way, while outlining departmental goals and performance metrics for transparency. The template includes slides for resource allocation, collaboration opportunities, and training and development strategies, ensuring a comprehensive narrative. Use the process improvement and feedback and suggestions sections to invite engagement and innovation. With fully editable slides, this template is compatible with PowerPoint, Google Slides, and Keynote, offering a polished and professional platform to highlight your business strengths and future plans. Perfect for entrepreneurs and small businesses ready to captivate stakeholders.