


Features
- 6 Unique slides
- Fully editable and easy to edit in Microsoft Powerpoint, Keynote and Google Slides
- 16:9 widescreen layout
- Clean and professional designs
- Export to JPG, PDF or send by email


Do you have any questions?
Recommend


21 slides
Thunderbird Small Business Pitch Deck Presentation
Take flight with this dynamic Thunderbird-inspired presentation, perfect for pitching your small business! Designed to highlight your business model, market potential, and financial projections, this template ensures your pitch is clear, compelling, and professional. Its bold visuals will help you soar. Compatible with PowerPoint, Keynote, and Google Slides.

20 slides
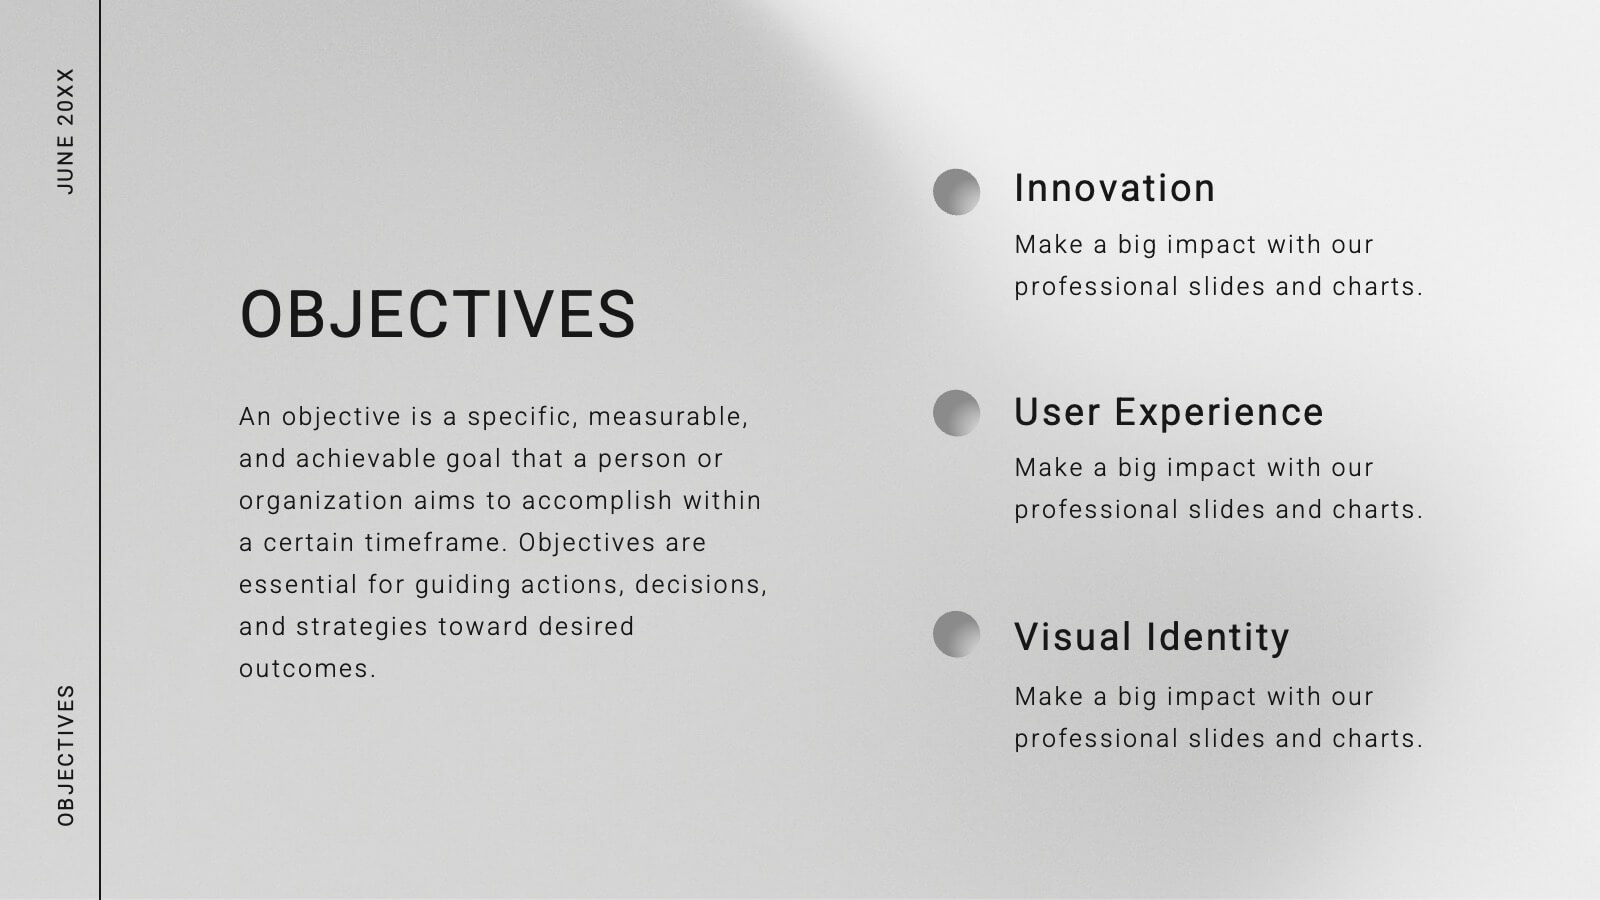
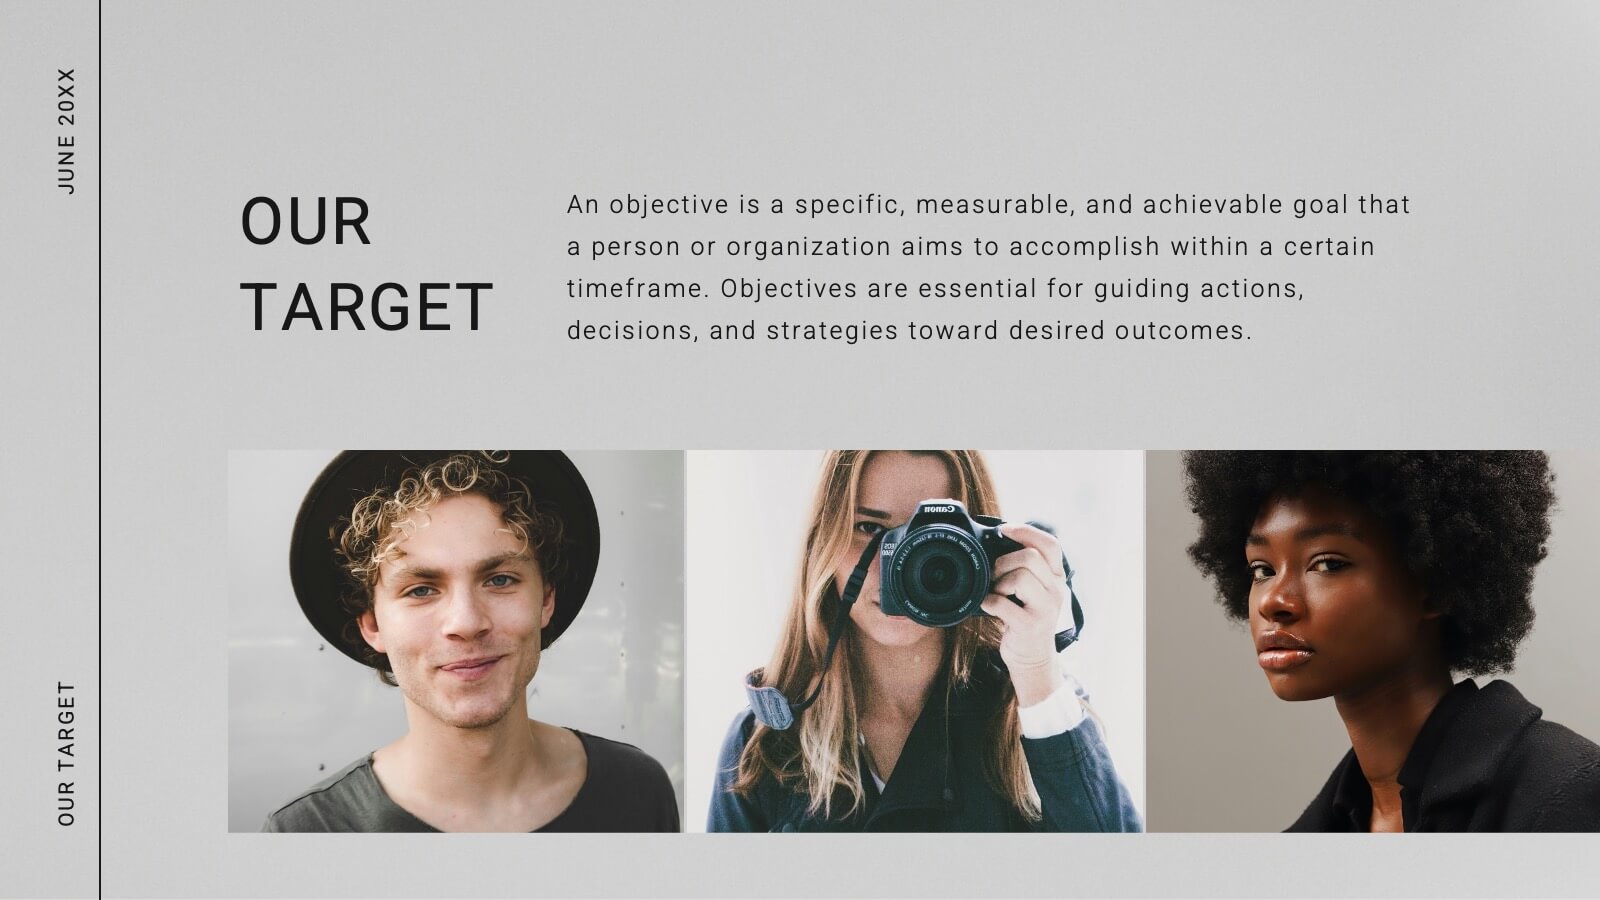
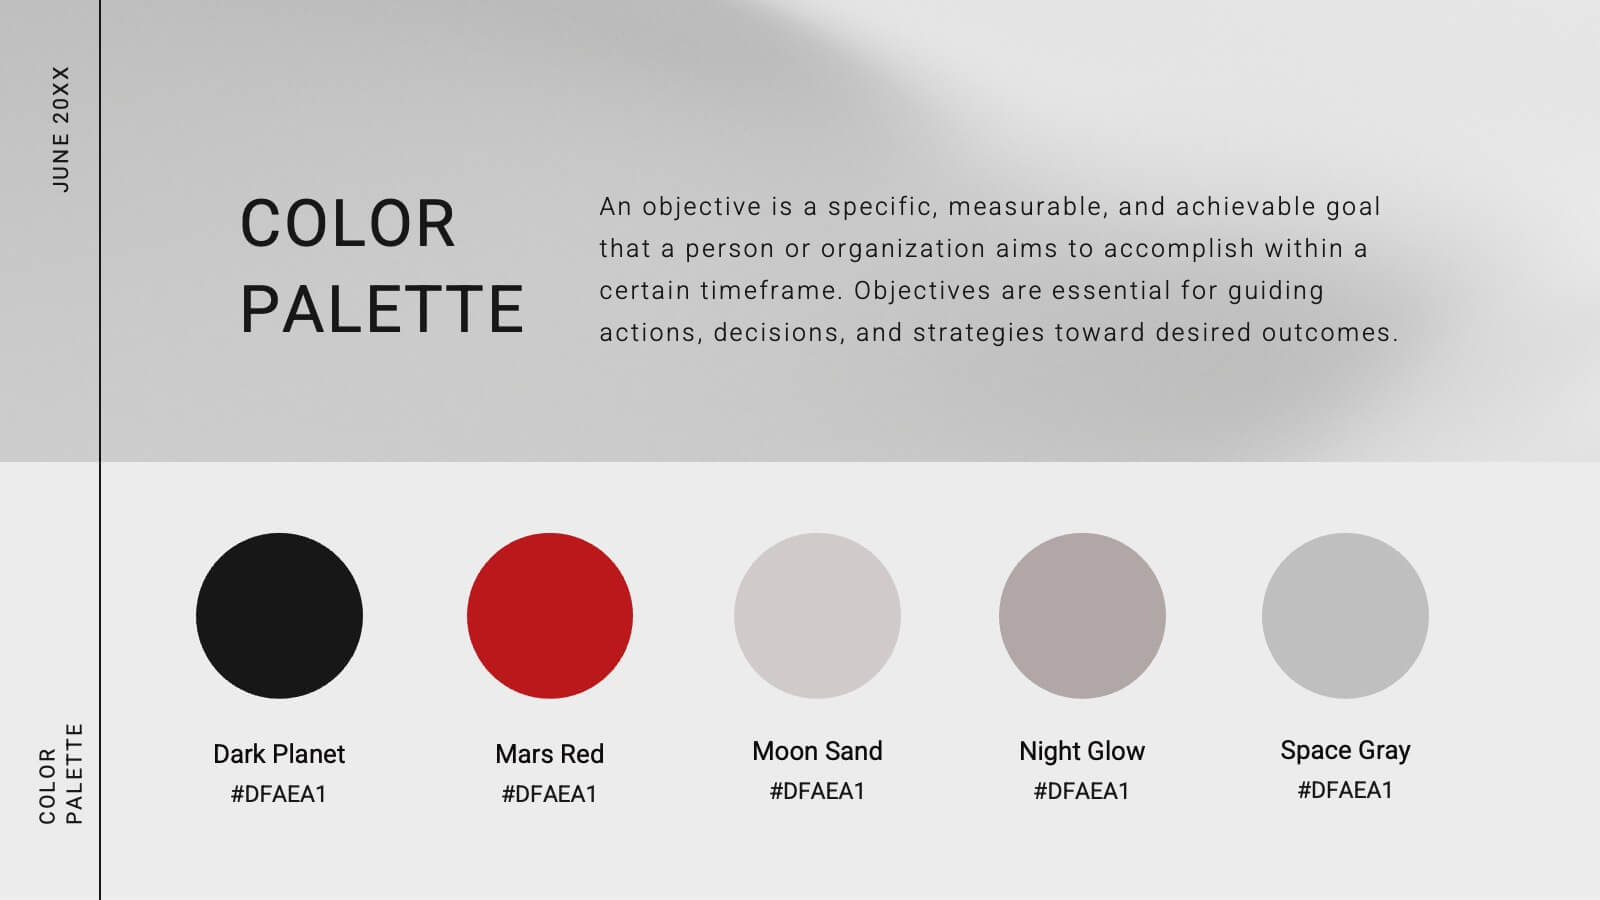
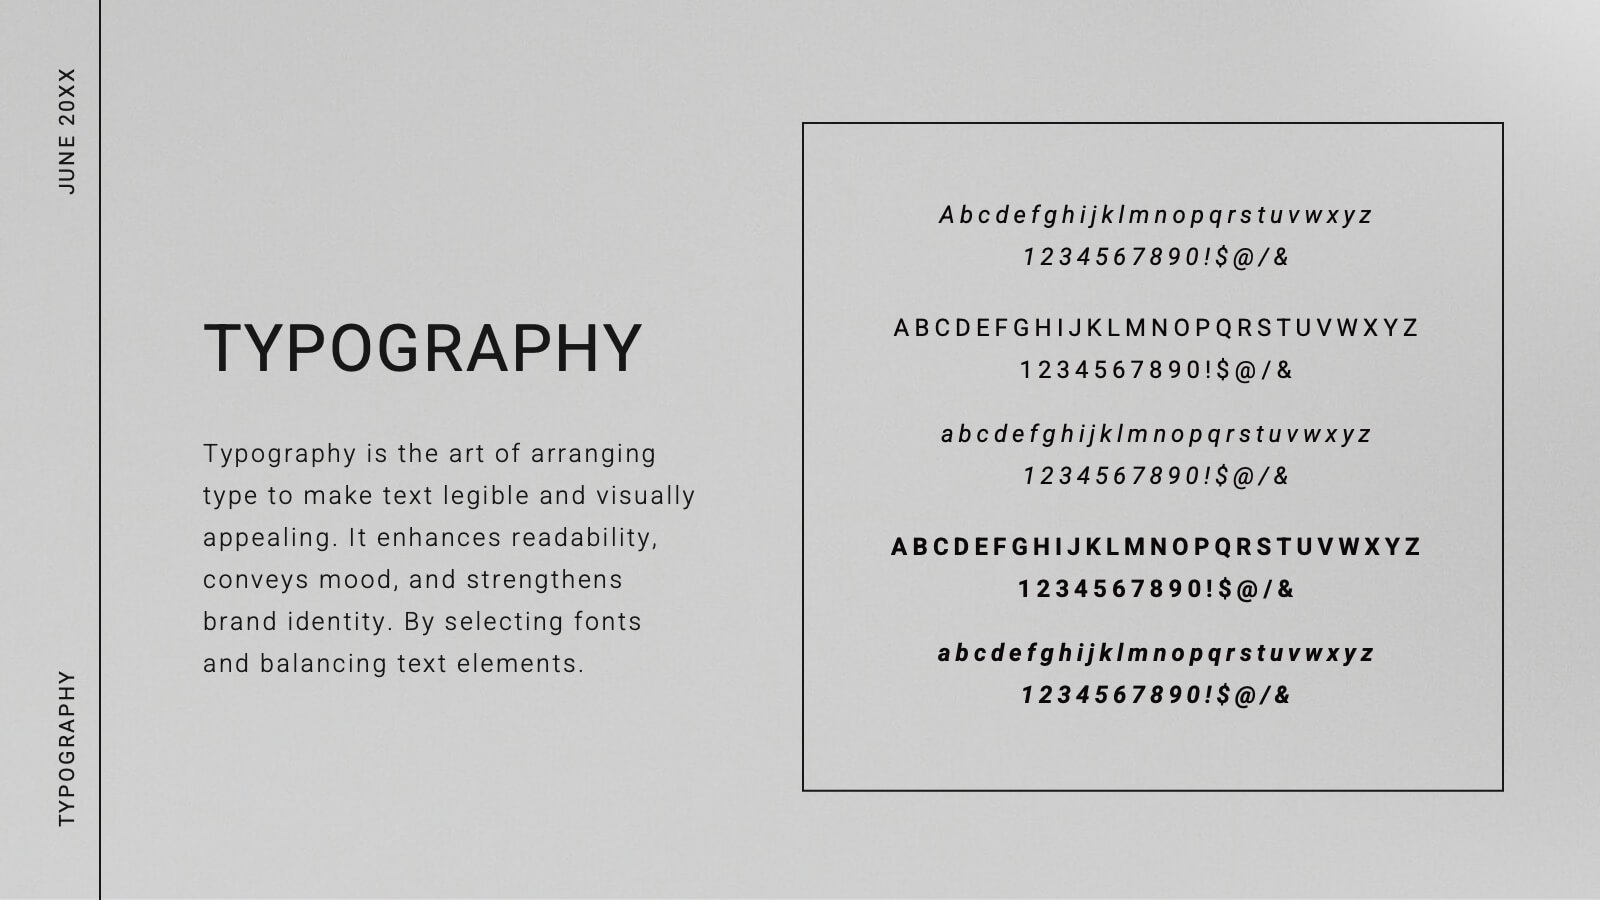
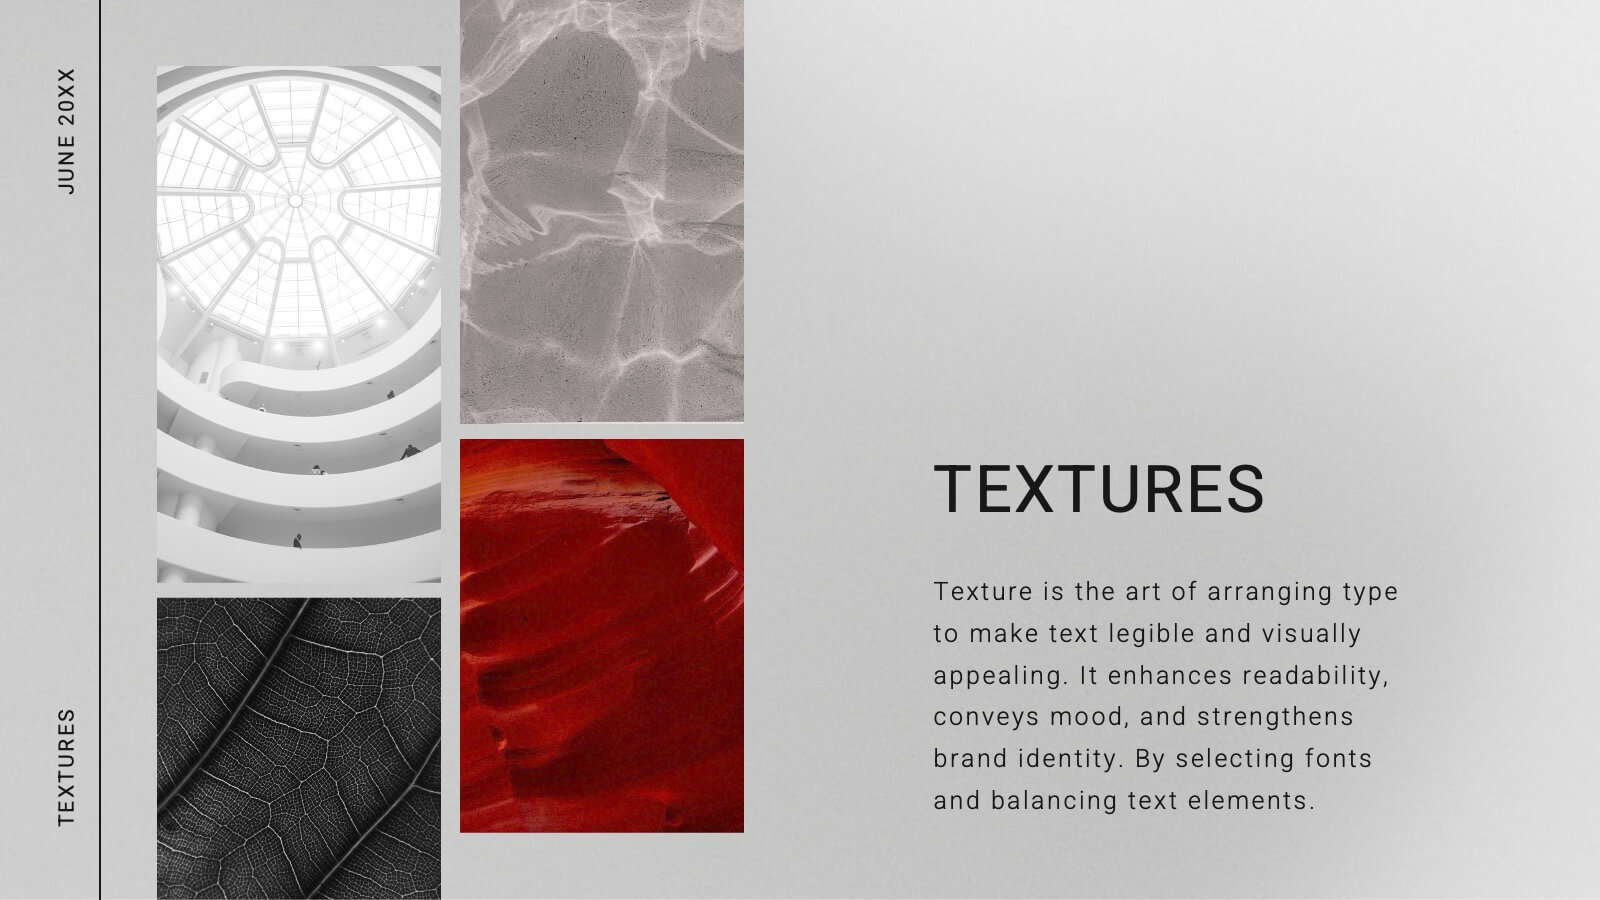
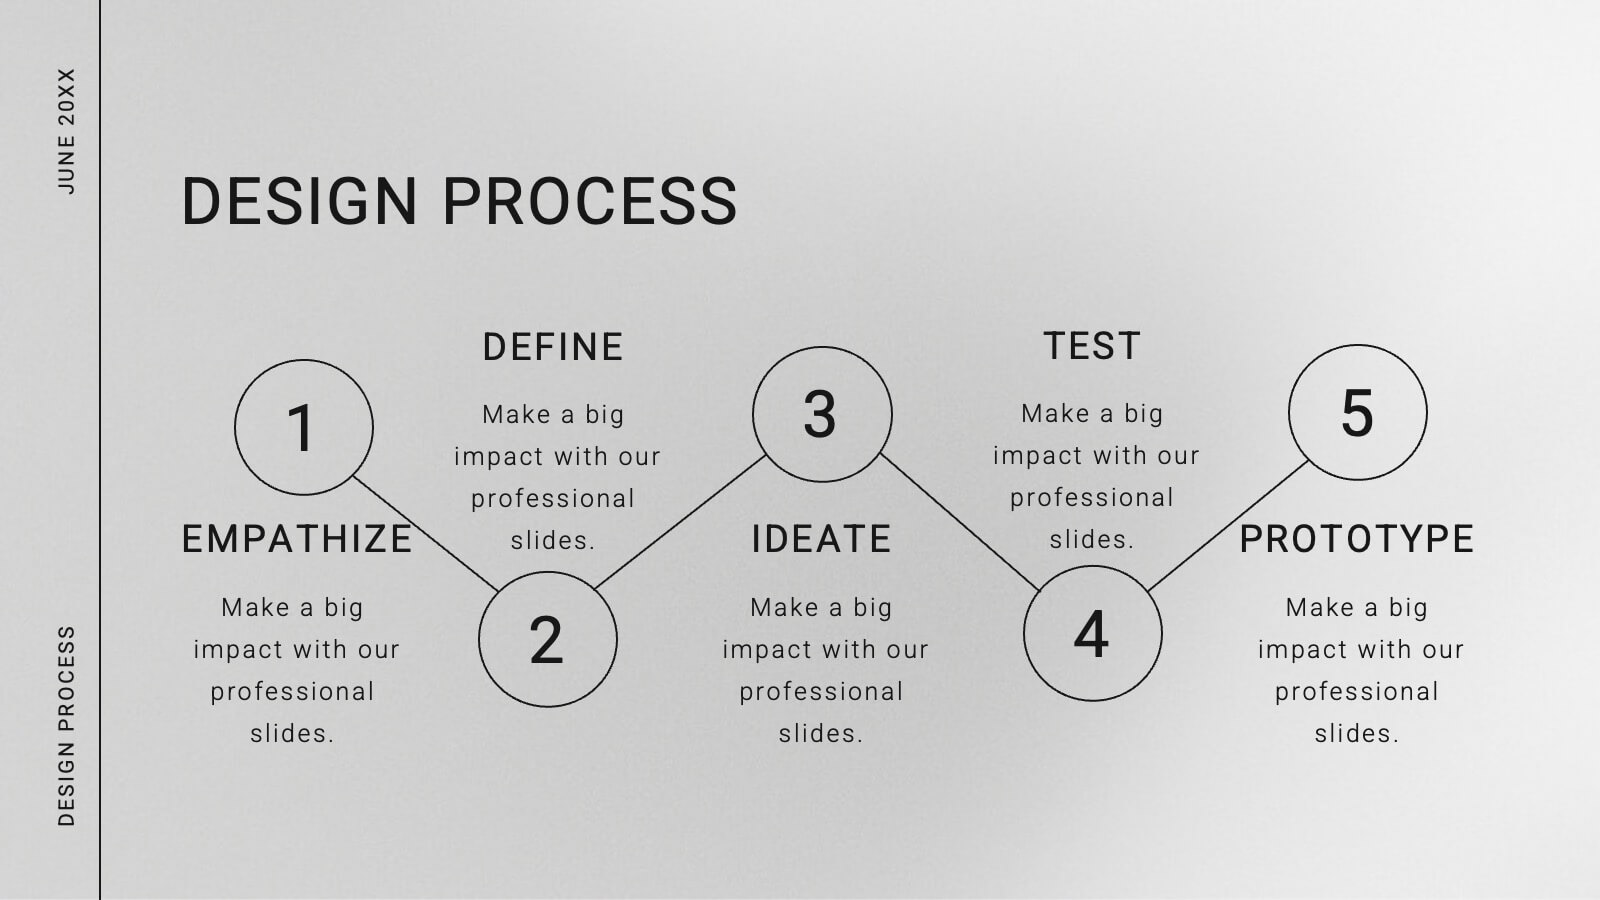
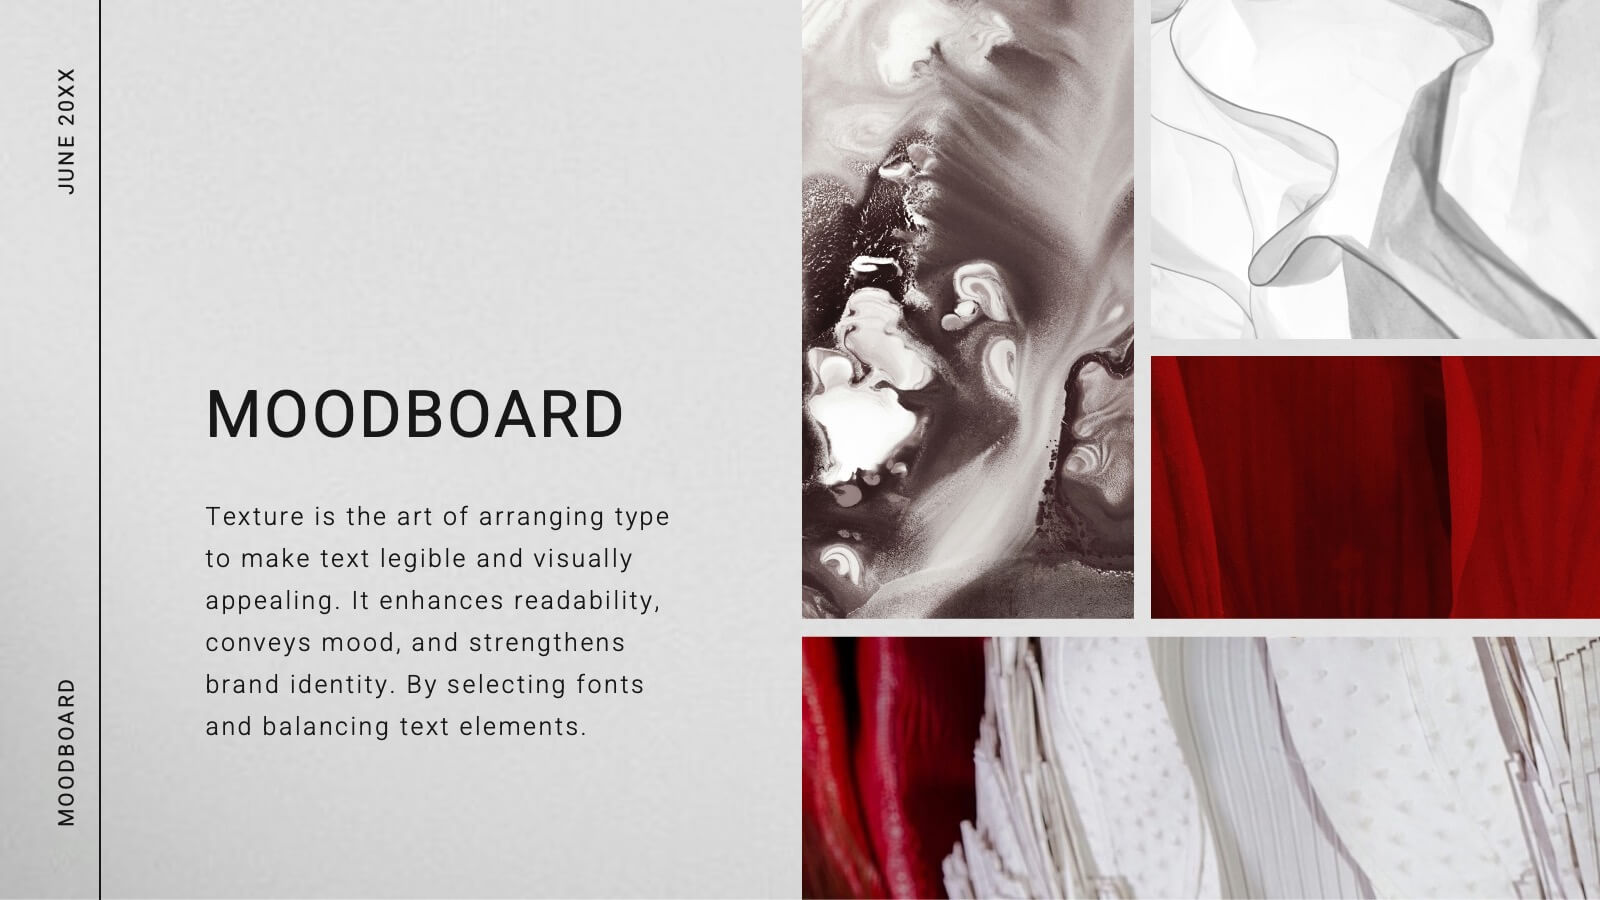
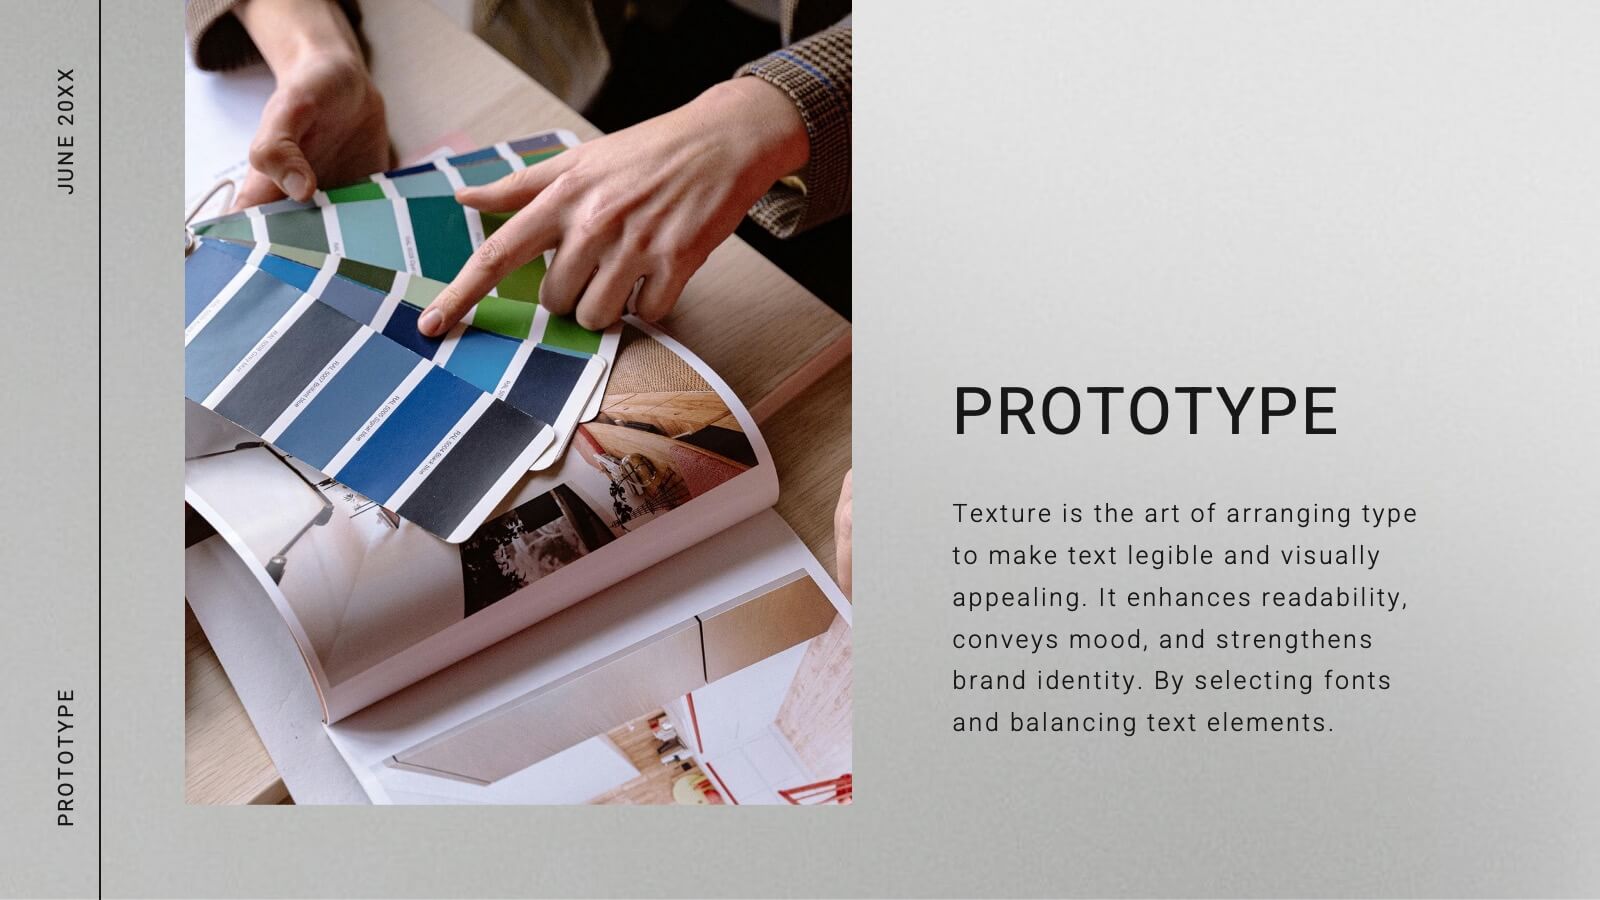
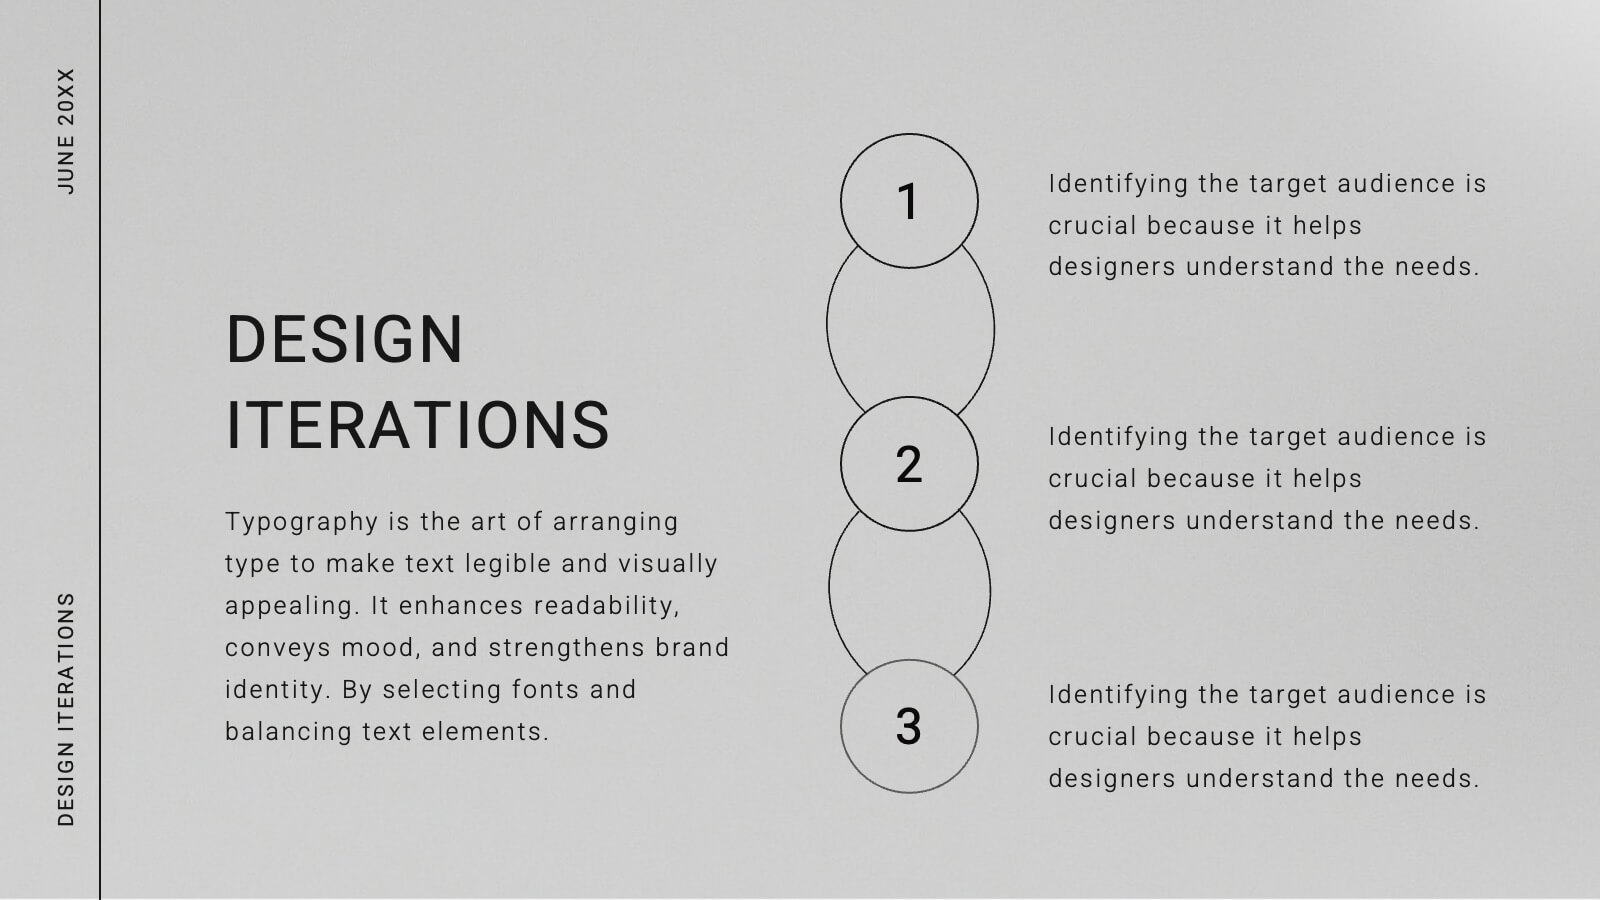
Comet Graphic Design Project Plan Presentation
Craft stunning design project presentations with this elegant template. Showcase objectives, processes, mood boards, and final designs effectively. Ideal for creative teams and clients. Fully compatible with PowerPoint, Keynote, and Google Slides.


5 slides
Relationship Mapping Diagram Presentation
Bring clarity to complex connections with this clean and modern visual layout designed to map relationships, processes, or ideas effortlessly. Perfect for presentations that require structure and flow, it balances simplicity with professionalism. Fully customizable and compatible with PowerPoint, Keynote, and Google Slides for seamless design flexibility.


4 slides
Investor-Ready Pitch for New Ventures Presentation
Make a lasting impression with the Investor-Ready Pitch for New Ventures Presentation. Designed to balance visuals with key stats, this template helps startups clearly communicate value to potential investors. Highlight milestones, team credibility, and market opportunity using bold typography and high-impact imagery. Fully editable in PowerPoint, Keynote, Google Slides, and Canva.


2 slides
Elegant Thank You Slide Presentation
Leave a lasting impression with this elegant thank-you slide template! Perfect for closing presentations with professionalism, this design features a modern layout with space for contact details and branding. Ideal for business meetings, pitches, and corporate events. Fully customizable and compatible with PowerPoint, Keynote, and Google Slides for seamless editing.


4 slides
Organizational Hierarchy Chart Presentation
A clear, engaging way to map out team structure, this presentation highlights how roles connect and flow across an organization. It visually simplifies reporting lines, helping audiences quickly understand leadership levels and team responsibilities. Perfect for planning, onboarding, or strategy discussions, and fully compatible with PowerPoint, Keynote, and Google Slides.


4 slides
Project Timeline & Milestone Presentation
Stay on track and visualize your progress with this Project Timeline & Milestone Presentation. Perfect for project managers and team leads, this template features a clean Gantt-style layout that spans multiple months, allowing you to clearly map out tasks, timelines, and key milestones. Use it to enhance stakeholder reporting or internal planning sessions. Fully editable in PowerPoint, Keynote, and Google Slides.


5 slides
Clean Water Access and Sustainability Goals Presentation
Visually track progress with the Clean Water Access and Sustainability Goals Presentation. This intuitive slide design uses water-filled glasses to represent four stages of development, making it perfect for sustainability metrics, public health initiatives, or project benchmarks. Fully customizable and compatible with PowerPoint, Keynote, Google Slides, and Canva.


5 slides
Financial and Growth Statistics
Present financial insights and growth metrics with impact using this visually engaging infographic. Ideal for showcasing revenue performance, profit trends, or investment results, this template keeps data clear and actionable. Fully customizable in PowerPoint, Keynote, and Google Slides to match your brand and strategy needs.


6 slides
5G Technology Rollout and Future Vision Presentation
From 1G to 5G, tell the story of progress with this visually engaging infographic slide. Perfect for showcasing mobile network evolution, telecom innovation, or digital transformation strategies, each stage is clearly marked for simple, informative storytelling. Fully compatible with PowerPoint, Keynote, and Google Slides for easy editing and seamless presentation.

21 slides
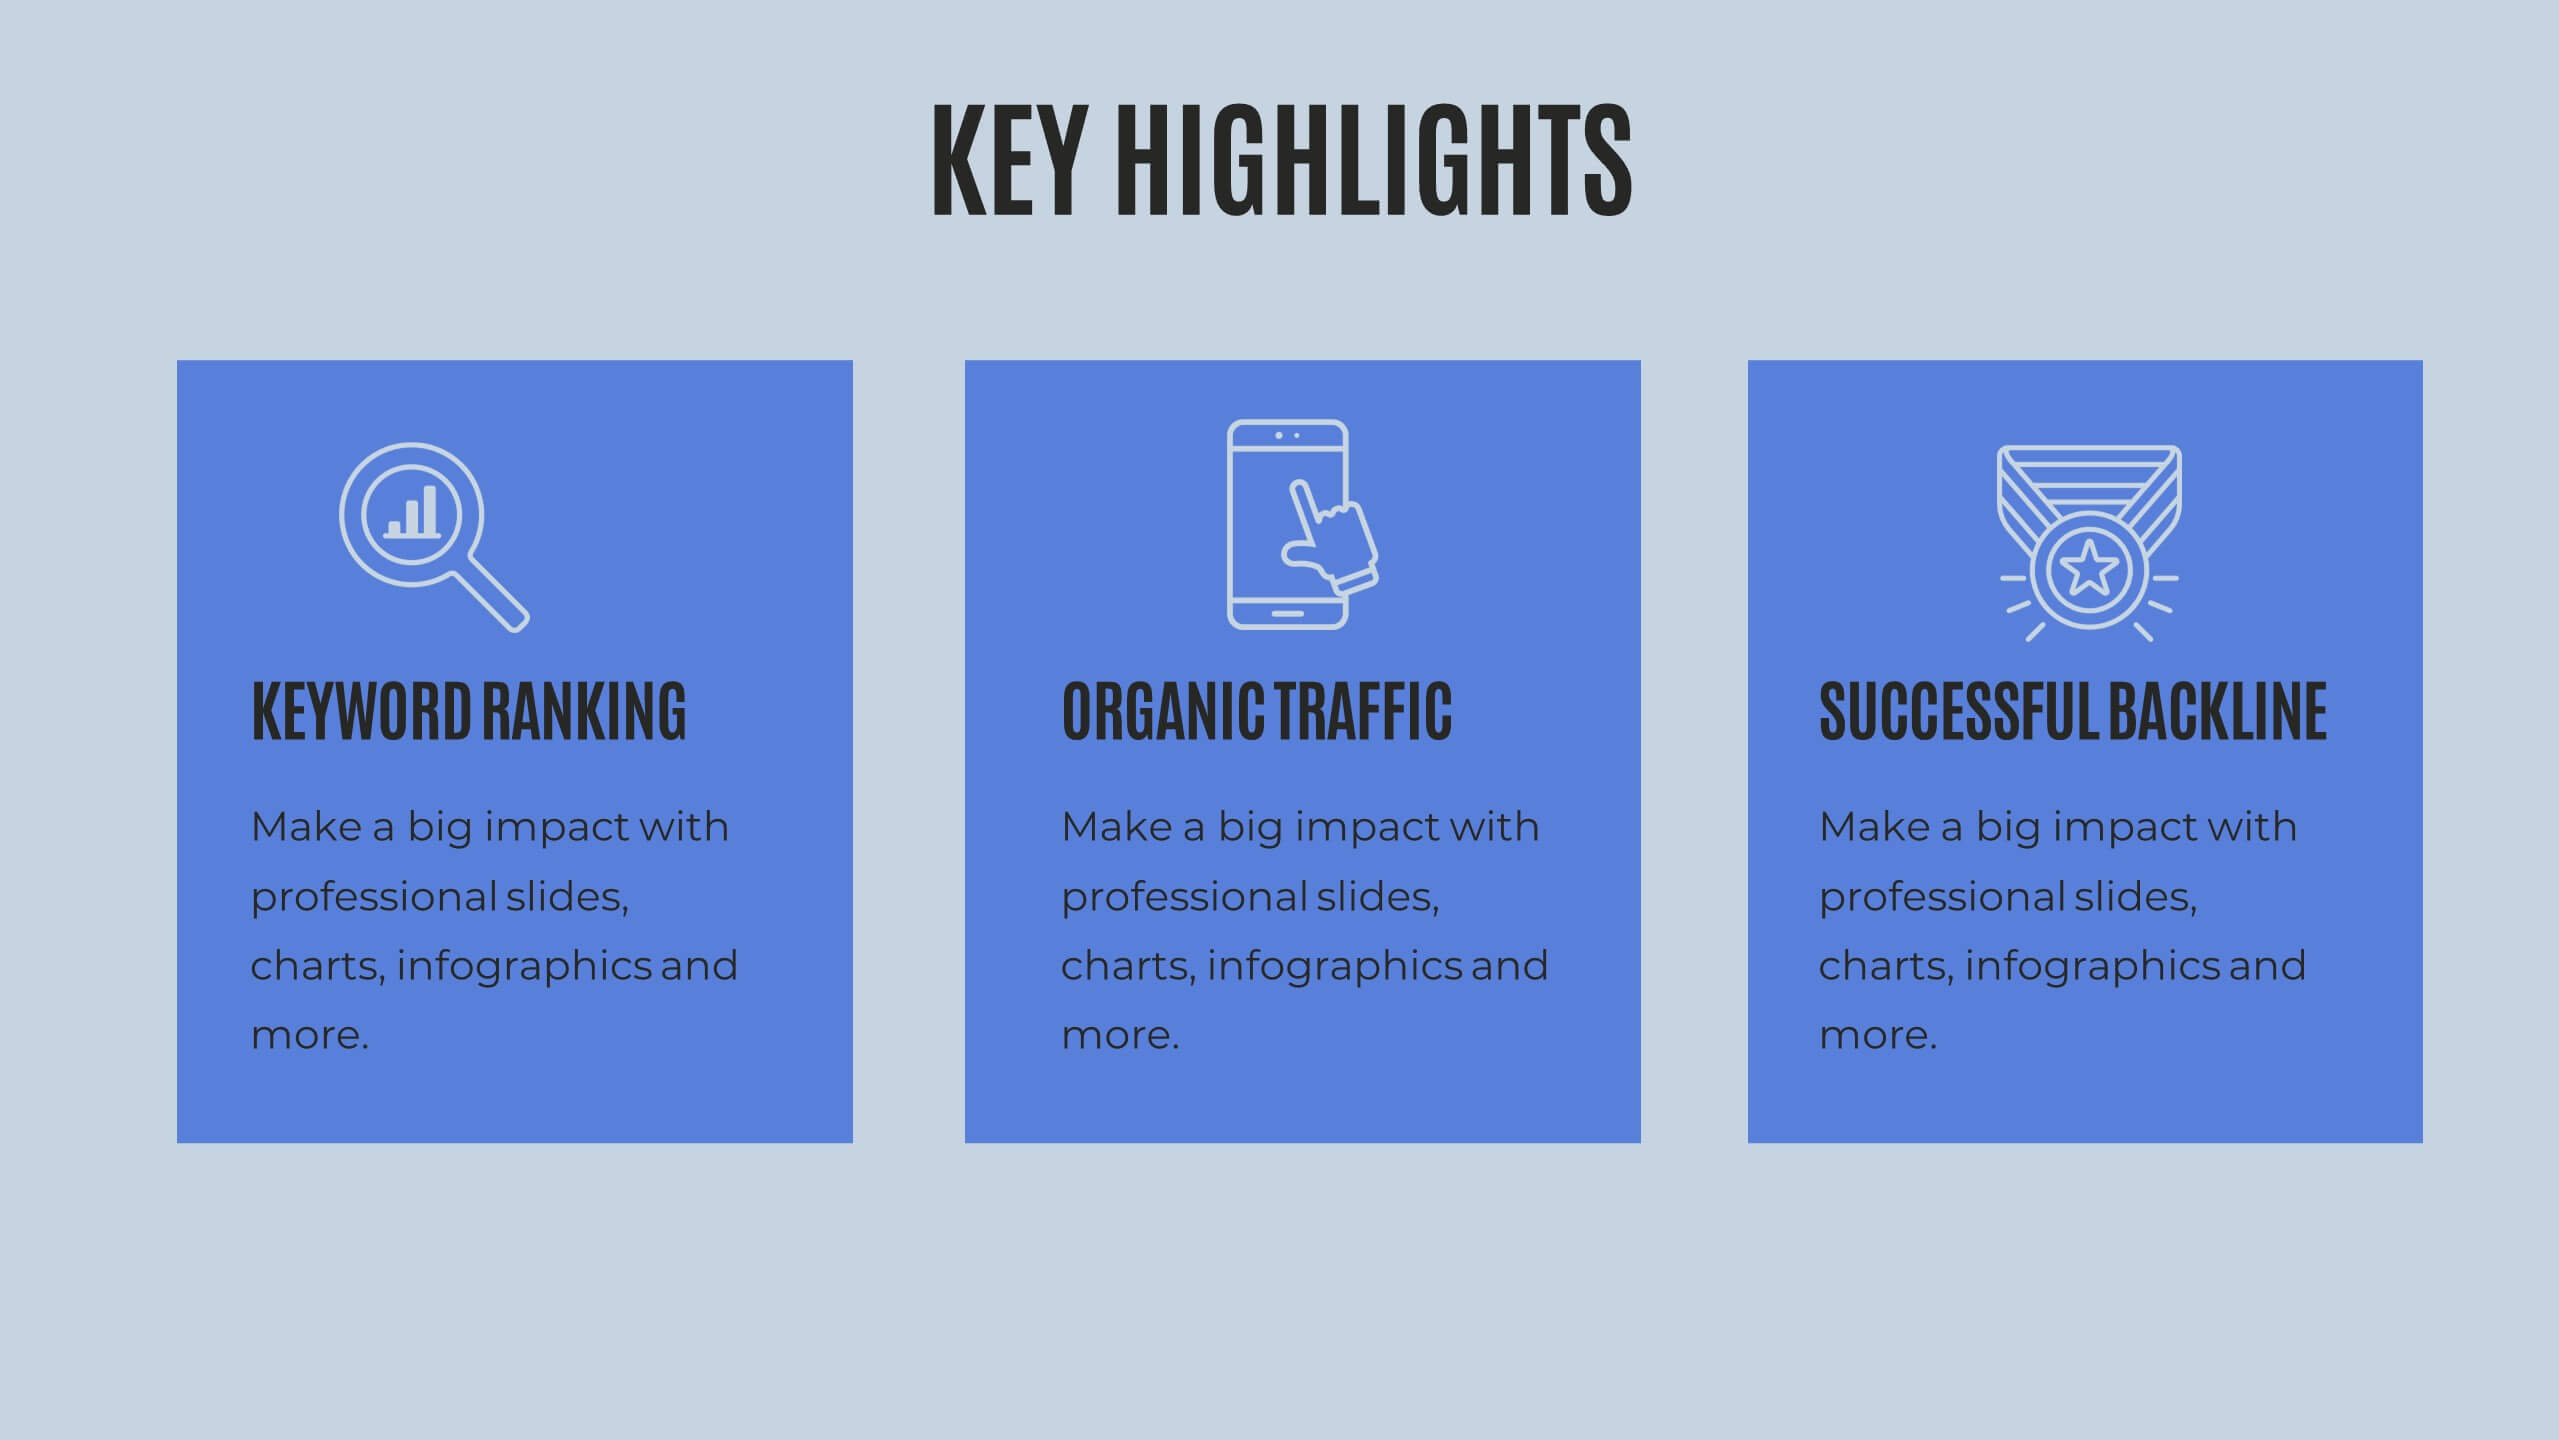
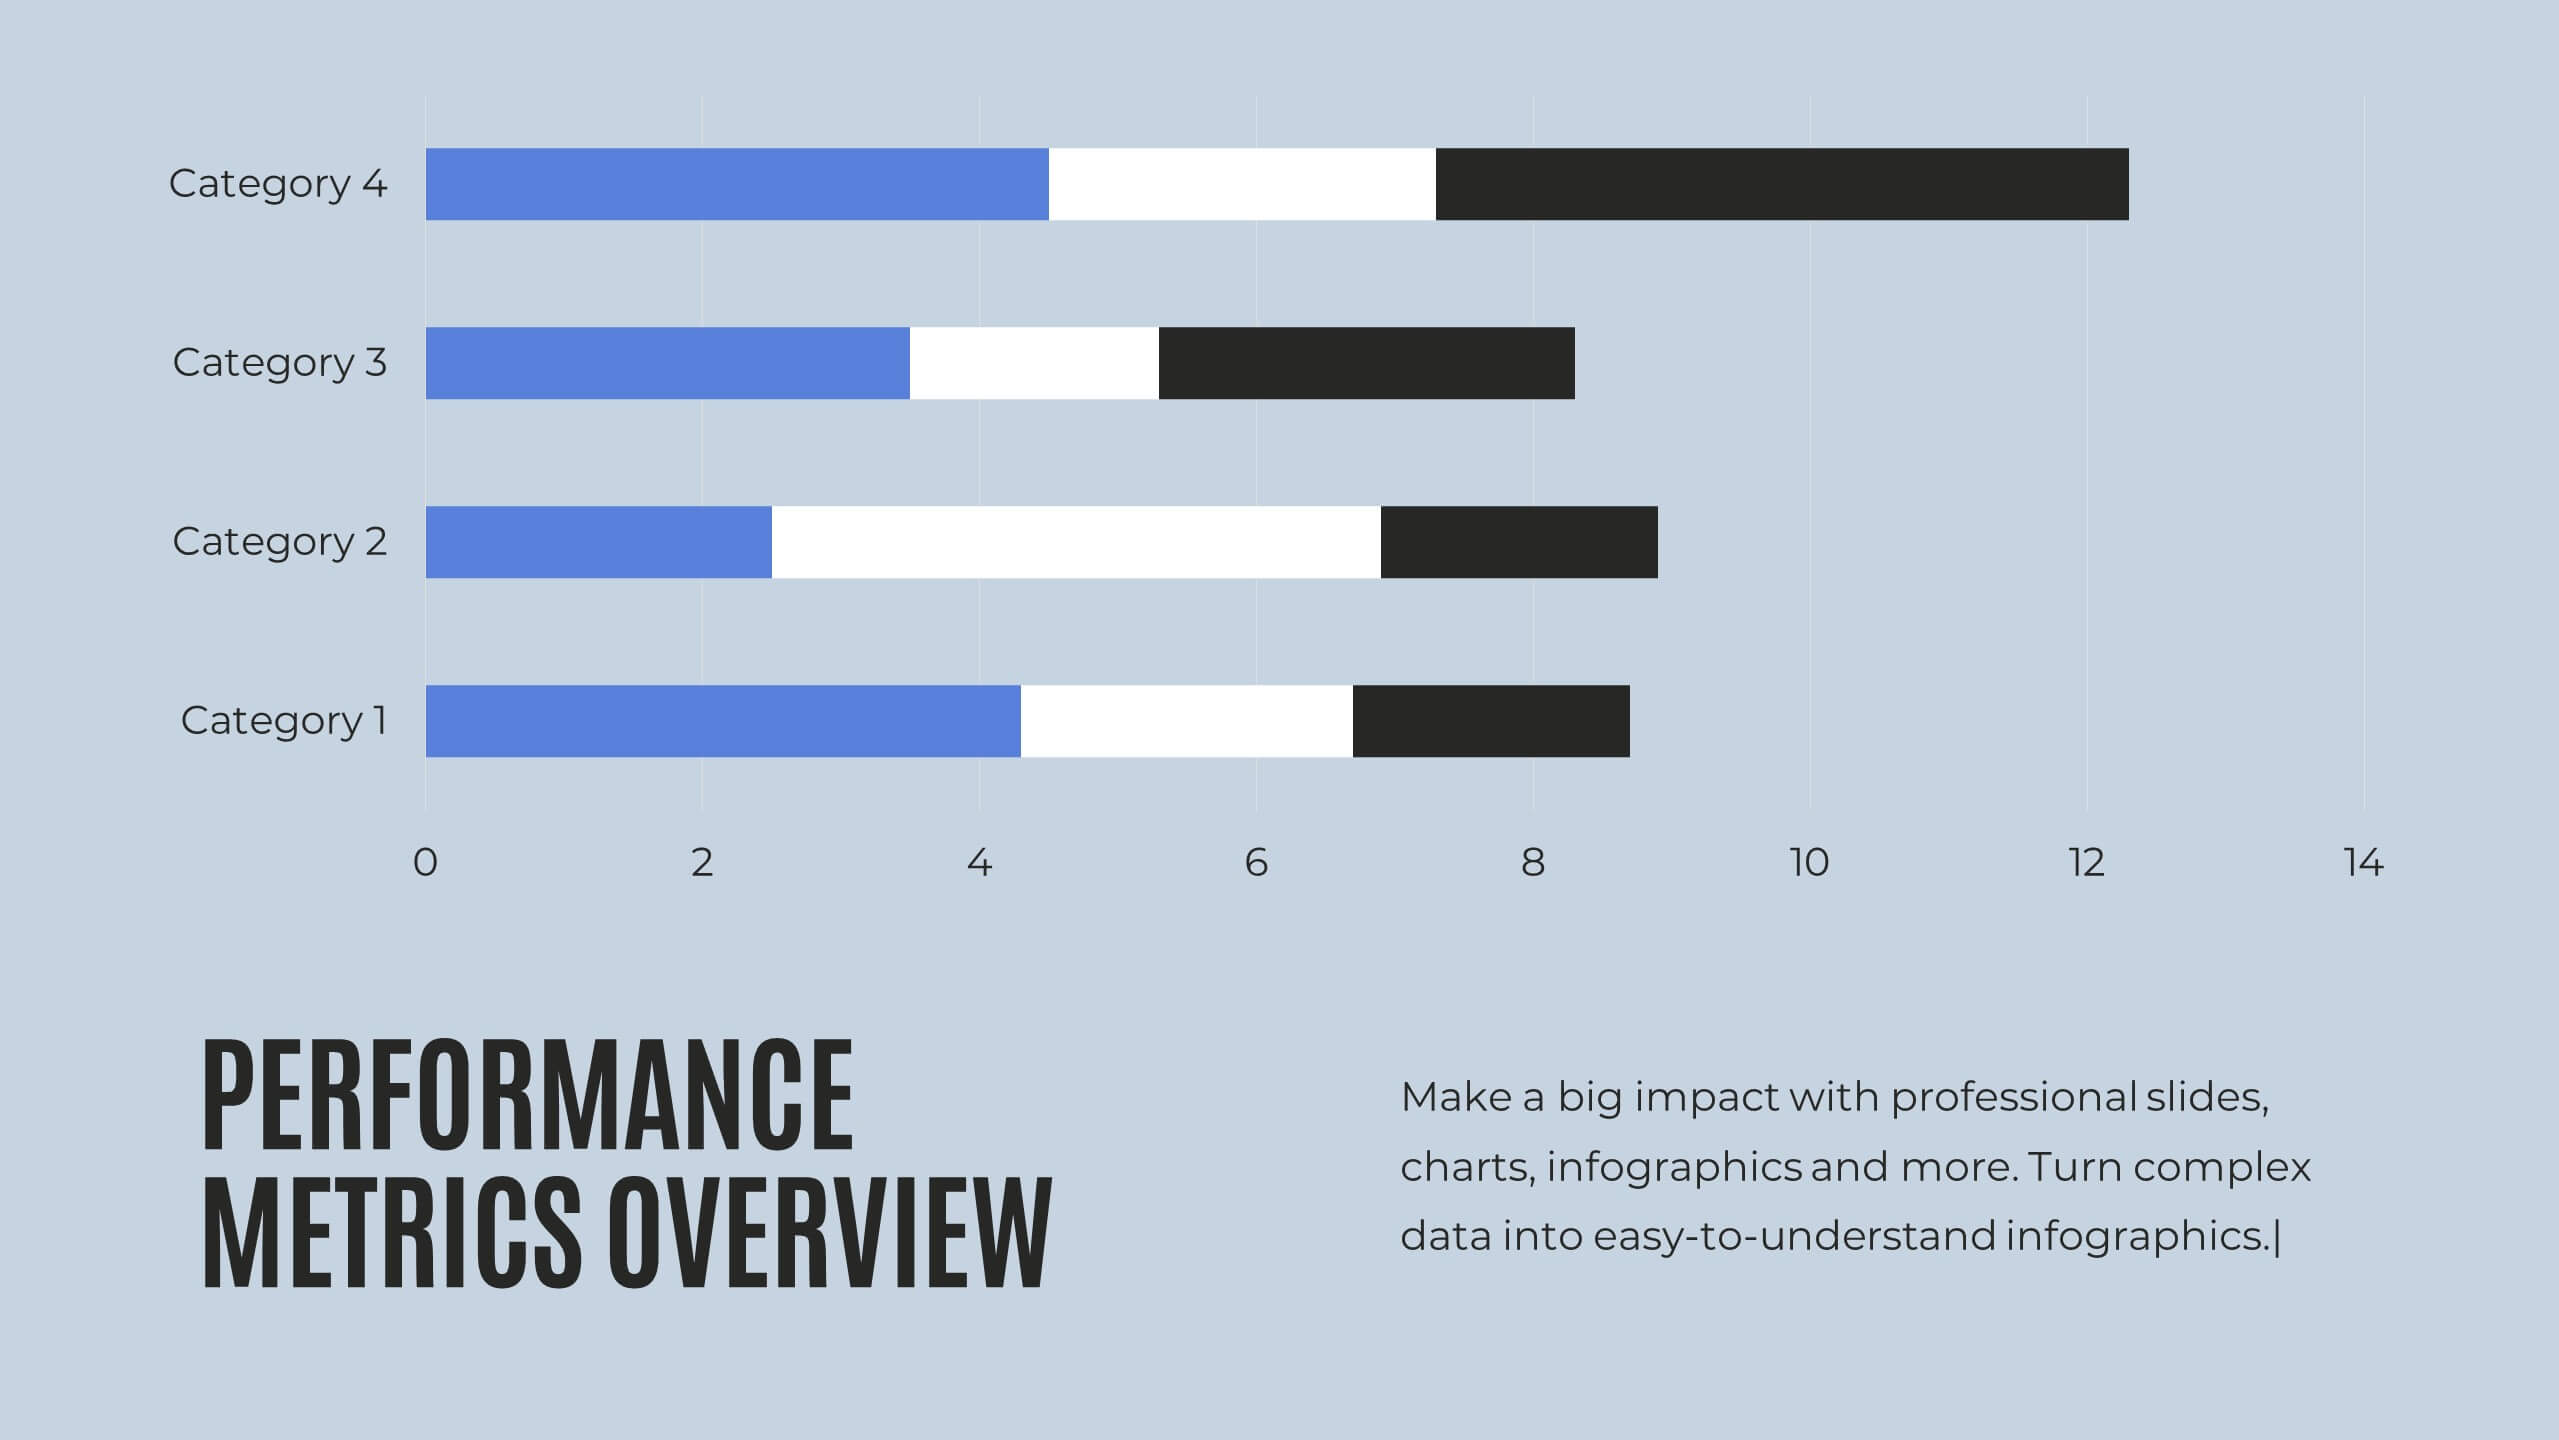
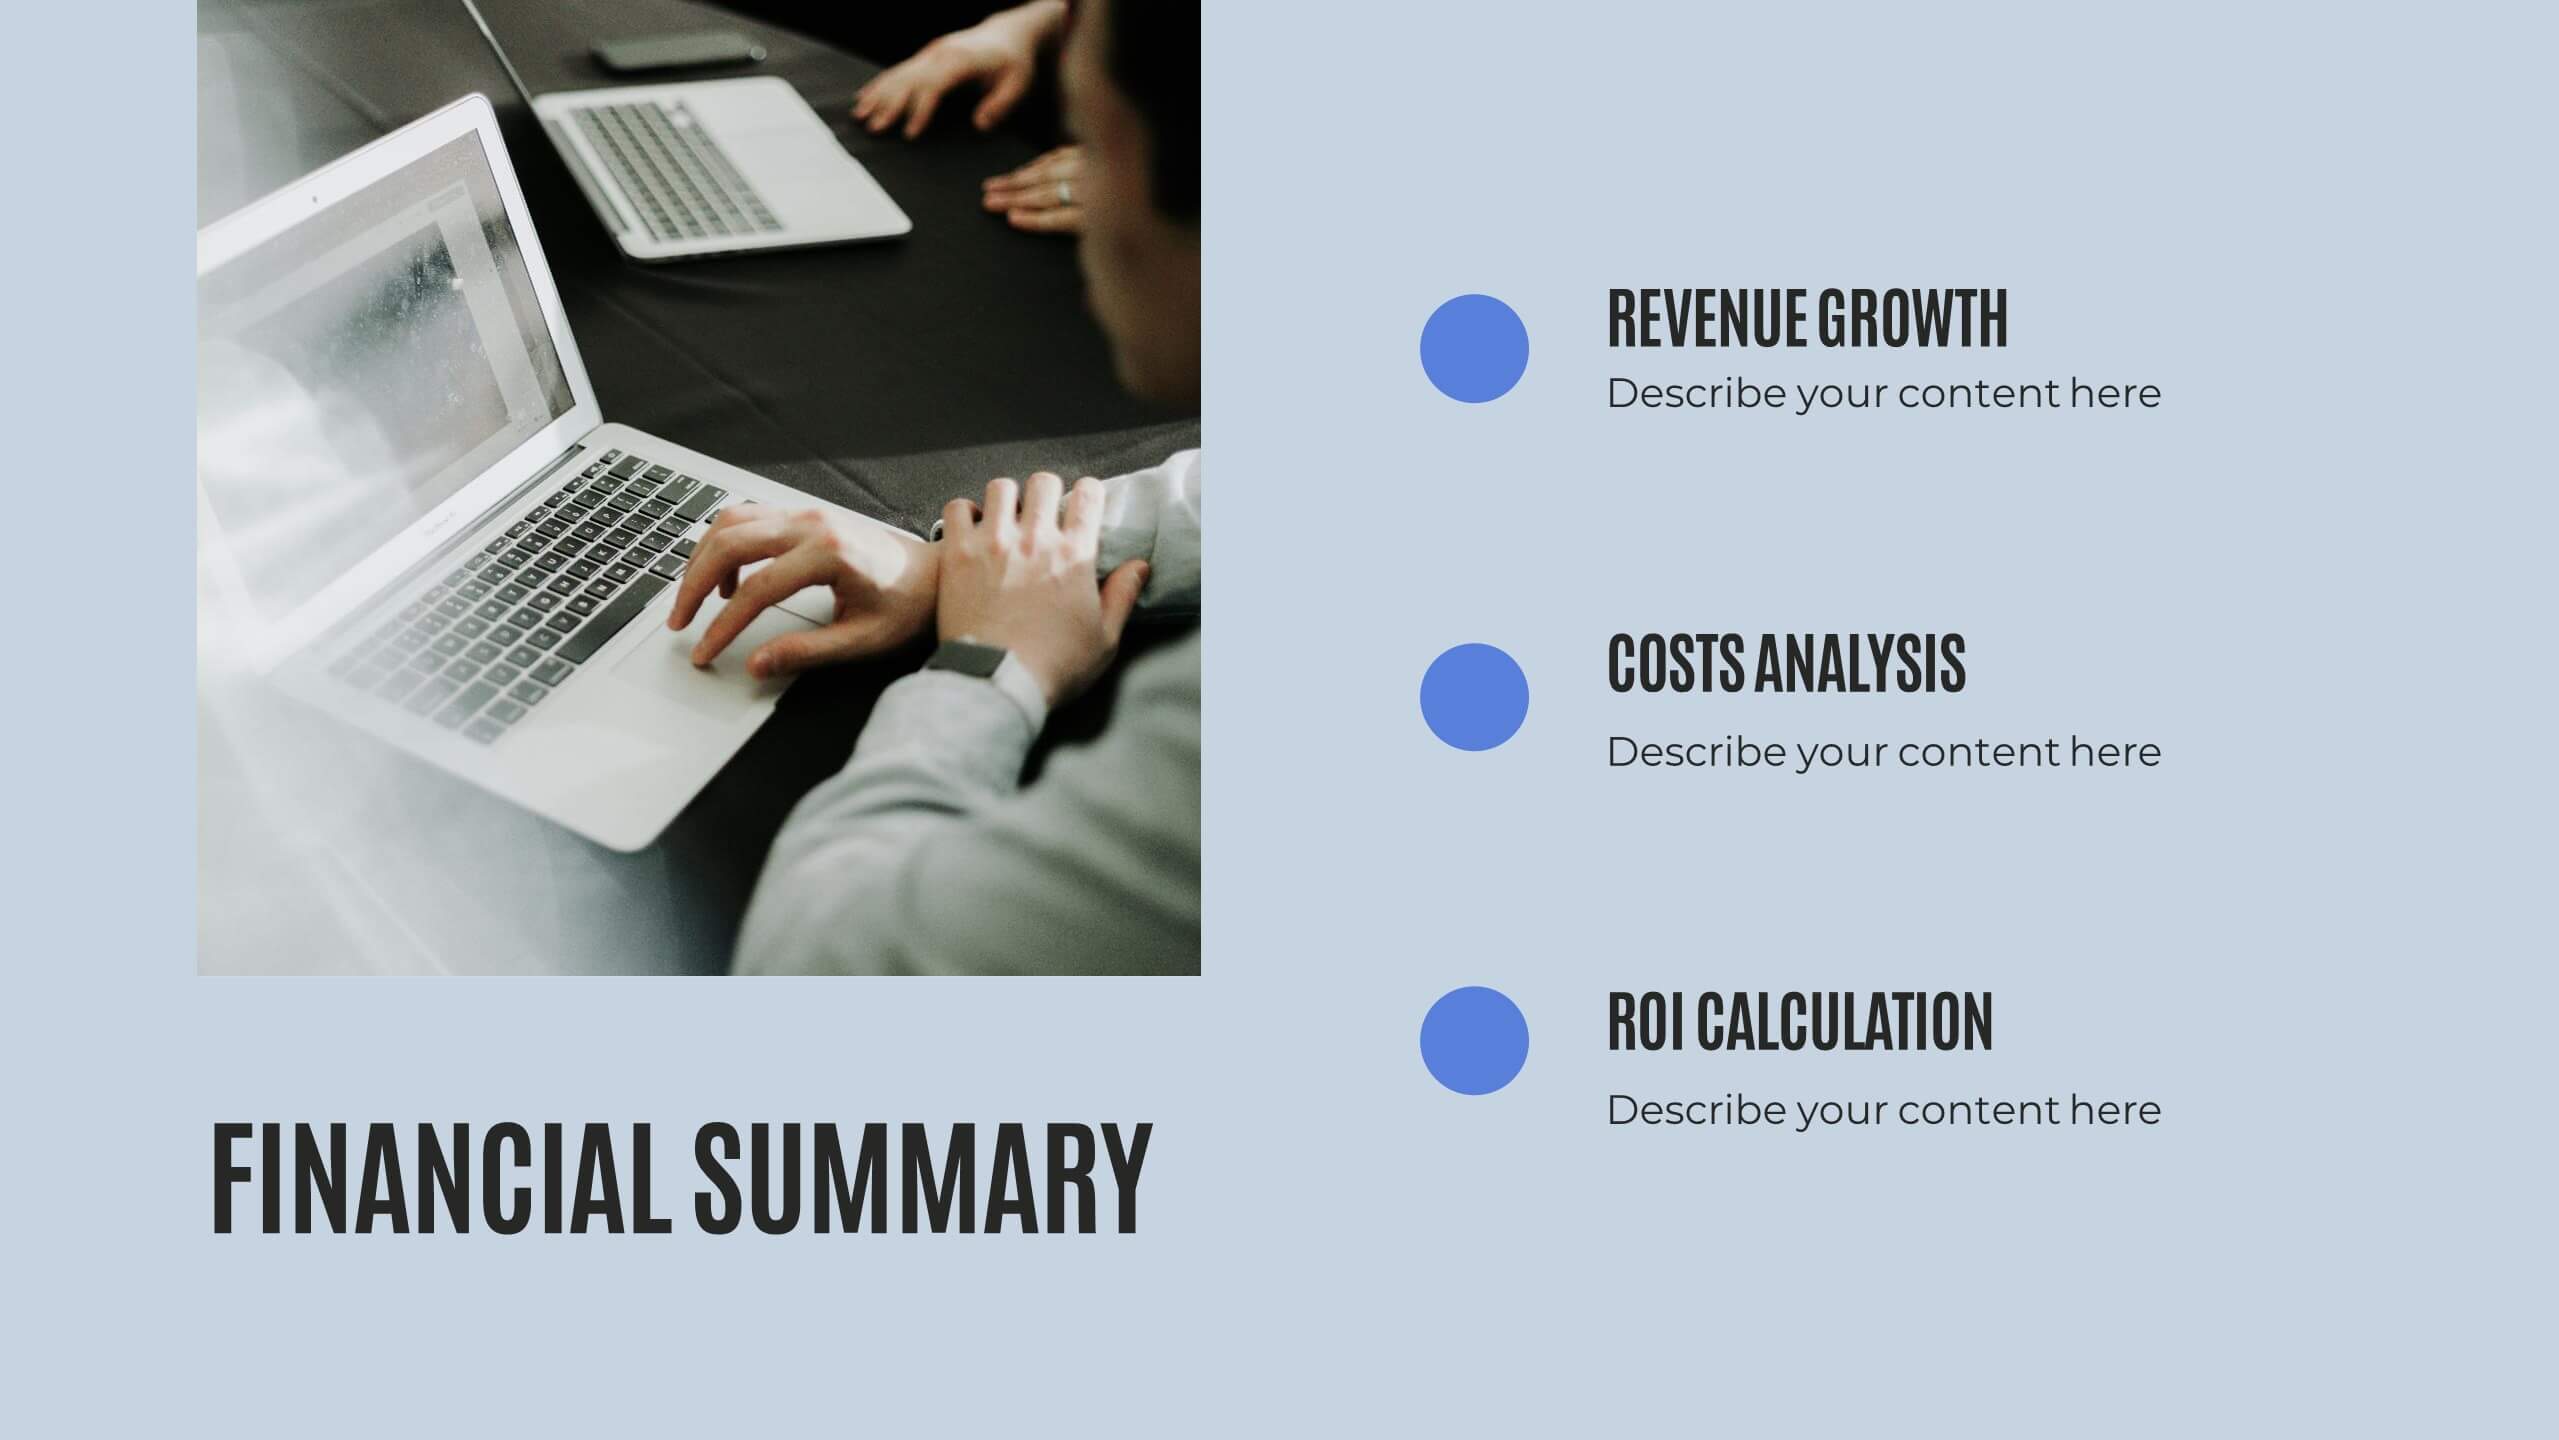
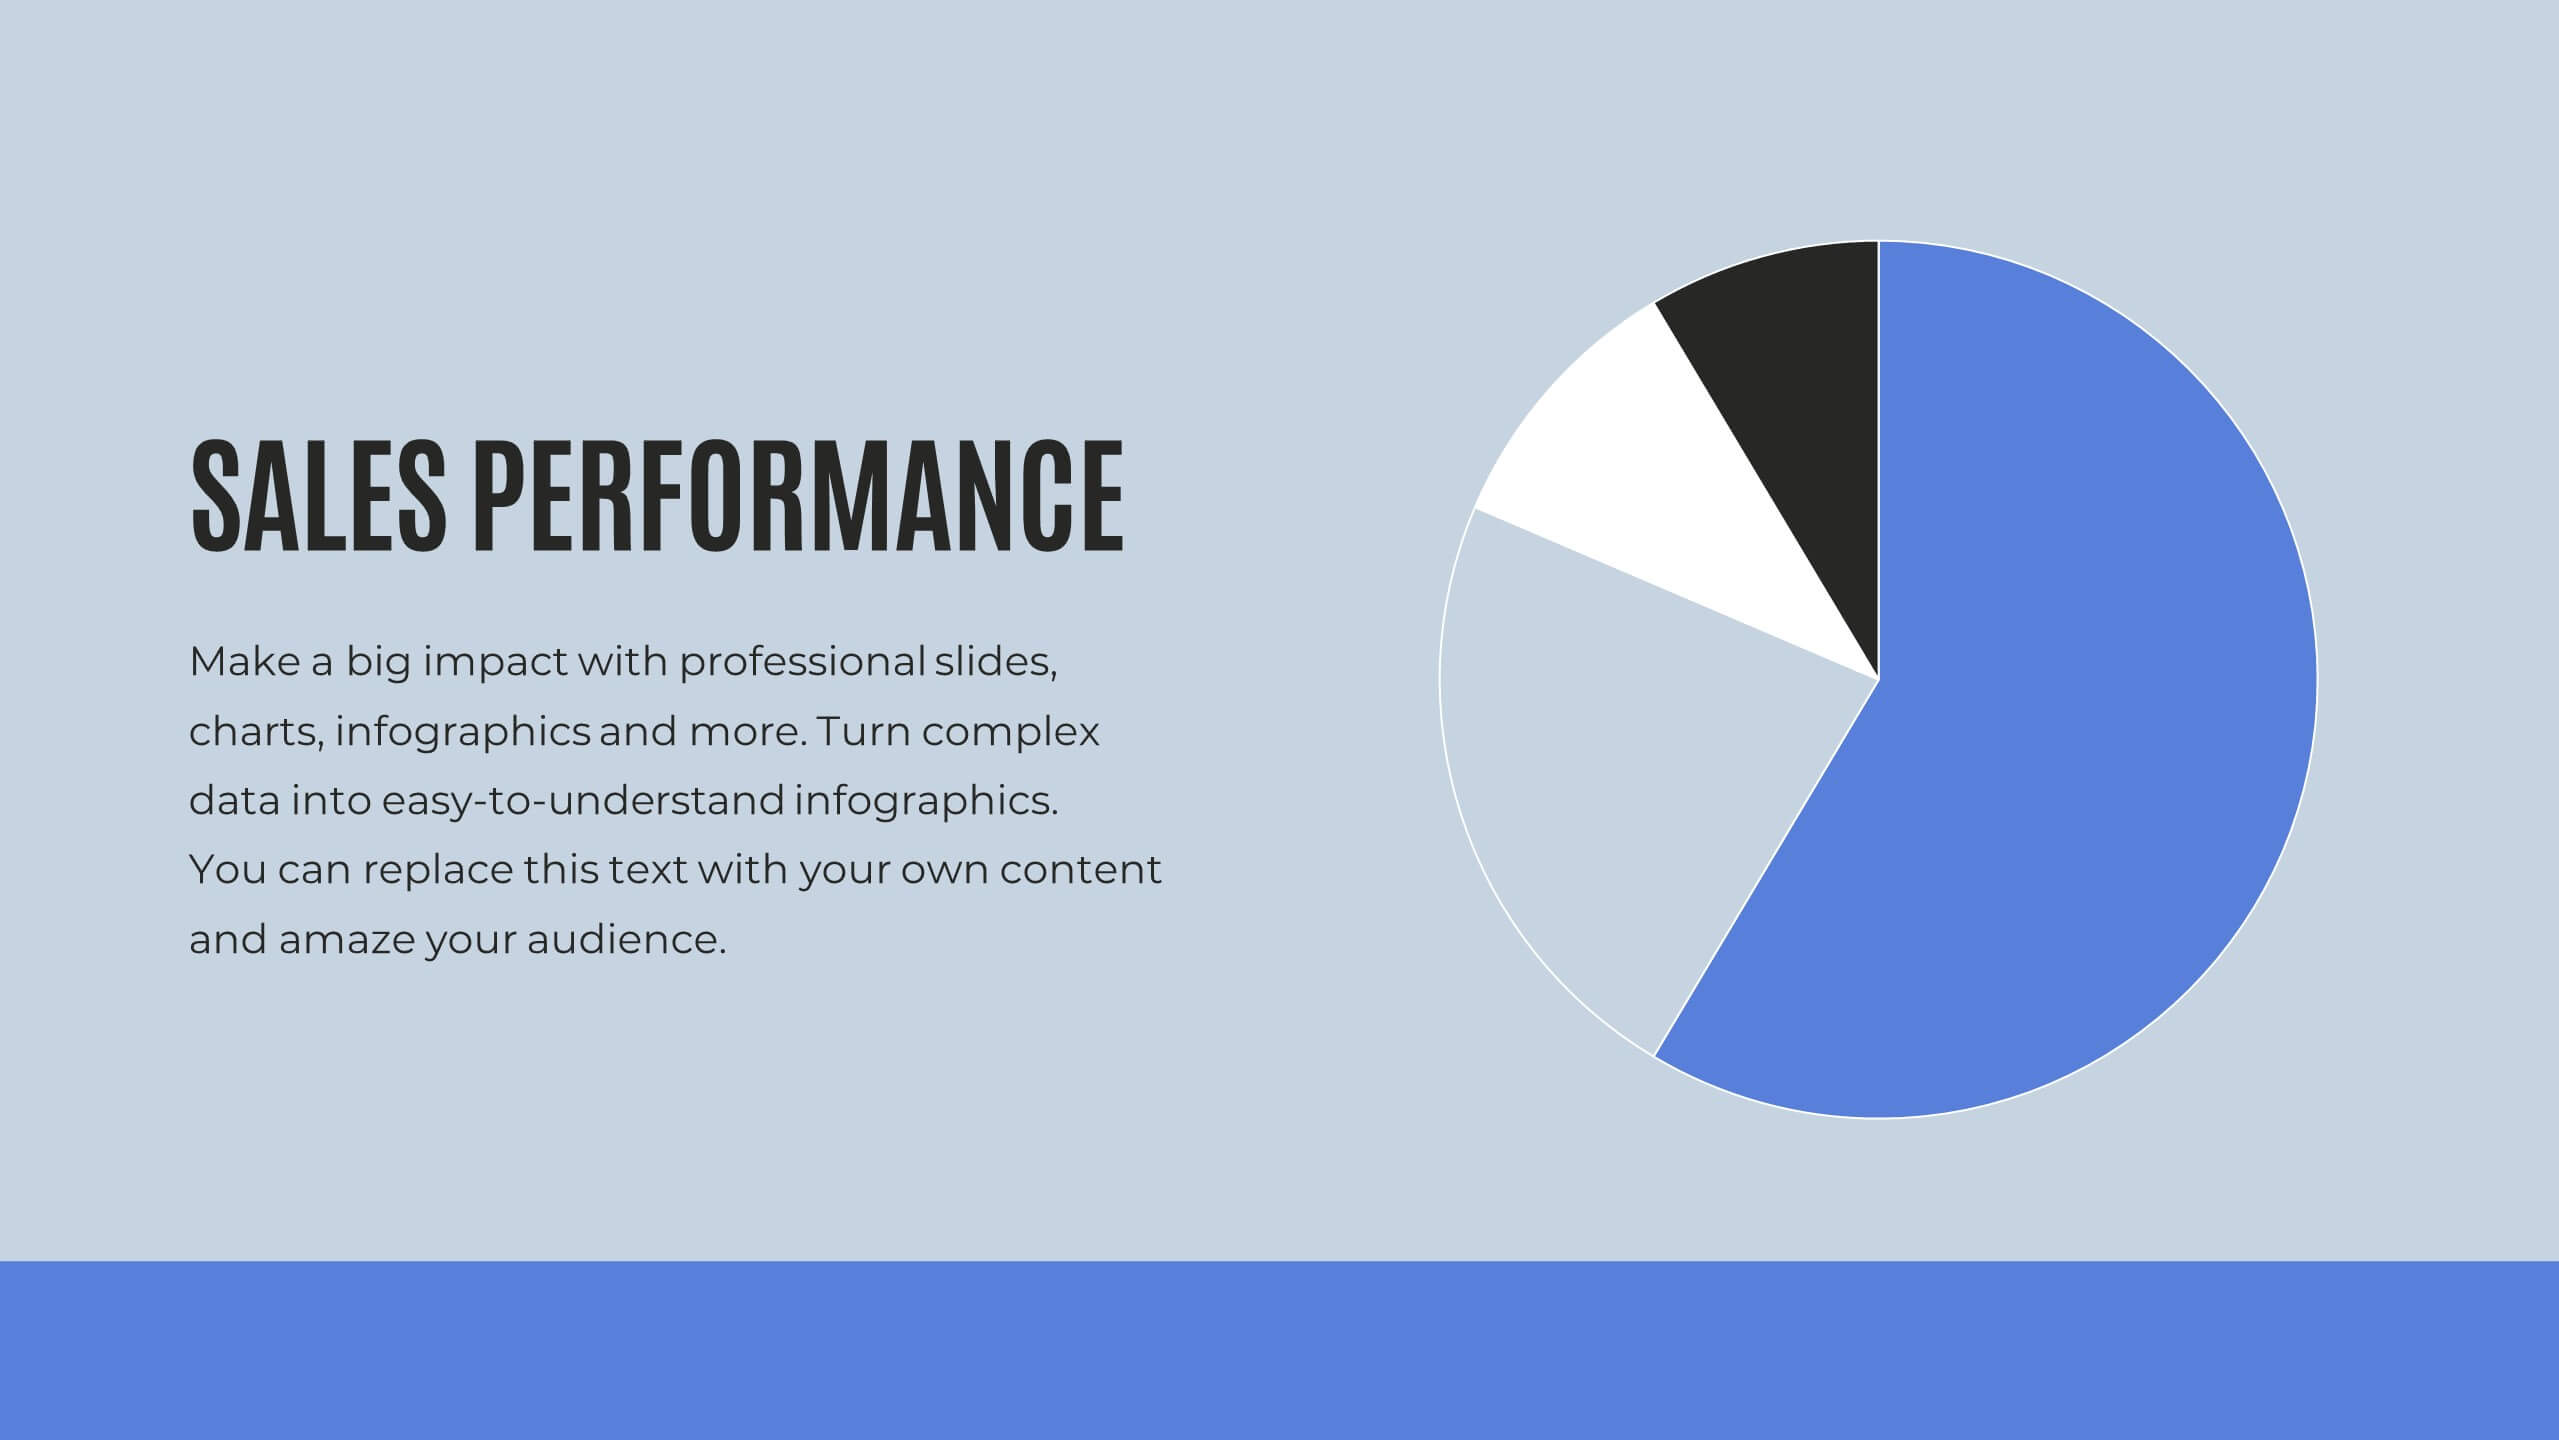
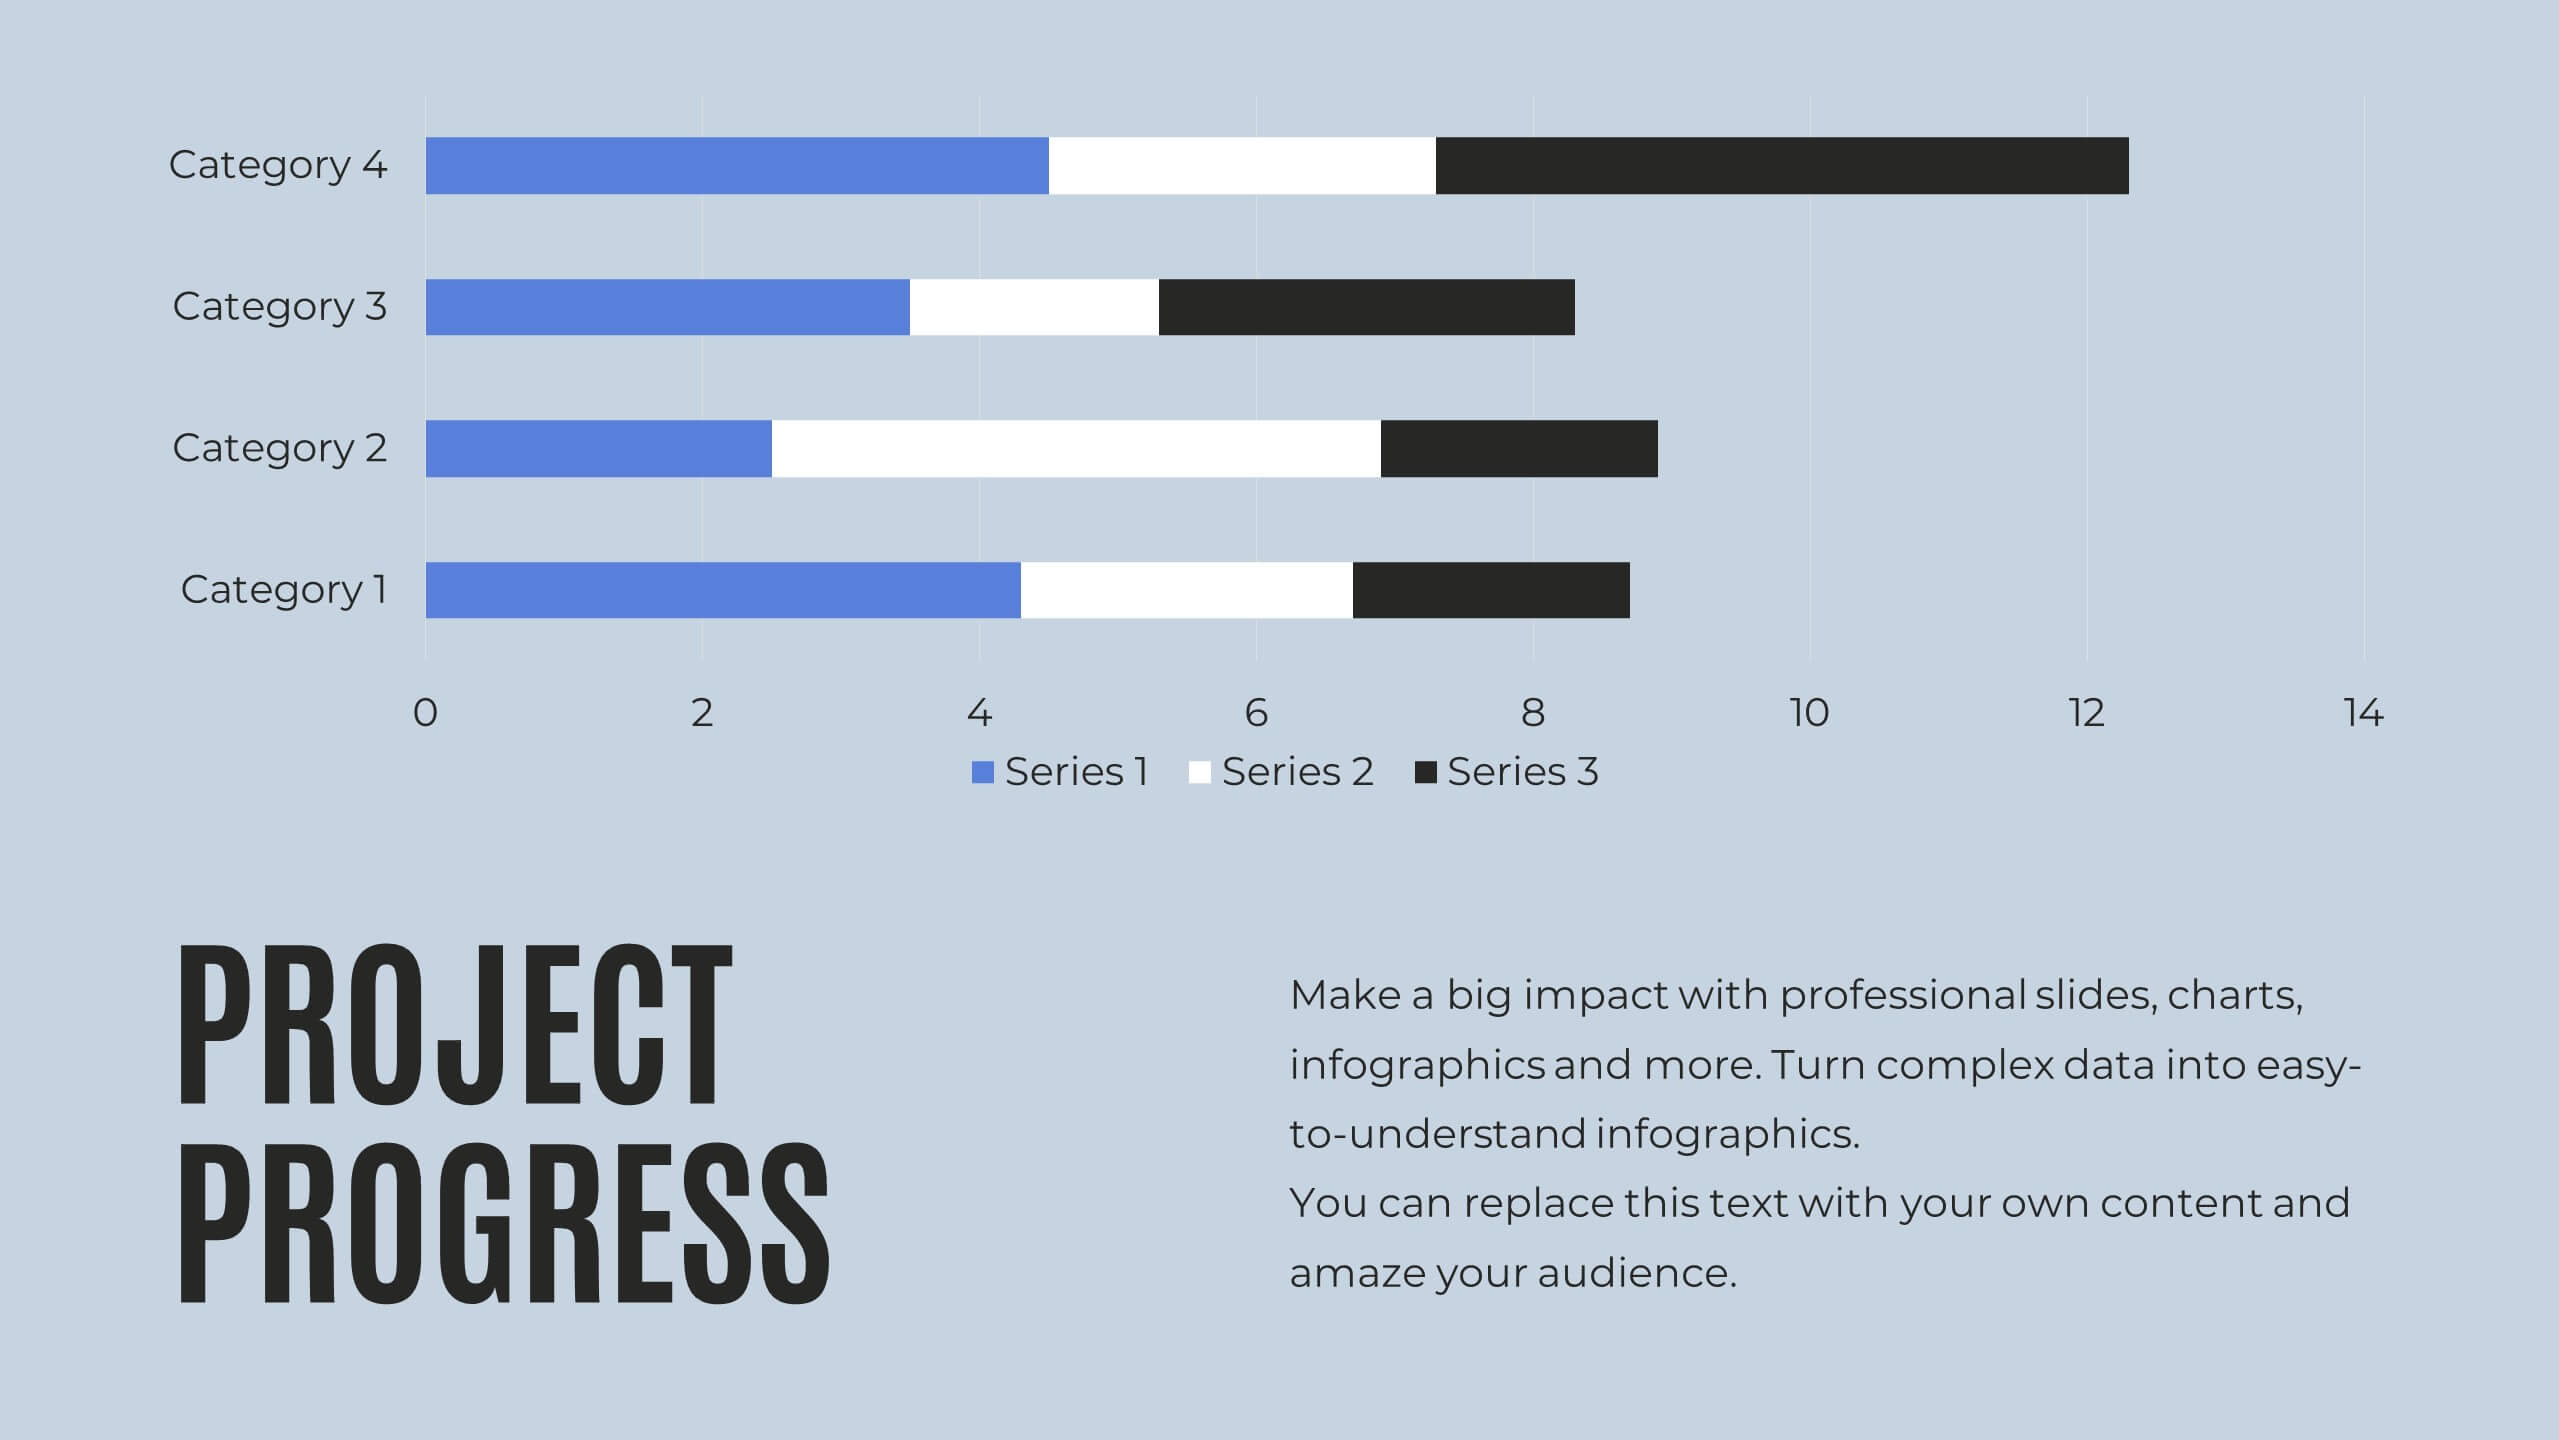
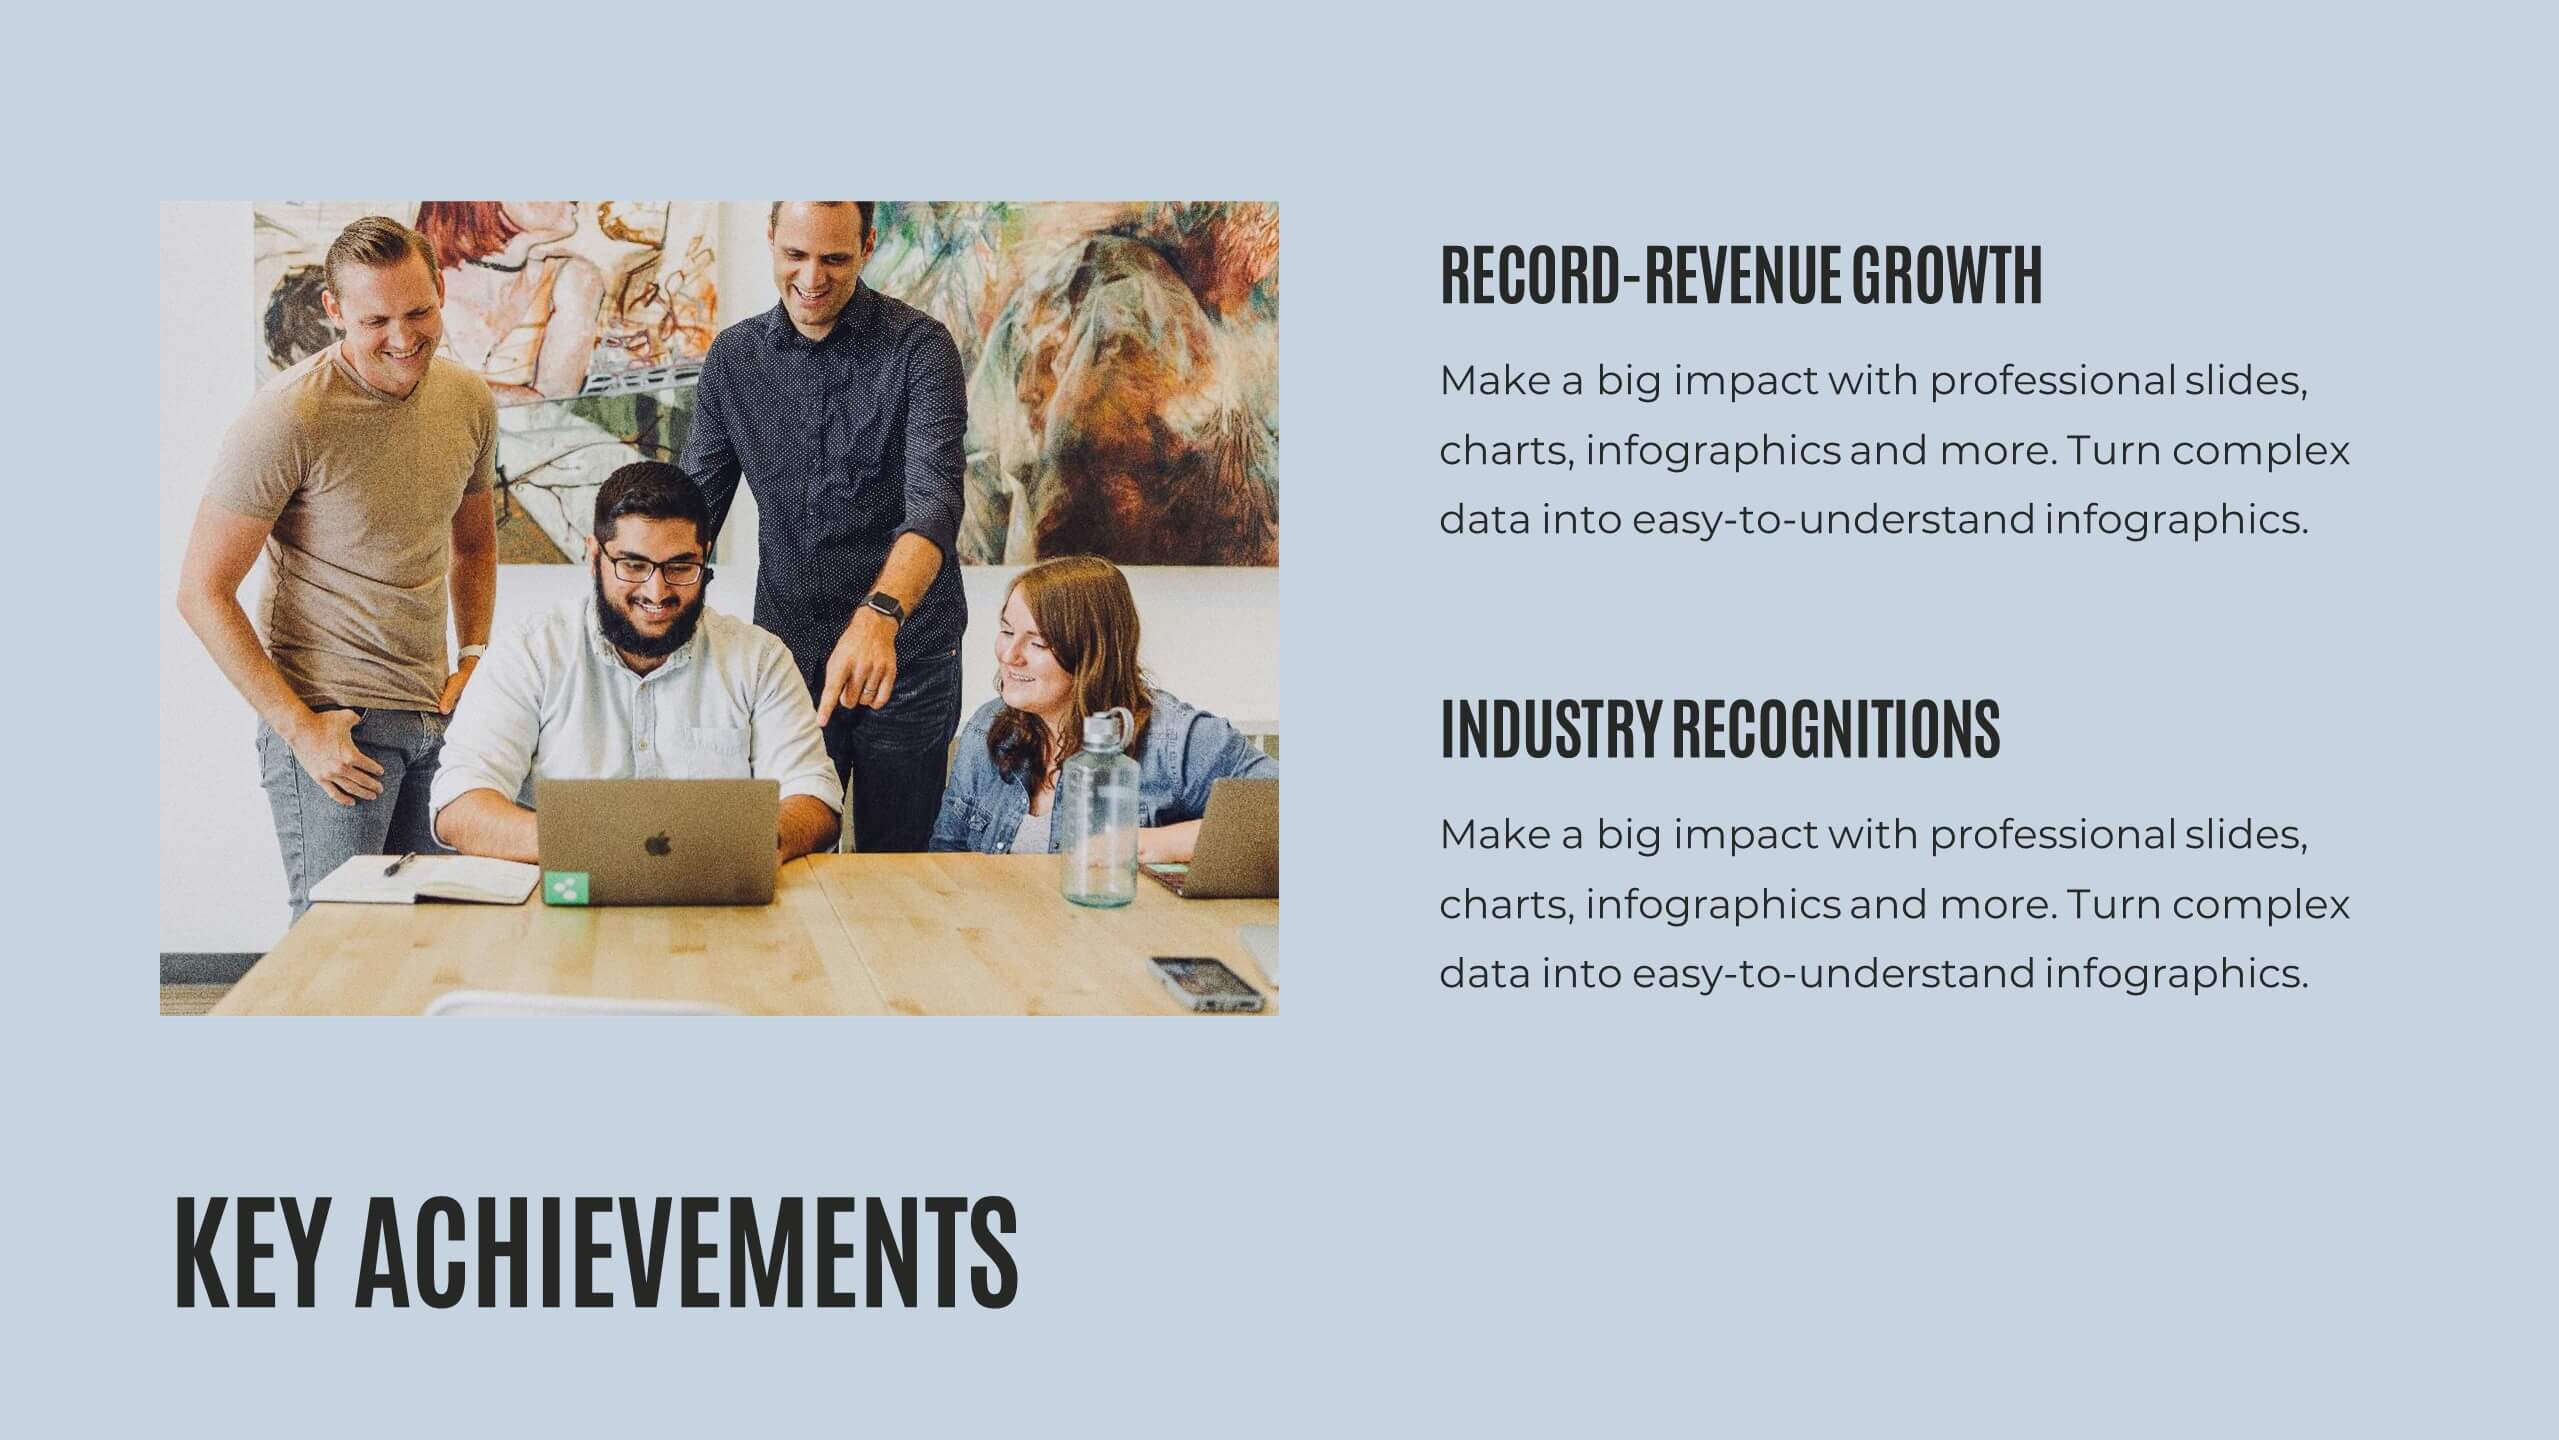
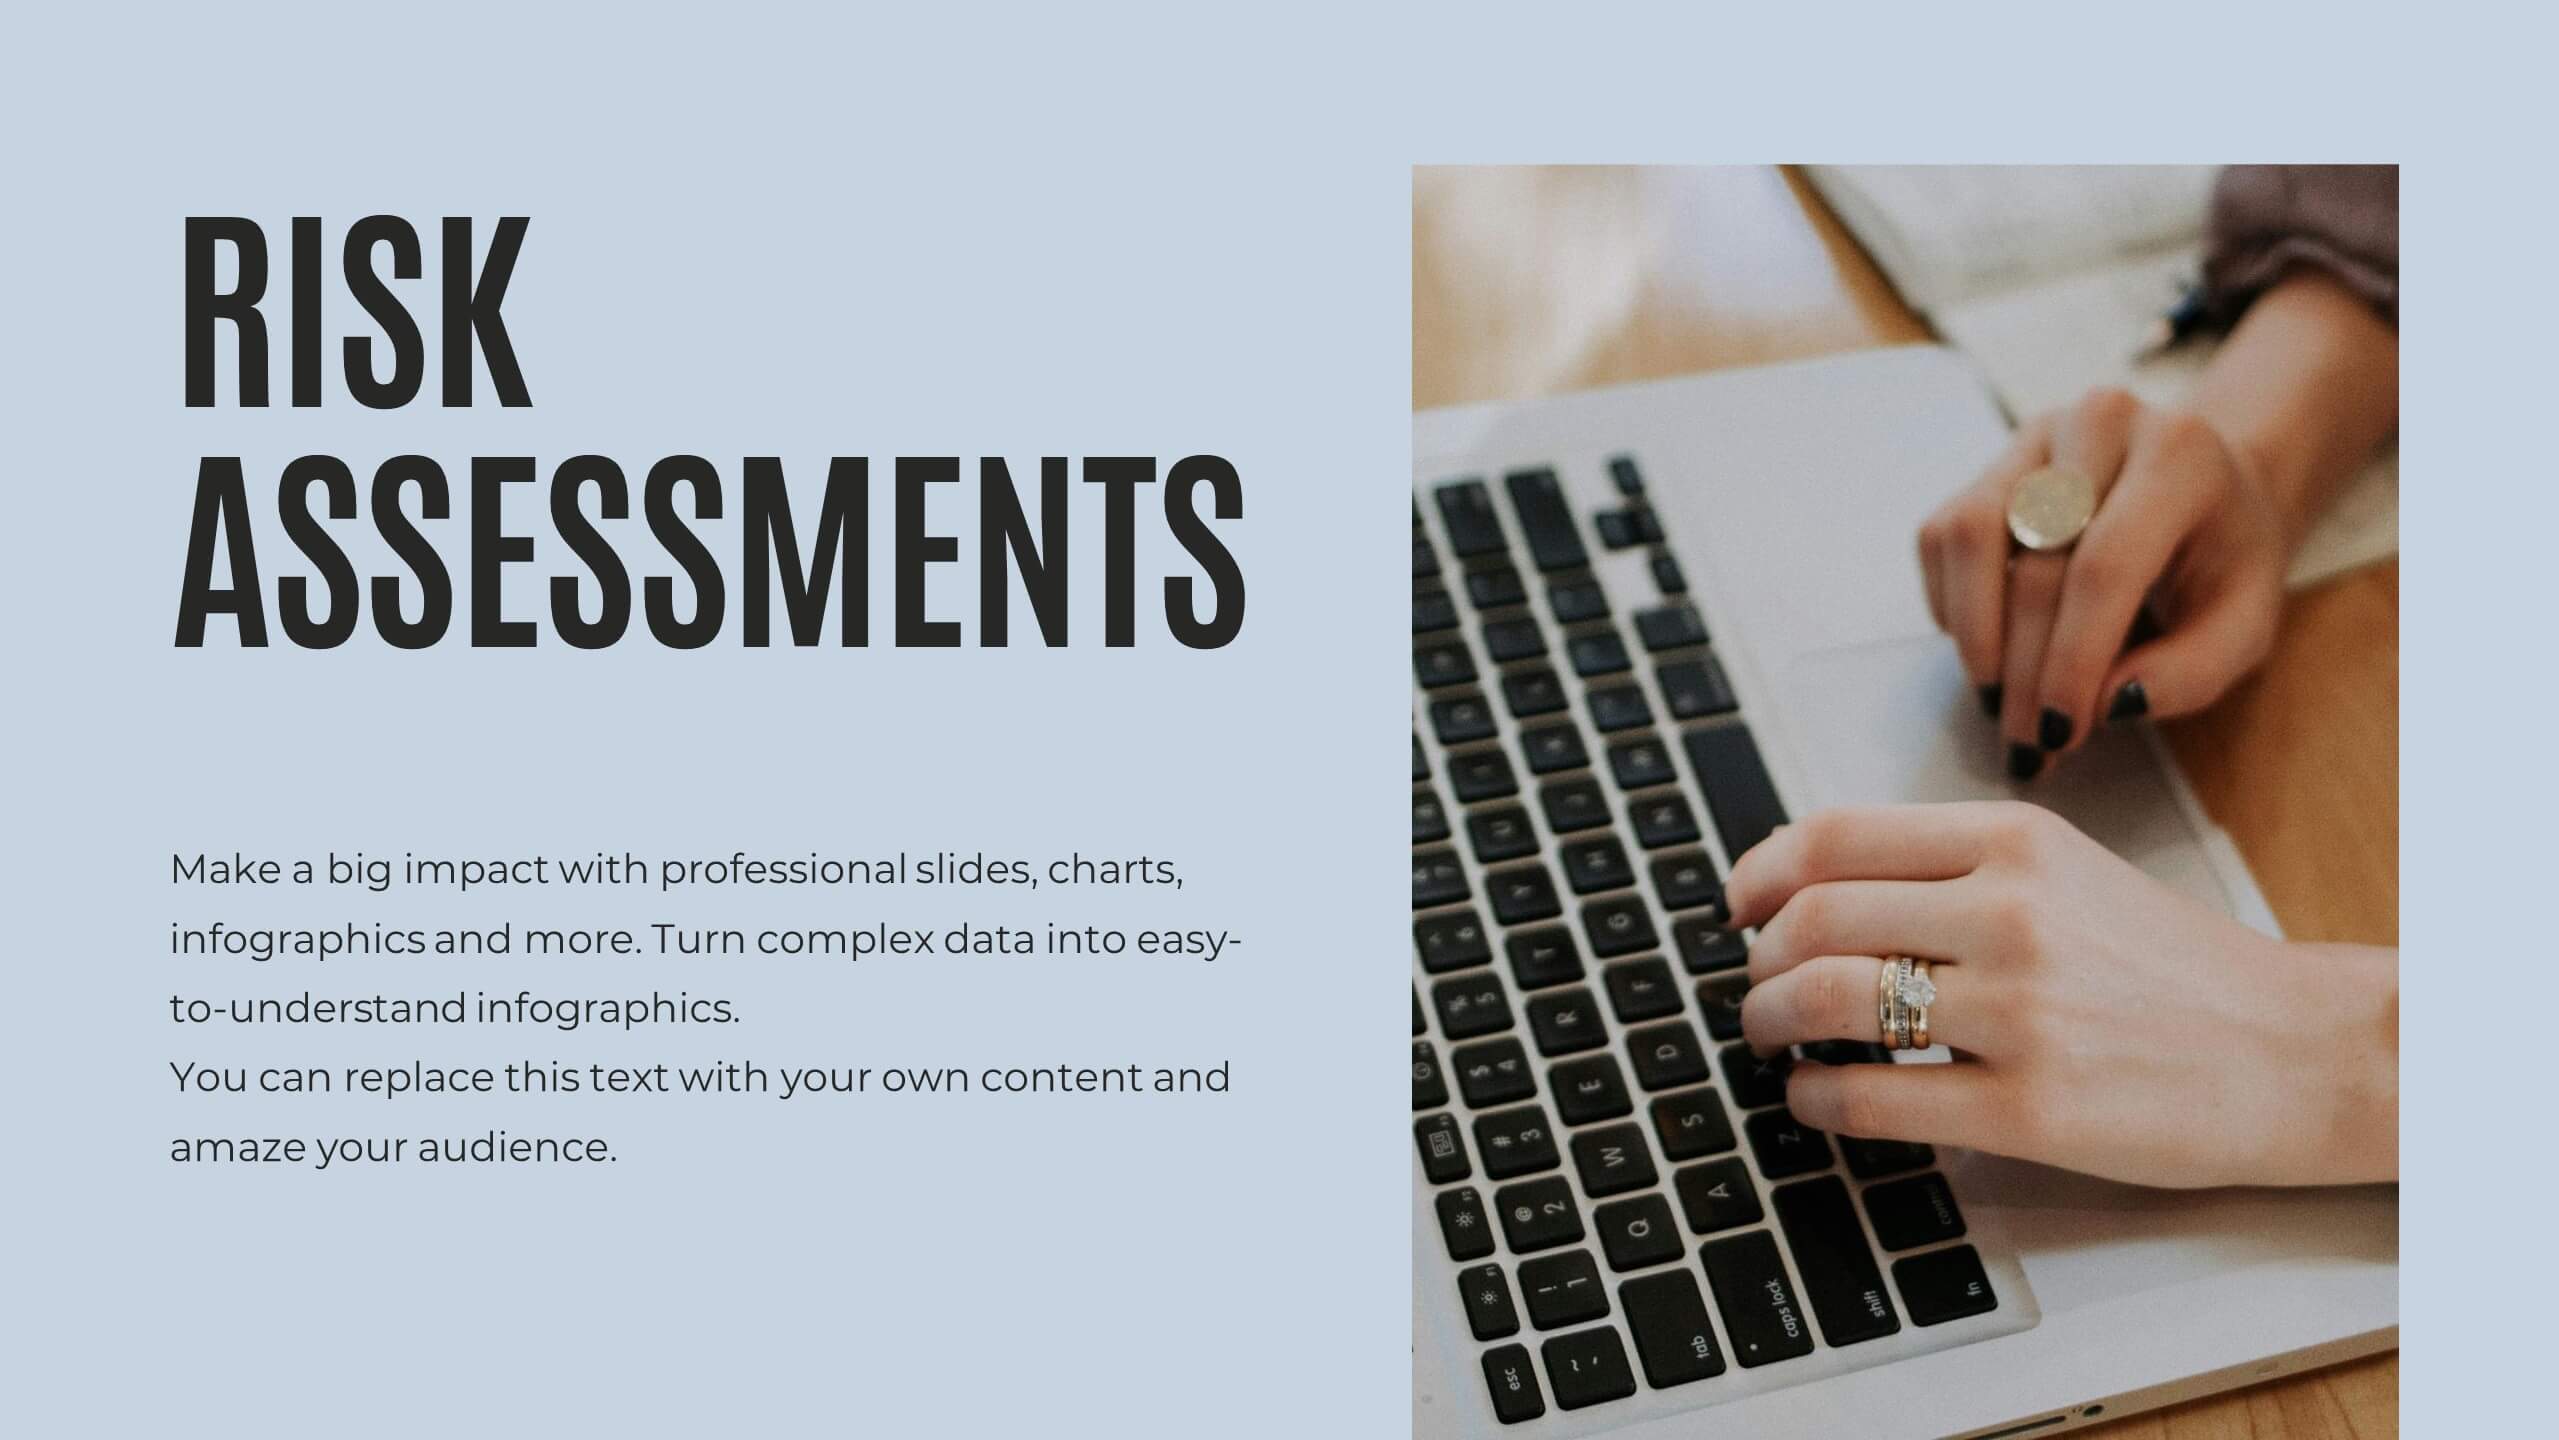
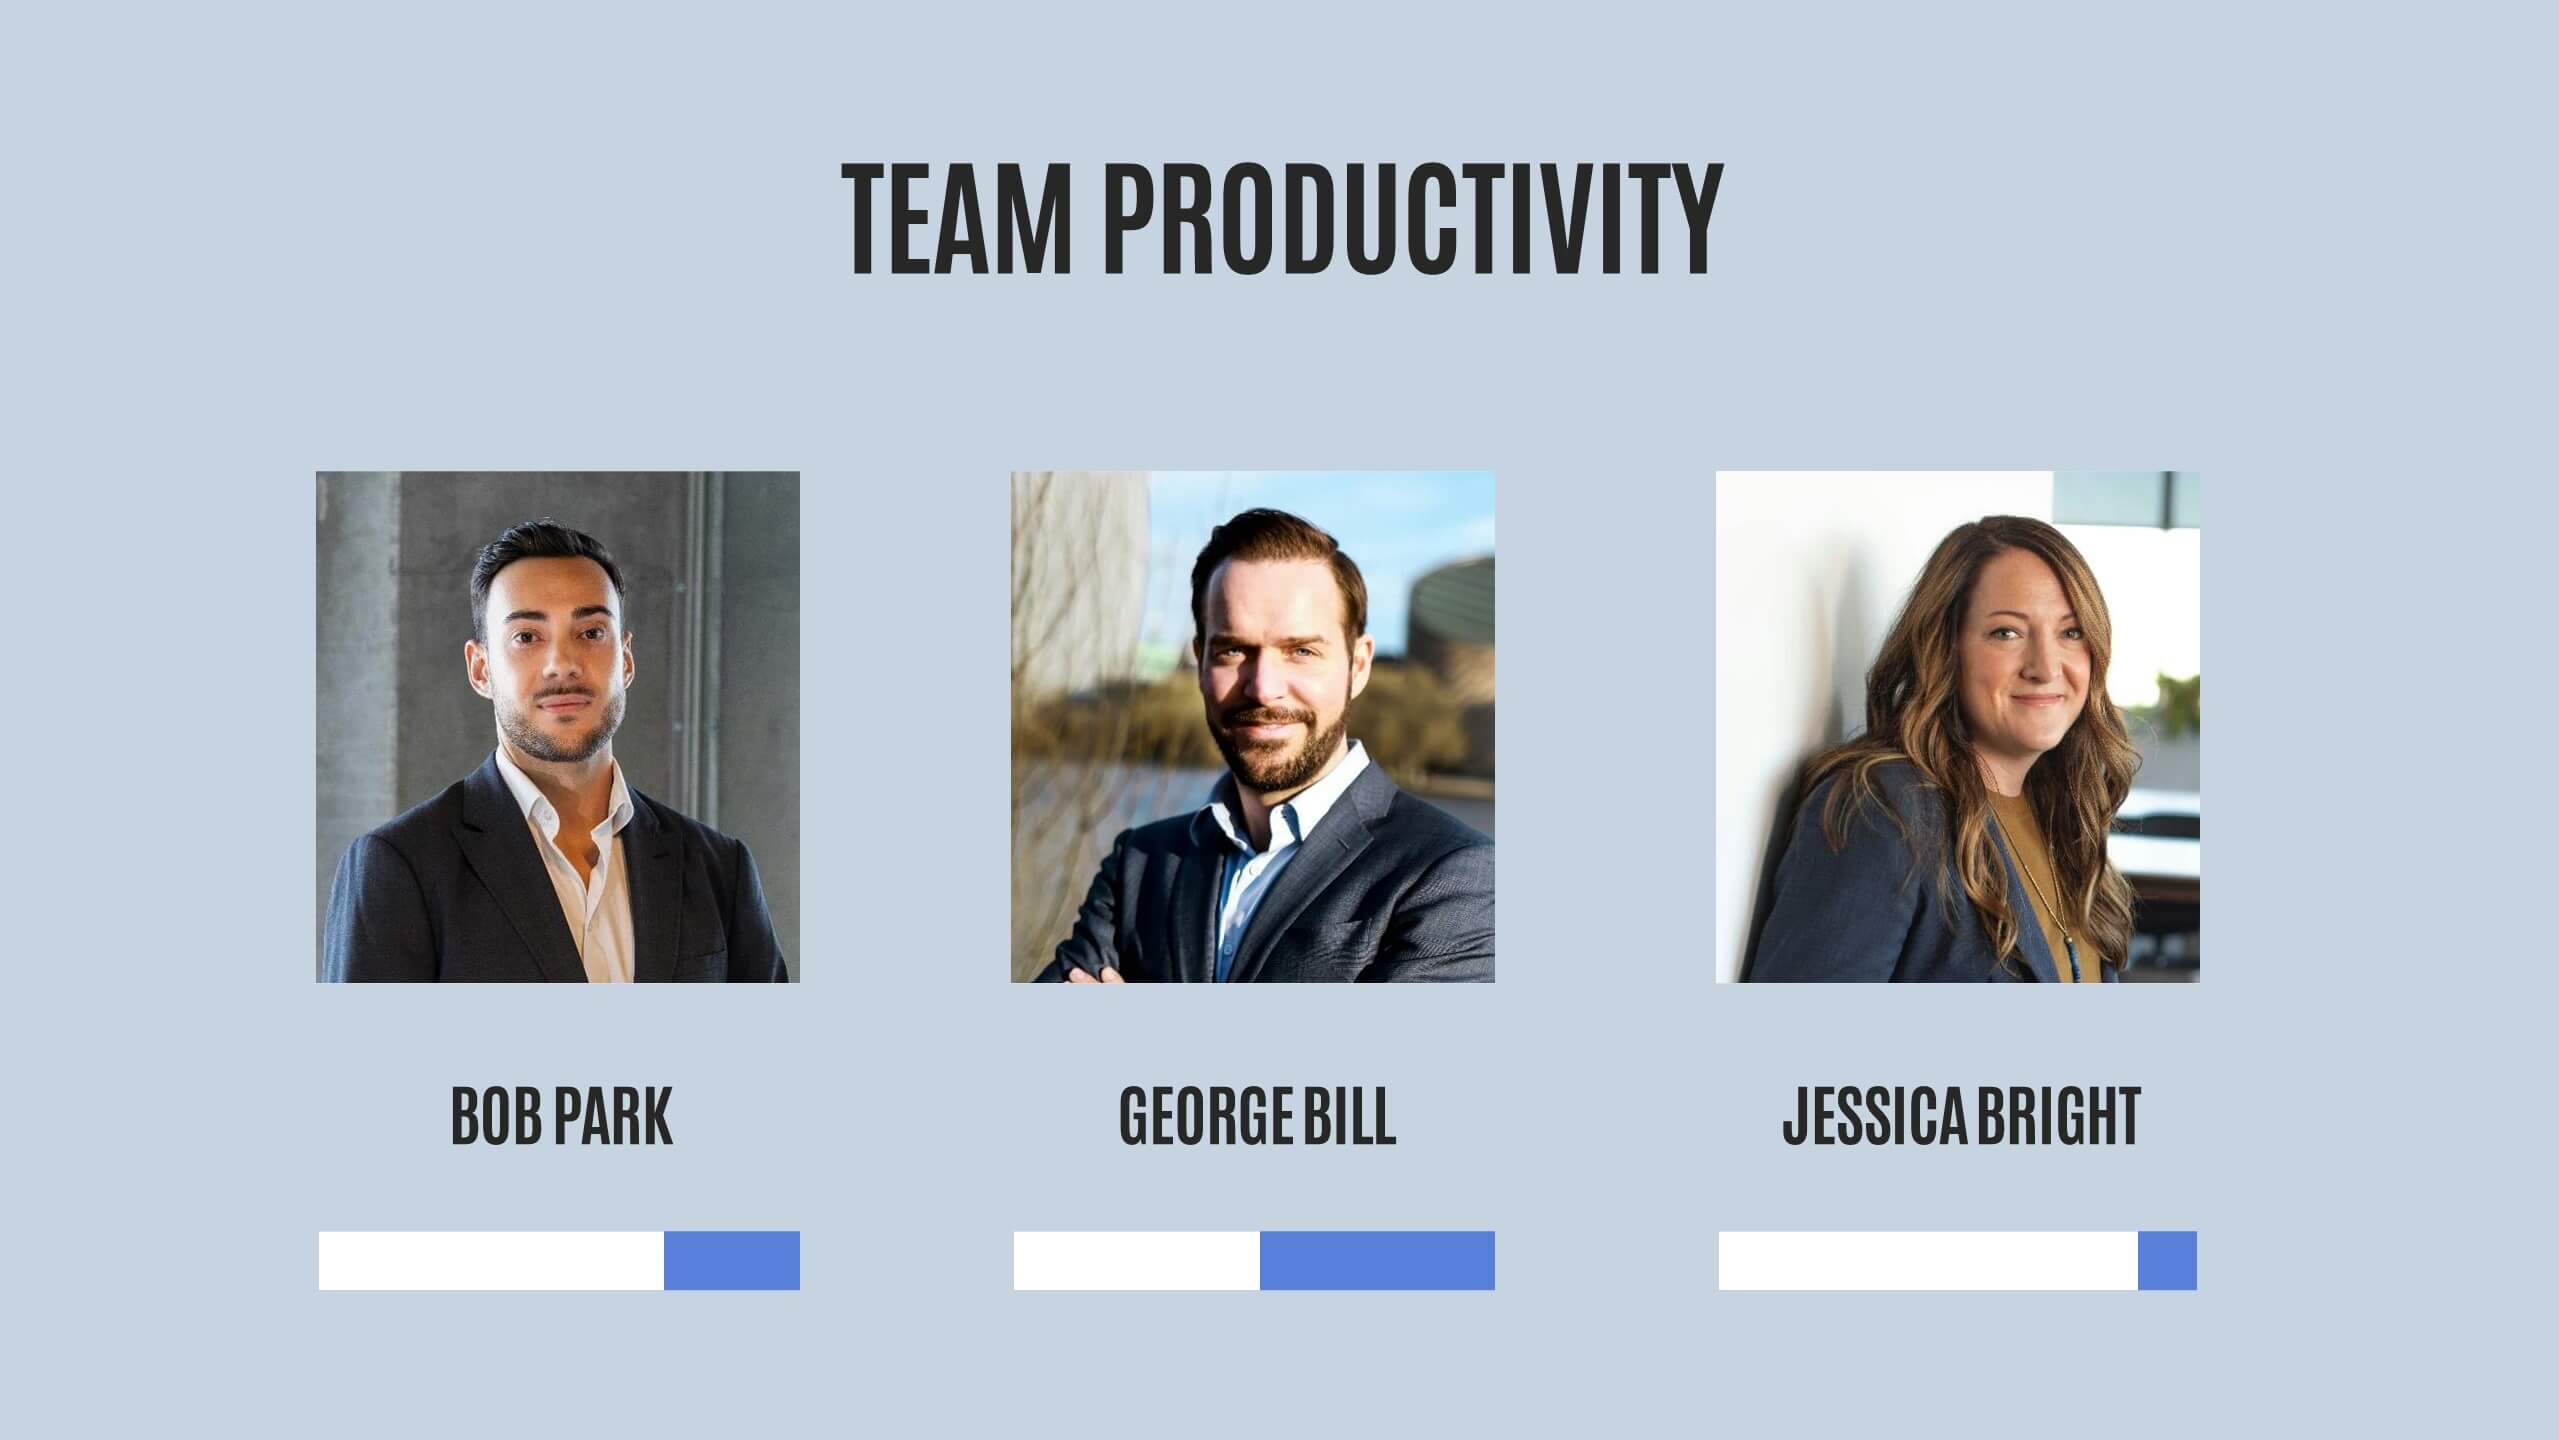
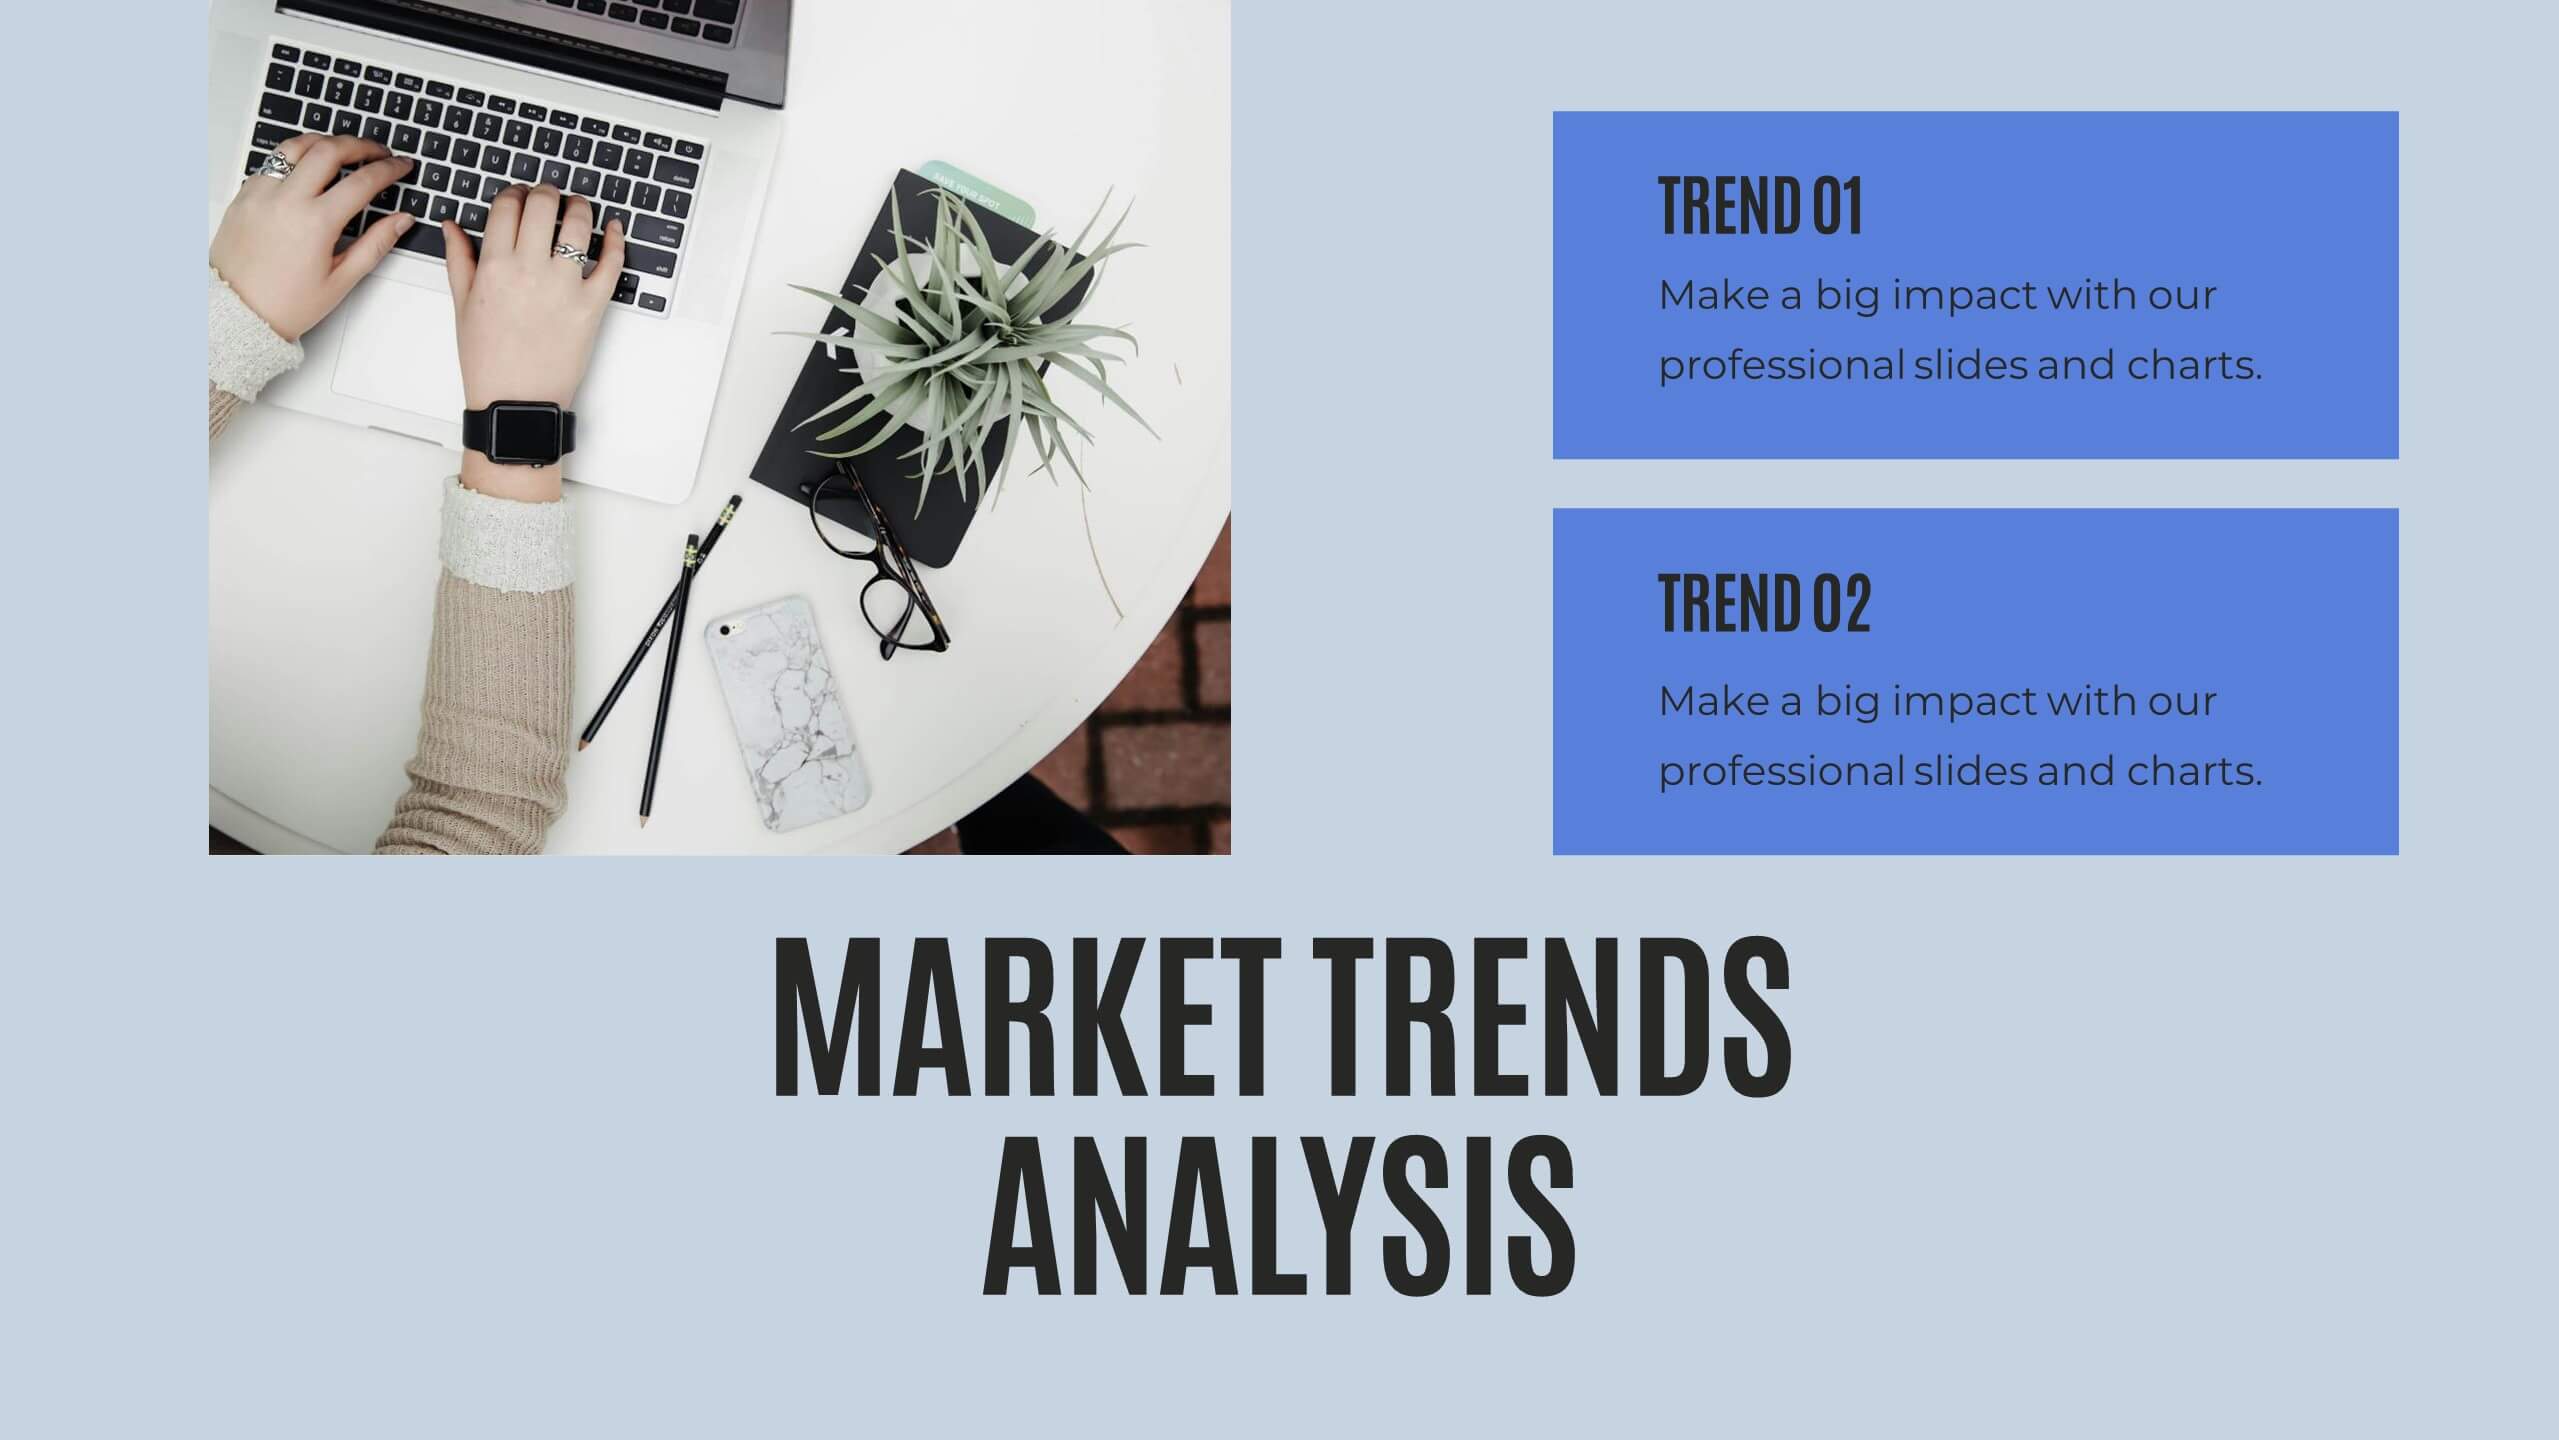
Quill Research Findings Report Presentation
Illuminate your findings with this comprehensive research report template! Perfect for presenting key highlights, performance metrics, and financial summaries, it features professional slides for project progress, risk assessments, and market trends analysis. Engage your audience with clear visuals and detailed content. Compatible with PowerPoint, Keynote, and Google Slides for seamless presentations on any platform.


7 slides
Developmental Milestone Infographic
Developmental milestones are specific skills or abilities achieved by individuals within a certain age range that indicate their growth and progress in various domains of development, including physical, cognitive, social, and emotional. This infographic template is designed to showcase the key developmental milestones children typically reach at various ages, guiding parents and caregivers in understanding and celebrating these significant achievements. Compatible with Powerpoint, Keynote, and Google Slides. Encourage celebrating each milestone achieved, emphasizing the positive impact on development and motivation.


21 slides
Veridian Agile Project Plan Presentation
Streamline your project management with this agile project plan template, featuring deliverables, timeline, resource allocation, and quality assurance. Ideal for agile teams, it helps in tracking progress and managing risks efficiently. Compatible with PowerPoint, Keynote, and Google Slides, ensuring seamless and impactful presentations.


5 slides
Collaboration Tools for Team Efficiency Presentation
Visualize teamwork like never before with the Collaboration Tools for Team Efficiency Presentation. Featuring a puzzle-style layout, this slide highlights four interconnected ideas or steps—perfect for team workflows, project milestones, or tool comparisons. Easy to customize in Canva, PowerPoint, or Google Slides.


8 slides
Construction Project Planning Presentation
Streamline project timelines with the Construction Project Planning template. This visually structured design helps organize key phases, tasks, and milestones for efficient workflow management. Ideal for project managers and construction professionals, it enhances clarity in presentations. Fully customizable and compatible with PowerPoint, Keynote, and Google Slides for seamless integration.


6 slides
Product and Service Benefits Presentation
Highlight the unique value of your offerings with this Product and Service Benefits Presentation. Designed for clarity and impact, this visual layout allows you to break down six key features or advantages side-by-side. Perfect for product launches, sales decks, or service comparisons. Easily customizable in PowerPoint, Keynote, and Google Slides — ideal for marketers, sales teams, and consultants.


6 slides
5-Year Financial Forecast Slide Presentation
Show your long-term growth with a clean, visual touch that makes numbers easy to follow and goals clear to everyone. This modern layout highlights yearly progress using engaging icons and percentage indicators, perfect for financial reports or investor decks. Fully compatible with PowerPoint, Keynote, and Google Slides for seamless editing.