


Features
- 6 Unique slides
- Fully editable and easy to edit in Microsoft Powerpoint, Keynote and Google Slides
- 16:9 widescreen layout
- Clean and professional designs
- Export to JPG, PDF or send by email


Do you have any questions?
Recommend


4 slides
Market Research Survey Insights Presentation
Showcase key data from your latest research with this bold, megaphone-themed survey slide. Ideal for presenting percentages and key findings side-by-side, this layout draws attention to market trends, consumer feedback, or audience segmentation. Fully editable in PowerPoint, Keynote, and Google Slides.


12 slides
Project Completion Checklist
Streamline project tracking with this clean and functional project completion checklist slide. Ideal for task management and progress reporting, it includes editable sections for task descriptions, process stages, current status, and additional notes. With toggles like “In Process,” “On Hold,” “Complete,” and “Overdue,” this layout is perfect for keeping teams aligned. Fully editable in PowerPoint, Keynote, and Google Slides.


4 slides
Ishikawa Diagram for Process Review Presentation
Visualize cause-and-effect relationships with the Ishikawa Diagram for Process Review Presentation. Also known as a fishbone diagram, this template is perfect for identifying potential root causes during quality control or team brainstorming sessions. Easily editable in Canva, PowerPoint, and Google Slides to match your workflow and style.


5 slides
Easy 4-Stage Development Process Presentation
Simplify complex processes with this clean, 4-step development diagram. Ideal for product lifecycles, workflows, or phased planning, this slide uses connected blocks and clear numbering to illustrate each stage. Fully editable in PowerPoint, Keynote, and Google Slides—perfect for project managers, engineers, and teams needing to communicate clear development strategies.


7 slides
Mortgage Comparison Infographic
Make the home buying decision easier with our mortgage comparison infographic template. This user-friendly and visually engaging infographic allows you to compare different mortgage options, helping your audience make informed financial choices. Use the charts to illustrate how the loan term impacts the total cost of the mortgage, making it easier to choose the right term. Fully customizable and compatible with Powerpoint, Keynote, and Google Slides. With this template, you can demystify mortgage options and empower individuals to choose the mortgage that best fits their needs and financial goals.


26 slides
Doriyan Presentation Template
Doriyan is a beautiful, colorful, professional and descriptive presentation. This template has wonderful colors and graphics that are engaging and conveys the information to the audience. This template is suitable for all types of businesses especially those that are investors, realtors or other companies involved in investment advice. Charts, timelines and easy to edit text makes this template perfect for businesses seeking to introduce there business and services to make a great impression. Doriyan offers a way to boost your business. Present your information with this efficient template!


4 slides
Logistics Chain and Delivery Map Presentation
Navigate global supply chains with ease using this dynamic shipping and delivery slide. Designed around a cargo ship visual, this infographic helps teams outline each stage of their logistics journey—from origin to destination. Ideal for supply chain updates, shipping plans, or logistics strategy meetings. Fully compatible with PowerPoint, Keynote, and Google Slides.


5 slides
Key Business Benefits and Value
Present your organization’s core strengths using this 4-part value diagram. Ideal for outlining benefits, service pillars, or strategic goals, the slide features directional arrows with matching icons for clarity and structure. Easy to customize in PowerPoint, Keynote, and Google Slides—adjust text, icons, and colors to align with your business branding.


18 slides
Business Data Analysis Dashboard Presentation
Track Business Performance Effectively! The Business Data Analysis Dashboard Presentation provides a structured and visually engaging way to showcase key metrics, trends, and insights. Featuring dynamic charts, graphs, and KPI indicators, this template is perfect for executive reports, financial reviews, and strategic planning. Fully customizable and compatible with PowerPoint, Keynote, and Google Slides for seamless presentation.


25 slides
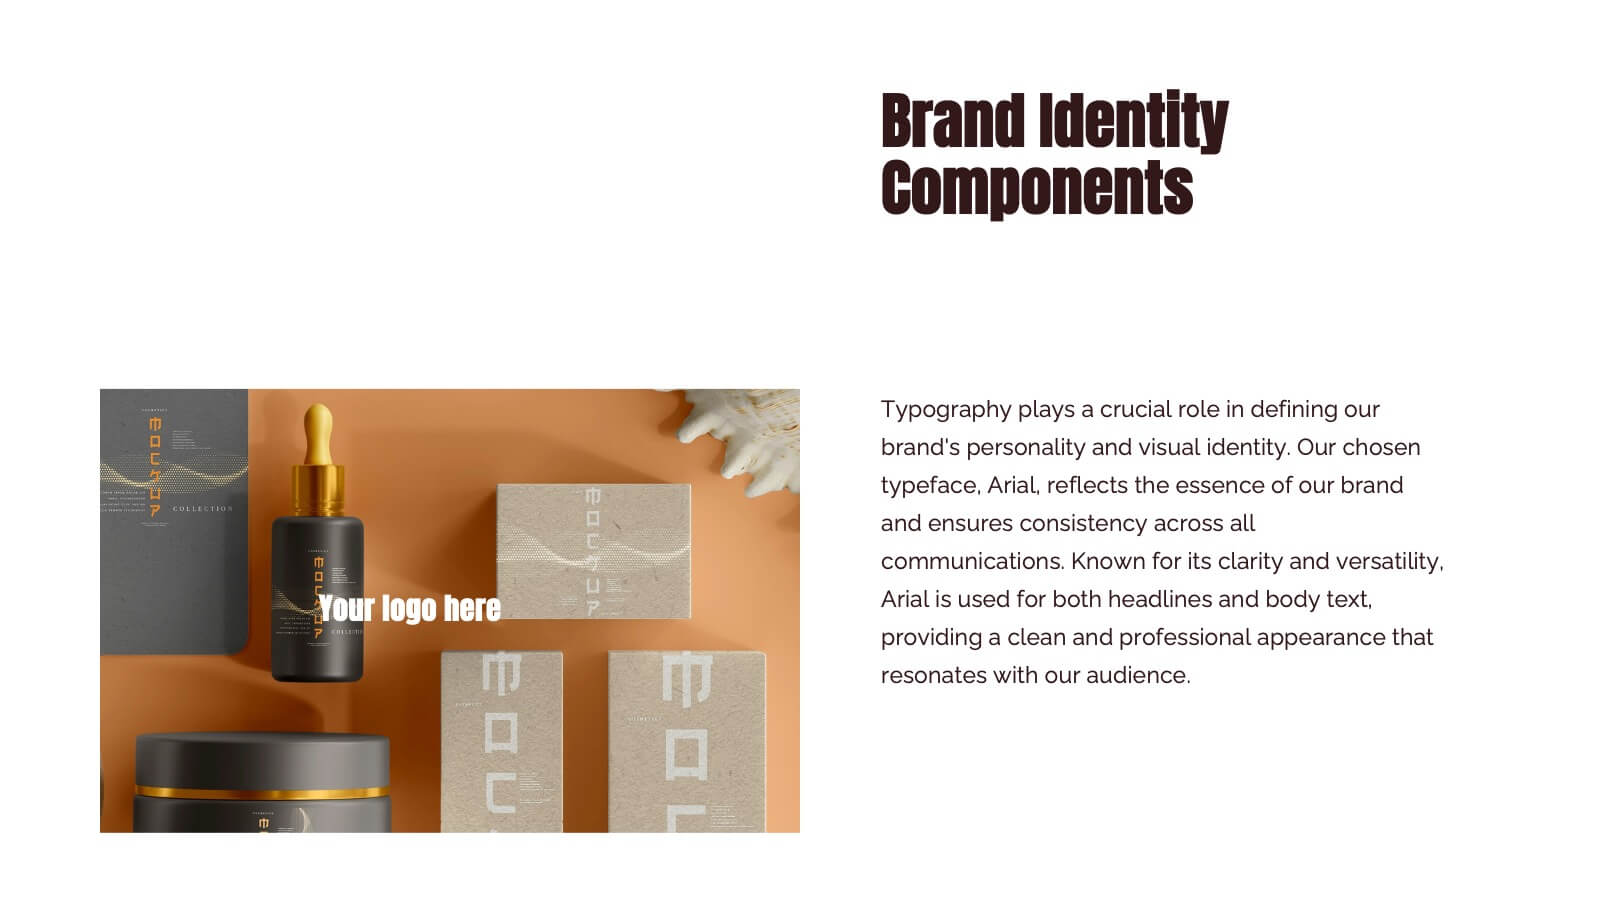
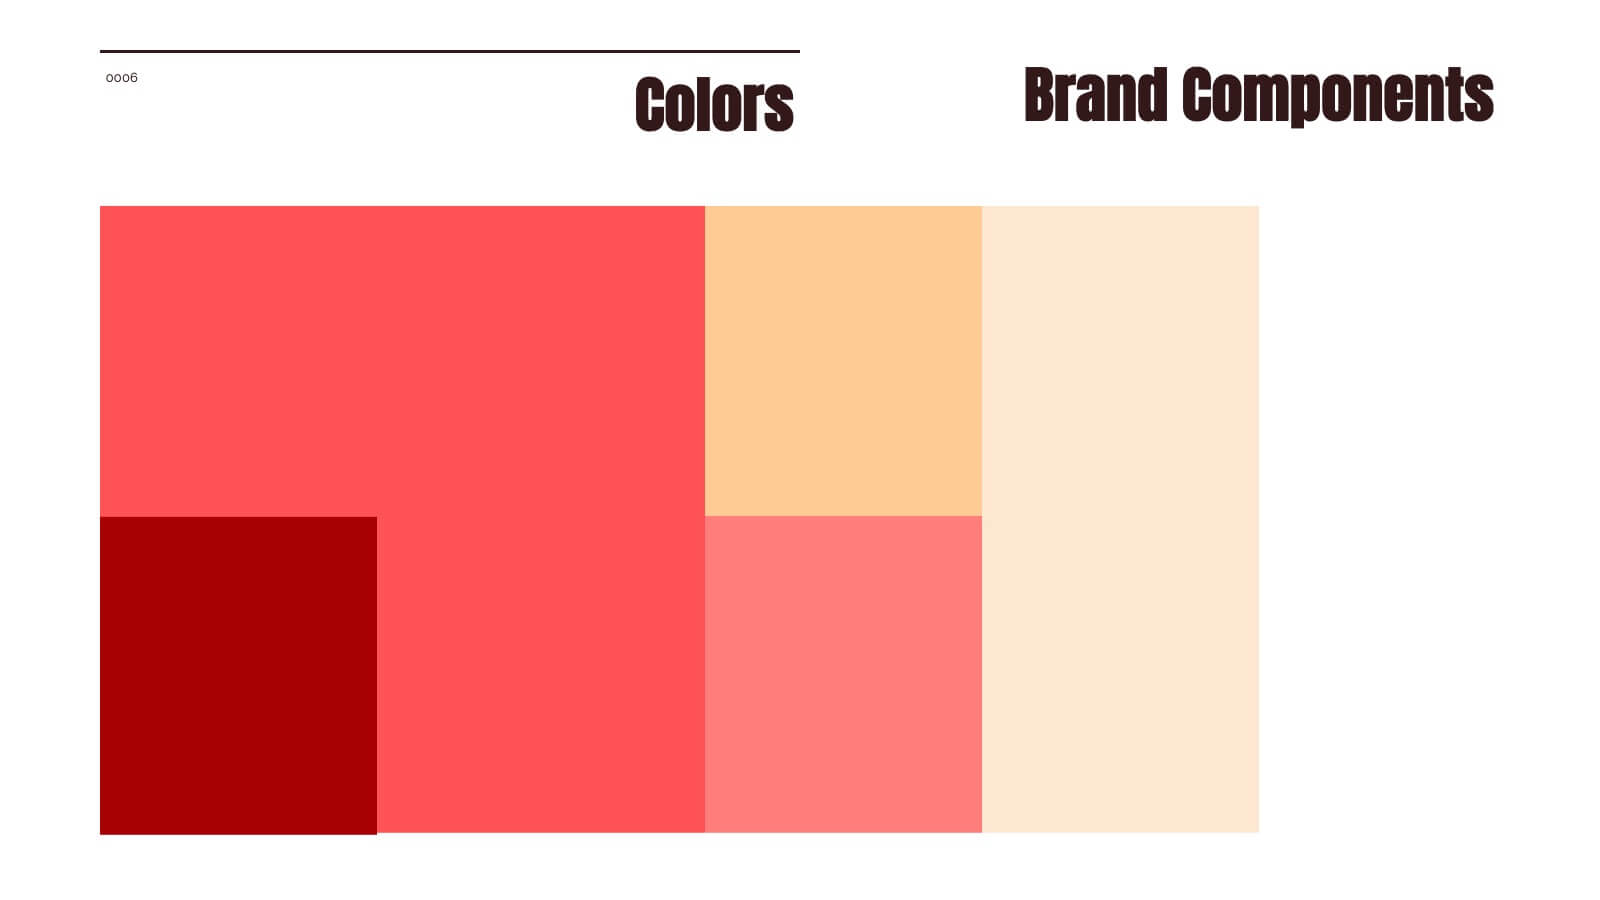
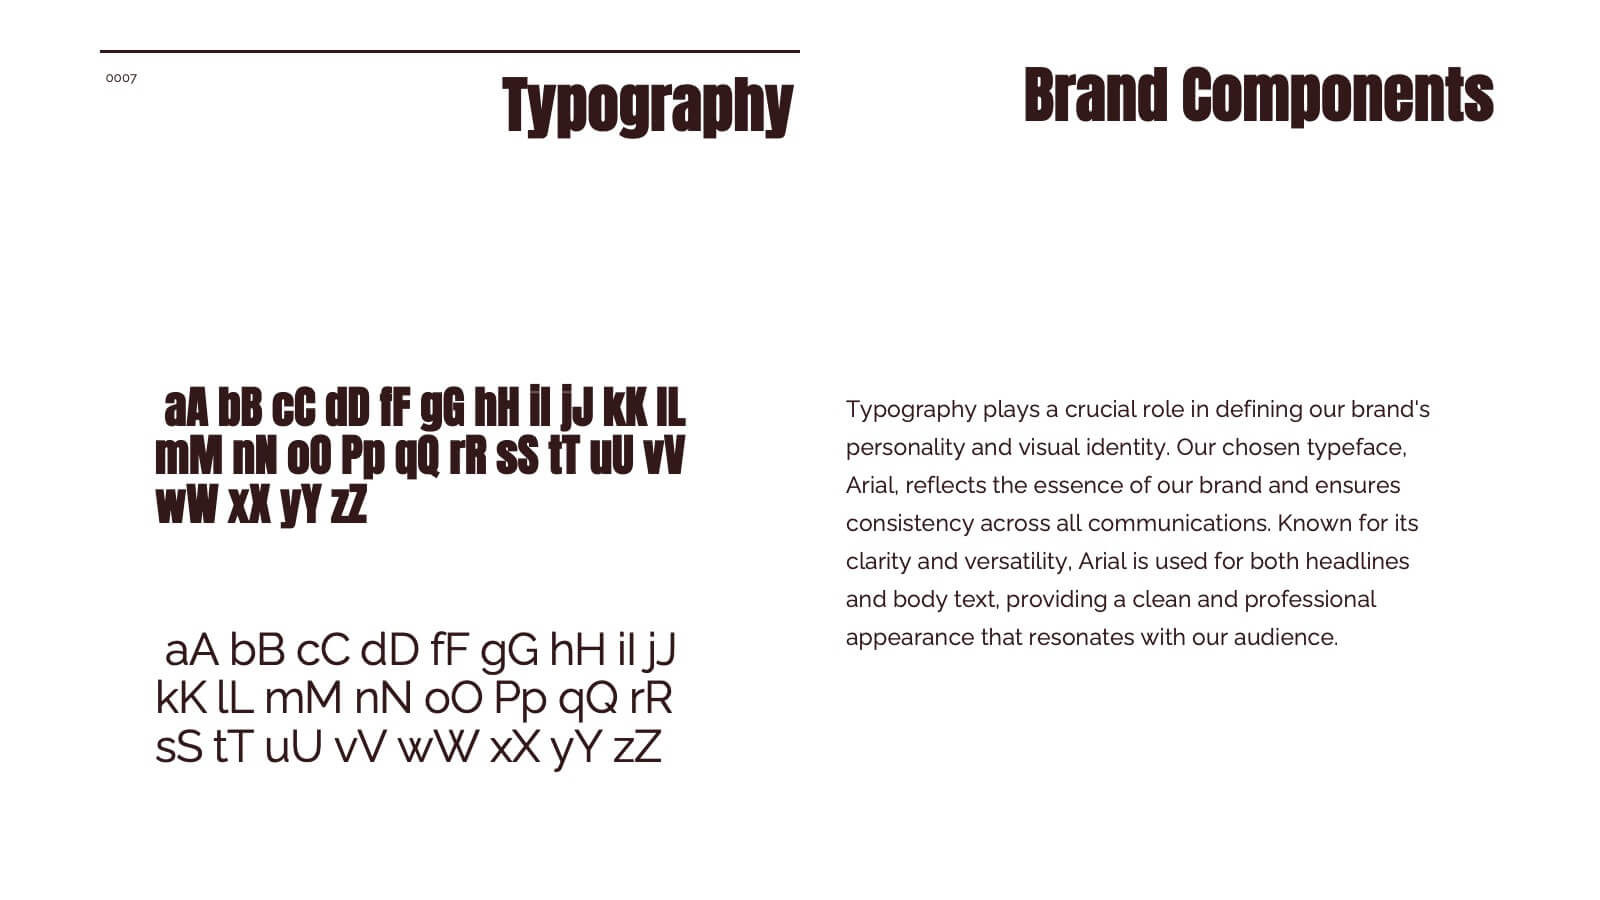
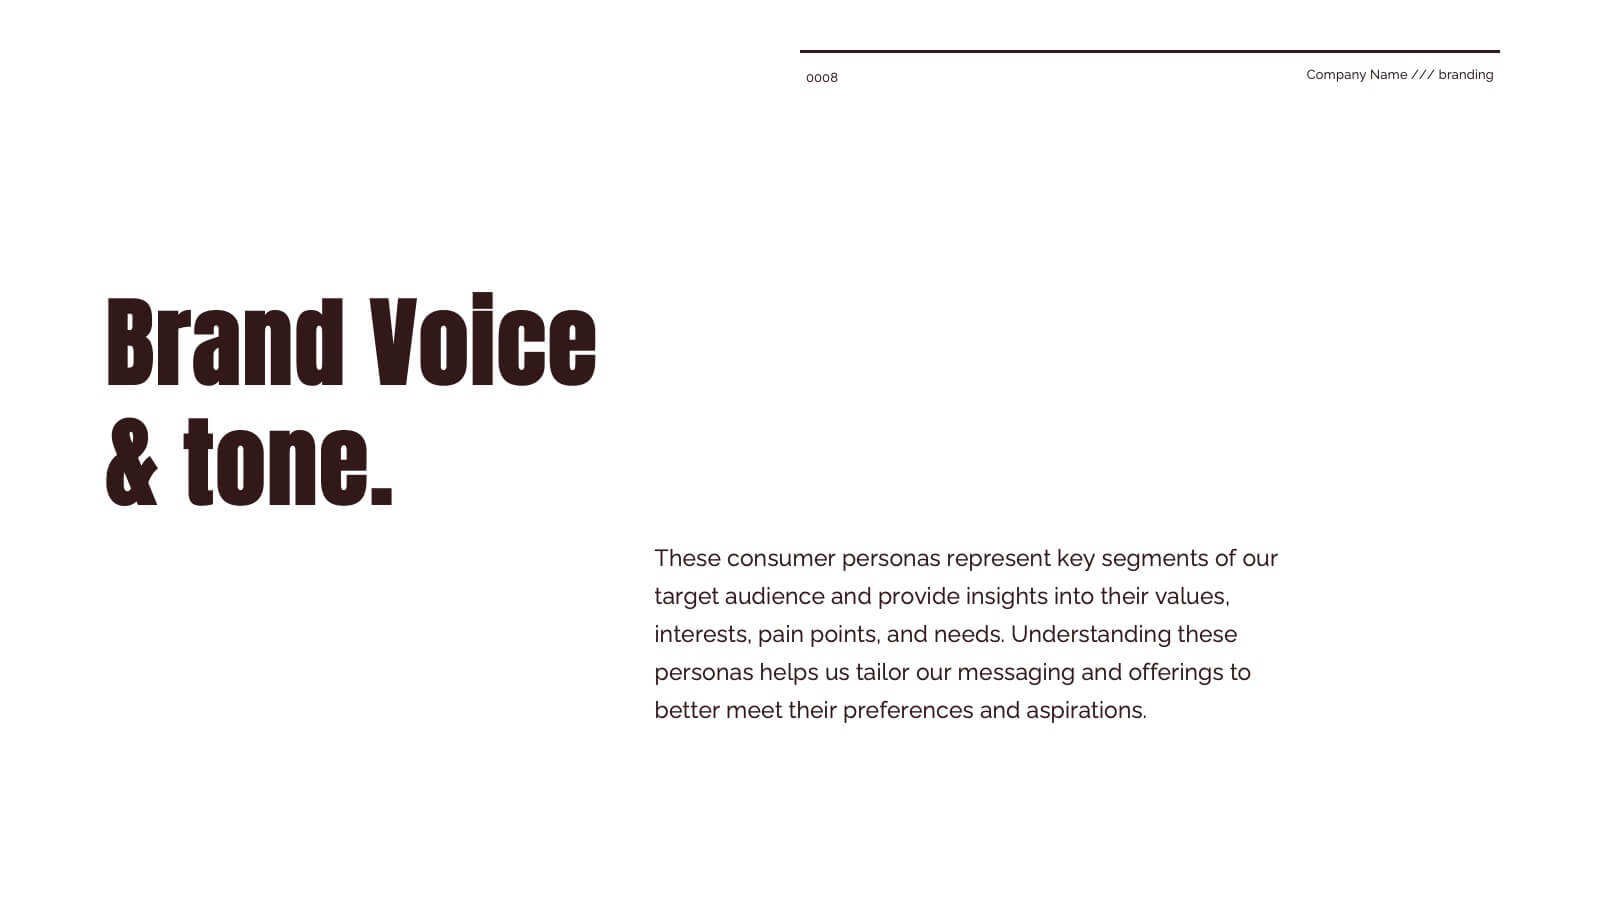
Blaze Brand Identity Presentation
Ignite your brand's potential with this vibrant, blaze-inspired presentation! Ideal for showcasing your brand identity, this template highlights key elements like logo design, color palette, and brand messaging with bold visuals and a modern layout. Perfect for making your brand stand out. Compatible with PowerPoint, Keynote, and Google Slides.


7 slides
Gantt Chart Infographic Presentation Template
A Gantt chart is a graphic chart that illustrates the start and finish dates of project activities, and its tasks or events between a start and finish date. The resulting charts are often used to depict the relationship between individual tasks in addition to their dependencies and duration estimates. This Gantt chart template is easy to use, and allows you to adjust start and end dates with a simple drag and drop. This template is designed to help you start organizing your project by identifying tasks and dependencies on those tasks, without overwhelming you with a comprehensive layout.
7 slides
Project Milestone Tracking Presentation
Efficiently monitor key project milestones with our "Project Milestone Tracking" presentation templates. These visually clear and user-friendly tools are perfect for project managers to showcase task completions, priority levels, due dates, and overall project progress, ensuring that every team member is aligned and informed. Compatible with PowerPoint, Keynote, and Google Slides, these templates streamline project updates and enhance team coordination.


6 slides
Modern Agriculture Trends Presentation
Bring innovation to the forefront with this visually engaging presentation design. Perfect for highlighting sustainability practices, agri-tech developments, and market evolution, it helps communicate key insights with clarity and style. Fully customizable and compatible with PowerPoint, Keynote, and Google Slides for a polished, professional presentation experience.


4 slides
Stock Market Insights and Trends Presentation
Visualize complex financial data with ease using the Stock Market Insights and Trends presentation template. This layout features a bold line chart with labeled milestones to highlight key shifts in performance, market patterns, or strategic indicators. Ideal for investment reports, financial briefings, and economic updates. Perfect for analysts, finance professionals, and business strategists. Fully editable and compatible with PowerPoint, Keynote, and Google Slides.


6 slides
Academy Sports Infographic
Sports are physical activities or games that involve individual or team competition and are typically governed by specific rules. This infographic template highlights key aspects of sports and physical activities in an academy setting. Whether it's a school sports program, a community sports academy, or a professional training institute, this infographic provides a comprehensive overview of the benefits, programs, and facilities offered by an academy sports institution. This template is compatible with Powerpoint, Keynote, and Google Slides making it easy to navigate and can be easily customized to fit your presentation needs.


4 slides
Minimal Title Page Variations Presentation
Highlight key ideas with style using the Minimal Title Page Variations Presentation. These clean and colorful layouts feature bold numbers, pastel text boxes, and abstract 3D artwork to instantly draw attention. Perfect for agendas, summaries, or content previews. Includes multiple layout options and is fully editable in PowerPoint, Keynote, and Google Slides.


6 slides
Global Sourcing and Distribution Presentation
Present your supply strategy with clarity using the Global Sourcing and Distribution Presentation. This slide features a central sourcing hub with segmented groups to illustrate regional or functional distribution channels. Ideal for global logistics, procurement planning, or stakeholder reporting. Fully editable in PowerPoint, Keynote, and Google Slides.