


Features
- 2 Unique Slides
- Fully editable and easy to edit in Microsoft Powerpoint, Keynote and Google Slides
- 16:9 widescreen layout
- Clean and professional designs
- Export to JPG, PDF or send by email


Do you have any questions?
Recommend


6 slides
Closing Summary and Key Takeaway Presentation
End your presentation with clarity using this Closing Summary and Key Takeaways Presentation. The segmented half-circle design helps you highlight up to 5 final messages or calls to action. Each section is color-coded for visual emphasis and easy understanding. Ideal for wrap-up slides, final reflections, or summary overviews. Fully editable in PowerPoint, Keynote, Google Slides, and Canva.


5 slides
Social Media Strategy Infographic
Social Media refers to digital platforms and websites that allow users to create and share content, engage with others, and participate in online communities. This presentation template is a powerful tool to help you create a comprehensive social media strategy. It provides a visually appealing and easy-to-understand overview of the key elements of a successful social media strategy. Use this template to plan and communicate your social media strategy effectively, ensuring that you make the most of your social media presence and engage your target audience efficiently. This template is compatible with Powerpoint, Keynote, and Google Slides.


5 slides
Enterprise IT System Design Presentation
Create a professional Enterprise IT System Design presentation with this structured diagram. Ideal for showcasing IT infrastructure, system architecture, data flow, and integration strategies, this fully customizable template is compatible with PowerPoint, Keynote, and Google Slides.


26 slides
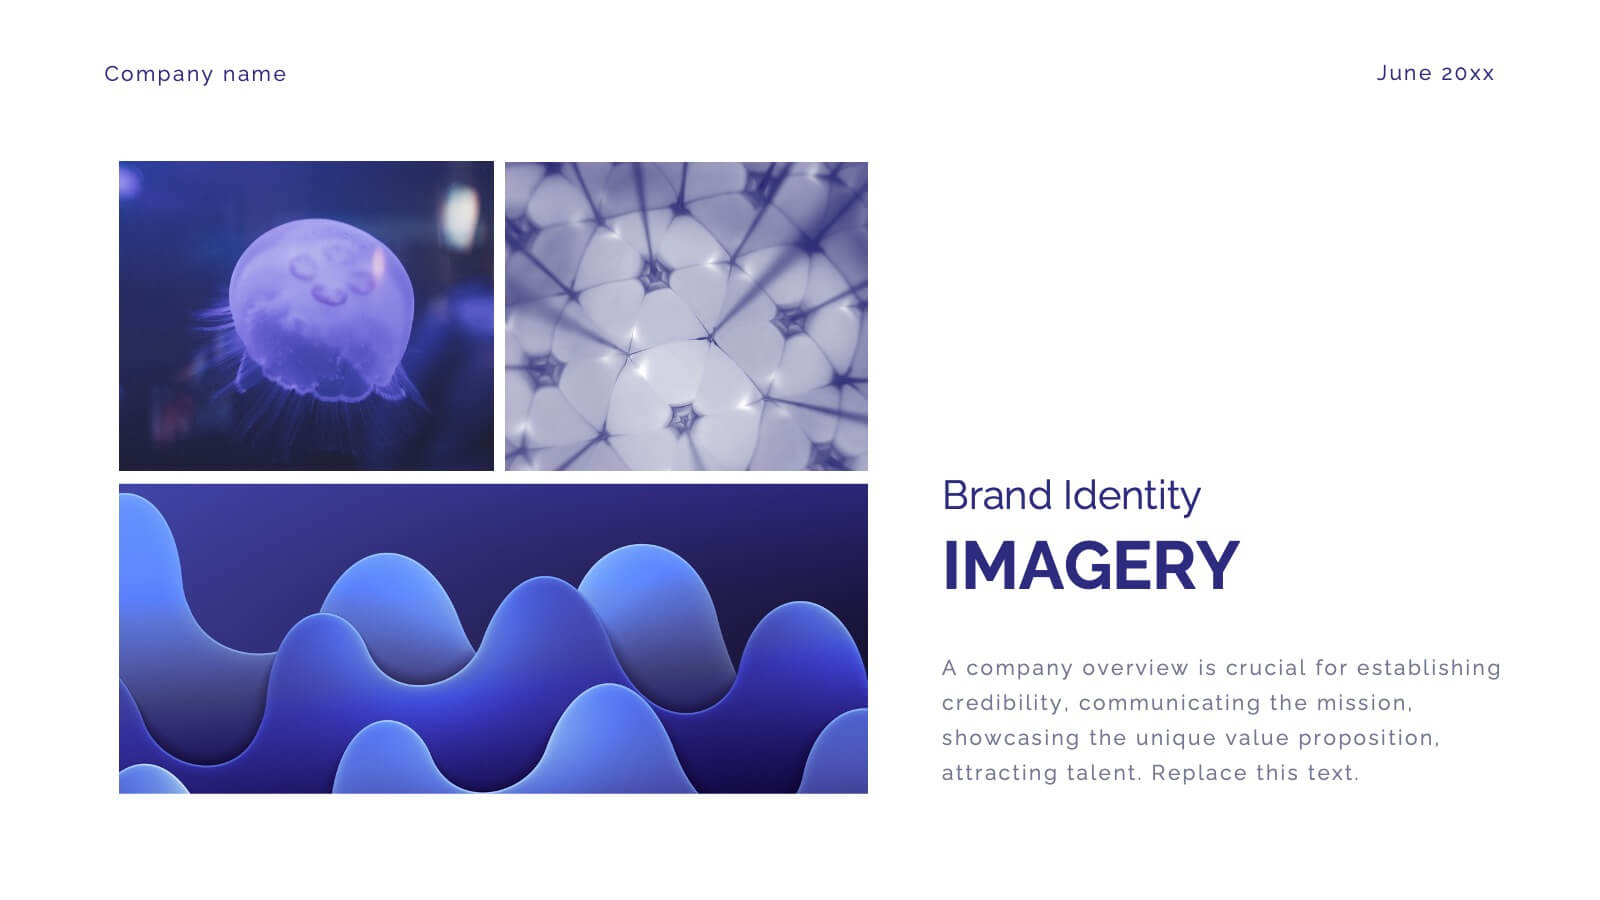
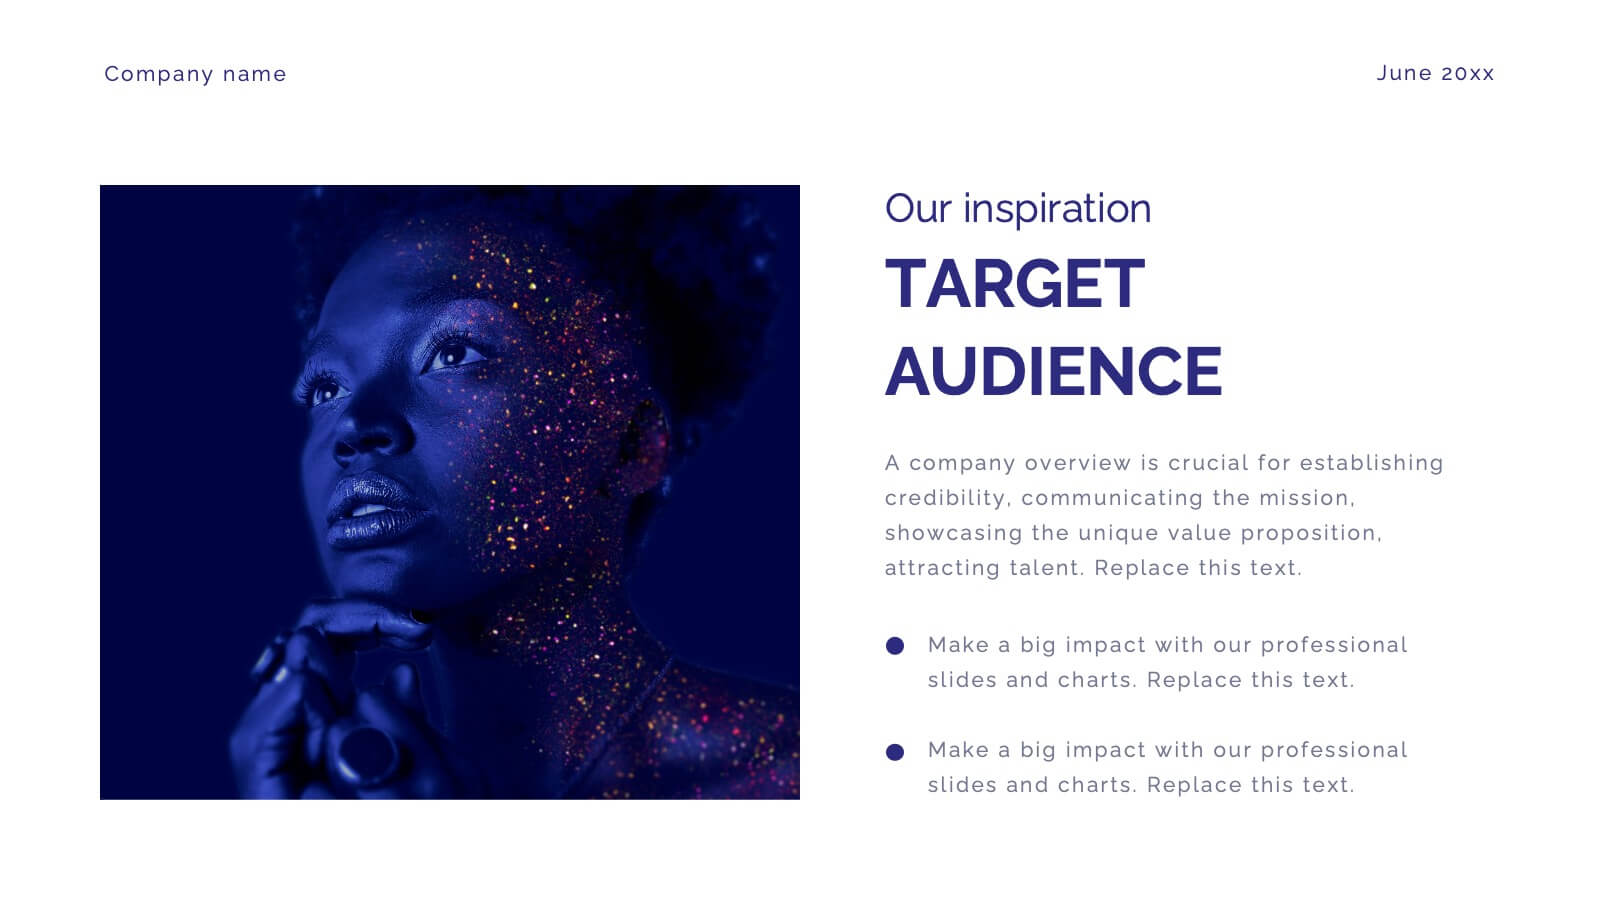
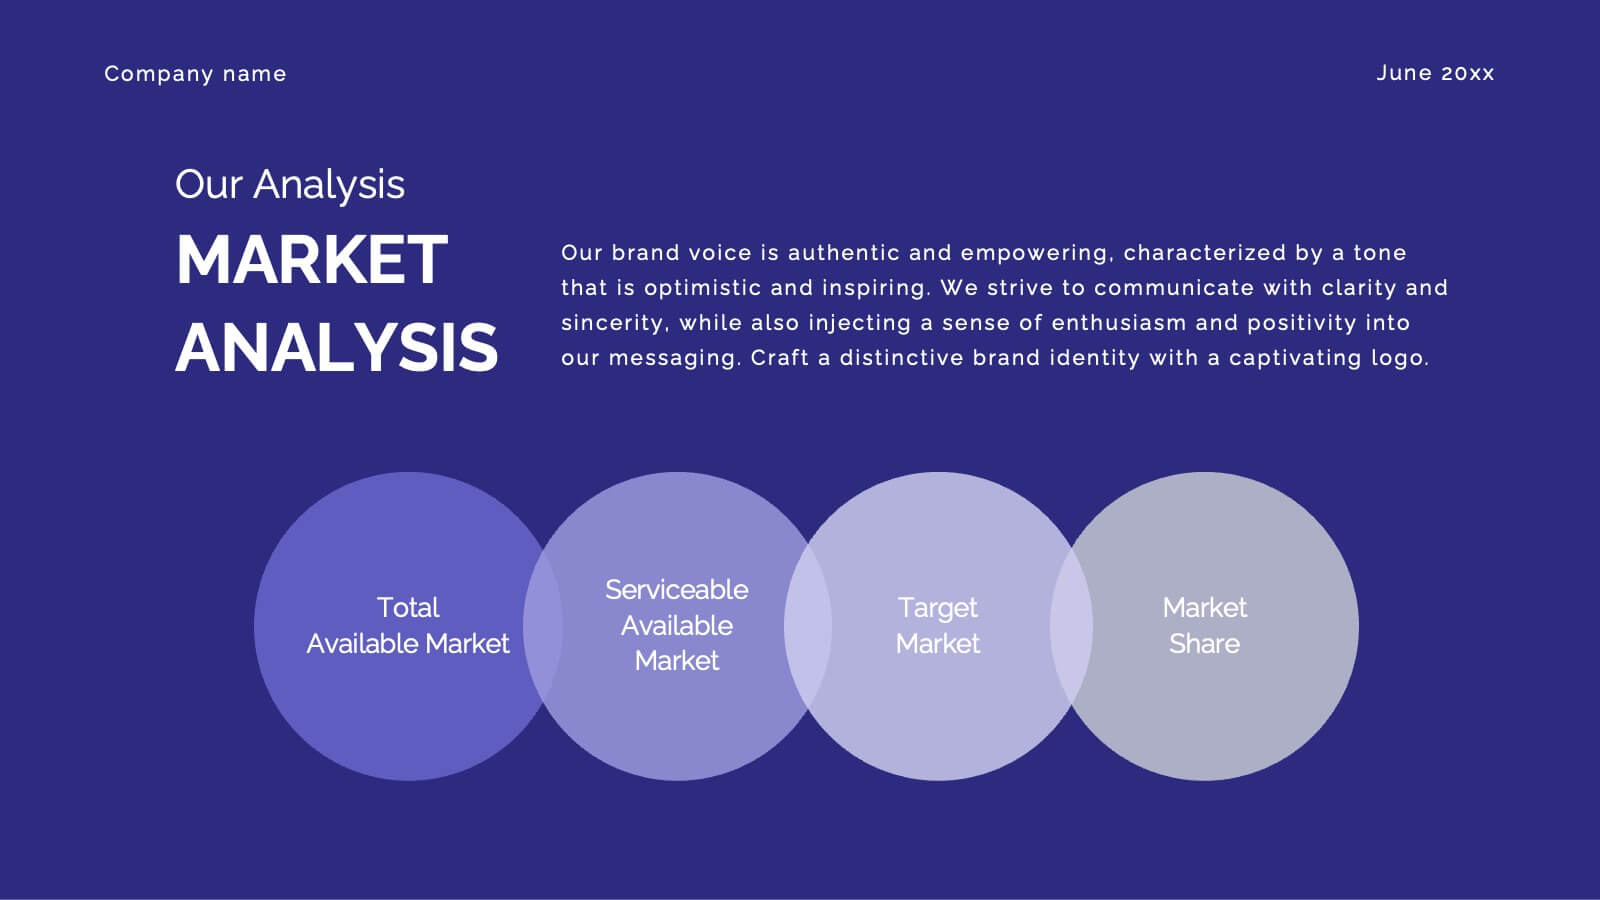
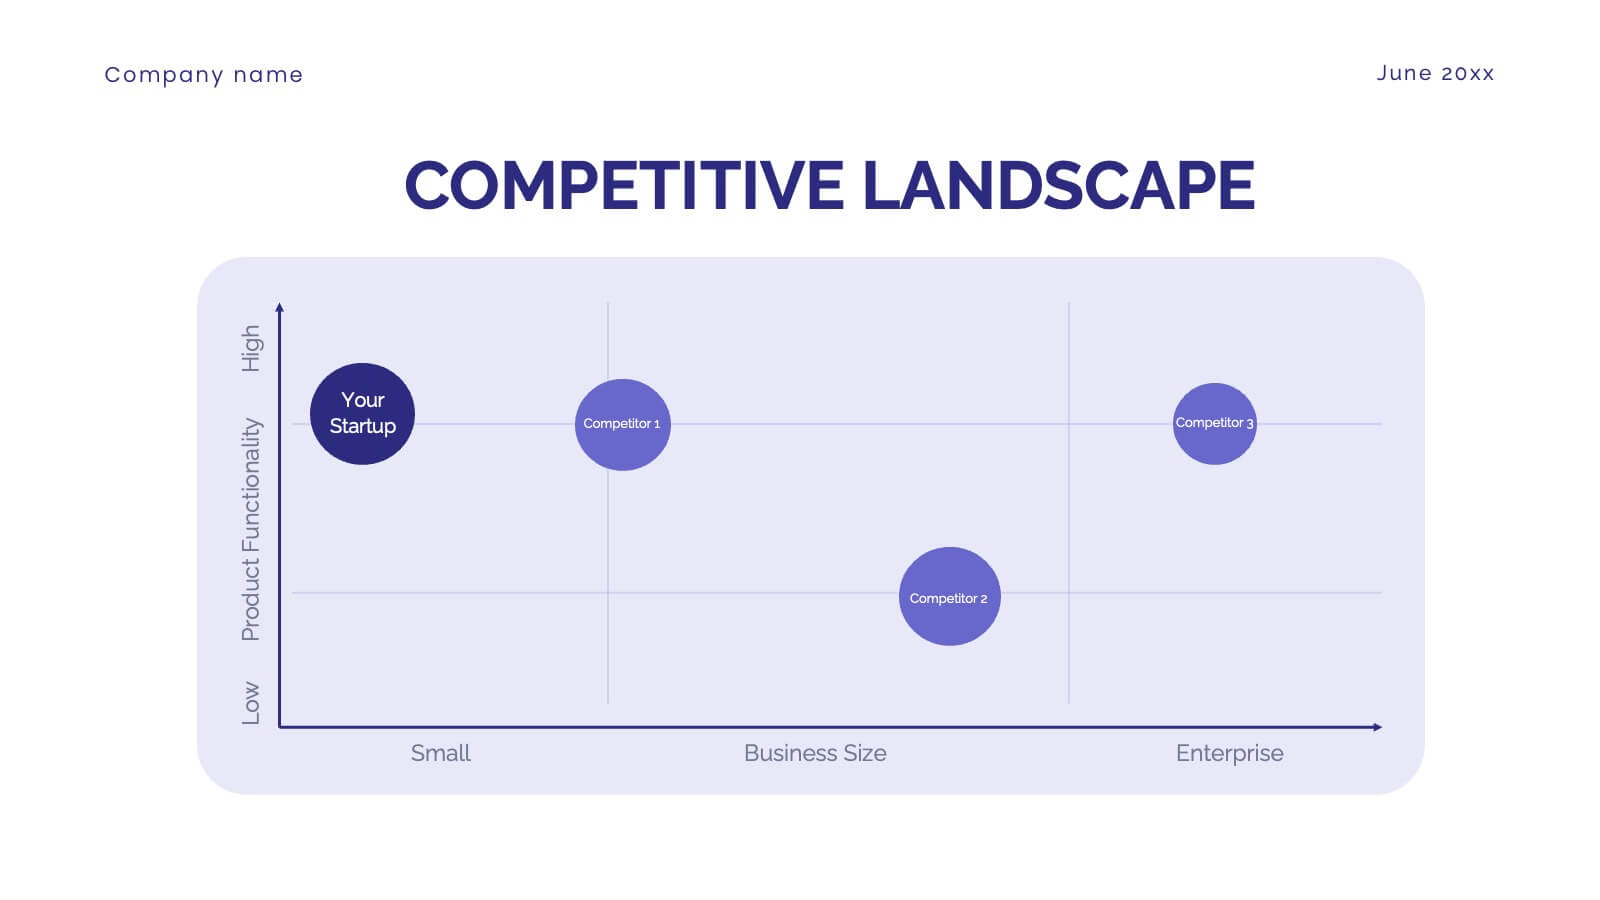
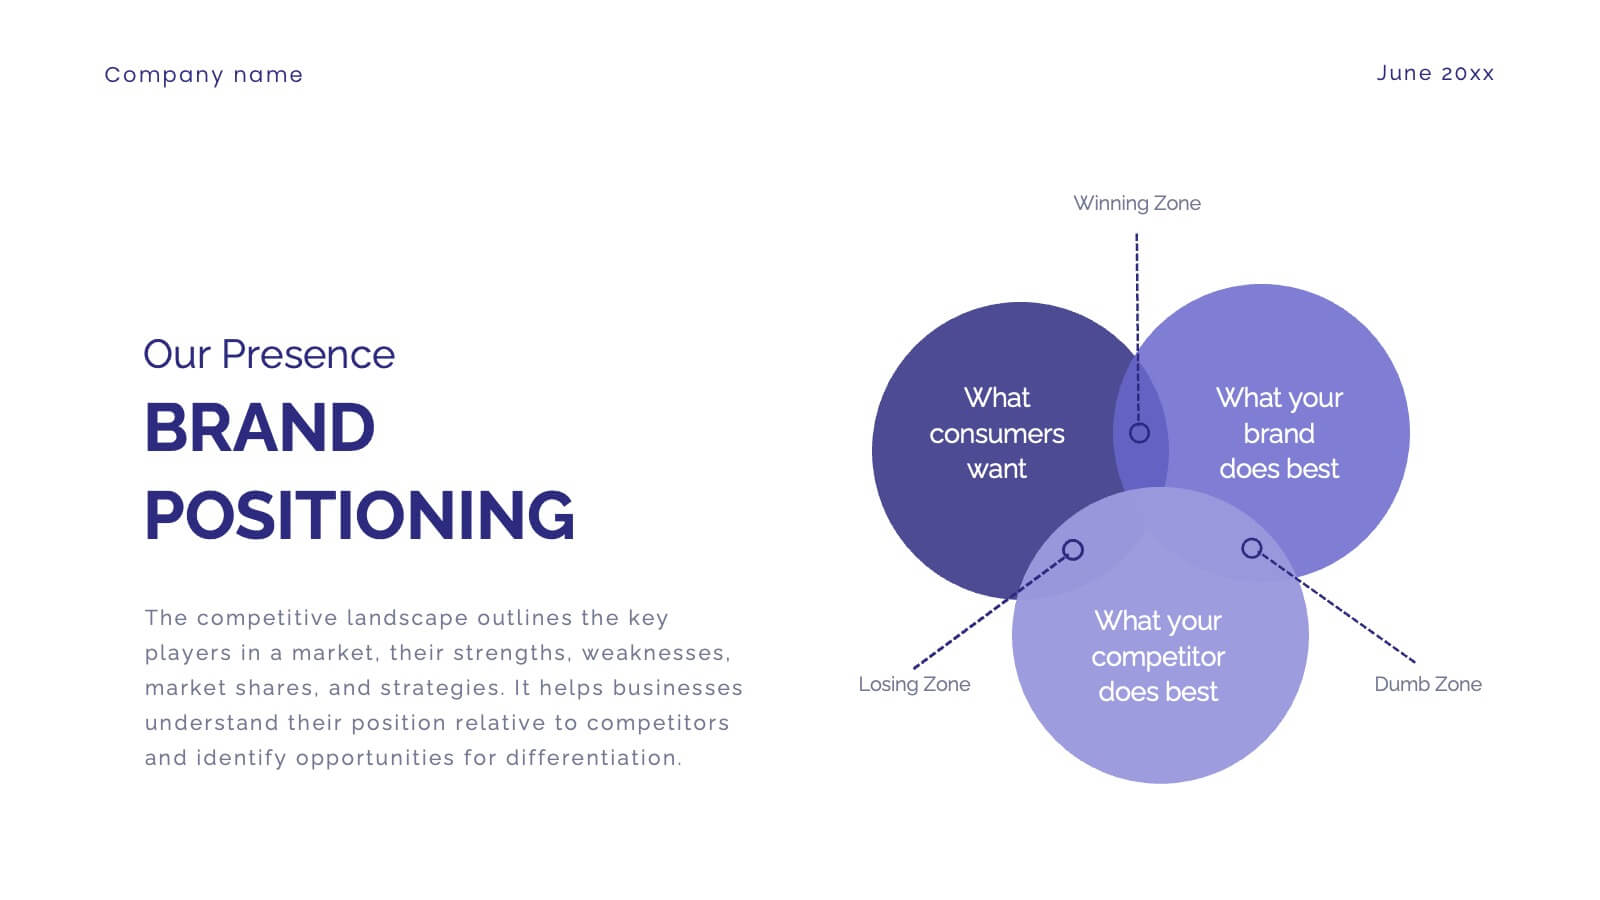
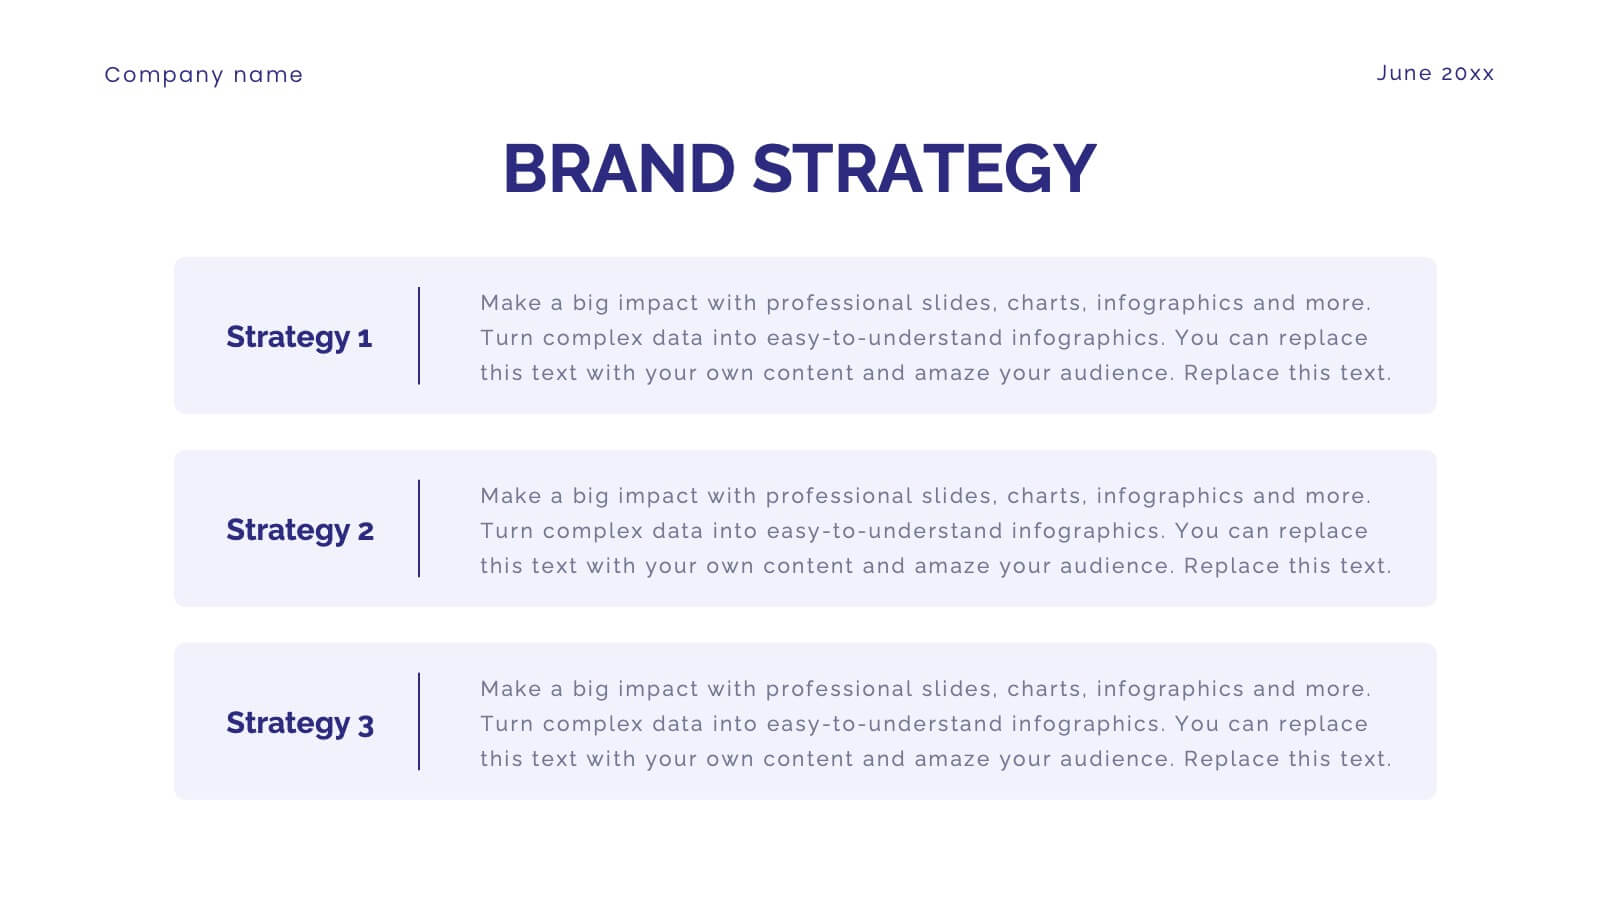
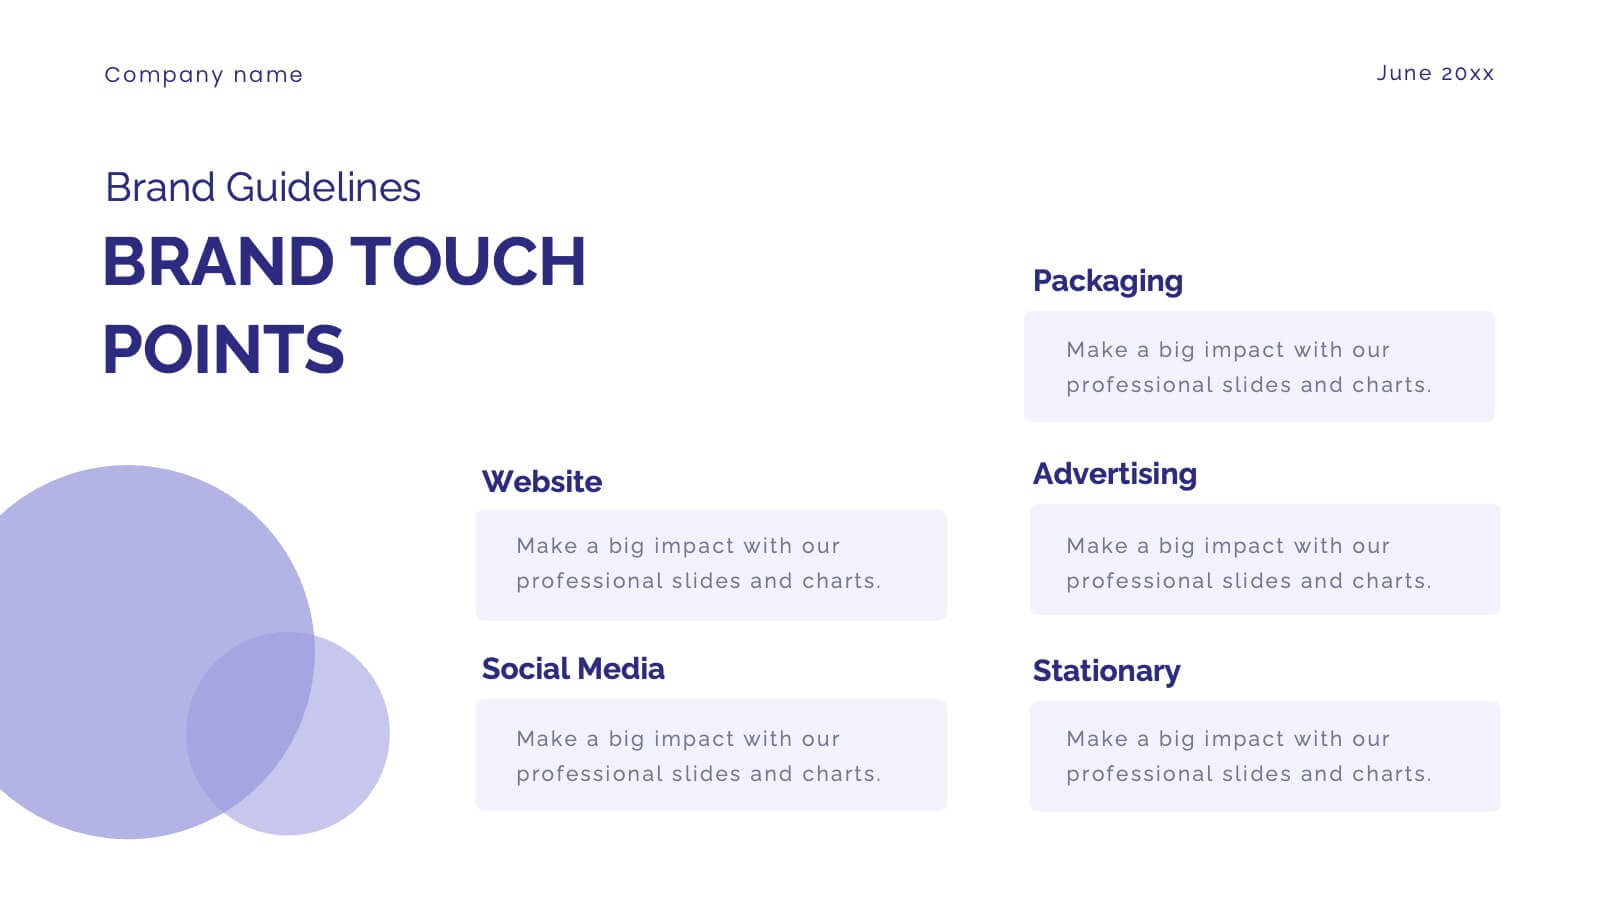
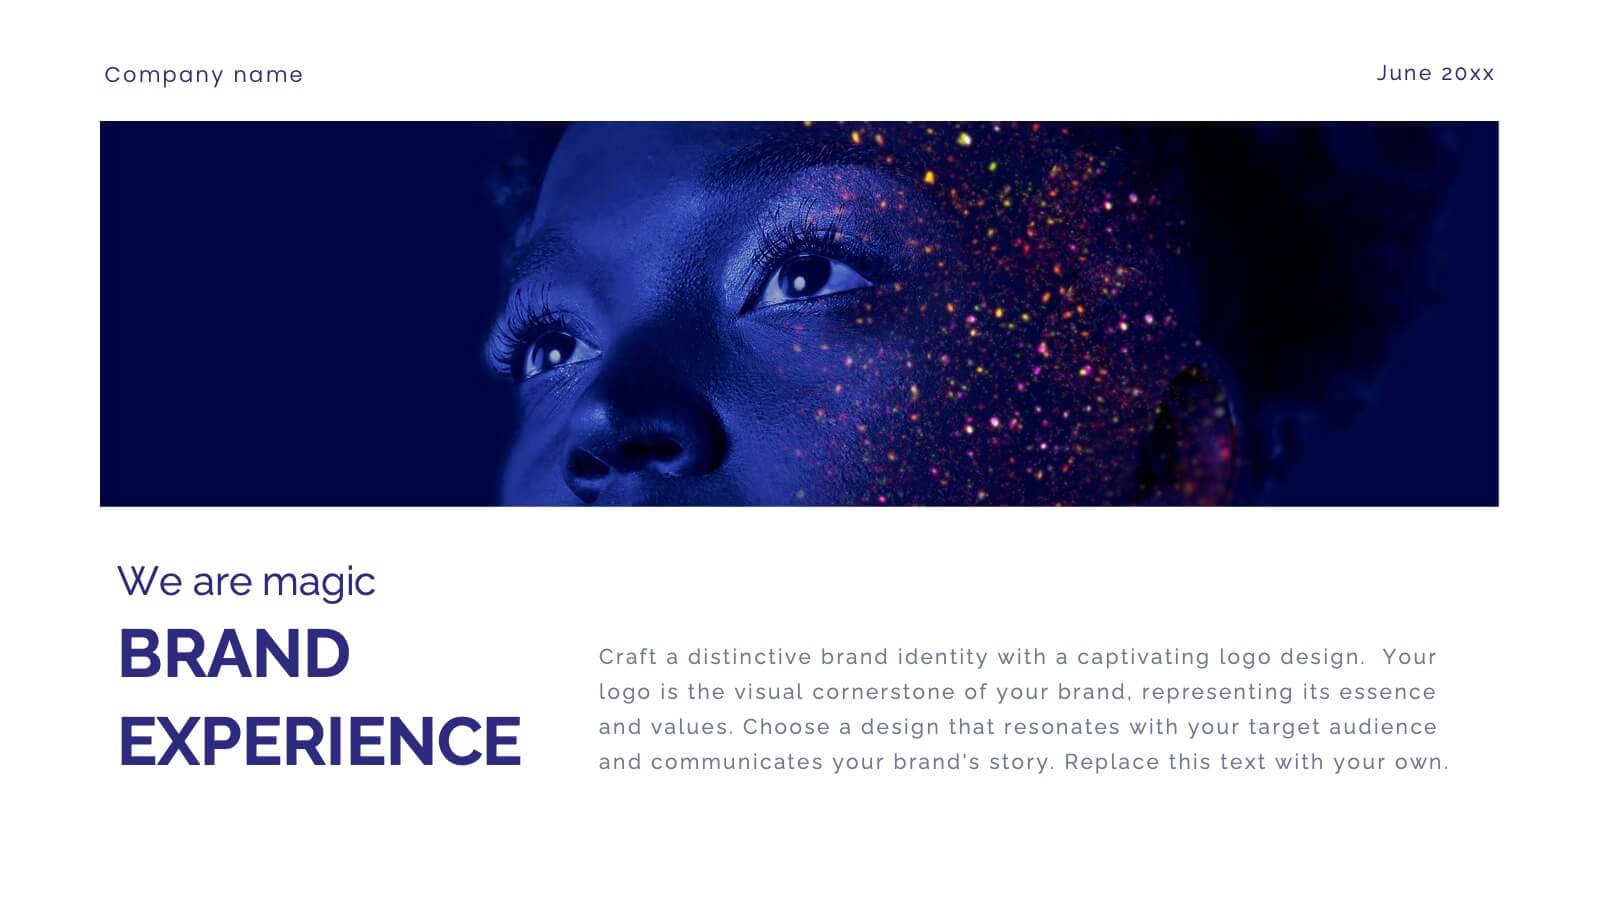
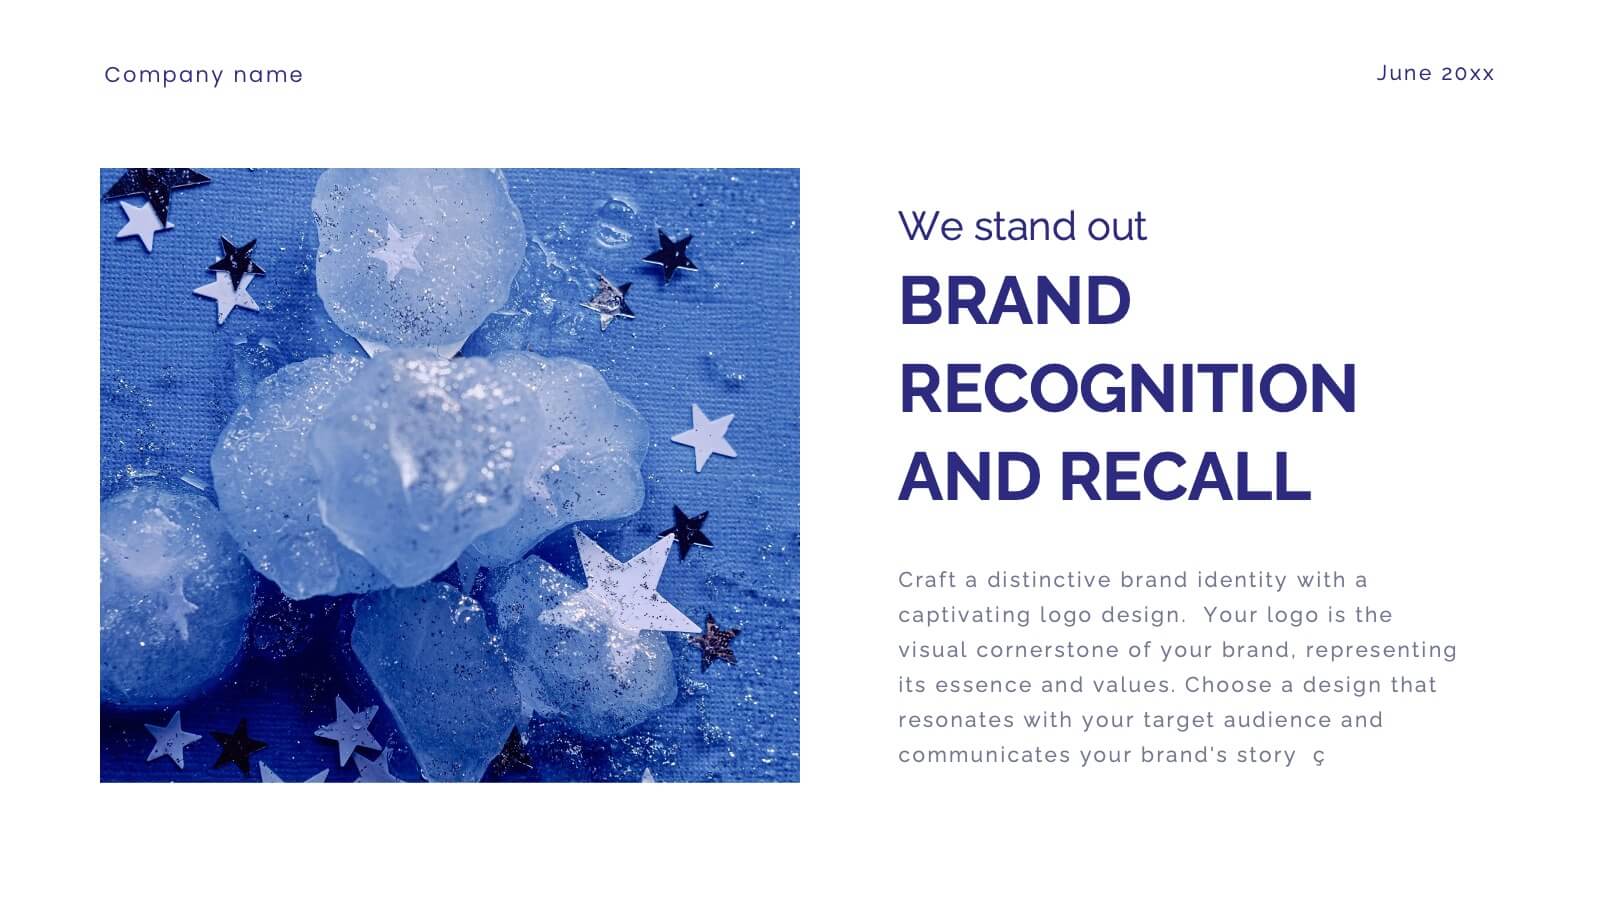
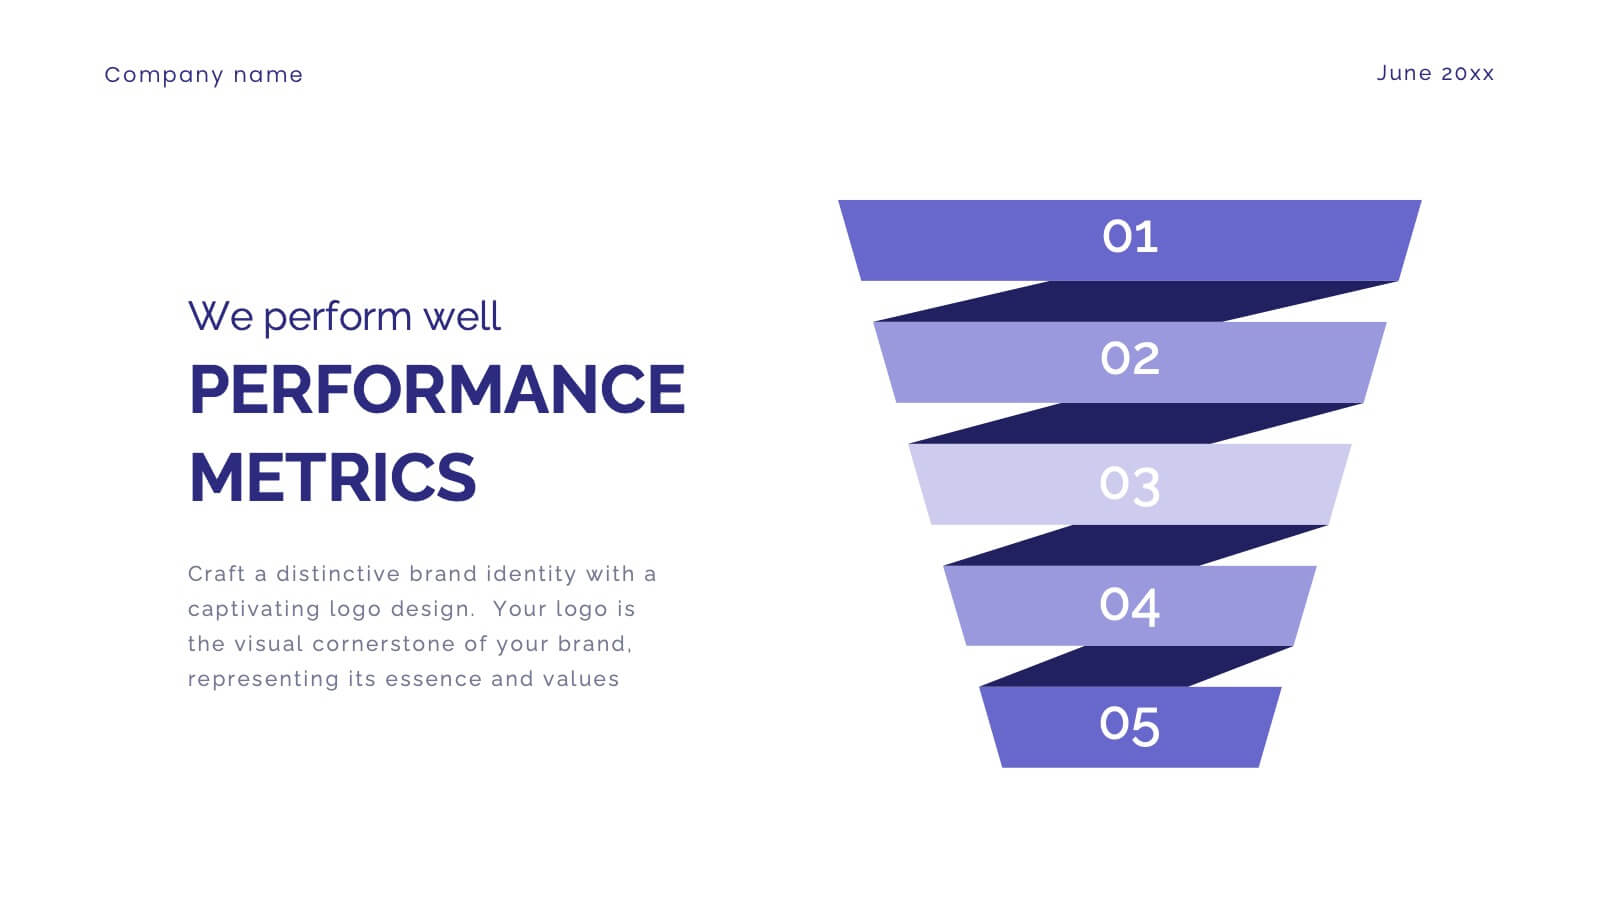
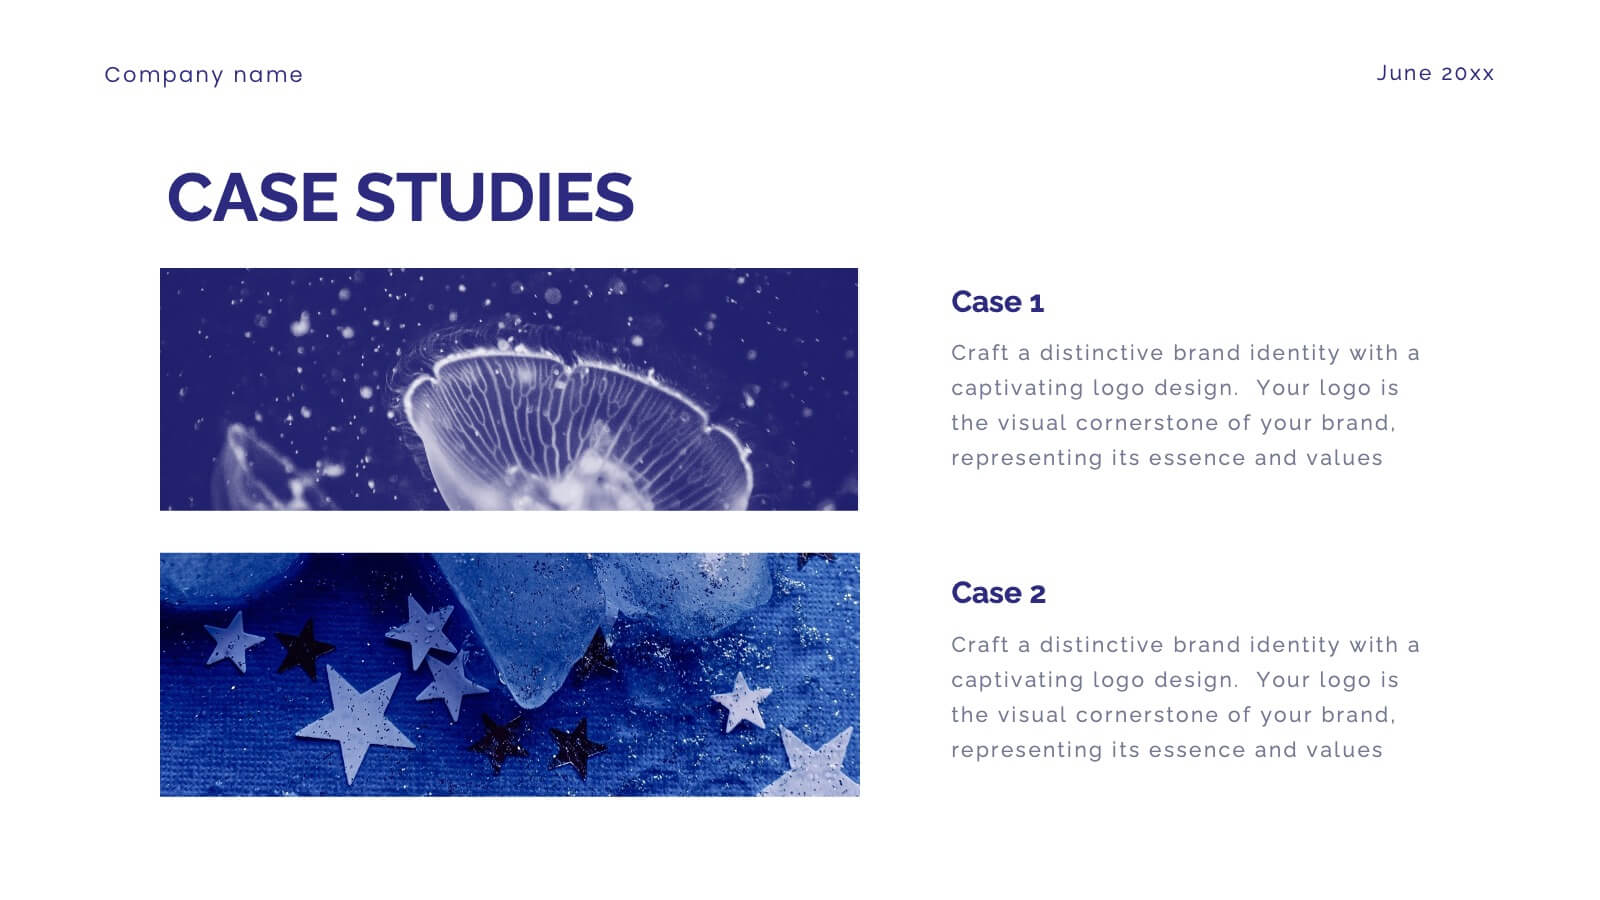
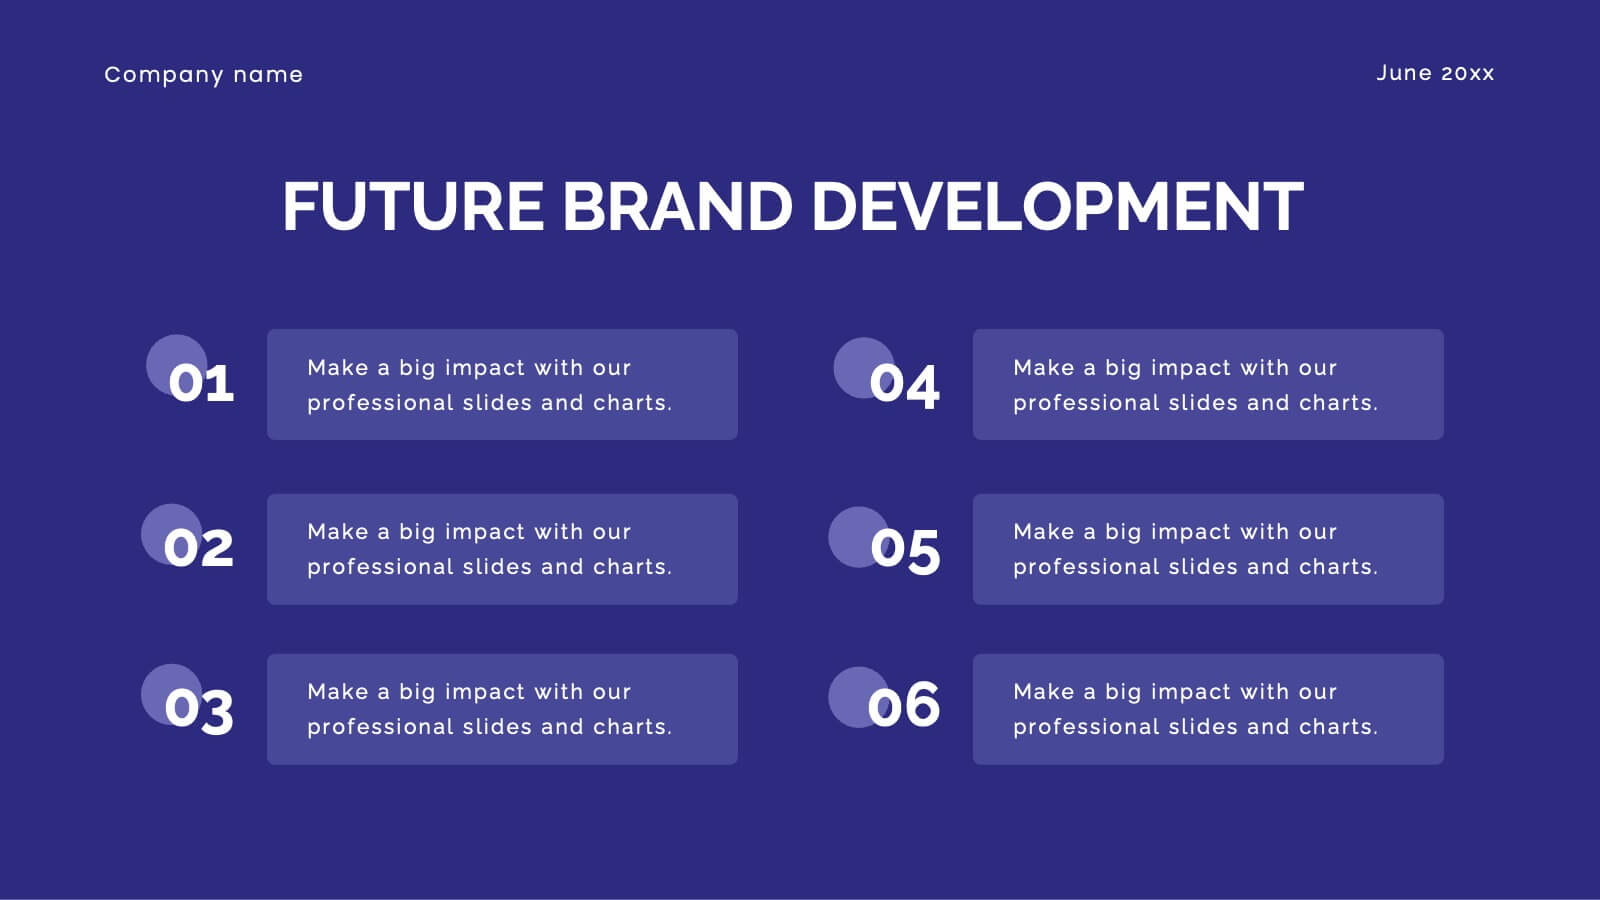
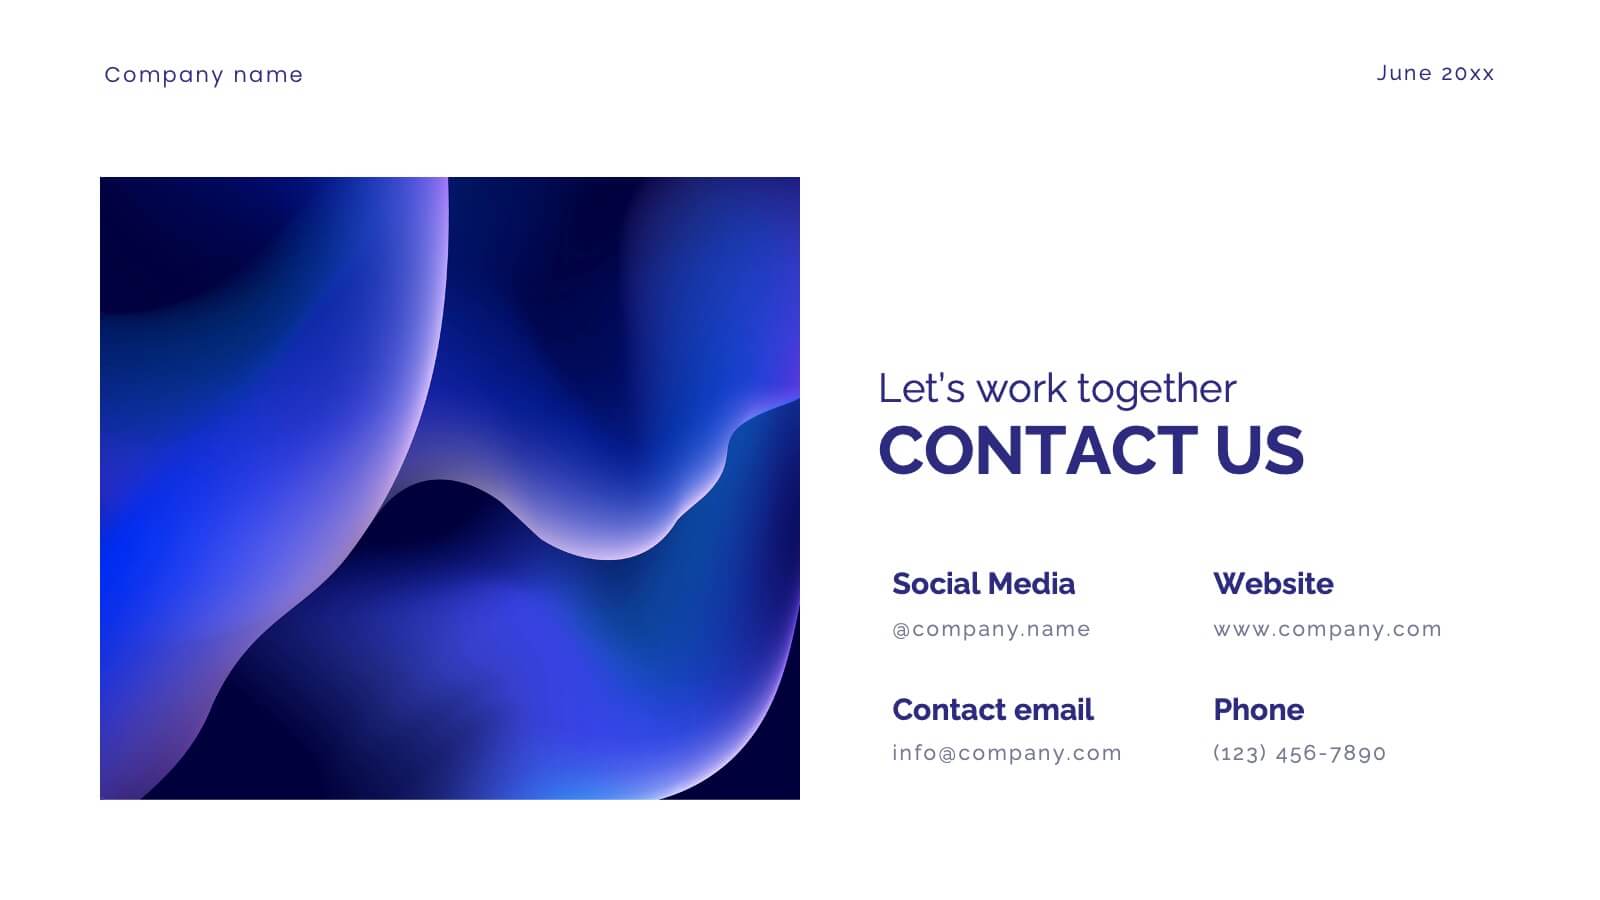
Glimmer Brand Development Pitch Deck Presentation
Elevate your brand with this comprehensive rebranding presentation template! Perfect for detailing your logo, color scheme, and market analysis, it includes slides for brand positioning, competitive landscape, and performance metrics. Engage your audience with clear visuals and structured content. Compatible with PowerPoint, Keynote, and Google Slides for seamless presentations on any platform.


22 slides
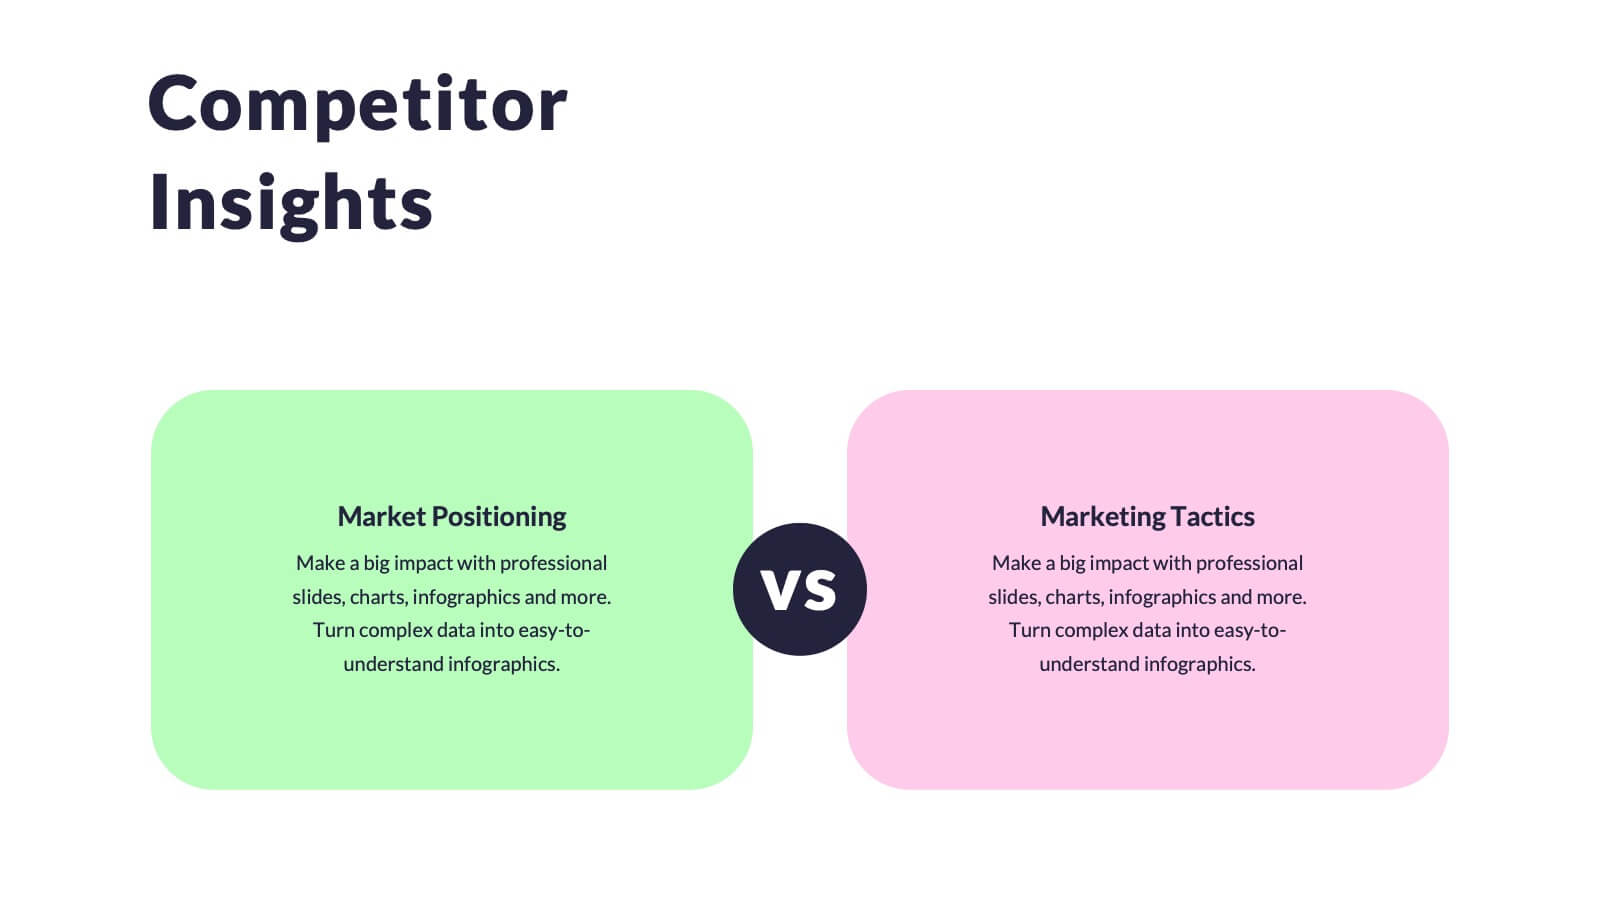
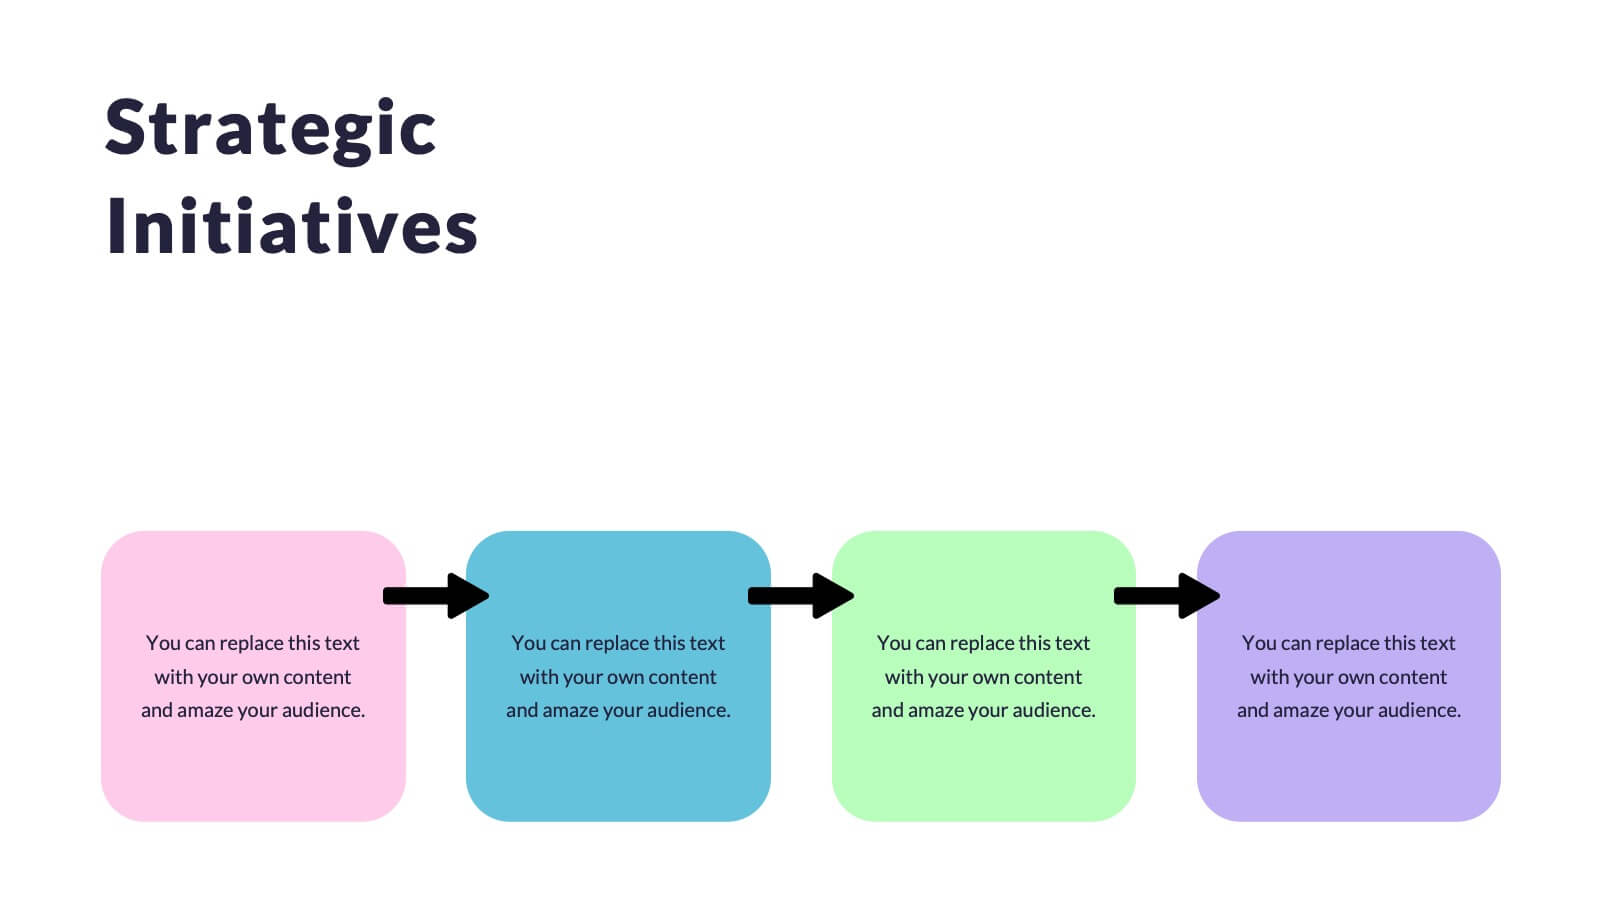
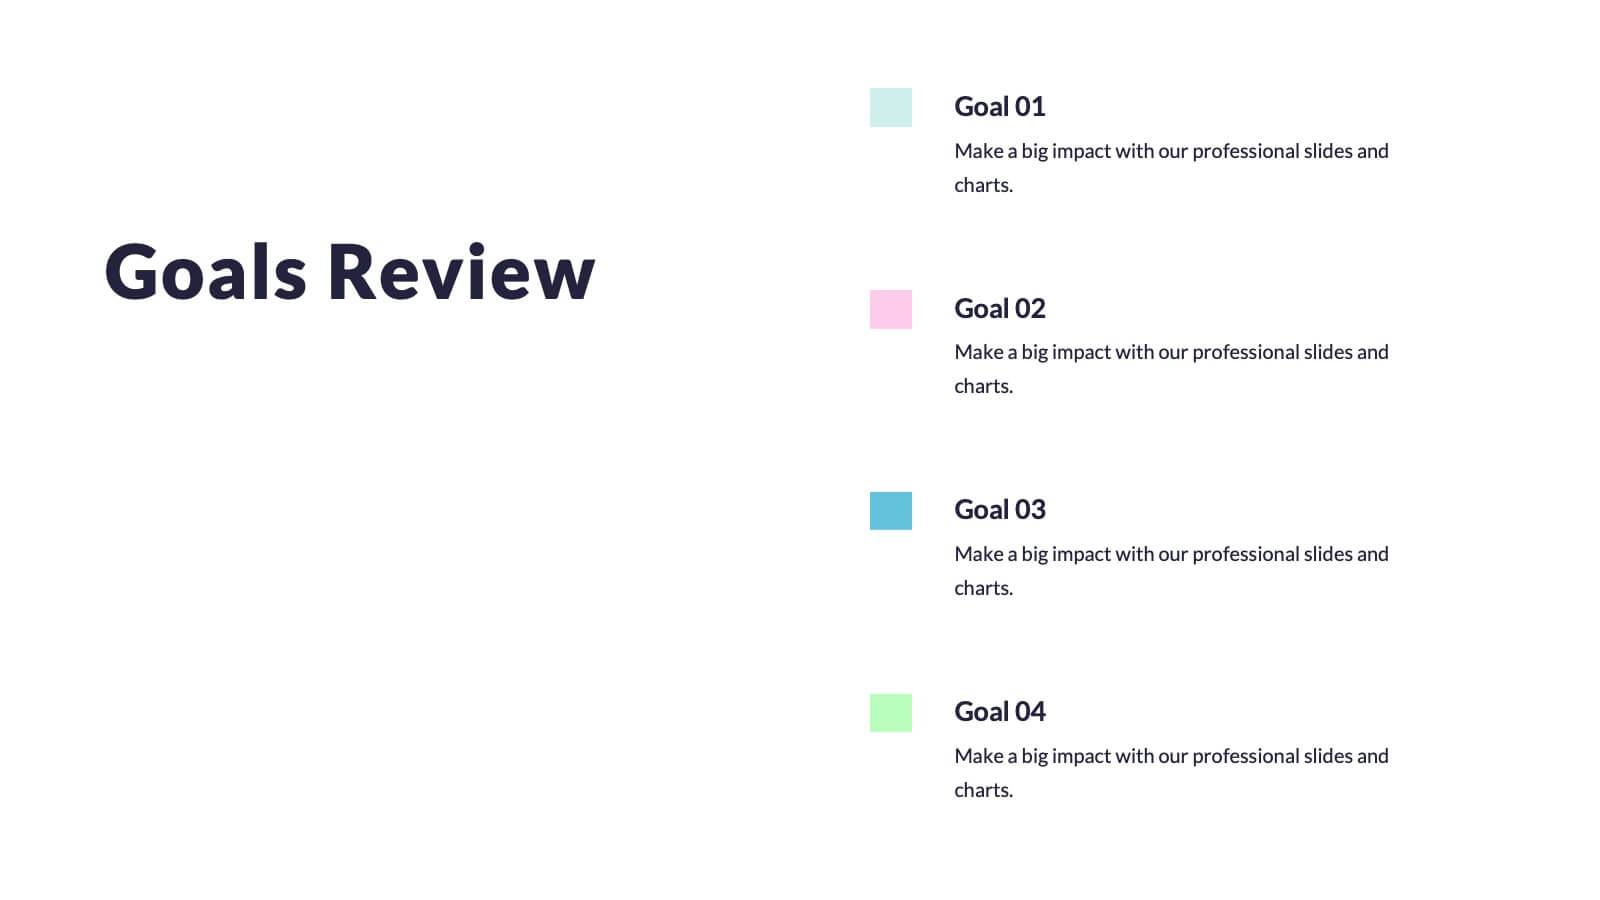
Vivid Market Research Presentation
Unveil the insights that drive decisions with the Vivid Market Research Presentation template! This sleek and professional template is crafted to help you present complex data in an engaging and easy-to-understand format. Whether you're analyzing market trends, exploring customer behavior, or evaluating competitive landscapes, this template provides a clear structure to convey your findings. It includes sections for research objectives, methodologies, key findings, and recommendations, ensuring you cover every aspect of your market research comprehensively. With a clean design that emphasizes clarity and visual appeal, your audience will stay focused and intrigued throughout the presentation. Perfect for business analysts, marketers, and researchers, the Vivid template is fully customizable and works seamlessly with PowerPoint, Keynote, and Google Slides. Elevate your market research presentations and make your data come to life with Vivid!


6 slides
Digital Marketing Consultancy Infographics
Our Digital Marketing Consultancy infographic is an essential visual tool for Powerpoint, Keynote, and Google Slides presentations, tailor-made for digital marketing consultants, strategists, and educators. This infographic is designed to visually articulate the impact and results of digital marketing strategies and campaigns. The Digital Marketing Consultancy infographic presents key marketing metrics in an easily digestible format, from social media engagement rates to website traffic and conversion statistics. It's perfect for showcasing the success of digital marketing efforts and for explaining the return on investment (ROI) to stakeholders. The visual design is crafted to be both informative and attention-grabbing, ensuring your audience fully grasps the significance of the data presented. By using this infographic in your presentations, you can effectively communicate complex digital marketing concepts and analytics to your audience. Whether you’re reporting to clients, training a team, or teaching students, this infographic will enhance your ability to convey essential marketing insights in a clear and engaging manner. Incorporate it into your presentation materials to highlight the benefits and effectiveness of strategic digital marketing initiatives.


5 slides
Steps Process Infographics
A steps process refers to a series of sequential actions or stages that need to be followed to accomplish a specific task or achieve a desired outcome. These informative vertical infographics are designed to showcase step-by-step processes, procedures, or workflows. Whether you need to explain a business process, a project timeline, or a complex procedure, this provides a clear and concise way to present information in a visually engaging manner. The infographic offers a variety of layouts specifically designed to display step-by-step processes. The template allows you to customize the infographics according to your specific needs.


5 slides
Search Engine Marketing Analysis Presentation
Showcase your SEM insights with a presentation slide that’s as sharp as your strategy. This layout helps you break down ad performance, keyword data, and campaign elements clearly and visually. Perfect for marketers presenting to clients or teams, and fully compatible with PowerPoint, Keynote, and Google Slides.


7 slides
Chart Comparison Infographic Presentation
Chart Comparison is the process of comparing different charts or graphs to identify similarities. It involves analyzing multiple sets of data by visually presenting them in charts. Use this template to show the comparison of various charts and how things look when they are compared. This template will help you create a professional Infographic presentation that highlights the key differences between data sets. Each chart can have it's own color, so you can use any color you want. You can also add text in the chart with your own content, and edit in Powerpoint, Keynote, or Google Slides.


7 slides
Business People Management Infographic
Business people refer to individuals involved in the world of commerce and trade, encompassing various roles within the business landscape. This Infographic is an illuminating and dynamic template designed to guide you through the art and science of managing human capital within the business sphere. Explore the key aspects of effective people management and elevate your organizational success by harnessing the power of your workforce. Compatible with Powerpoint, Keynote, and Google Slides. Discover the art of leading and engaging your team, and witness the transformation as your organization excels and grows, driven by the power of effective people management!


5 slides
Poaching Effects Infographics
Navigate the critical issue of wildlife endangerment with our poaching effects infographics. Crafted in earthy tones of brown and tan, this informative and creatively styled vertical template sheds light on the harsh realities of illegal wildlife hunting. Whether you're an environmental activist, an educator, or part of an ecological research team, this infographic is structured to resonate with your audience, offering compelling visuals and thematic icons that starkly represent the consequences of poaching. It's more than a presentation; it's a call to global action, crucial for anyone advocating for wildlife preservation and aiming to inspire change through storytelling.


7 slides
Big Data Tools Infographic
Big Data refers to large volumes of data, both structured and unstructured, that inundate a business or organization on a day-to-day basis. This infographic template is designed to captivate, educate, and empower, providing a bold and clear representation of the sheer magnitude and impact of big data. Compatible with Powerpoint, Keynote, and Google Slides. This template involves processing and analyzing Big Data to extract meaningful insights, patterns, and trends. These insights can be used for business intelligence, decision-making, research, and various other applications across different domains and industries.


4 slides
Food Business Concept Pitch Presentation
Bring your culinary vision to life with the Food Business Concept Pitch Presentation. This unique avocado-shaped layout helps you outline up to four key ideas—from menu innovation to service strategy. Perfect for chefs, restaurateurs, or food startups. Fully editable in PowerPoint, Canva, and Google Slides for easy customization.


4 slides
RACI Matrix Roles and Responsibilities Presentation
Bring clarity to complex workflows with a vibrant, easy-to-follow layout designed to map roles, responsibilities, and decision-making at a glance. This presentation helps teams understand who leads, supports, approves, and informs across key tasks, making collaboration smoother. Fully editable and ready to use in PowerPoint, Keynote, and Google Slides.


6 slides
Agile Development Methodology Infographic
Discover a visually engaging way to present the Agile Development Methodology with our versatile infographic template. Perfect for Powerpoint, Google Slides, and Keynote users, this template breaks down complex Agile concepts into easy-to-understand visuals. Whether you're illustrating the cycle of sprints, the importance of daily scrums, or the process of backlog refinement and reviews, our infographic makes it simple. It’s ideal for project managers, agile coaches, scrum masters, and team members looking to communicate the flexibility and dynamics of Agile workflows. Adopt a clear, concise approach to explaining iterative development and foster a better understanding in your audience with this user-friendly template.


8 slides
Large-Scale Data Processing Tools Presentation
Simplify the complexity of data processing with this sleek and modern template for mapping large-scale tools and systems. Ideal for tech teams, data analysts, and IT professionals, this slide helps you explain how data flows through cloud-based infrastructures. Fully customizable and compatible with PowerPoint, Keynote, and Google Slides.


22 slides
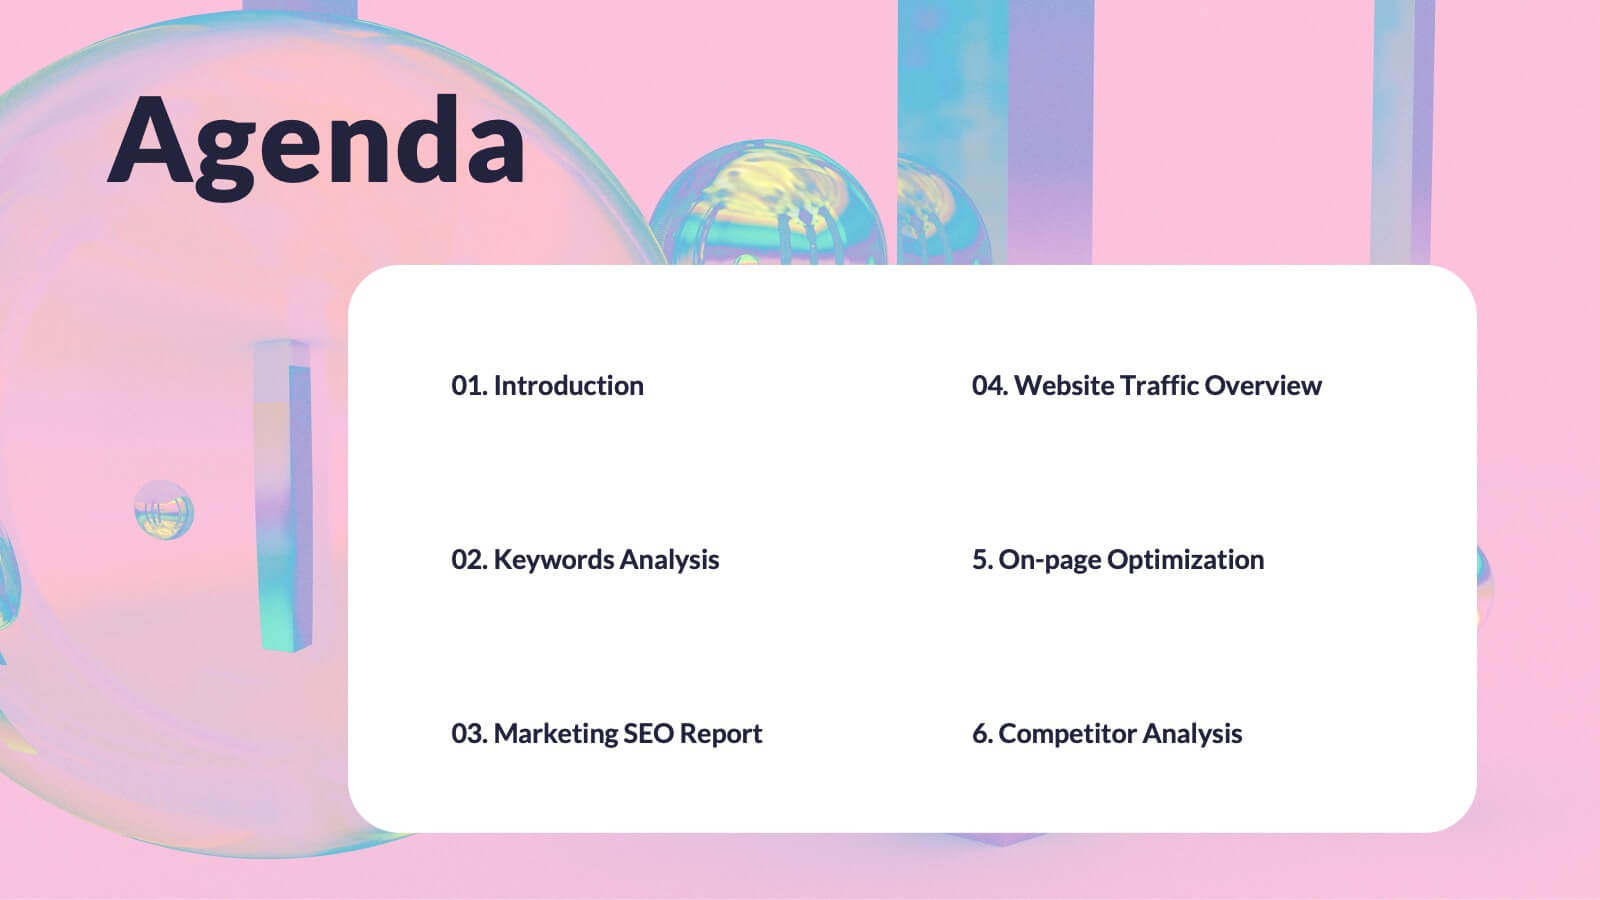
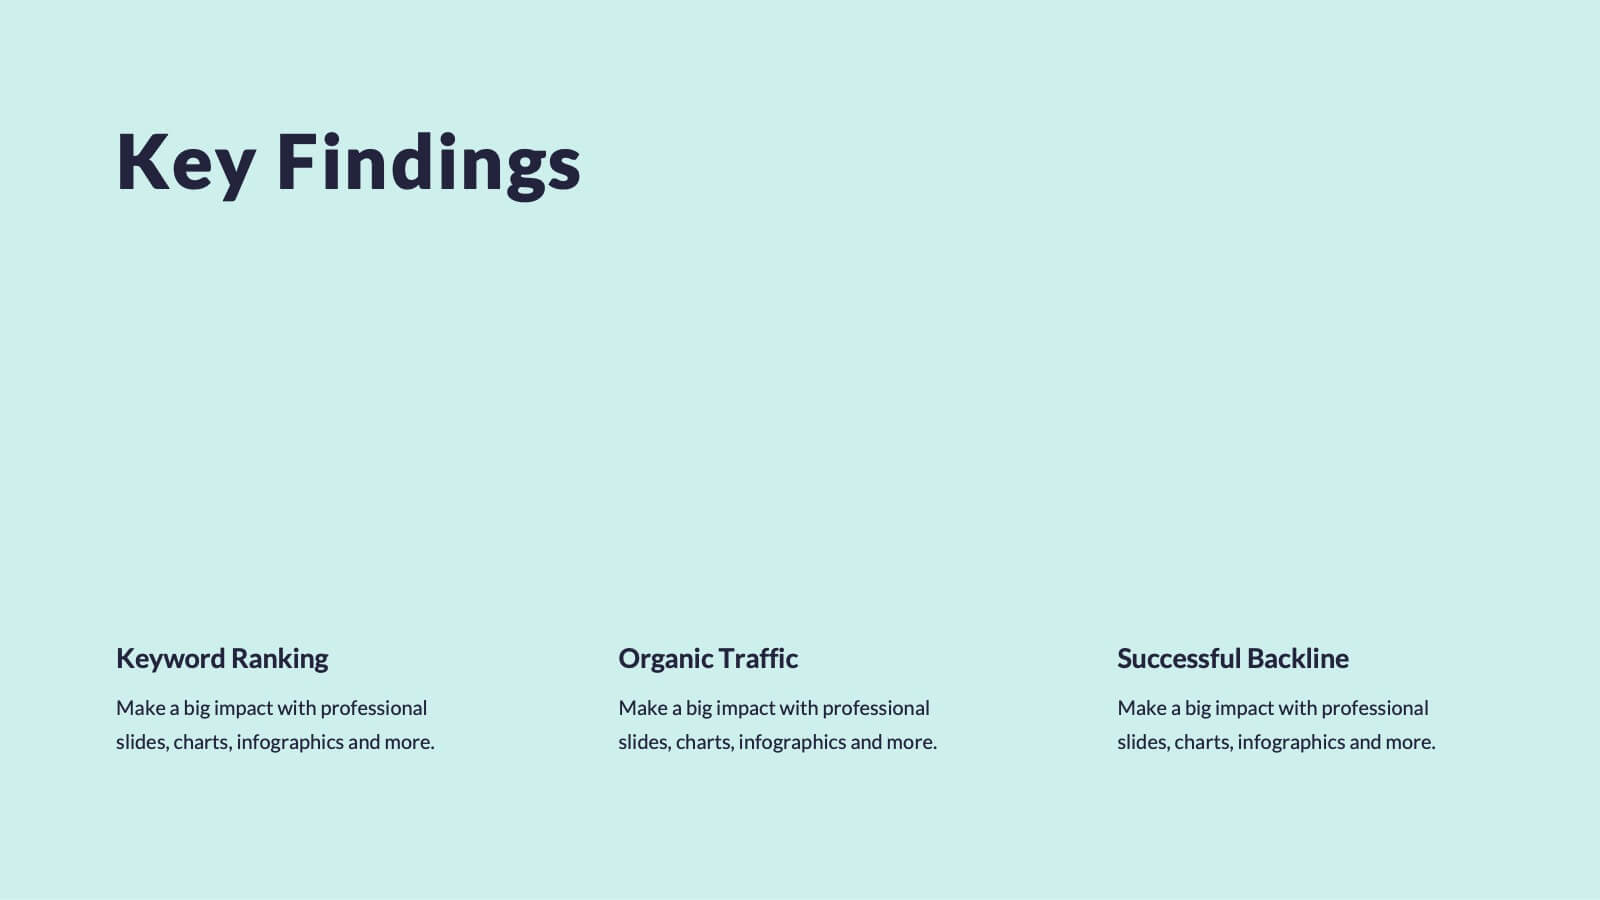
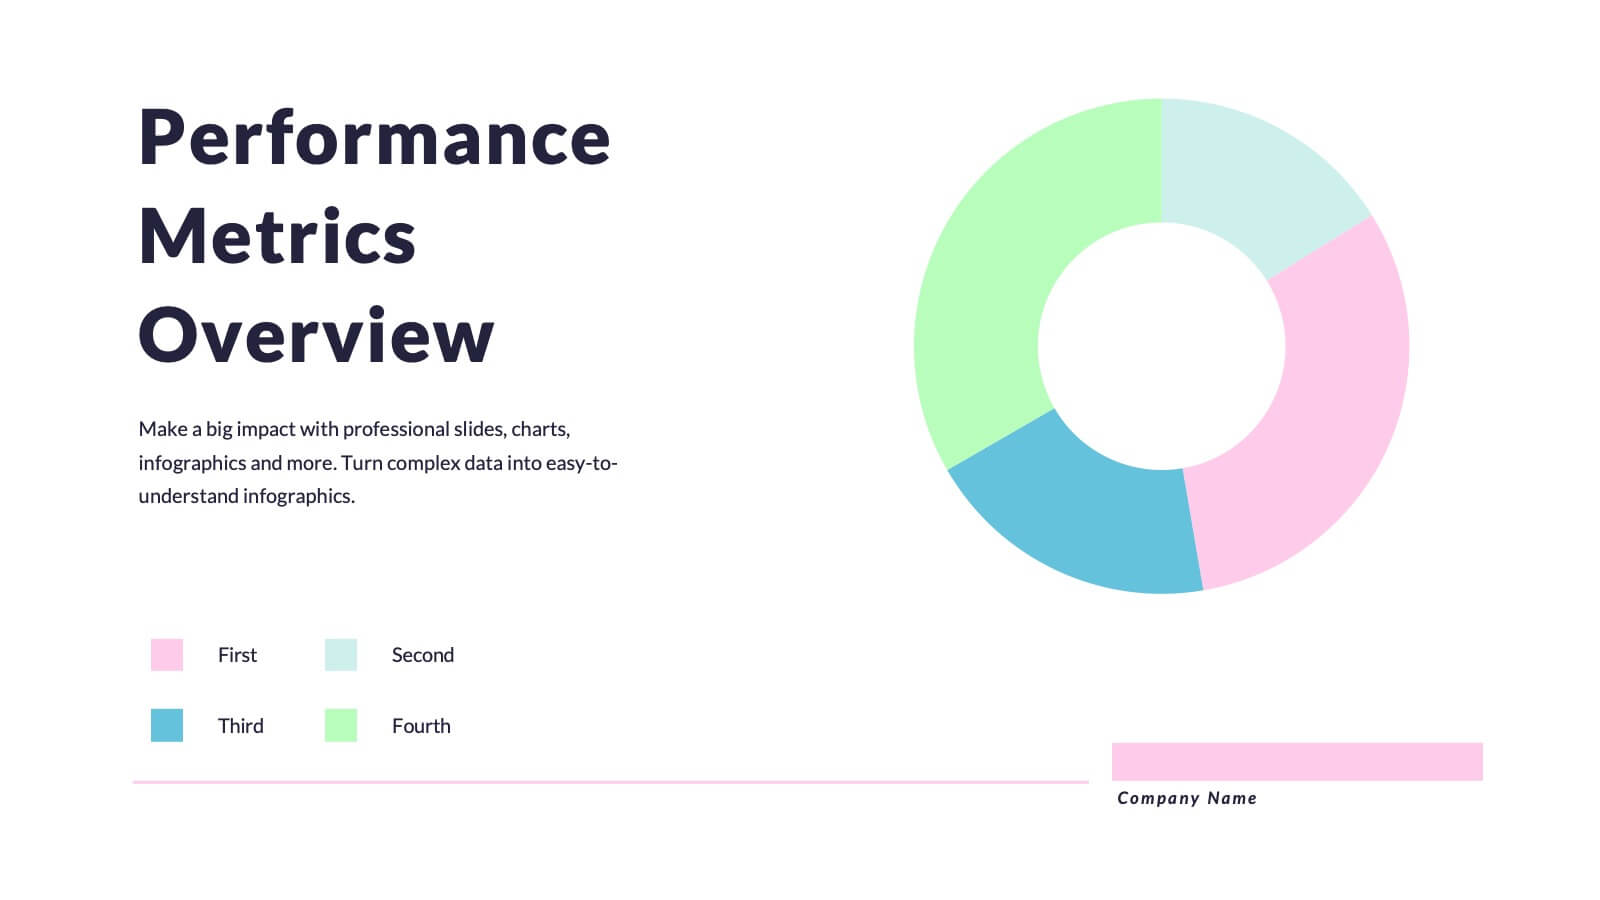
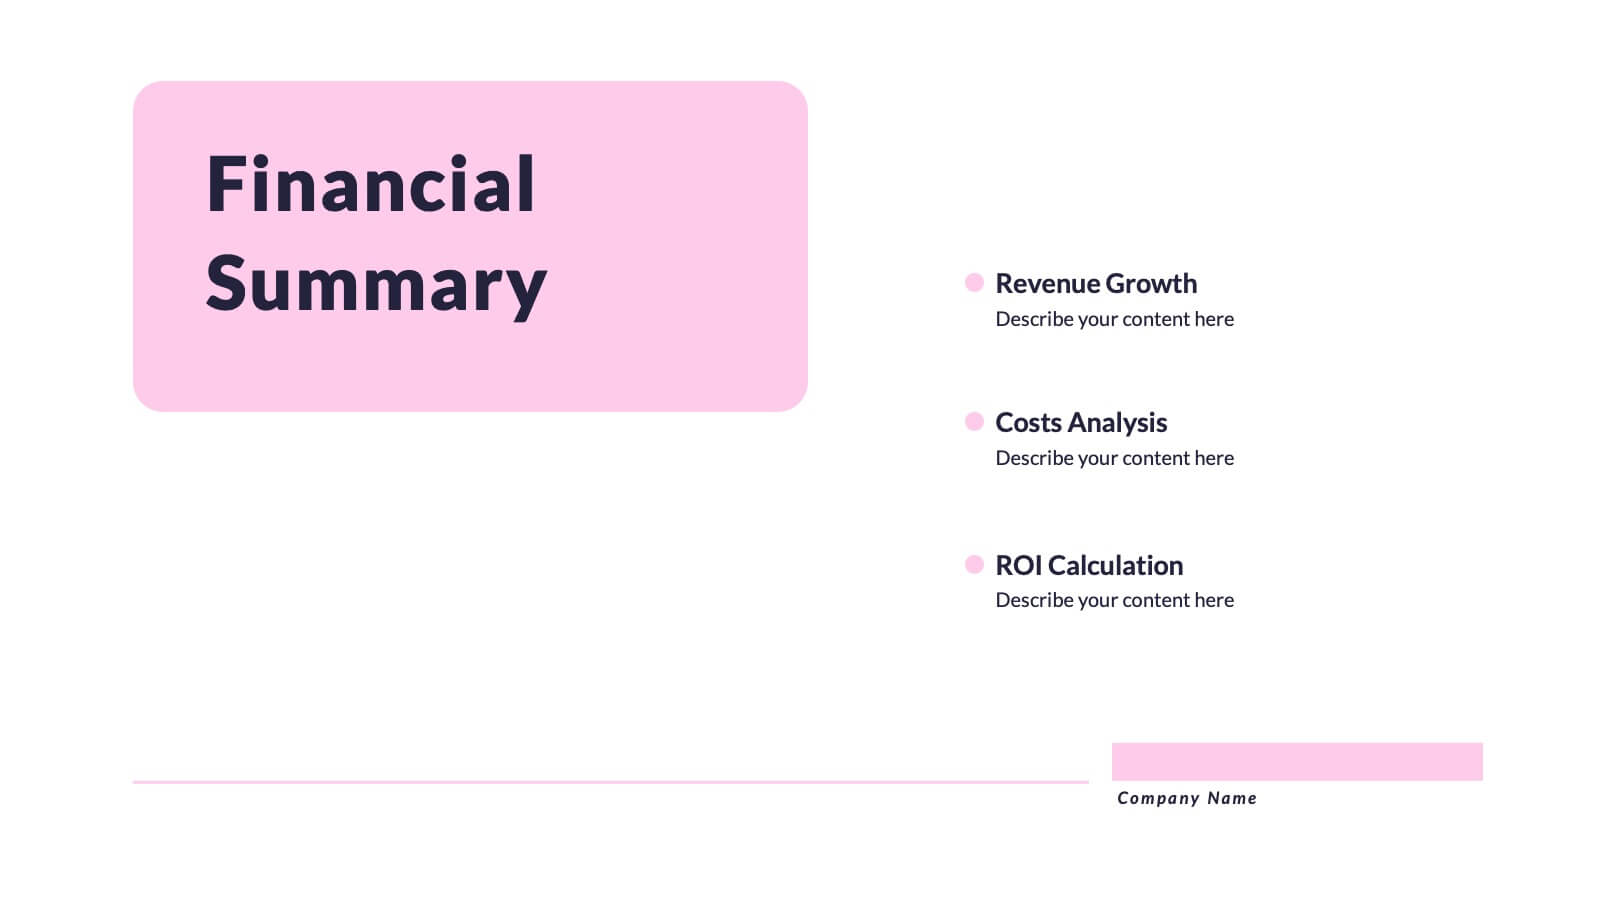
Quantum Research Findings Report Presentation
Discover insights like never before with this vibrant presentation template! Perfect for showcasing research findings, it includes slides for key findings, performance metrics, and market trends. Clearly present data and engage your audience with visually appealing graphics. Compatible with PowerPoint, Keynote, and Google Slides, making it easy to use on any platform.