
Features
- 5 Unique slides
- Fully editable and easy to edit in Microsoft Powerpoint, Keynote and Google Slides
- 16:9 widescreen layout
- Clean and professional designs
- Export to JPG, PDF or send by email


Do you have any questions?
Recommend


6 slides
Risk Evaluation and Mitigation Plan Presentation
Take control of uncertainty with a clean, visual layout that helps you assess potential challenges and map out clear solutions. Ideal for project planning, operations, or corporate risk management, this presentation simplifies complex data into actionable insights. Compatible with PowerPoint, Keynote, and Google Slides for easy customization.


6 slides
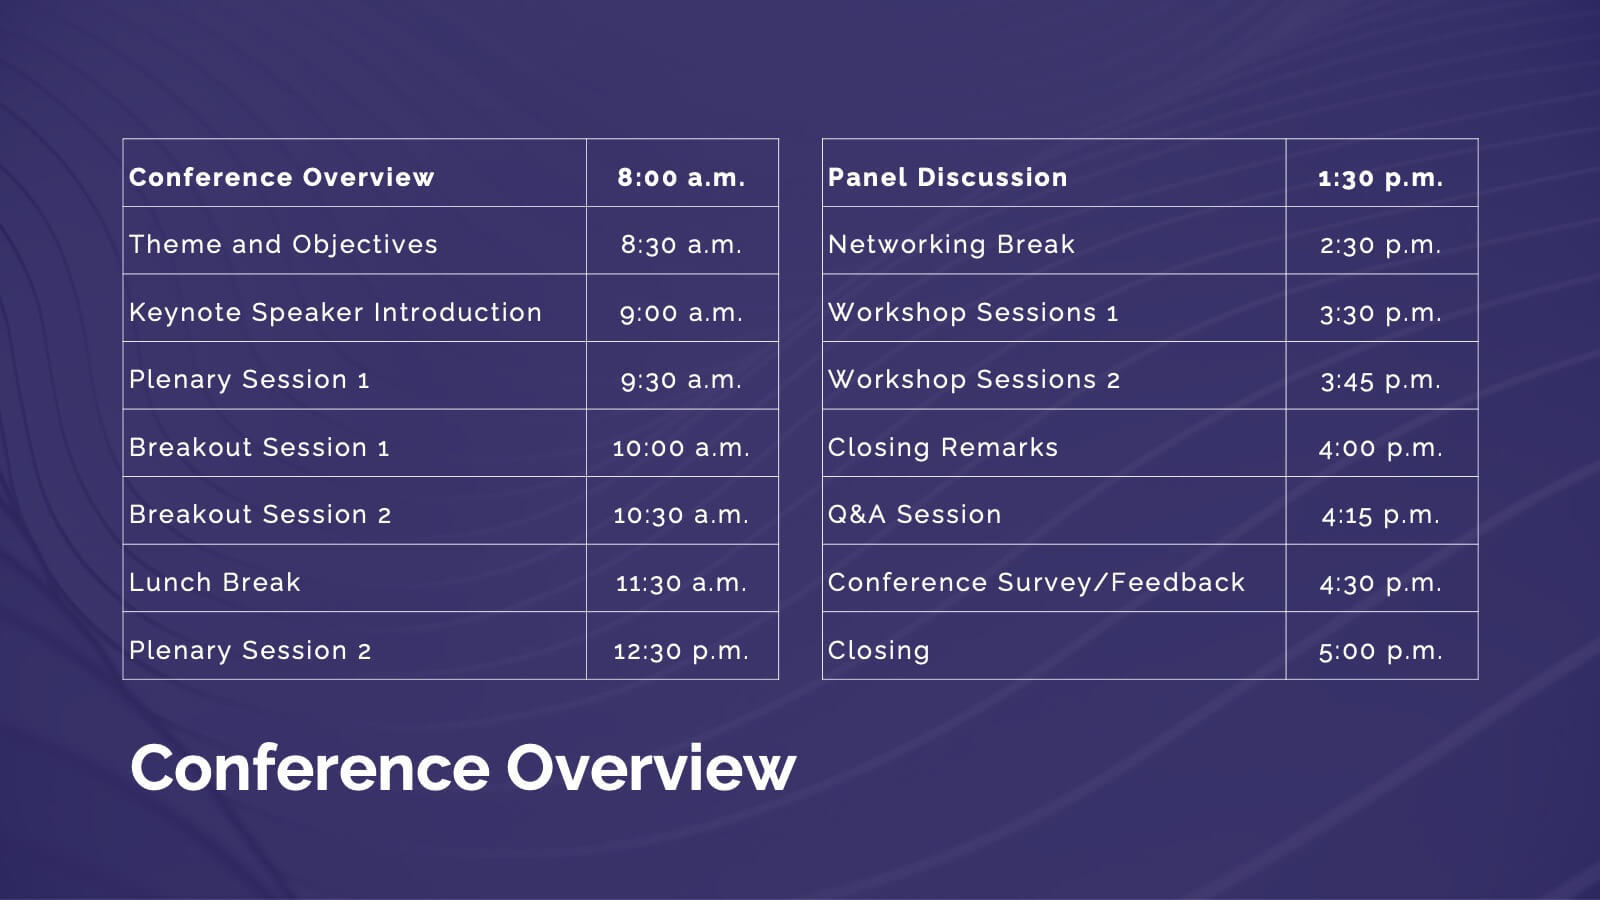
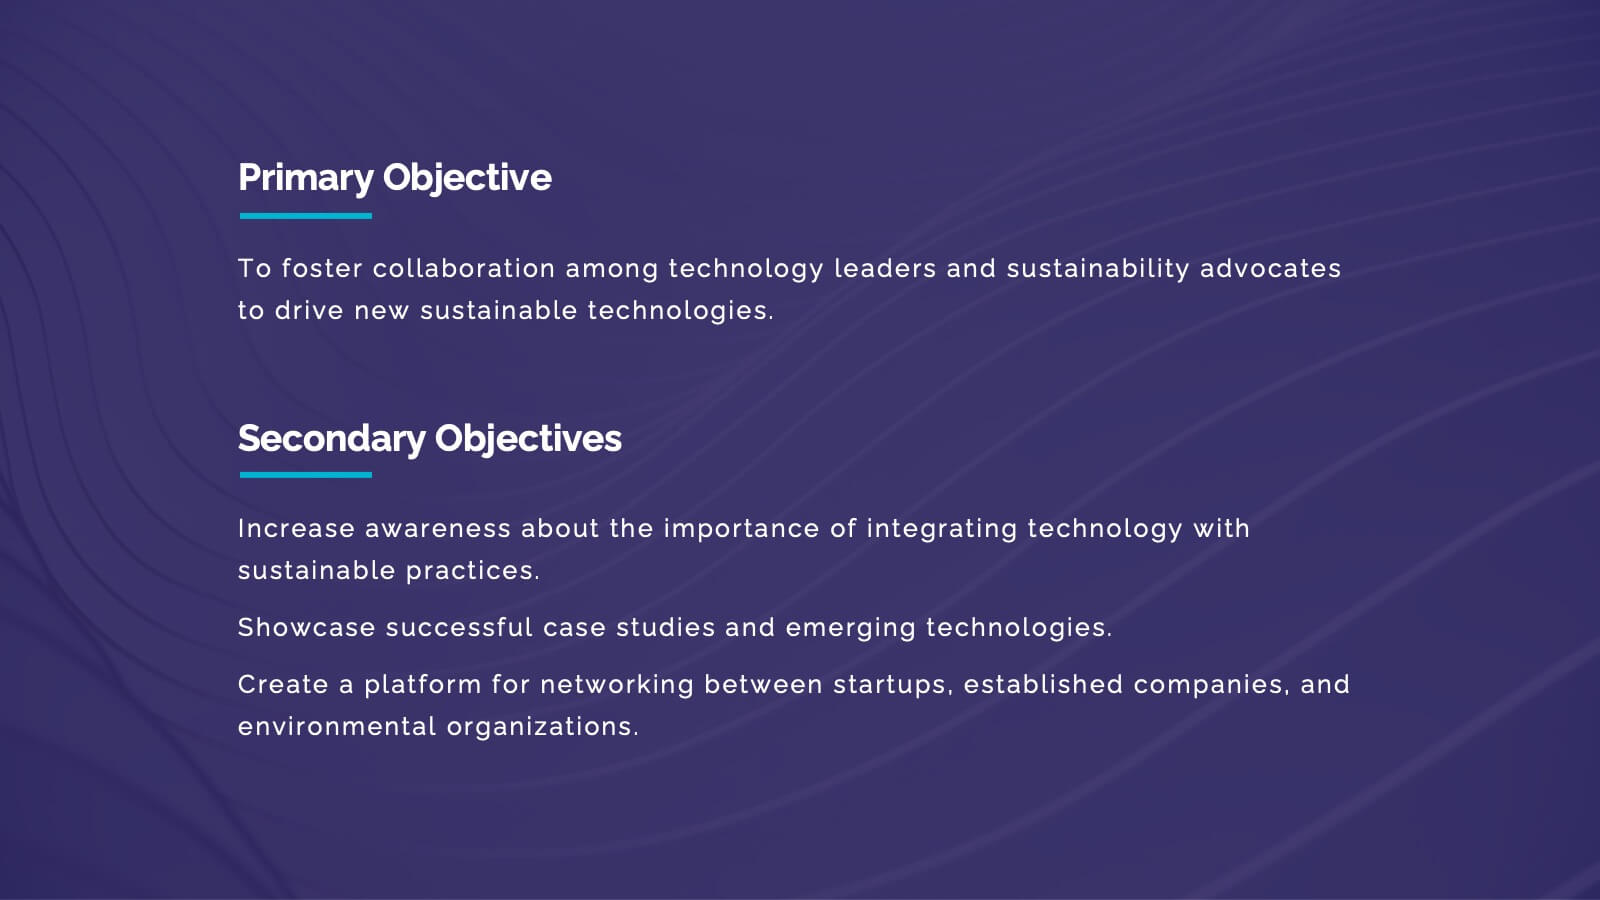
Event Planning Agenda Presentation
Organize every detail with the Event Planning Agenda Presentation. Featuring a 6-step layout styled like a calendar, this template clearly outlines each agenda point with vibrant blocks and icons for visual impact. Ideal for conferences, workshops, or launches. Fully editable in PowerPoint, Keynote, and Google Slides.


7 slides
Business Office Scenes Infographic Presentation
Office Scene Infographics can be a valuable tool for businesses or organizations that want to showcase their workplace culture or attract potential employees by providing a visual representation of what it's like to work at their company. This template is designed to provide a visual representation of different office scenarios and activities. The template is fully customizable and can be used for a variety of purposes, such as internal communication, training, marketing, and educational. It has a unique design, easy customization, and compatibility with Powerpoint, Keynote and Google Slides.


6 slides
Internal and External Communication Plan
Visualize your communication strategy with this dual-channel megaphone infographic, perfect for showcasing internal and external messaging flows. Ideal for corporate updates, PR plans, or stakeholder communications. Fully editable in PowerPoint, Keynote, and Google Slides.


5 slides
Meeting Minutes and Notes Presentation
Keep every discussion organized and every detail accounted for with this clean and structured layout. Perfect for summarizing key decisions, attendees, and next steps, it helps teams capture essential meeting insights efficiently. This easy-to-edit template works flawlessly with PowerPoint, Keynote, and Google Slides for a polished professional presentation.


21 slides
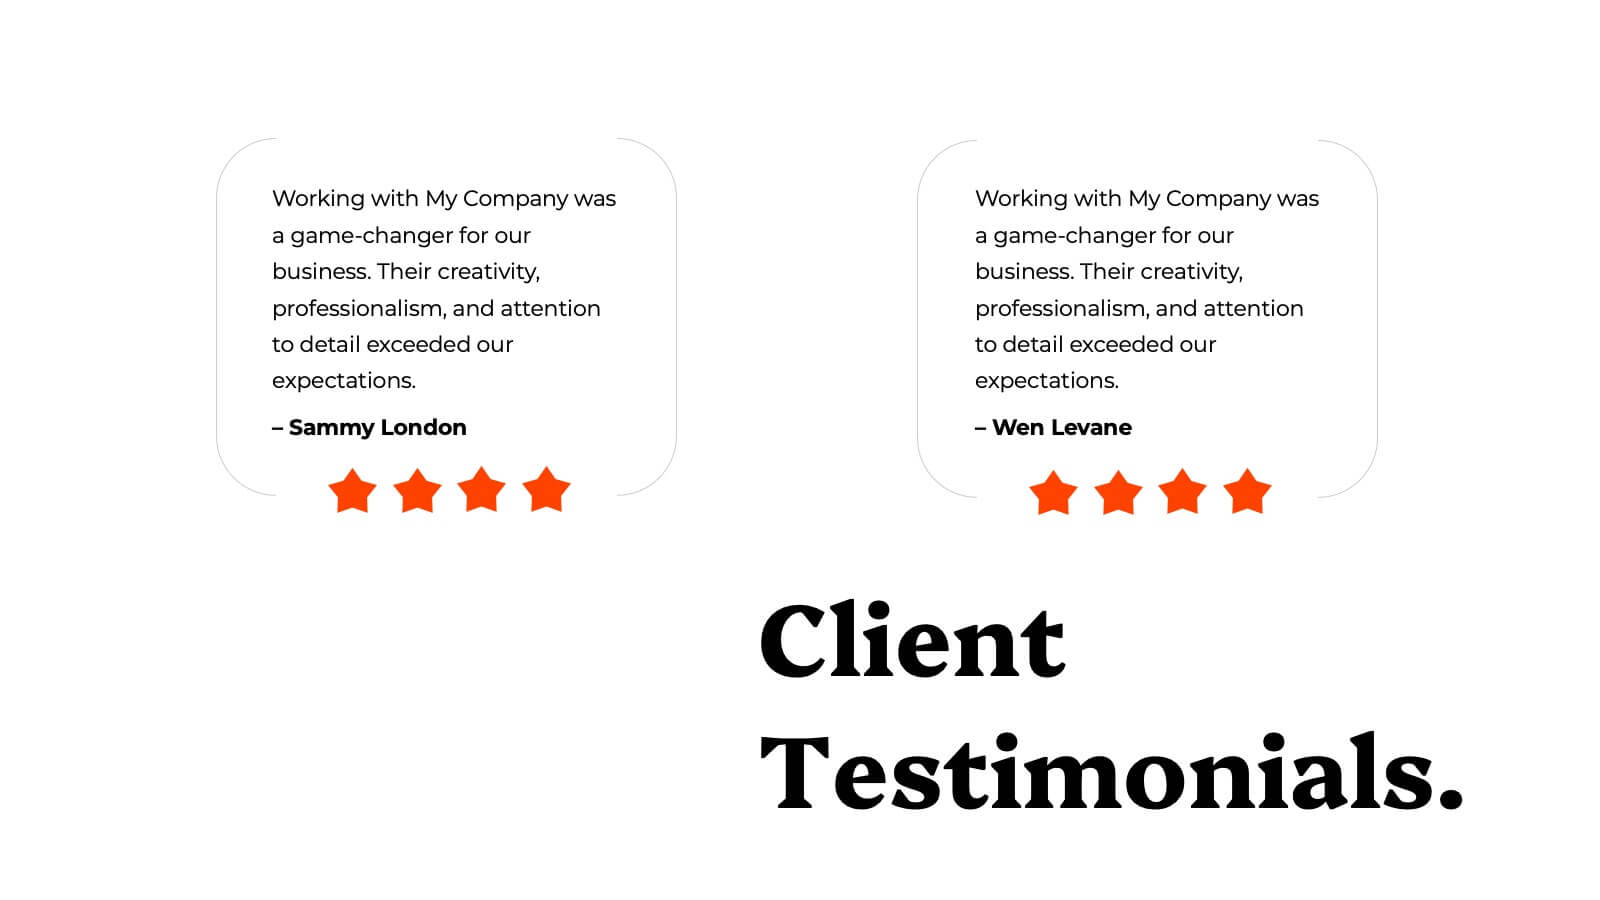
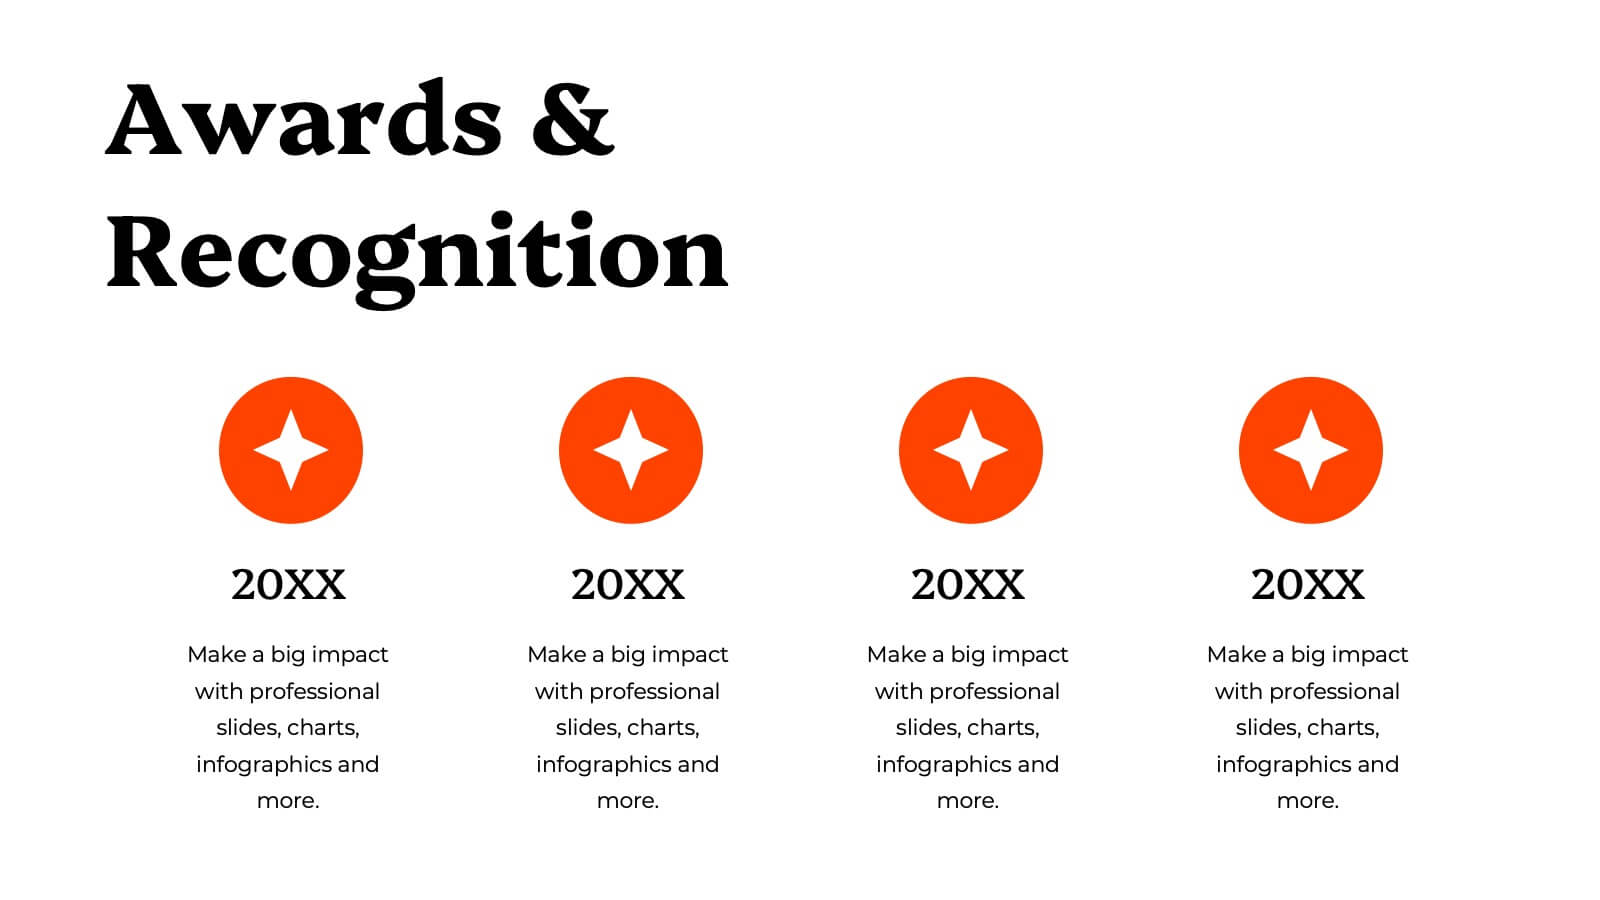
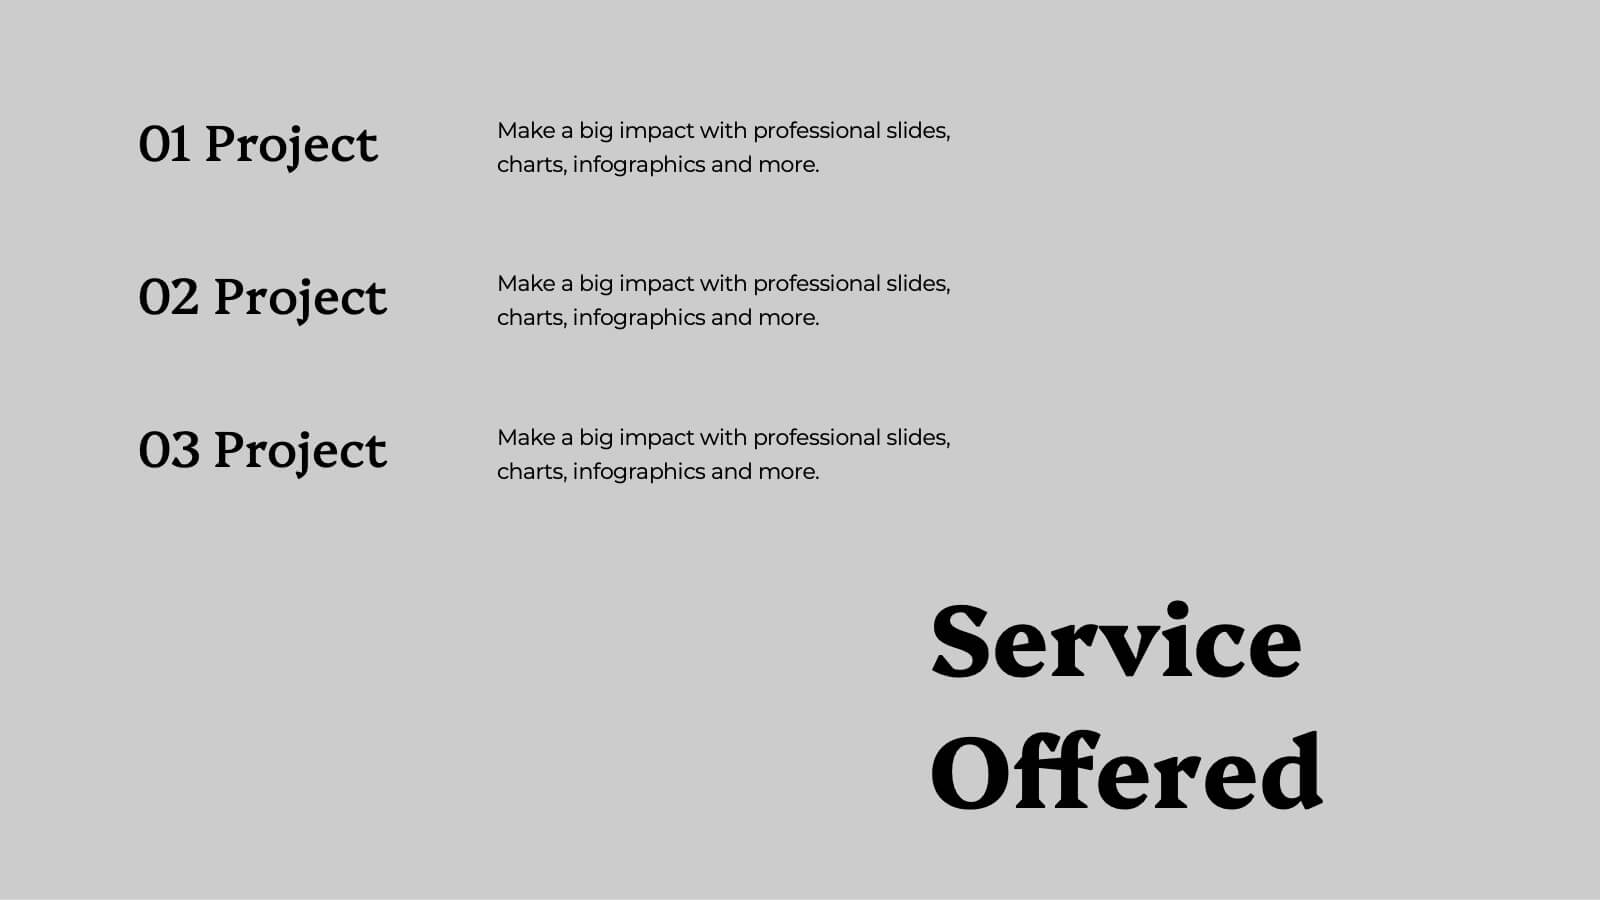
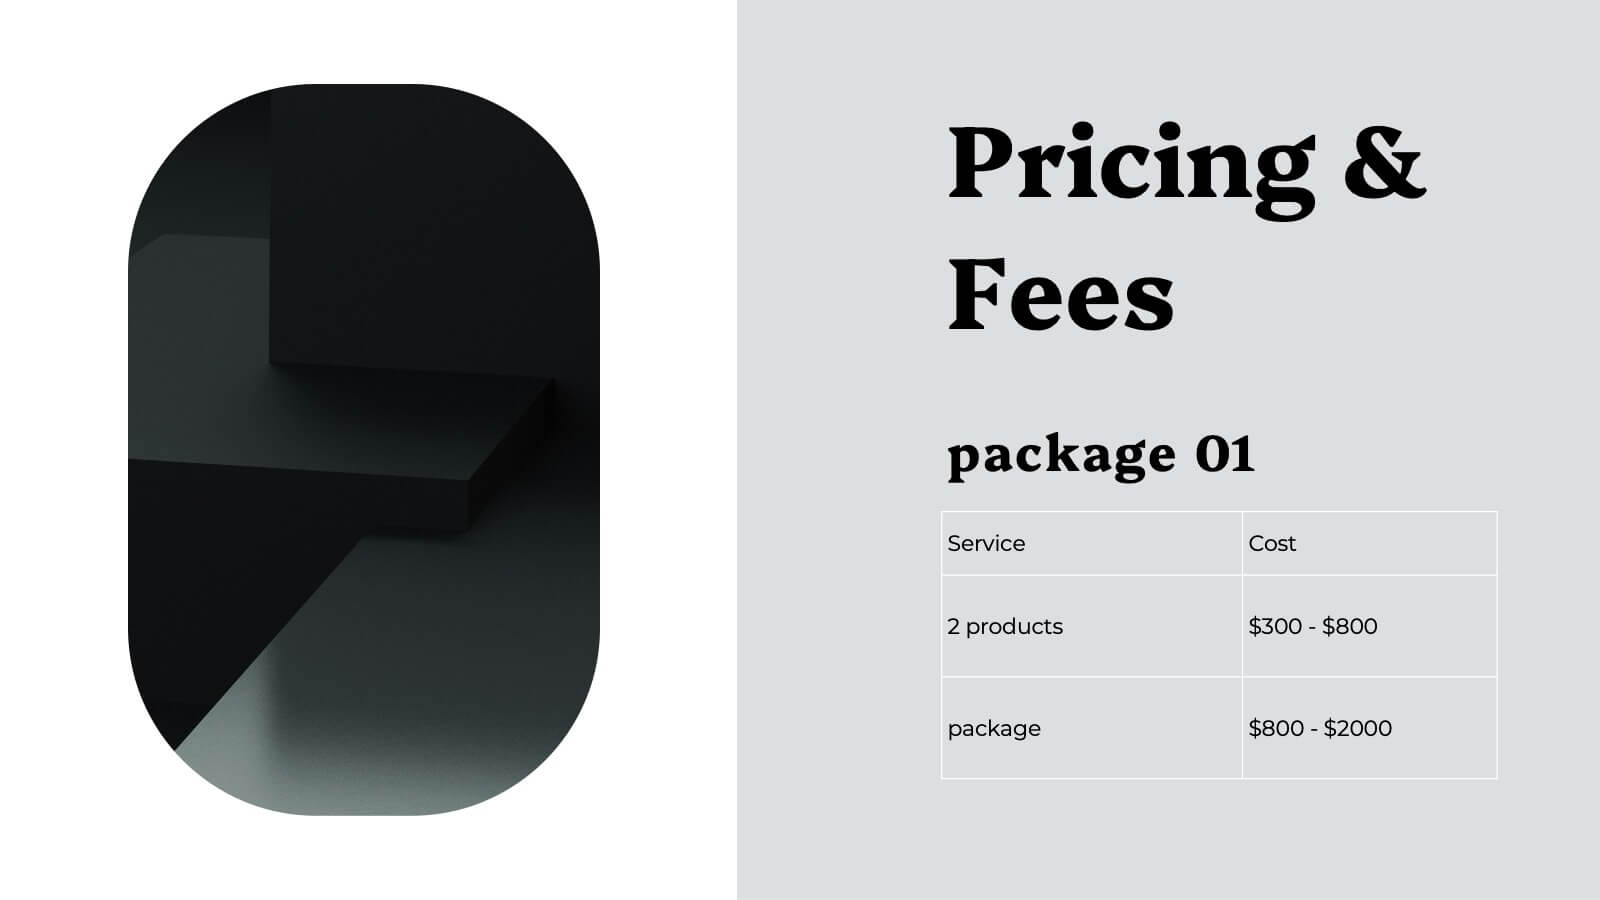
Arcadian Photography Portfolio Template Presentation
Showcase your best work with this sleek and stylish photography portfolio presentation template! It’s perfect for presenting your featured projects, creative process, and client testimonials in a visually stunning way. This template is fully customizable and offers a professional touch to your portfolio, making it ideal for both personal and client presentations. Compatible with PowerPoint, Keynote, and Google Slides.


6 slides
Business People Partner Infographics
Our "Business People Partner" infographic template is a modern and dynamic tool designed for PowerPoint, Keynote, and Google Slides. This template is particularly useful for HR professionals, business consultants, and team leaders who are involved in fostering effective business partnerships. The template highlights essential elements such as organizational roles, partnership strategies, and communication channels. Its layout is thoughtfully designed to help users articulate the intricacies of business partnerships and the roles of various stakeholders in a clear and concise manner. This makes it an invaluable resource for presentations focusing on collaborative efforts and strategic alliances in the business world. Featuring a bright and inviting color scheme, the design of this template is both contemporary and engaging. It reflects the dynamic and collaborative nature of business partnerships, making your presentation not just informative but also visually appealing. Whether you're presenting to executives, partners, or team members, this template ensures your message is delivered with clarity and impact.


21 slides
Phantomwood Product Roadmap Presentation
A comprehensive presentation template designed to outline product strategies and roadmaps. Covers key aspects like target market, competitive analysis, pricing, and technical specifications. Highlight marketing approaches, production processes, and support information effectively. Fully editable, this template is compatible with PowerPoint, Keynote, and Google Slides for seamless collaboration and professional delivery.


22 slides
Galvonic Research Proposal Presentation
Present research insights professionally with this comprehensive proposal template. Covering objectives, methodology, findings, and implications, it provides a clear structure for academic or market research projects. Compatible with PowerPoint, Keynote, and Google Slides, it’s ideal for presenting detailed analysis, conclusions, and future directions.


6 slides
Resource Allocation and PM Strategy Deck Presentation
Break down project resources and team strategies using this dynamic visual dashboard. Track allocation, effort levels, or progress across roles in a clean, easy-to-follow layout. Fully editable in PowerPoint, Keynote, and Google Slides, this template helps project managers communicate priorities and responsibilities with clarity and impact.


7 slides
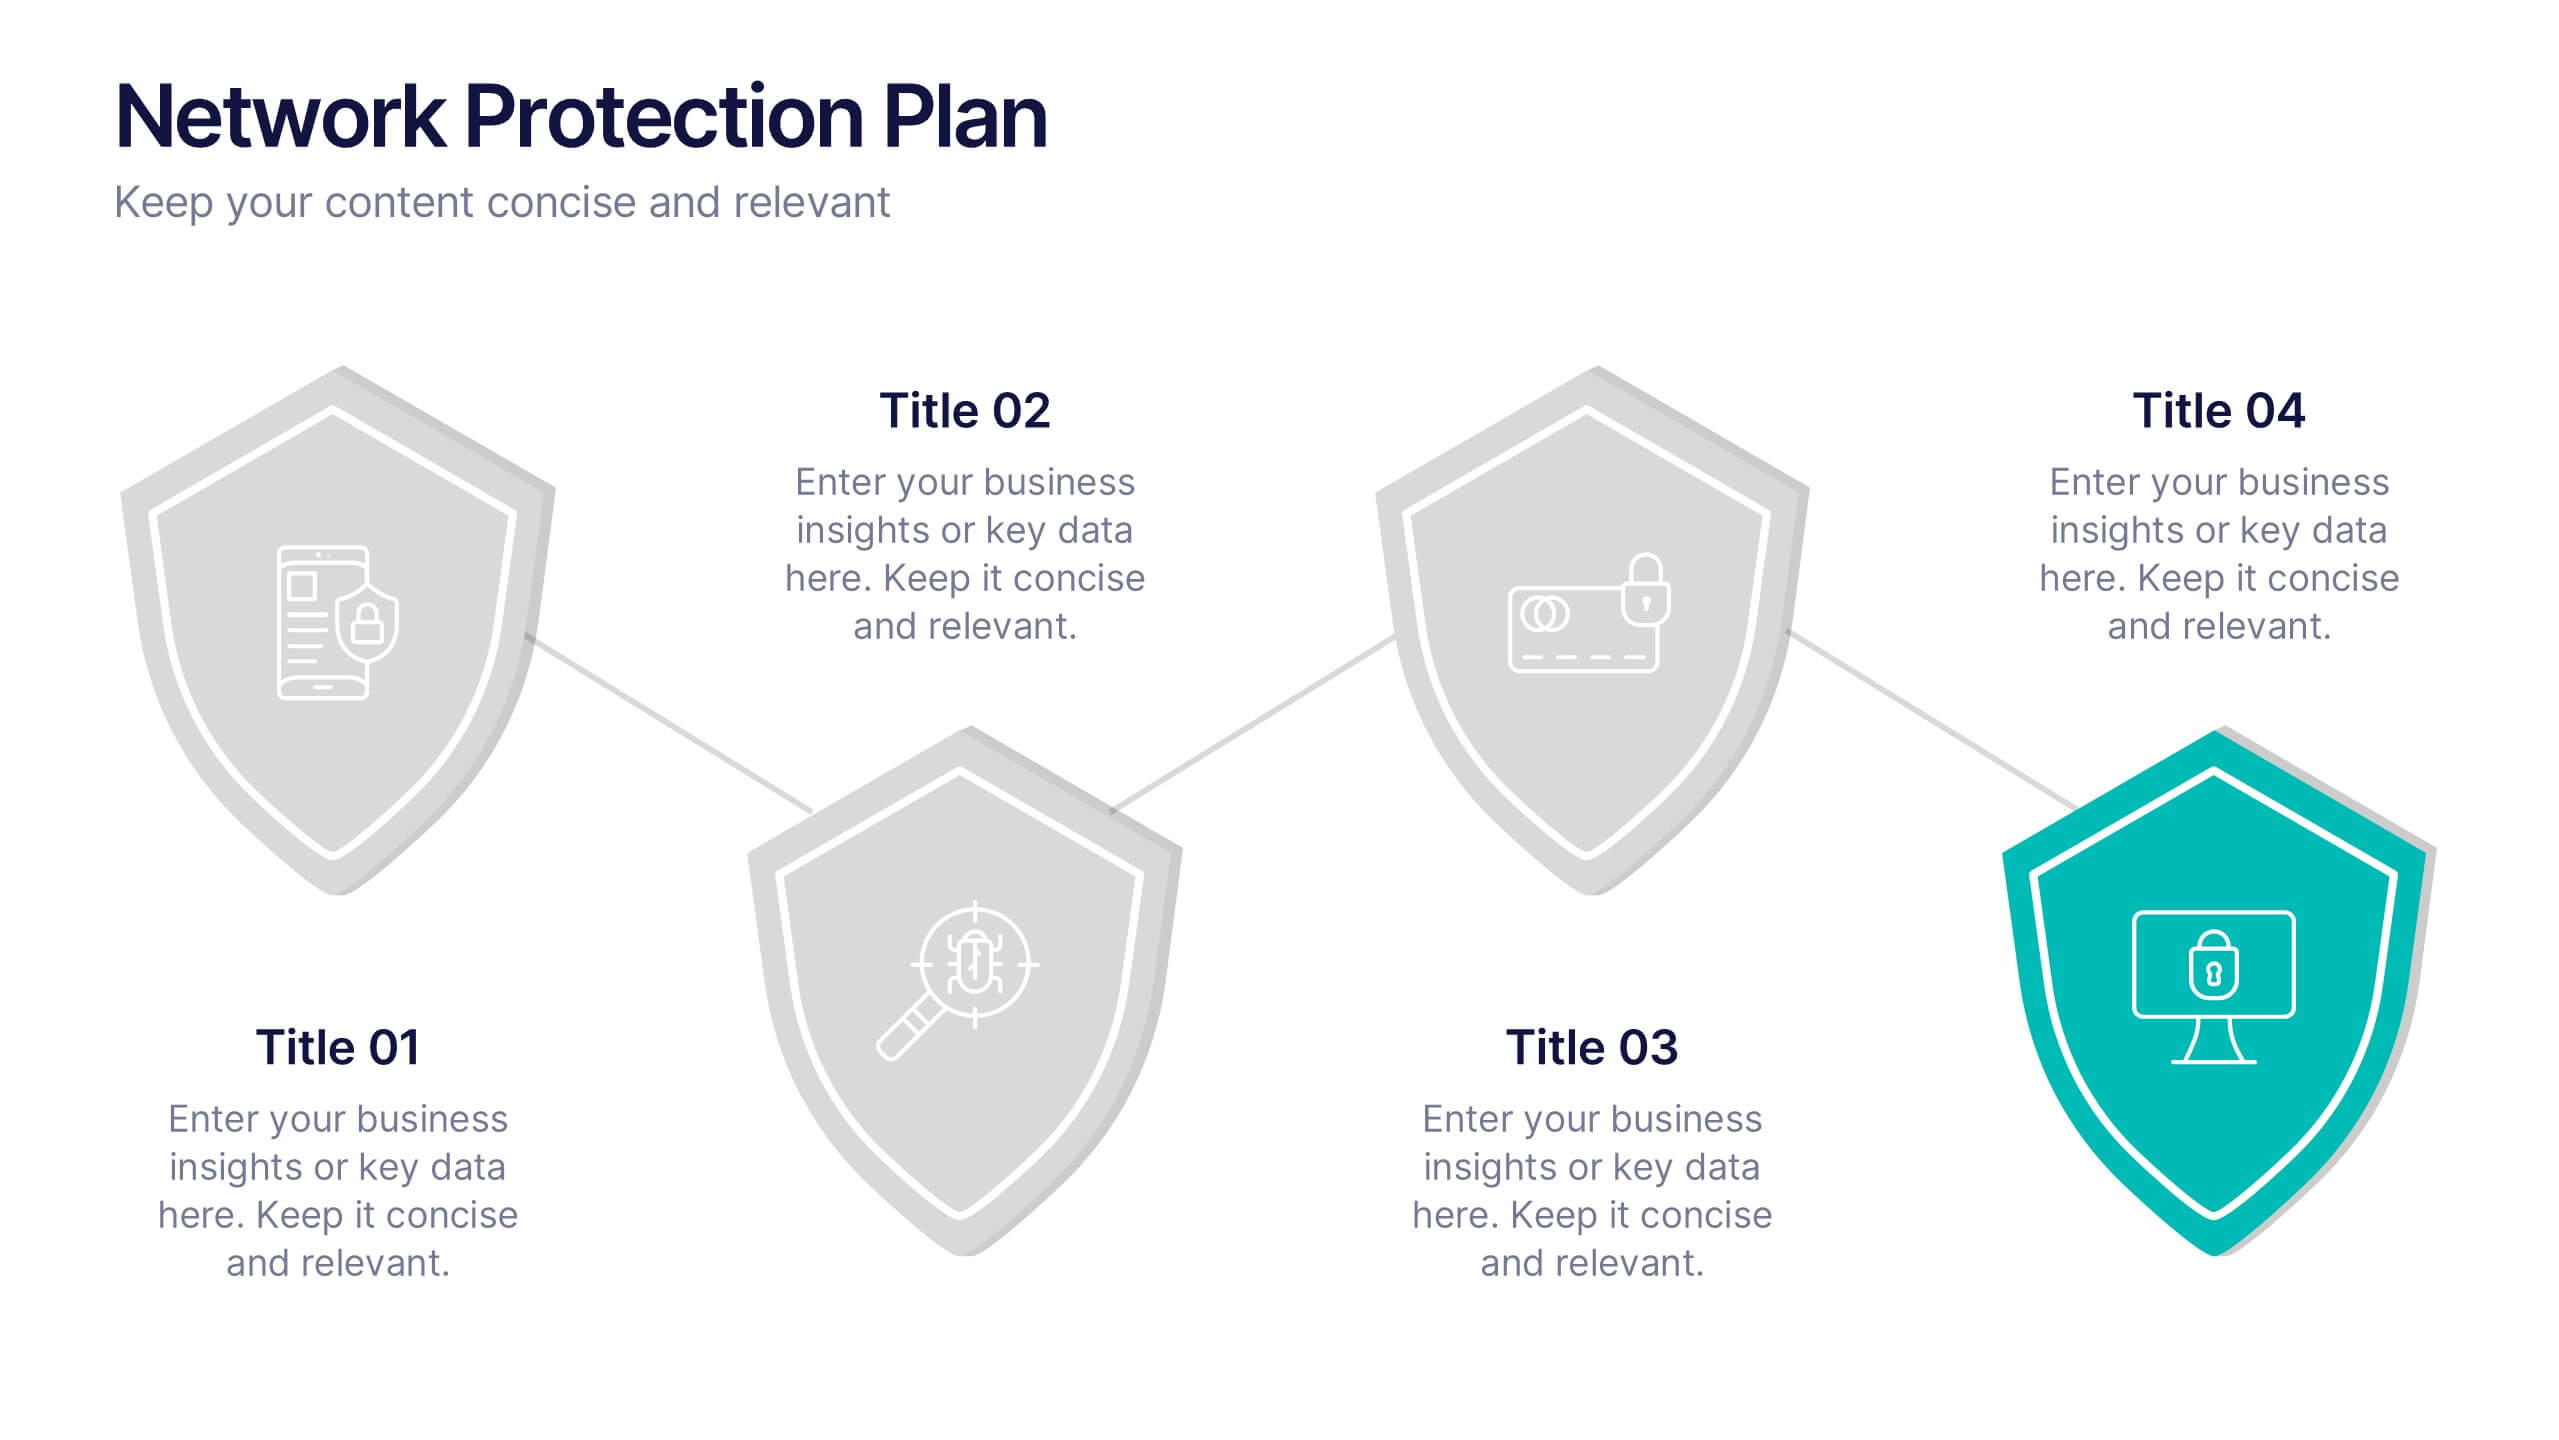
Security Service Infographic Presentation
Security is the practice of protecting people, information, and assets from harm or damage. It is essential for compliance, business continuity, and protecting an organization's reputation. This template is designed to help you showcase or discuss security services, products or any other topic related to this. This template contains security graphics, and you can easily add your logo or icon to make the template more fun and eye catchy. This template allows you to customize the slides with any color scheme that suits your brand and communicate important features of your business.


8 slides
Africa Market Potential and Improvement Map Presentation
Visualize market opportunities across Africa with this insightful map template. Featuring percentage-based growth indicators and color-coded country highlights, it’s perfect for showcasing regional potential, trends, and business expansion strategies. Fully customizable in PowerPoint, Keynote, and Google Slides, this template supports clear, data-driven storytelling for marketing, economic, or strategic presentations.


7 slides
Decision Tree Diagram Infographics
A Decision Tree Diagram is a visual representation of a decision-making process that uses a tree-like structure to map out various possible outcomes and their associated probabilities. This template can be used in fields such as business, economics, and data science to model complex decision-making scenarios. This infographic starts with a single node, representing the initial decision that needs to be taken. From this node, paths extend to other nodes representing possible outcomes that could occur as a result of the initial decision. The final nodes of the diagram represent the end results.


22 slides
Nimbus Business Development Proposal Presentation
Boost your business presentations with this vibrant, professional template designed for business development proposals. Perfect for detailing conference overviews, themes, objectives, and keynotes, it features a clean and engaging layout. Highlight critical sessions and networking opportunities to captivate your audience. Compatible with PowerPoint, Keynote, and Google Slides, it ensures seamless presentations on any platform.


21 slides
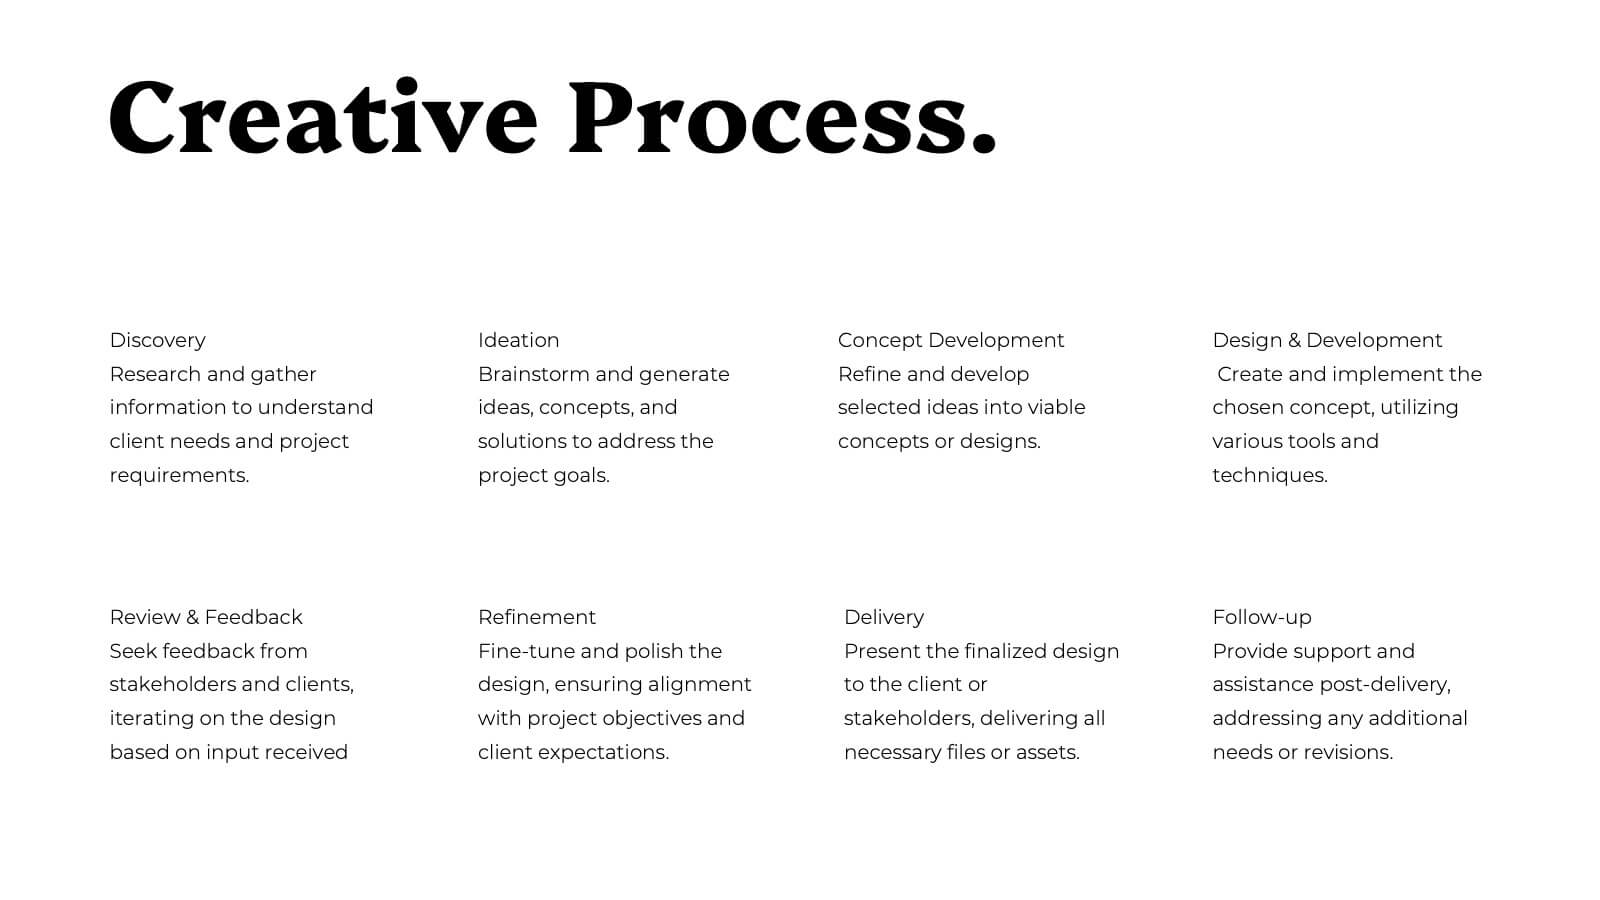
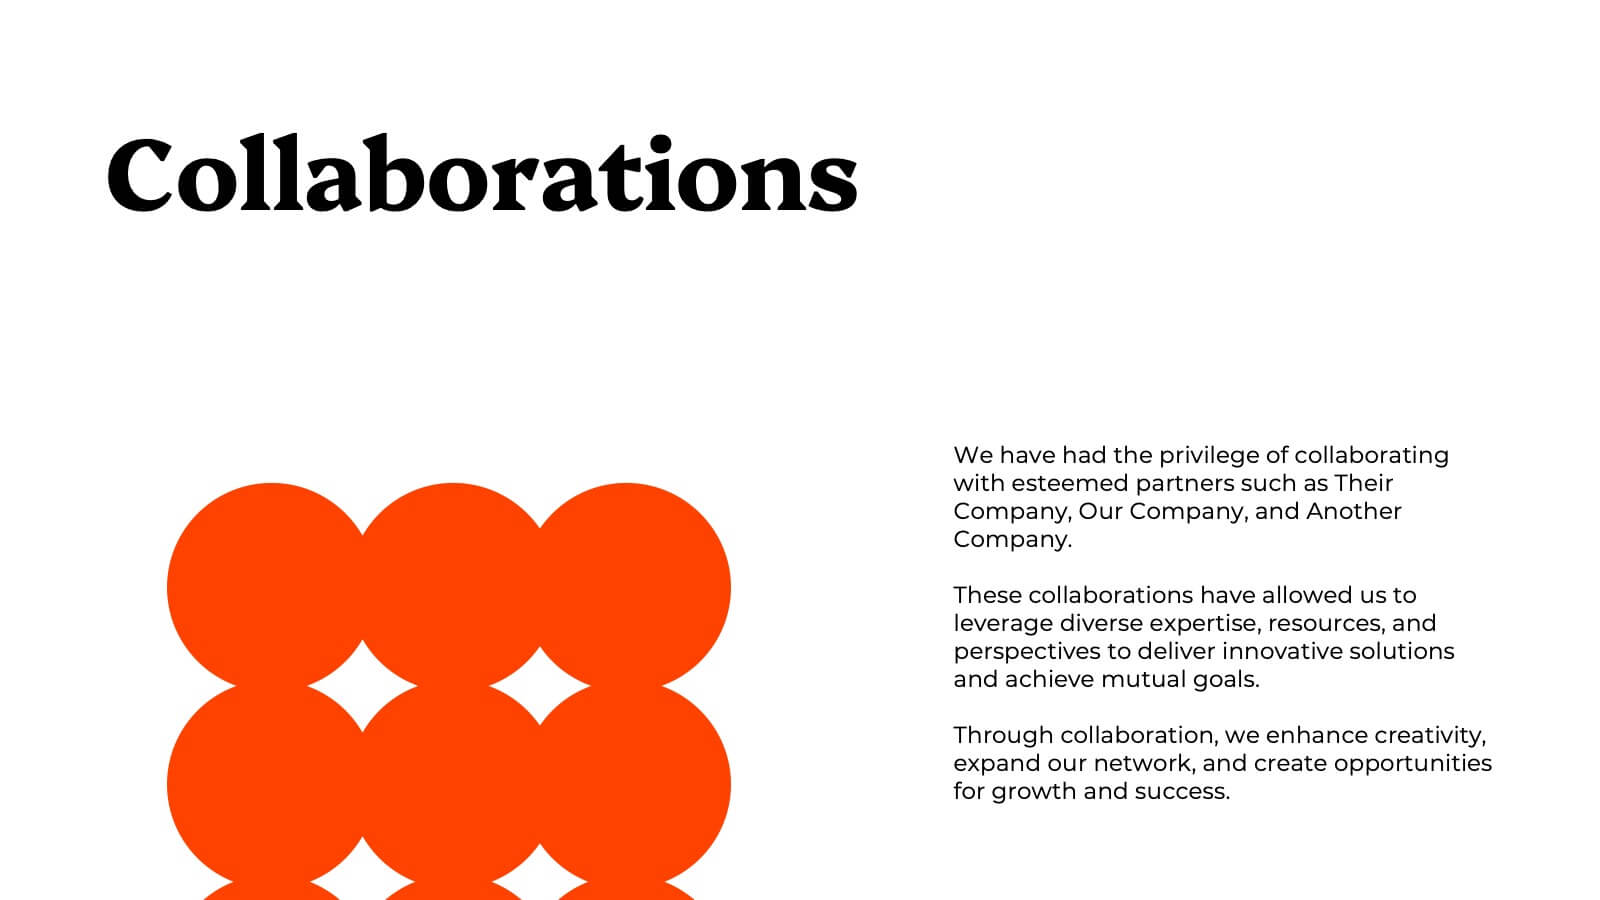
Illusia Artist Portfolio Template Presentation
Make your creative work shine with this vibrant and versatile portfolio presentation template. Designed for artists, designers, and creative professionals, this template enables you to showcase your projects, philosophy, and achievements in a visually captivating way. Present your journey with slides that cover an introduction, portfolio overview, creative process, and collaborations. Highlight your unique style and philosophy while featuring key projects with dynamic layouts. Share your accolades, services offered, pricing details, and client testimonials to build trust and credibility. Fully customizable and compatible with PowerPoint, Google Slides, and Keynote, this template offers effortless editing to align with your branding and personal style. Perfect for portfolio reviews, client meetings, or showcasing your work online, this template is designed to make a bold, professional impression.


5 slides
IT Infrastructure and Support Presentation
Optimize your IT presentations with the IT Infrastructure and Support Presentation template. Featuring a structured, step-by-step layout, this slide design visually conveys IT infrastructure processes, system support workflows, and key technology elements. Ideal for IT teams, tech consultants, and business professionals looking to illustrate complex IT strategies effectively. Fully editable in PowerPoint, Keynote, and Google Slides for seamless customization.


5 slides
SMART Objectives Slide Presentation
Kick your planning into gear with a bold, structured layout that makes goal-setting feel energetic and achievable. This presentation helps you outline clear objectives, track progress, and communicate strategy with a clean, organized flow designed for teams and leaders. Fully compatible with PowerPoint, Keynote, and Google Slides.