


Features
- 5 Unique slides
- Fully editable and easy to edit in Microsoft Powerpoint, Keynote and Google Slides
- 16:9 widescreen layout
- Clean and professional designs
- Export to JPG, PDF or send by email


Do you have any questions?
Recommend


7 slides
AIDA Interest Model Infographic
The AIDA Interest Model is a cornerstone in marketing and sales, guiding professionals through the stages of Attention, Interest, Desire, and Action. Our infographic, bathed in hues of purple, green, blue, and yellow, brings this classical model to life in a refreshing and engaging manner. With a fun, yet informative style, it elucidates each phase, making it a go-to resource for marketers, salespersons, and educators alike. Whether you're training a team, educating students, or crafting a persuasive pitch, this infographic will elevate your presentation. It's fully compatible with PowerPoint, Keynote, and Google Slides.


5 slides
Business Plan Infographics
Elevate your strategic approach with the business plan infographics template. Cast in the motivational hues of orange, purple, and green, this template breathes life into your business strategy, illustrating your plan's potential. Entrepreneurs and corporate strategists will find this creative, vertical-style infographic an invaluable ally in conveying complex business plans with simplicity and visual flair. Compatible with Powerpoint, Keynote, and Google Slides. This dynamic template comes complete with innovative graphics, thematic icons, and designated image placeholders, all fashioned to articulate your business journey. Utilize this tool to captivate your audience.


6 slides
Data Science and AI Big Data Presentation
Transform complex data concepts into engaging visuals with the Data Science and AI Big Data Presentation. This fully editable template highlights key areas such as machine learning, predictive analytics, automation, and data-driven decision-making. Perfect for data analysts, AI specialists, and business leaders, it’s available for PowerPoint, Keynote, and Google Slides, ensuring a modern and structured presentation.


6 slides
Transition Strategy for Change Implementation Presentation
Guide your audience through change with a clear roadmap using this transition strategy grid. Each step is mapped visually, making complex implementation plans easier to communicate and understand. Great for organizational development, team onboarding, or operational rollouts. Fully compatible with PowerPoint, Keynote, and Google Slides.


7 slides
Business Process Checklist
Simplify workflow tracking with this visual business process checklist slide. Featuring circular progress bars and bold letter labels (A–C), this template helps visualize task completion percentages for up to six steps. Perfect for audits, quality checks, or operational reviews. Fully customizable in PowerPoint, Keynote, and Google Slides.


7 slides
Strategic PESTEL Planning Breakdown
Break down complexity into clarity with this puzzle-style PESTEL layout—perfect for visualizing how Political, Economic, Social, Technological, Environmental, and Legal factors shape your strategic decisions. Great for workshops, planning sessions, or executive briefings, it keeps your analysis both organized and engaging. Fully compatible with PowerPoint, Keynote, and Google Slides.


10 slides
Search Engine Optimization (SEO) Strategy Presentation
Present your digital marketing plan with clarity using this vibrant SEO strategy layout. Featuring a magnifying glass infographic at the center and five segmented areas for key actions, this template is ideal for mapping keyword research, on-page optimization, content creation, link building, and performance tracking. Great for marketing agencies, SEO consultants, and website owners. Fully editable in PowerPoint, Keynote, and Google Slides.


5 slides
Management Framework Structure Presentation
Bring your ideas to life with a dynamic slide that maps out clear stages of leadership, planning, and execution. This layout helps you break down complex management structures into simple, visual steps that any audience can follow. Fully editable and easy to customize in PowerPoint, Keynote, and Google Slides.


31 slides
Astralis Brand Strategy Report Presentation
Present your brand strategy effectively with this well-structured presentation template. This comprehensive design covers all essential aspects, including vision and positioning, identity components, brand guidelines, and touchpoints. It is perfect for showcasing how your brand stands out, communicates, and connects with its audience. Highlight your unique selling points, ensure visual consistency with color palettes, and emphasize your brand's voice through tailored sections. This template is easy to customize and works seamlessly across PowerPoint, Google Slides, and Keynote, ensuring accessibility for all. Empower your brand strategy discussions with a professional and polished design.


21 slides
Spinel Product Strategy Report Presentation
Take your product strategy to the next level with this polished, spinel-inspired presentation! Designed to effectively communicate your product's goals, market analysis, and strategy roadmap, this template is both visually striking and easy to navigate. Its sharp design ensures a professional touch. Compatible with PowerPoint, Keynote, and Google Slides.


6 slides
Customer Targeting Strategy Overview Presentation
Present your customer approach clearly with this Customer Targeting Strategy Overview presentation. Featuring a central persona with speech bubble-style segments, this layout is perfect for showcasing targeting methods, segmentation insights, or buyer personas. Ideal for marketers and strategists. Fully editable in Canva, PowerPoint, and Google Slides for easy customization.


6 slides
Project Milestone Progress Presentation
Track project progress effortlessly with this Project Milestone Progress template. This structured, color-coded milestone tracker is perfect for monitoring timelines, identifying key deliverables, and keeping stakeholders informed. Fully editable—adjust dates, tasks, and colors to match your project requirements. Compatible with PowerPoint, Keynote, and Google Slides, ensuring seamless integration into your workflow.


8 slides
User-Centered Design with Empathy Map
Step into your user's shoes—literally. This engaging empathy map slide helps you visualize user behavior, thoughts, emotions, and needs in one clean layout. Ideal for UX strategies, product development, or customer journey sessions. Fully editable and works seamlessly with PowerPoint, Keynote, and Google Slides.


7 slides
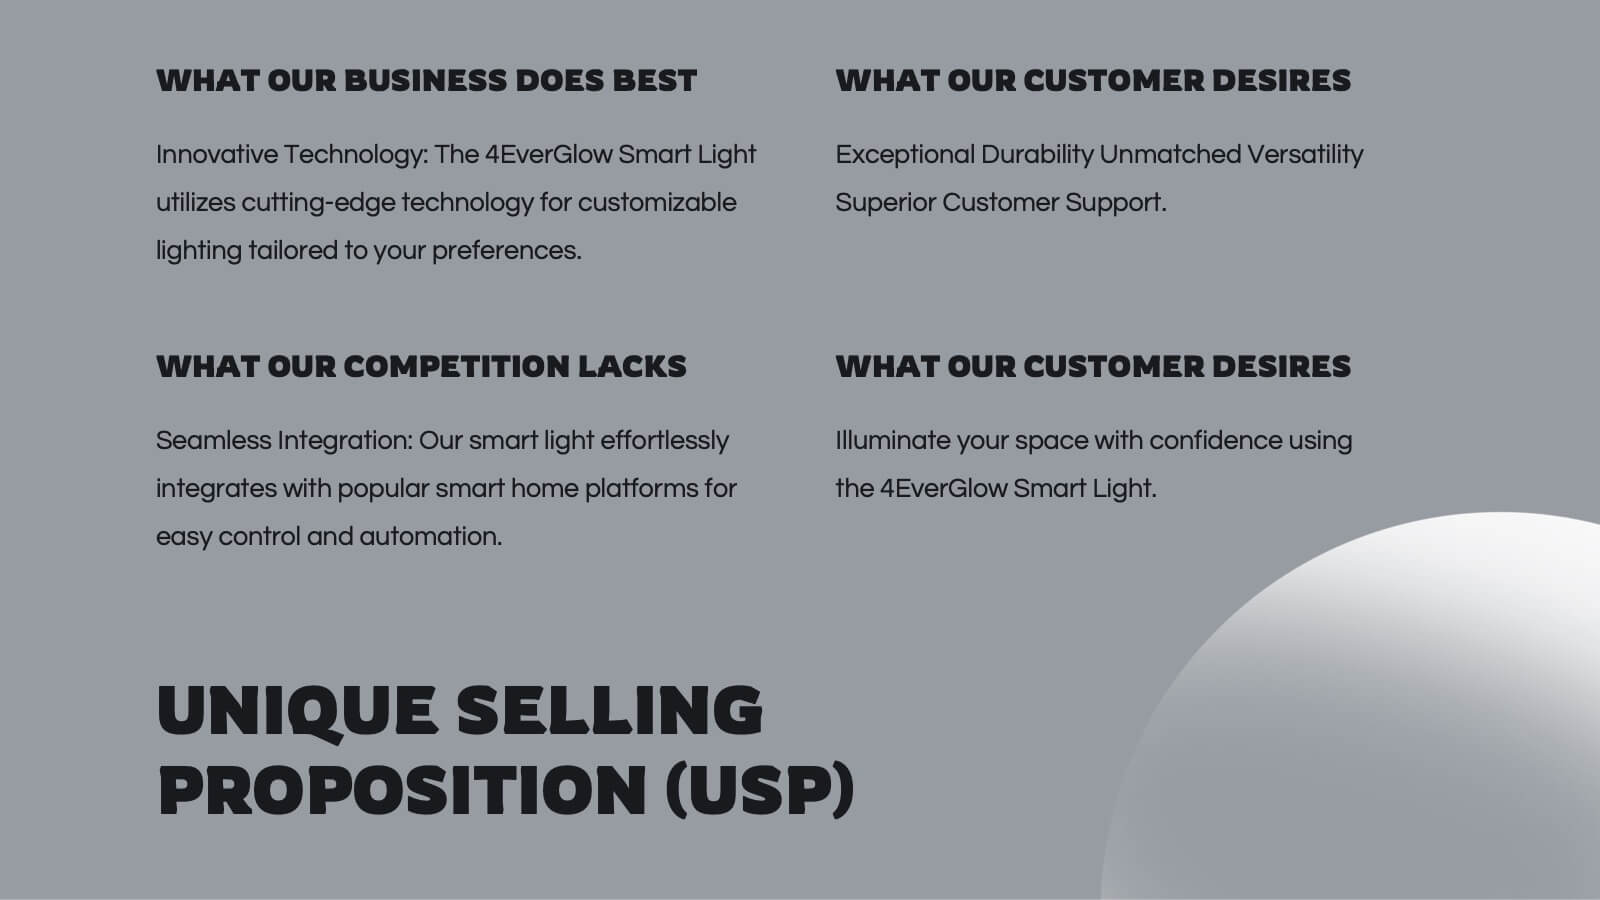
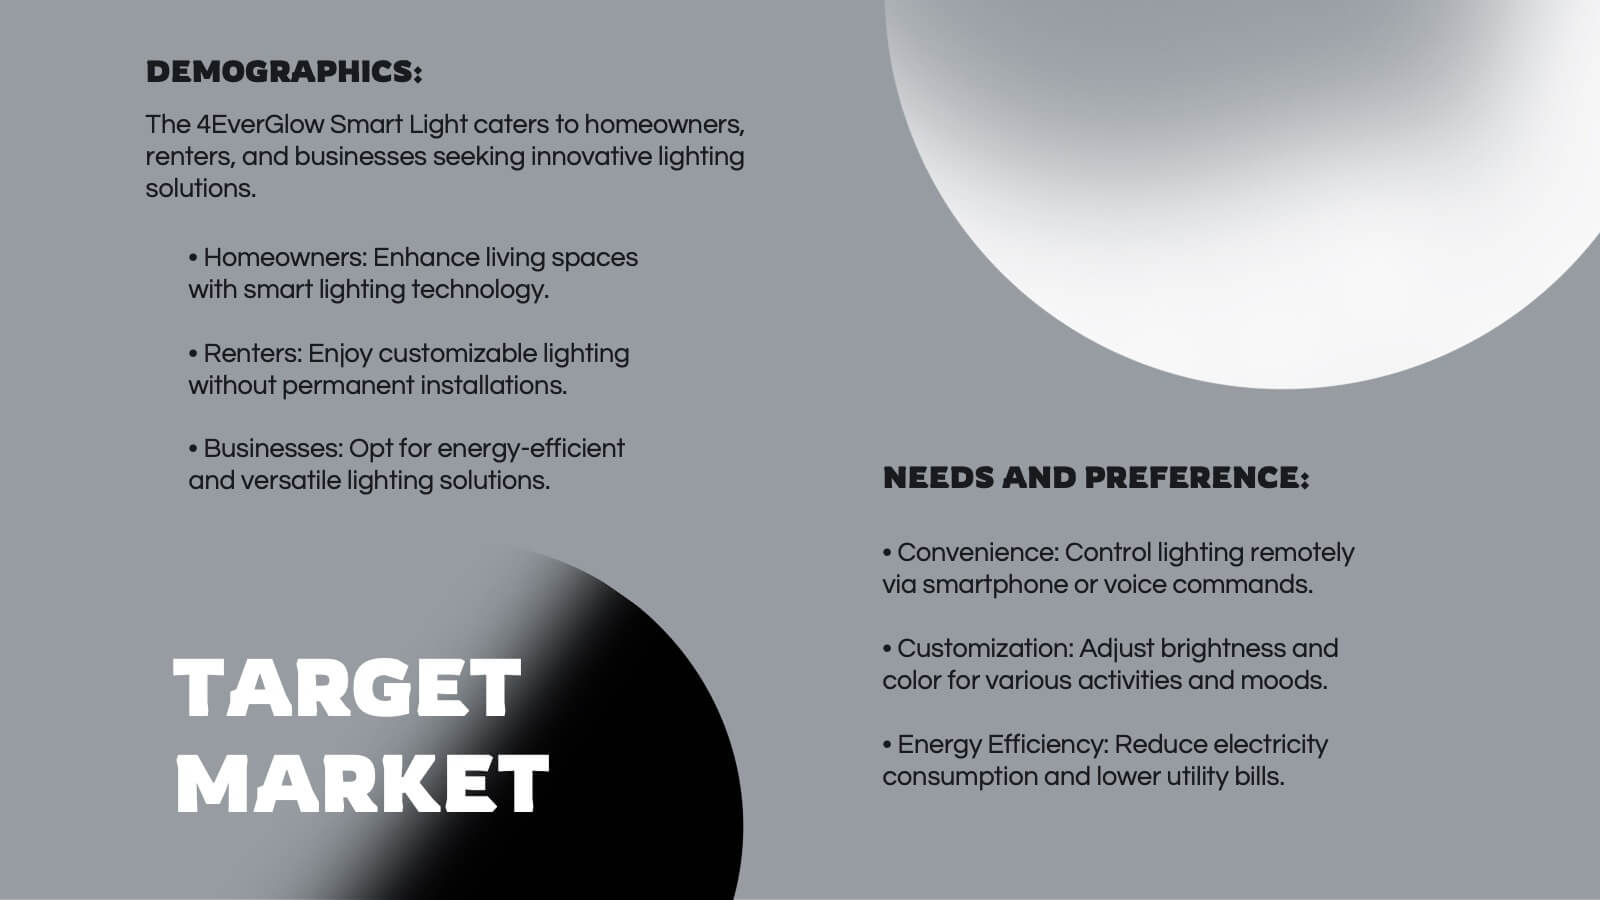
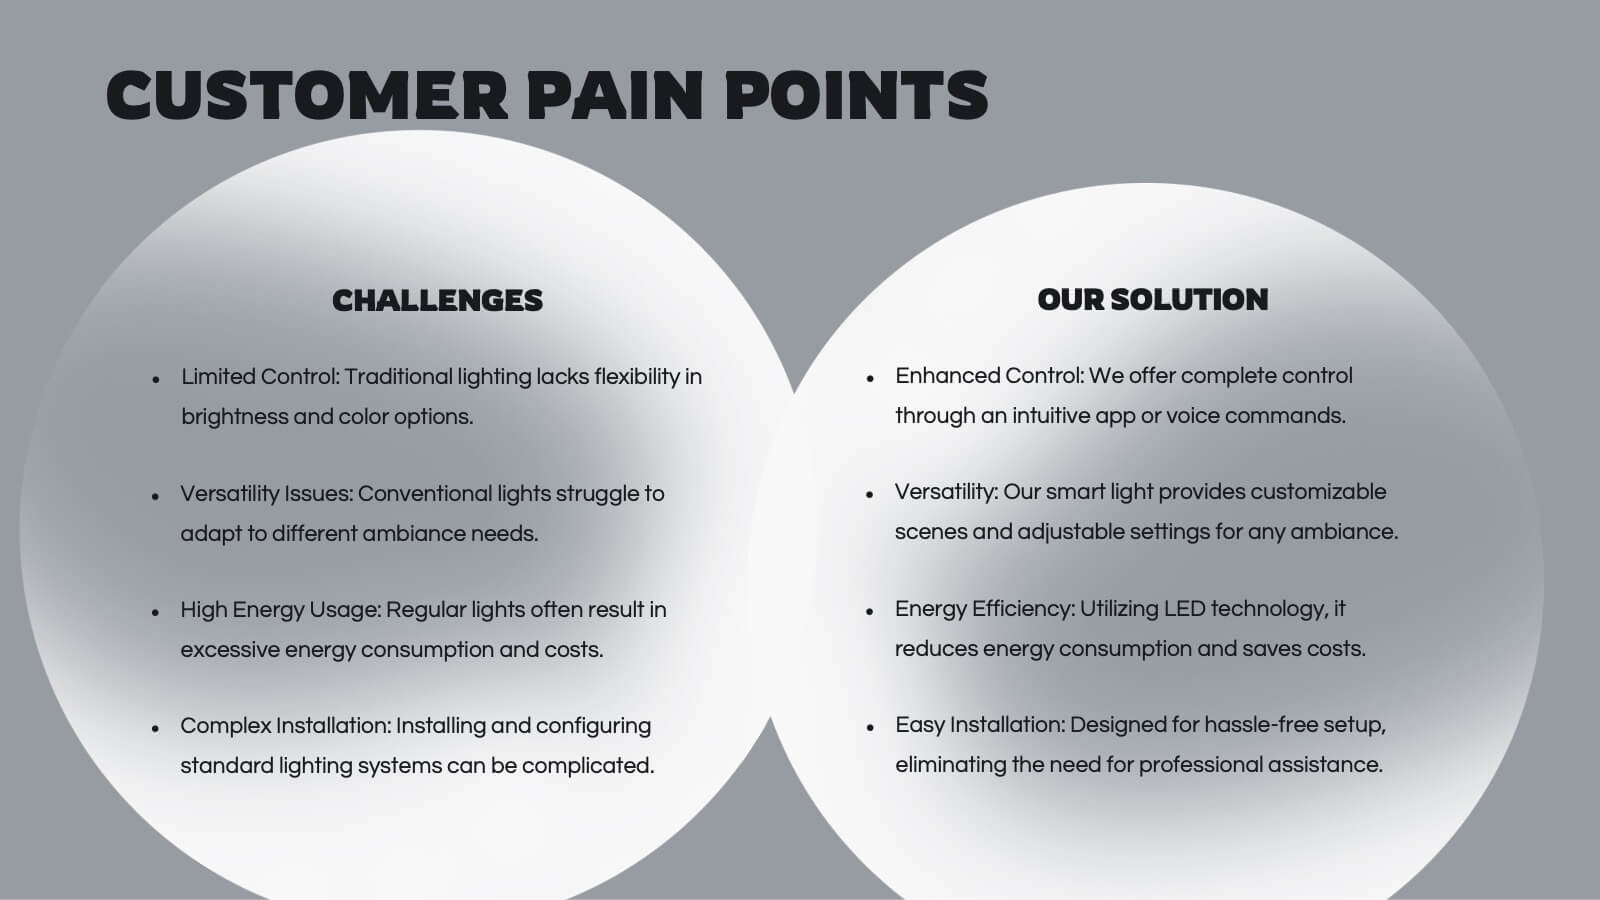
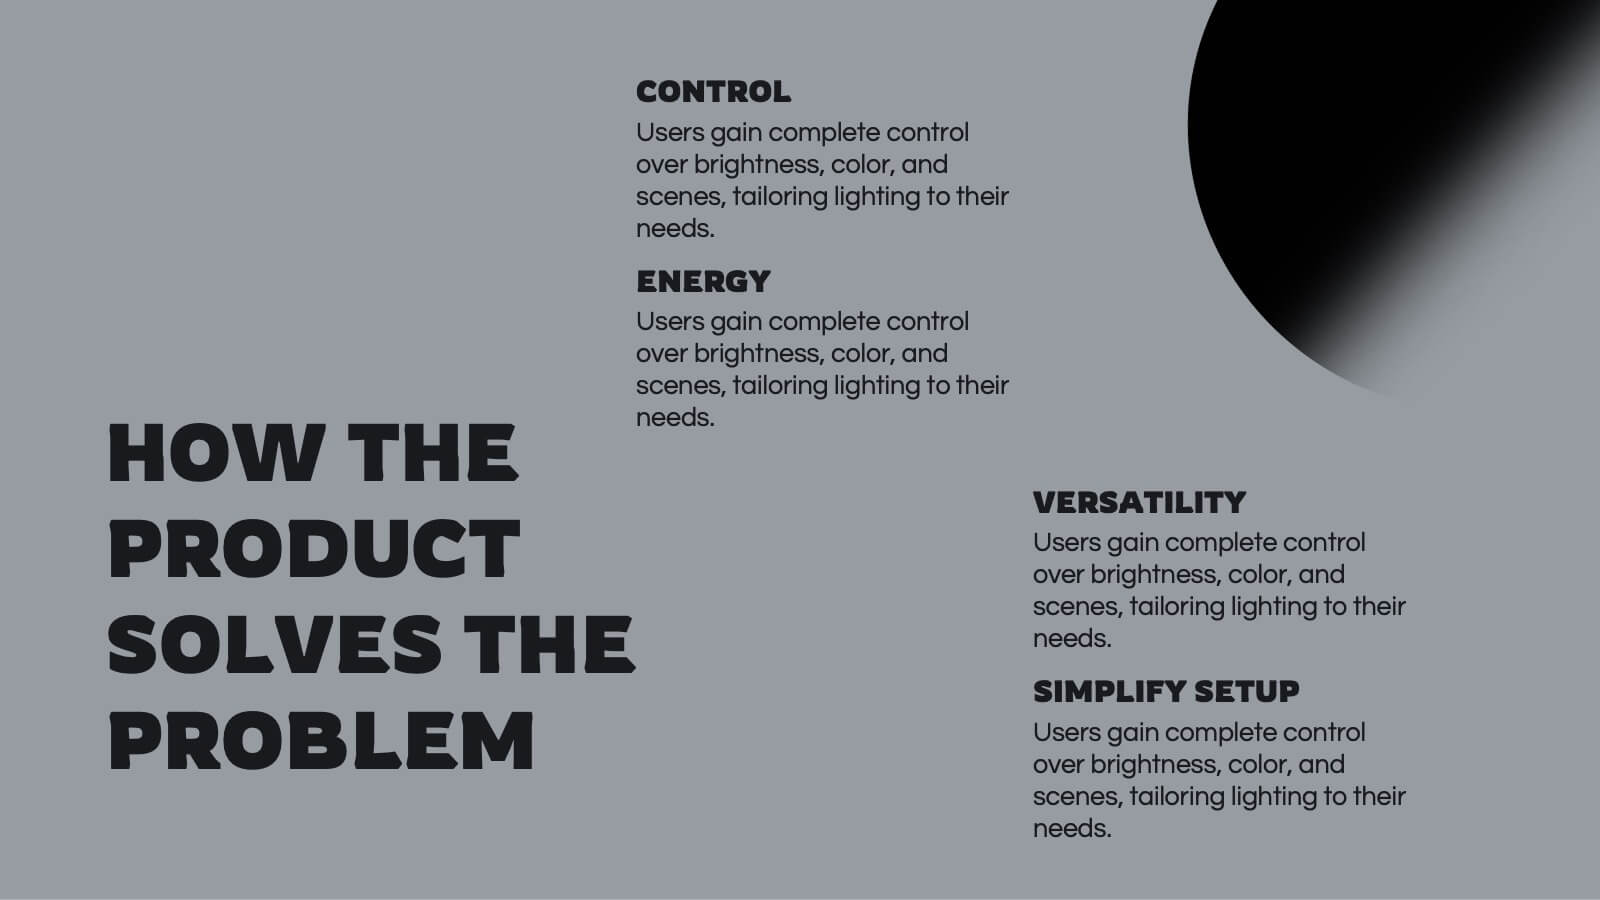
Summary Infographic
This collection of summary slides is expertly crafted to provide concise and clear overviews of complex information, making it ideal for concluding presentations, meetings, or reports. Each slide features a distinctive design with a strong focus on structure and readability, employing a balanced use of space and typography to highlight key points effectively. The slides utilize varied layouts, including bullet points, diagrams, and flowcharts, allowing for the presentation of summary data in a visually appealing and easily digestible format. These elements are crucial for summarizing the results of discussions, outlining project statuses, or presenting conclusions and next steps in a professional setting. Color coding and iconography are strategically used to categorize information and emphasize important metrics or conclusions, aiding in quick comprehension. This set is invaluable for professionals looking to present executive summaries, project outcomes, or strategic recommendations clearly and effectively, ensuring audiences grasp the essential takeaways without getting lost in details.


7 slides
Porters Five Forces Model Infographic Presentation
Porter's Five Forces Model is a structured framework used to analyze the competitive forces within an industry and their impact on a company's profitability. With template you can create an appealing and informative infographic about Porter's Five Forces Model. Featuring helpful illustrations and easy-to-read text, this template is perfect for breaking down the complex concepts of Porter's Five Forces Model into simple, understandable terms. Designed for use with Powerpoint, Keynote, and Google Slides, you can easily add your own content and tailor the template to fit your specific needs.


6 slides
Data Visualization Pie Chart Presentation
Present data with clarity using the Data Visualization Pie Chart Presentation template. This professional and fully customizable slide deck is designed for business analysts, marketers, and data scientists to showcase key insights in an engaging and visually impactful way. Featuring a modern pie chart layout, it simplifies complex information for clear communication. Compatible with PowerPoint, Keynote, and Google Slides.


5 slides
Attention to Action Model Framework Presentation
This sleek presentation visualizes the four key stages—Attention, Interest, Desire, and Action—in a clear, pyramid-based layout. Ideal for marketing, sales, or behavioral strategy discussions. Each step is color-coded for emphasis, making it easy to follow and present. Fully editable in Canva to fit your brand and messaging needs.