


Features
- 3 Unique slides
- Fully editable and easy to edit in Microsoft Powerpoint, Keynote and Google Slides
- 16:9 widescreen layout
- Clean and professional designs
- Export to JPG, PDF or send by email


Do you have any questions?
Recommend


13 slides
Market Segmentation and Consumer Demographics Presentation
Visualize your audience breakdown with this clean, data-driven demographic infographic slide. Featuring customizable male and female icons, percentage metrics, and bar charts for segment analysis, this layout is perfect for showcasing consumer insights, behavior patterns, and target group comparisons. Ideal for marketing reports, business plans, and audience research decks. Fully editable in PowerPoint, Keynote, and Google Slides.


6 slides
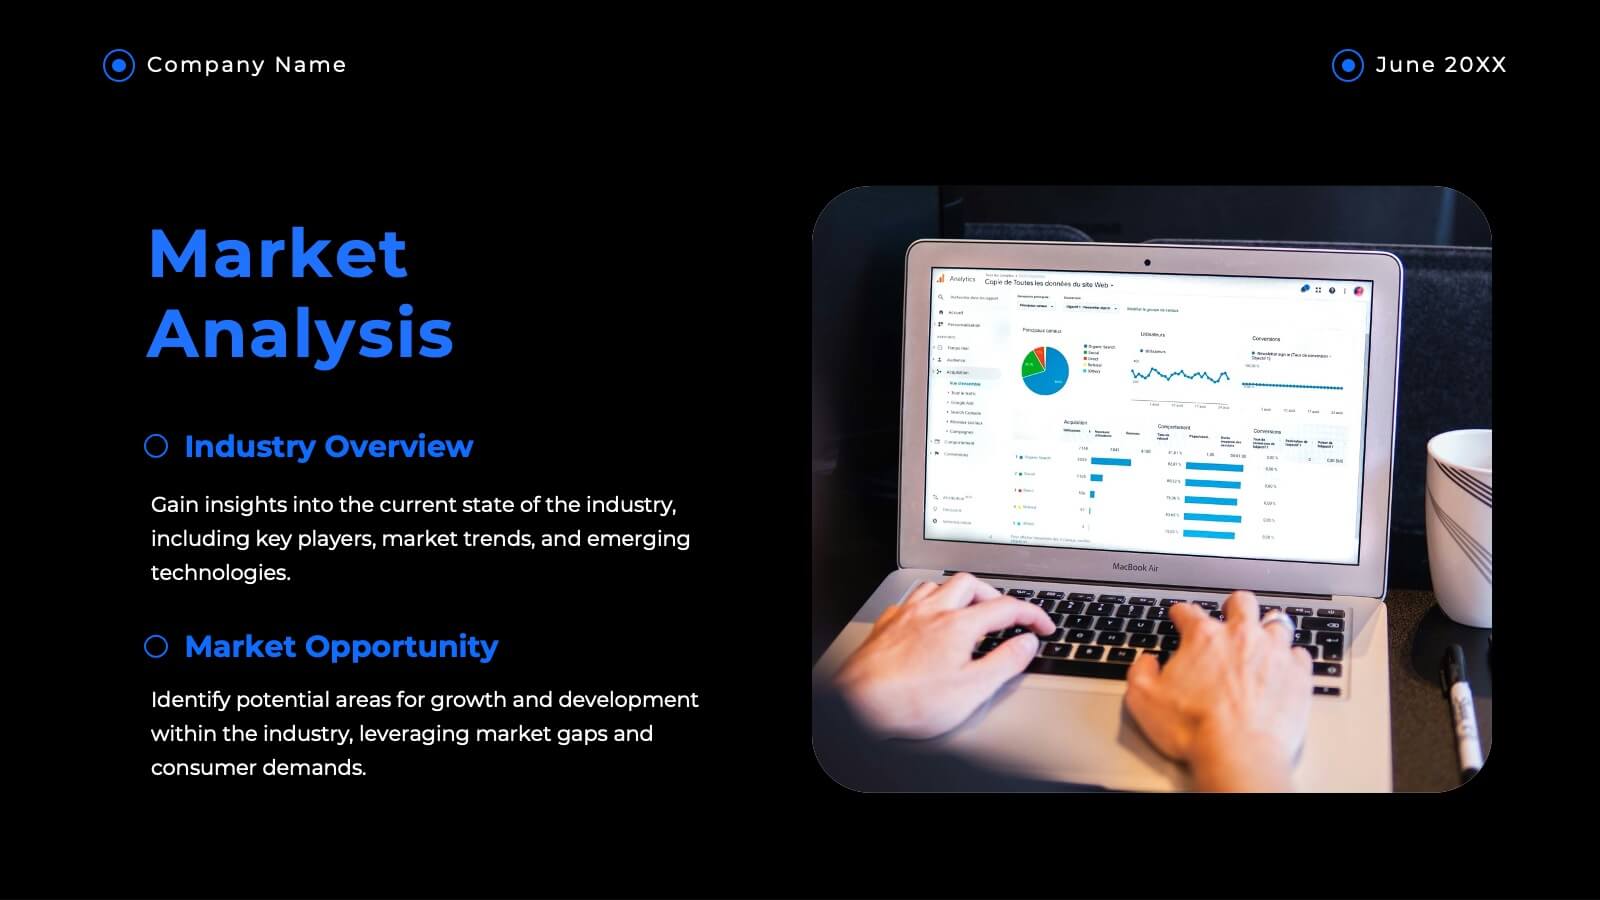
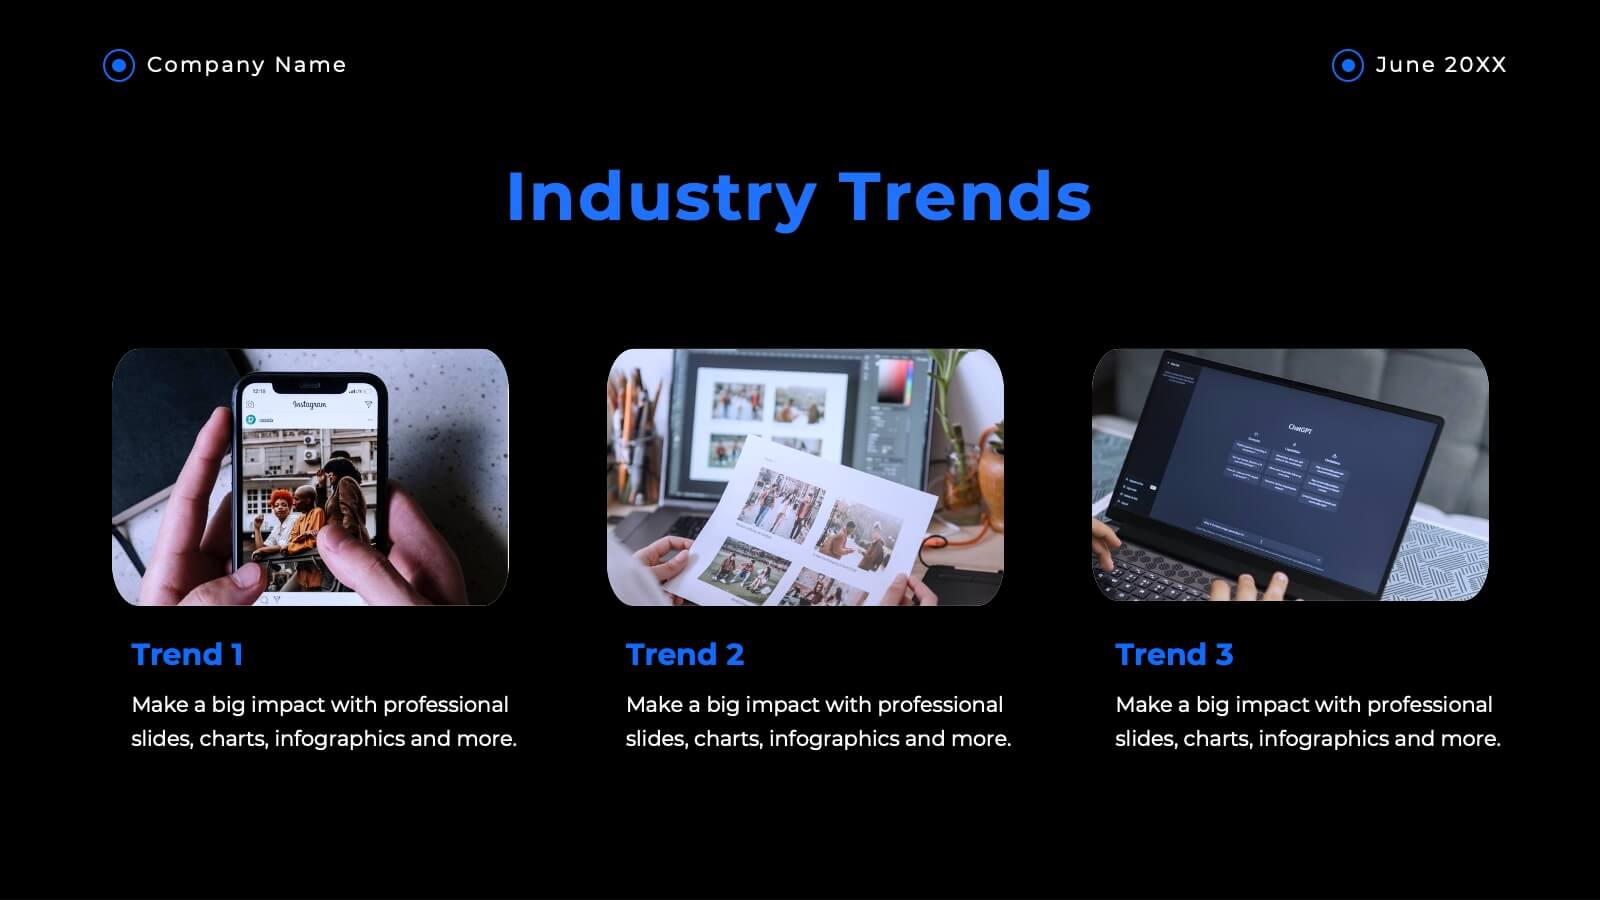
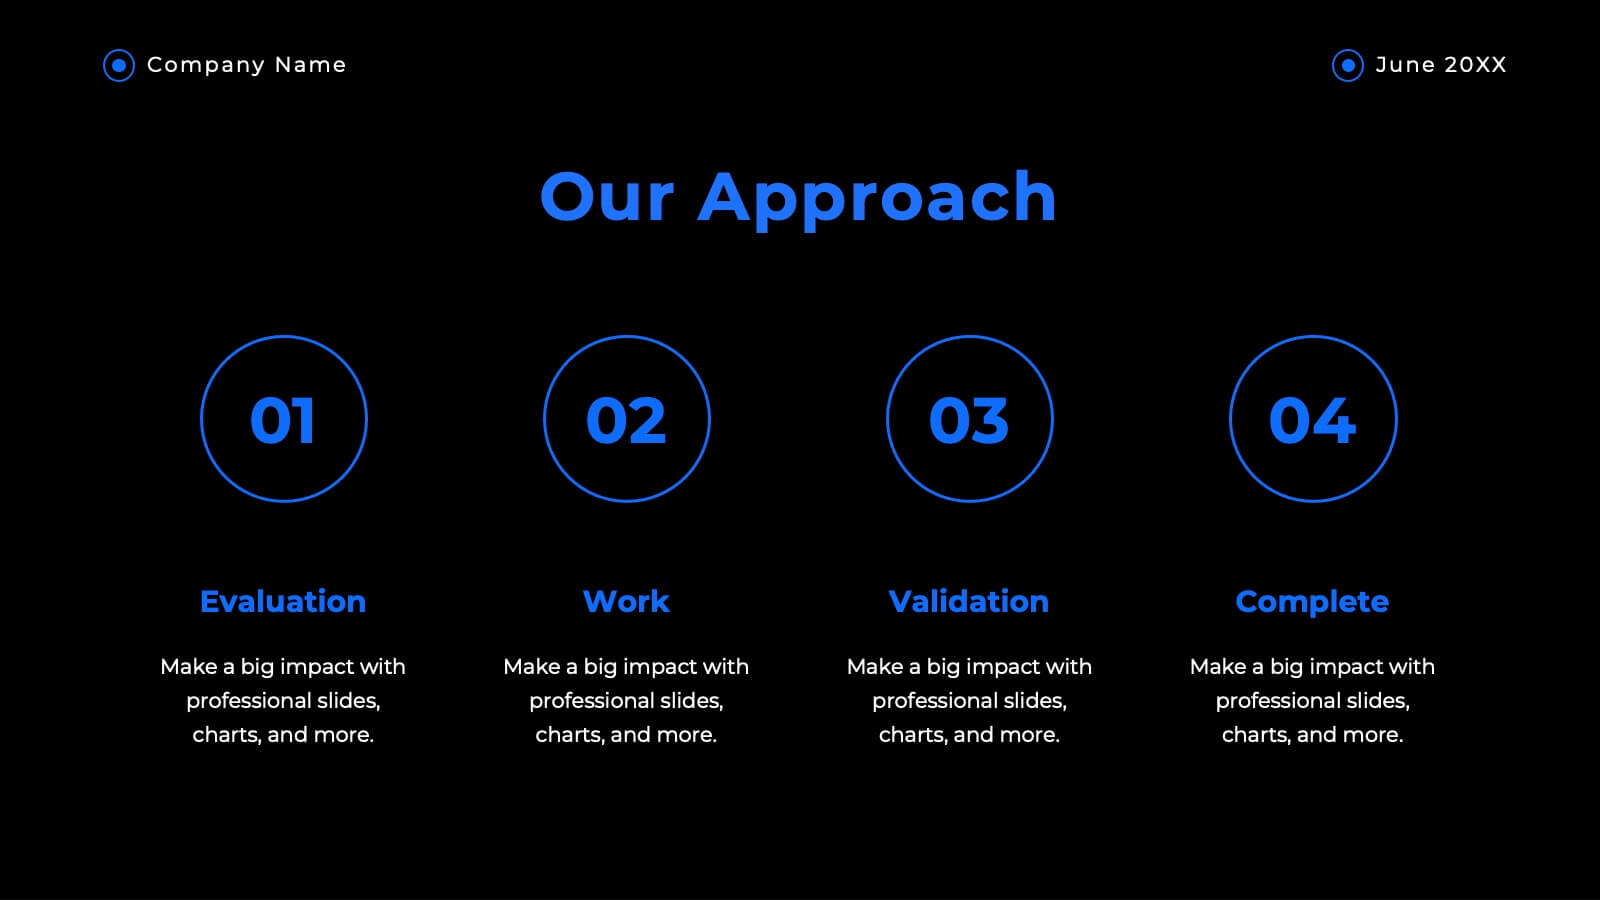
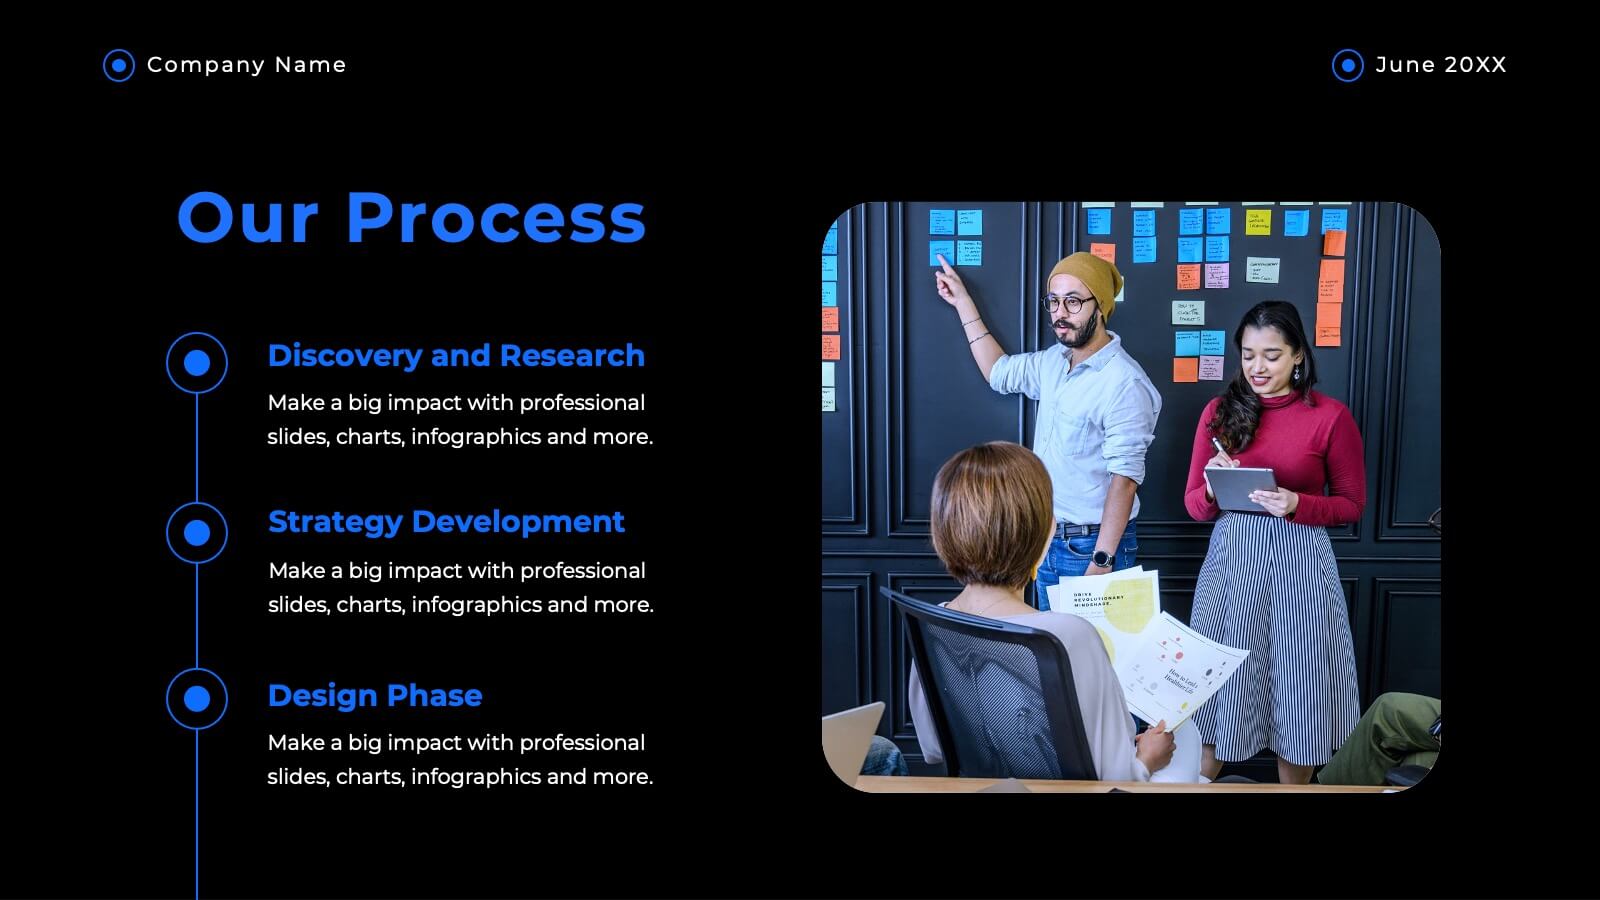
Social Media Analytics Infographic
Social Media Analytics refers to the process of collecting, analyzing, and interpreting data from social media platforms to gain insights into audience behavior, content performance, and overall social media effectiveness. This template showcases key concepts and insights related to social media analytics. This template is designed to help individuals and businesses understand and leverage the power of data-driven analysis to enhance their social media strategies. This template is perfect to optimize your social media presence, improve engagement, and drive meaningful results. Compatible with Powerpoint, Keynote, and Google Slides.


5 slides
Environment Preservation Infographics
Environment preservation refers to the protection, conservation, and sustainable management of natural resources and ecosystems to maintain their integrity and ensure their long-term viability. These vertical infographics are designed to raise awareness about the current environmental challenges and inspire individuals and communities to take action to protect and conserve the environment. It can be used in presentations, workshops, educational campaigns, and sustainability initiatives to inspire individuals, organizations, and communities to take steps towards a more sustainable and resilient future. Compatible with Powerpoint, Keynote, and google Slides.


26 slides
Home Solar Power System Presentation
Harness the incredible power of the sun and transform your home with our vibrant and detailed presentation on home solar power systems! Discover the benefits and functionalities of solar energy, designed to help you understand how solar panels work, their environmental impact, and cost savings. Our engaging template covers essential topics like installation processes, efficiency comparisons, and maintenance tips. It includes a variety of infographics, charts, and diagrams to illustrate complex information clearly and effectively. Perfect for homeowners, energy consultants, or anyone interested in sustainable living, this template offers a visually appealing and informative guide to adopting solar power. Customize each slide to fit your needs, whether you're presenting to a small group or a large audience. Compatible with PowerPoint, Keynote, and Google Slides, this template ensures a smooth and professional presentation experience. Ideal for showcasing the future of clean energy and encouraging the switch to renewable resources.

21 slides
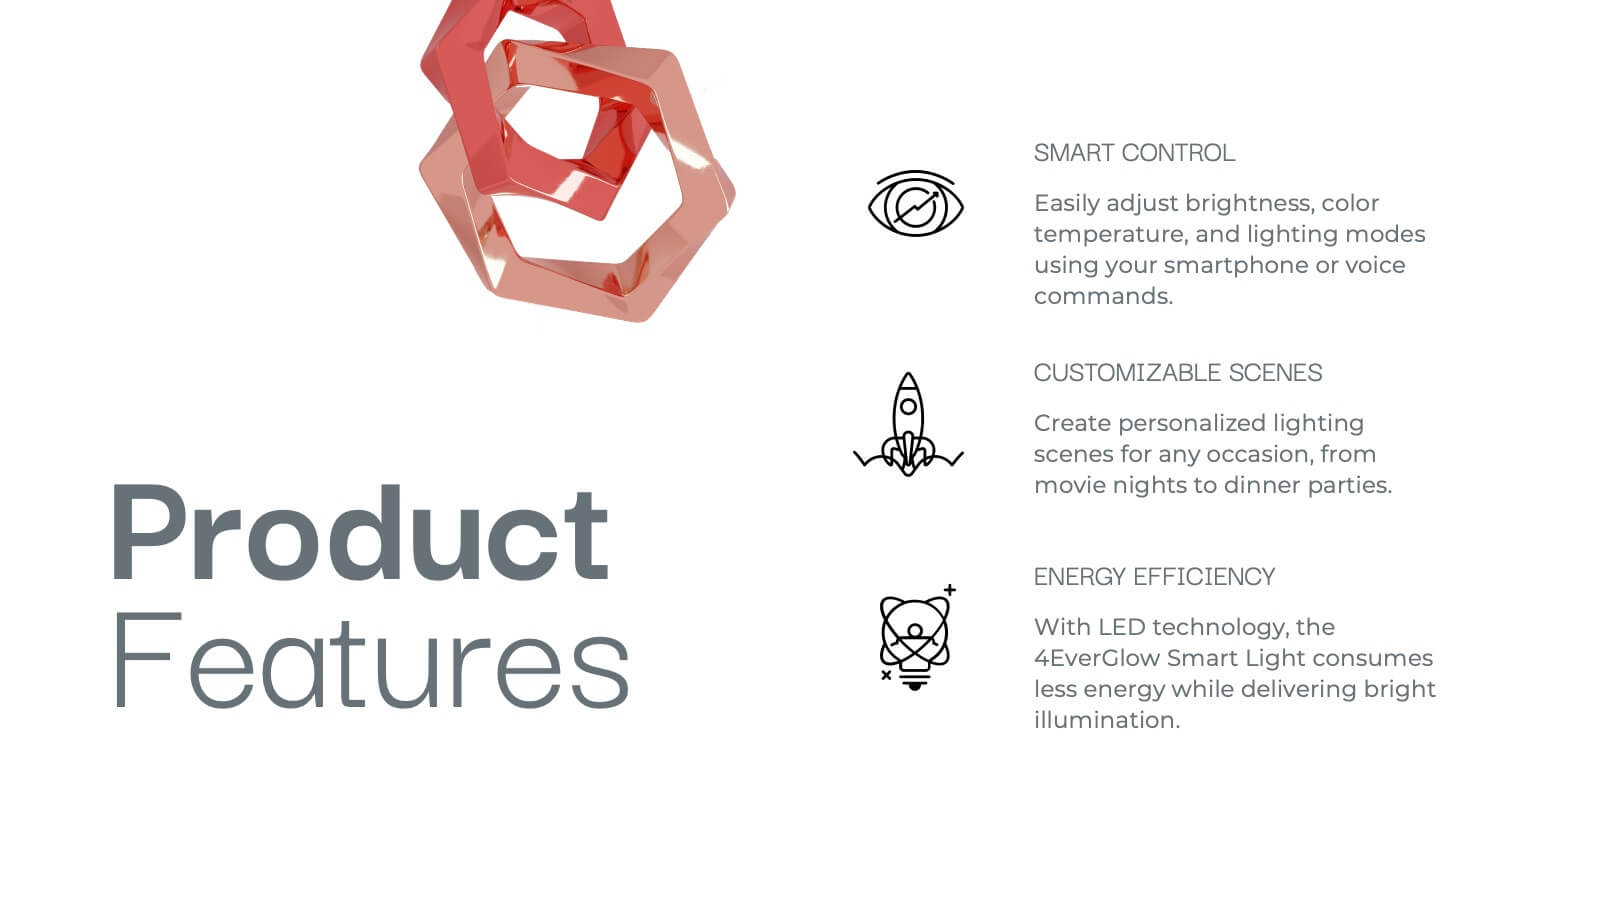
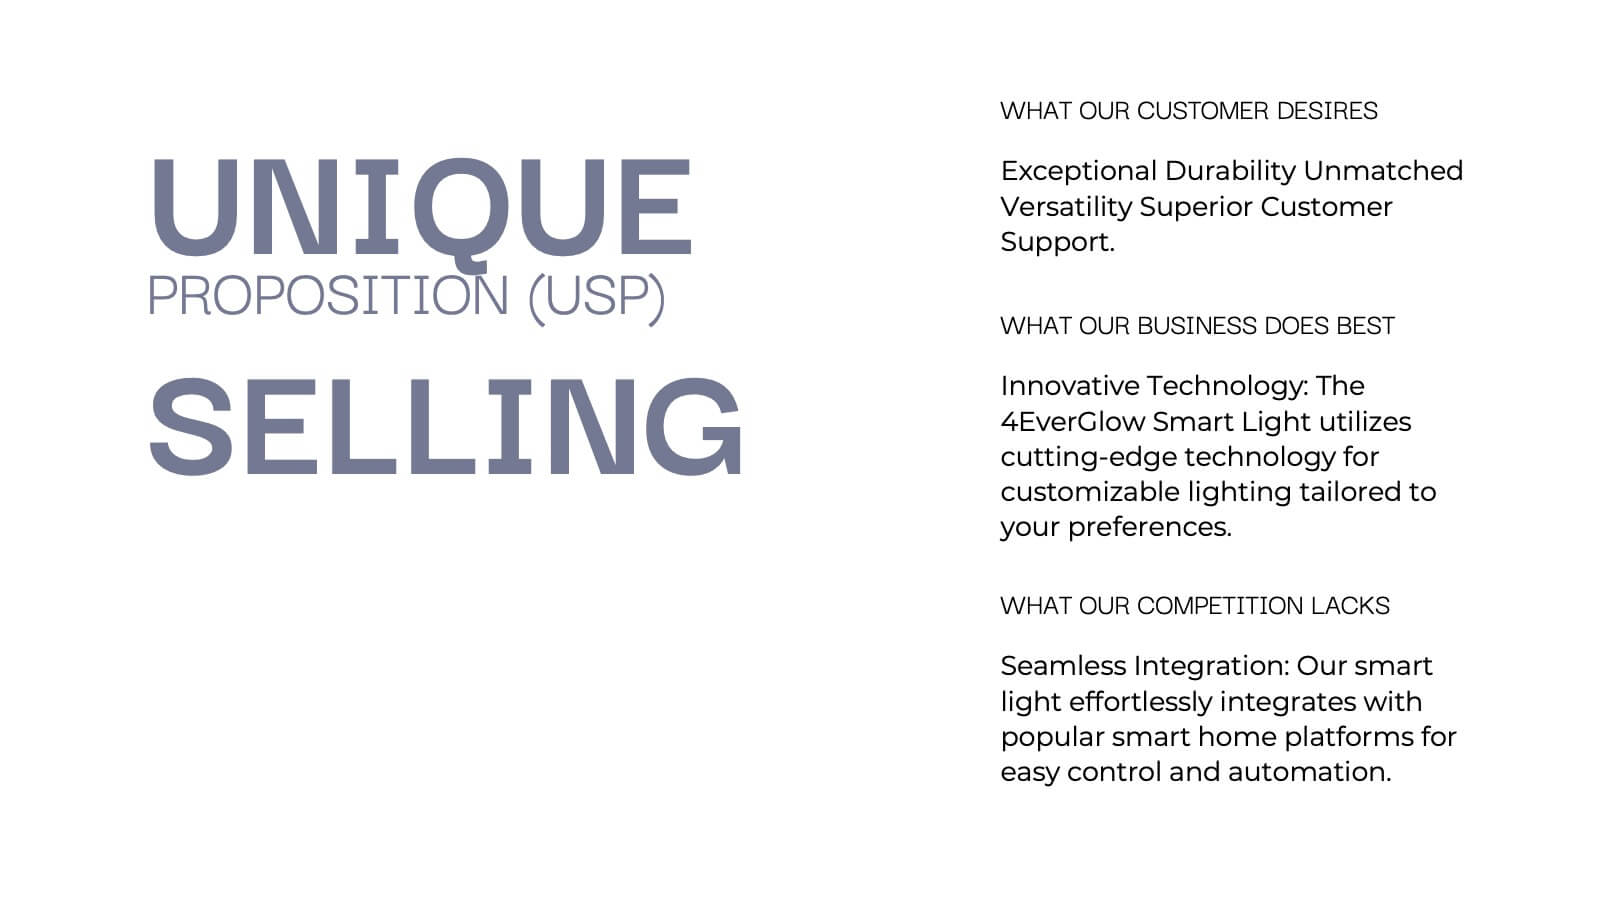
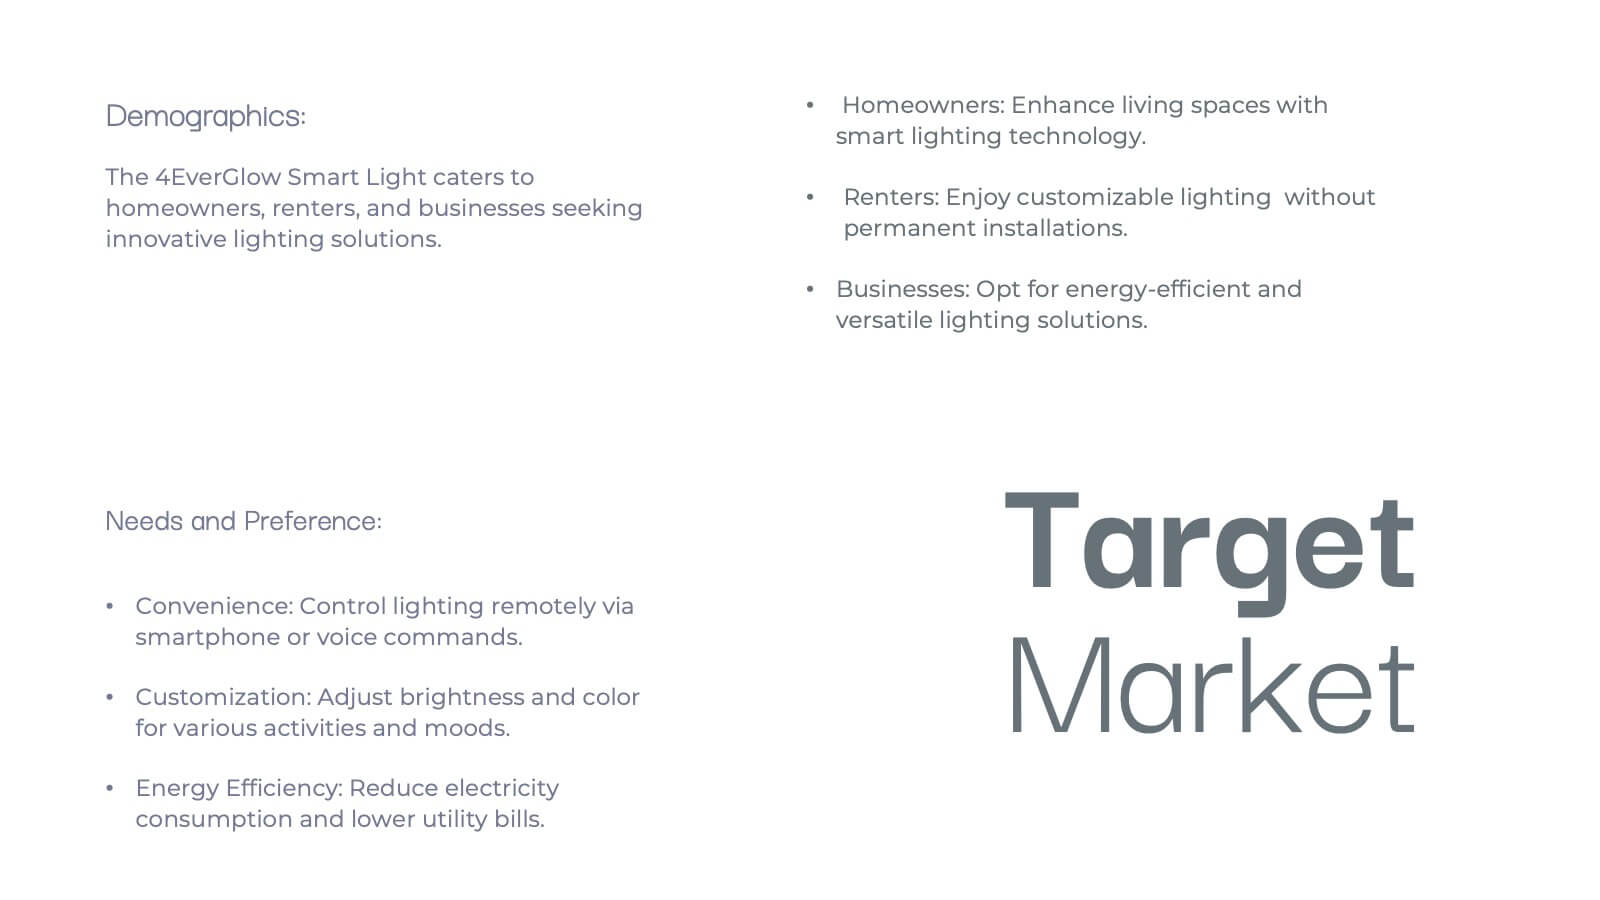
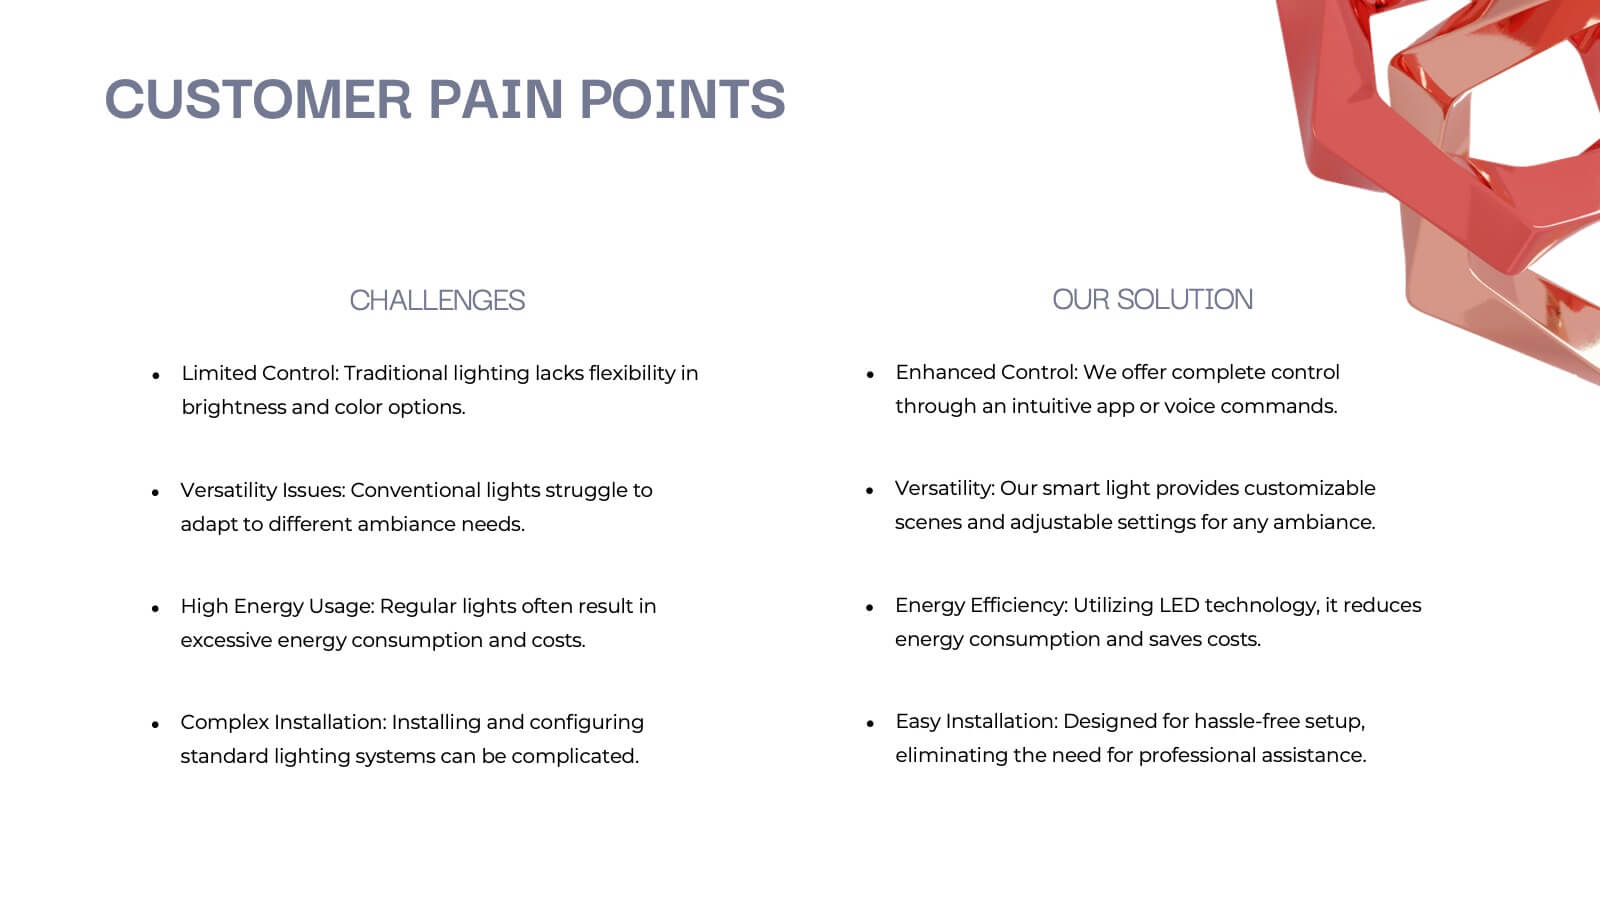
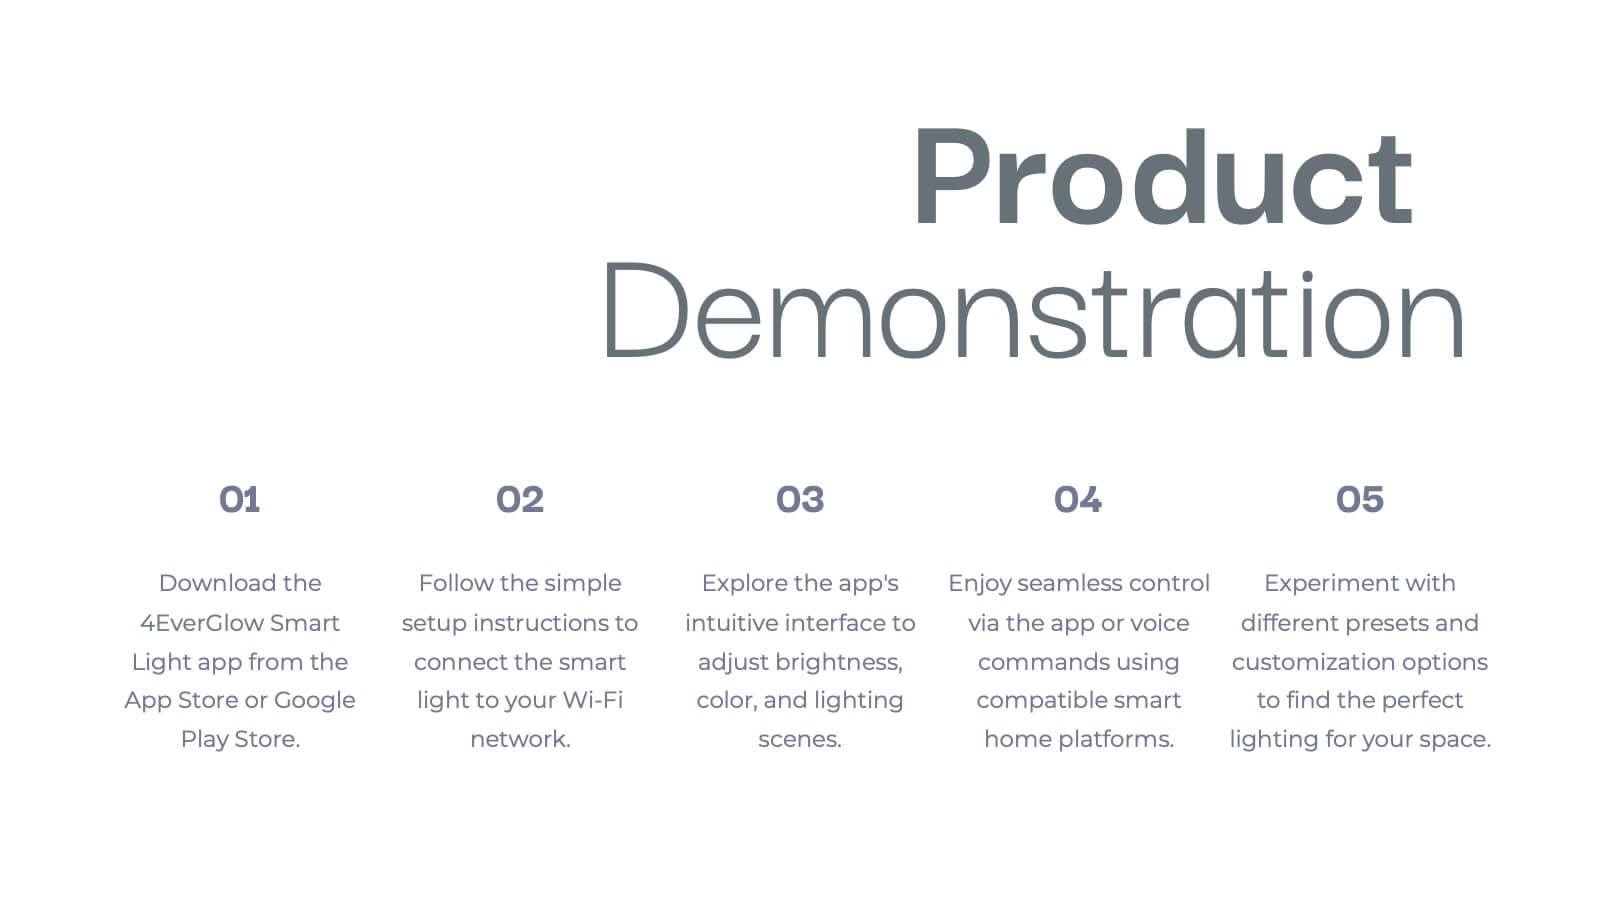
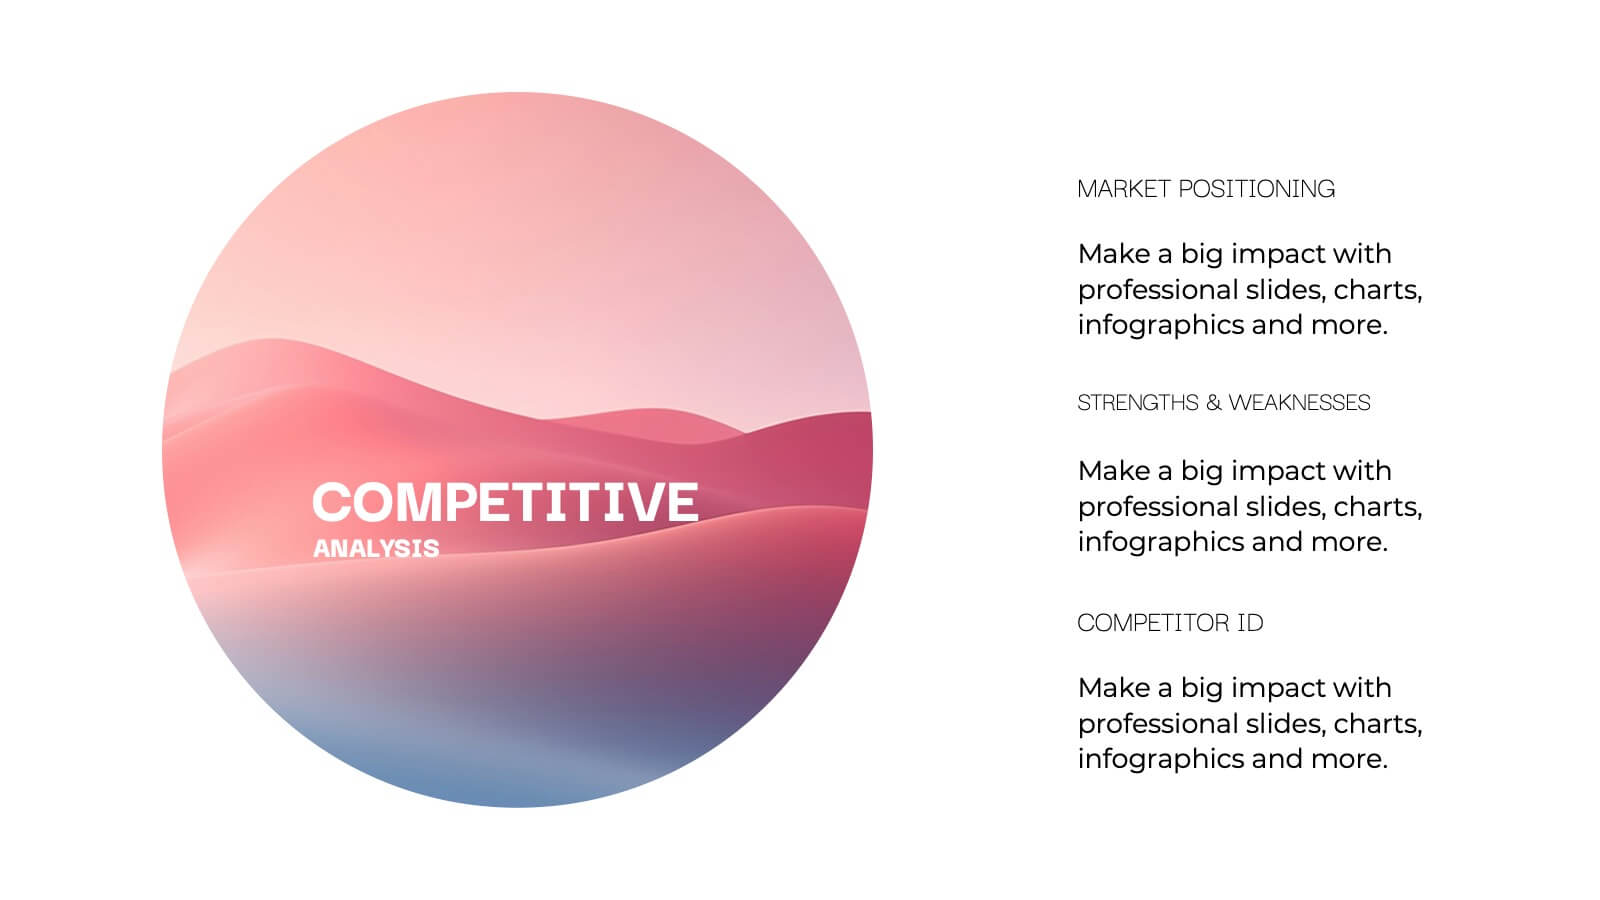
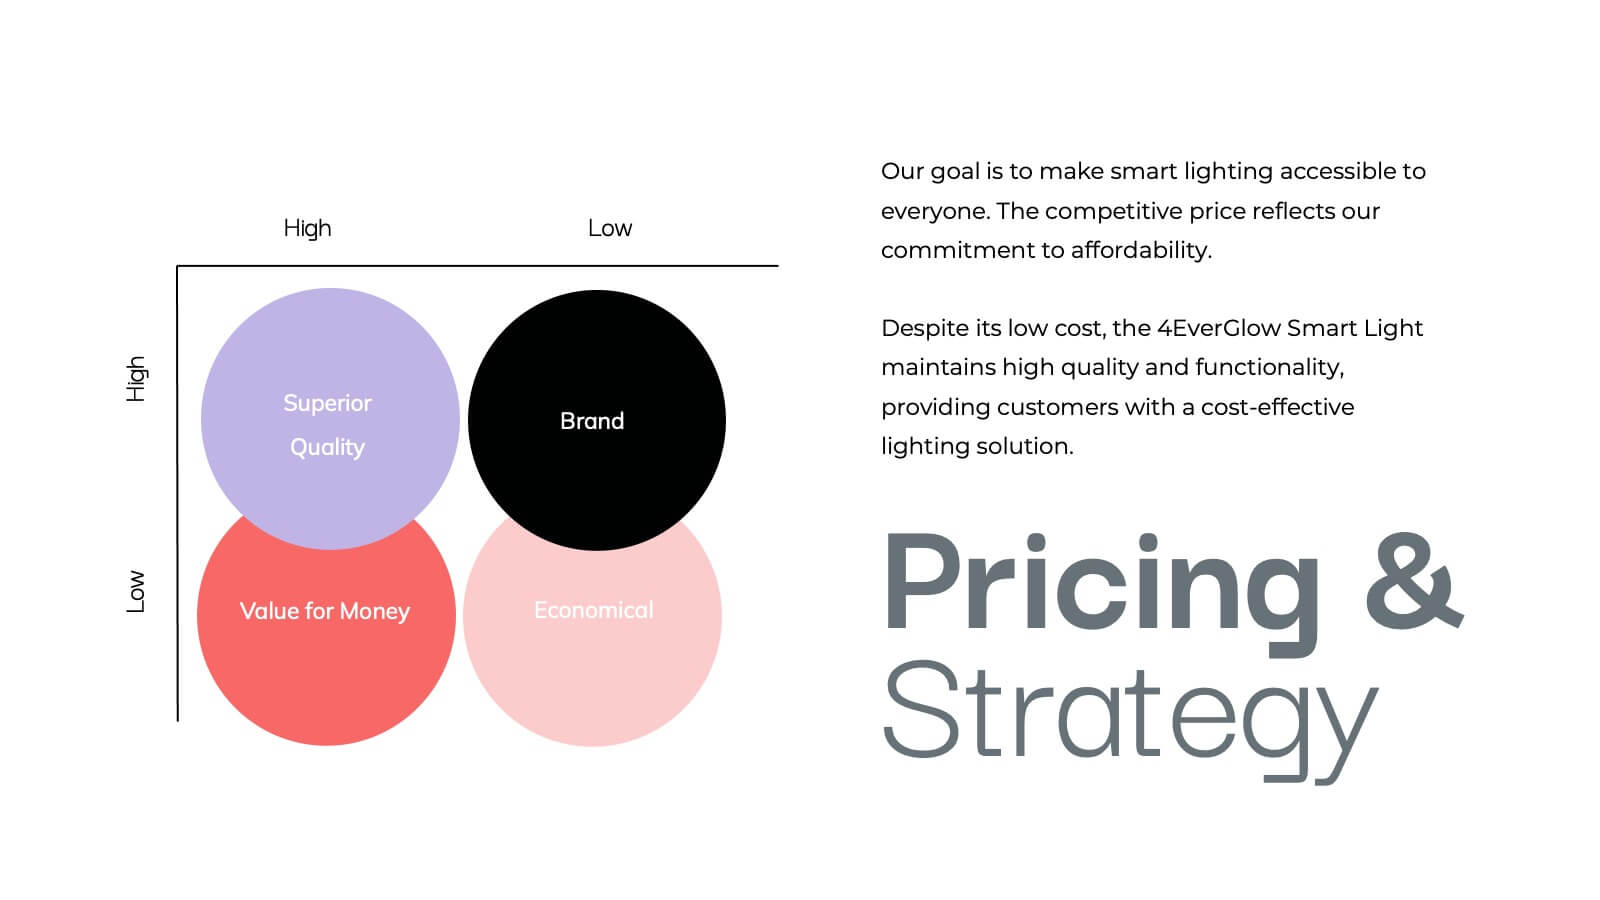
Vulcan New Product Proposal Presentation
Launch your next product with confidence using this comprehensive presentation template! Covering everything from product features and target market to pricing strategy and customer pain points, this template ensures a smooth and engaging flow for your audience. It’s ideal for product proposals, demonstrations, and marketing strategies. Compatible with PowerPoint, Keynote, and Google Slides for seamless presentations.
22 slides
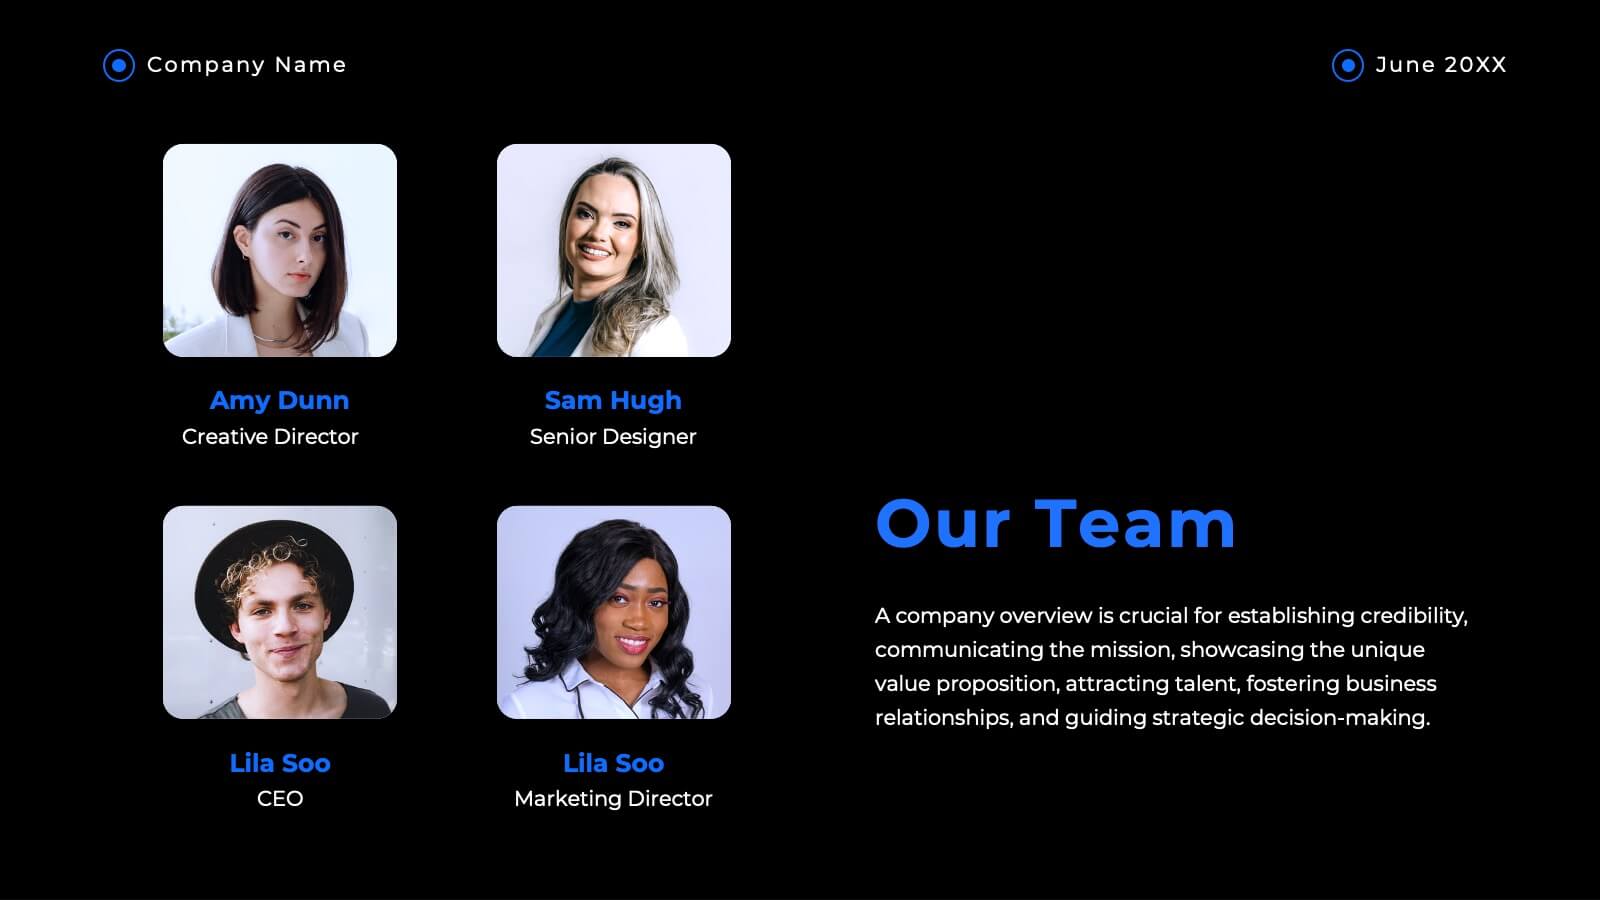
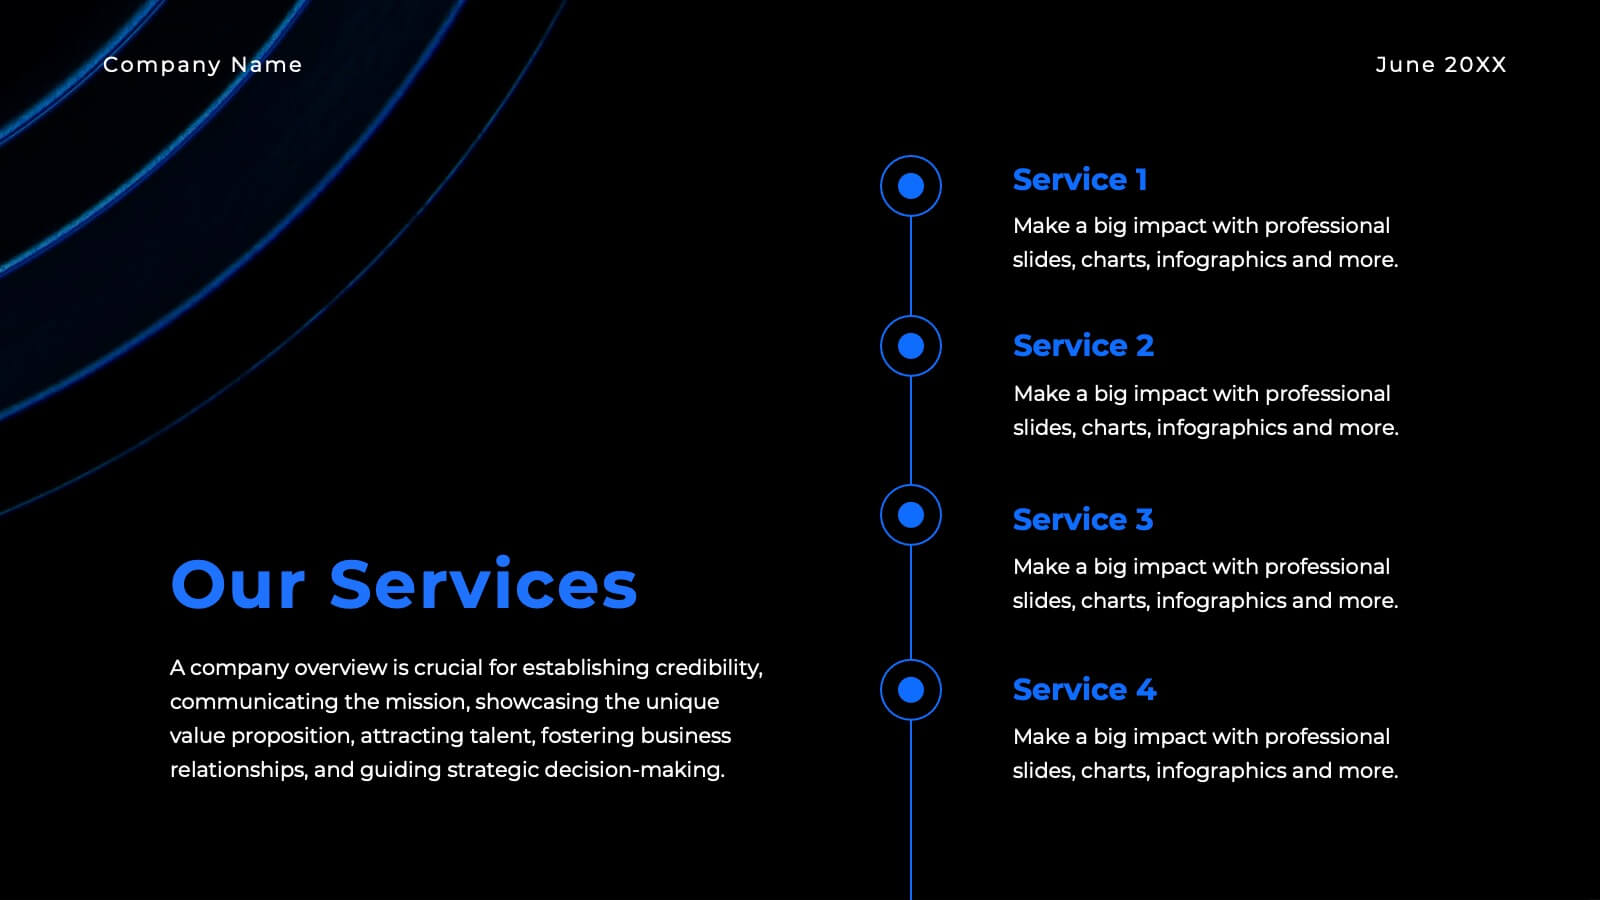
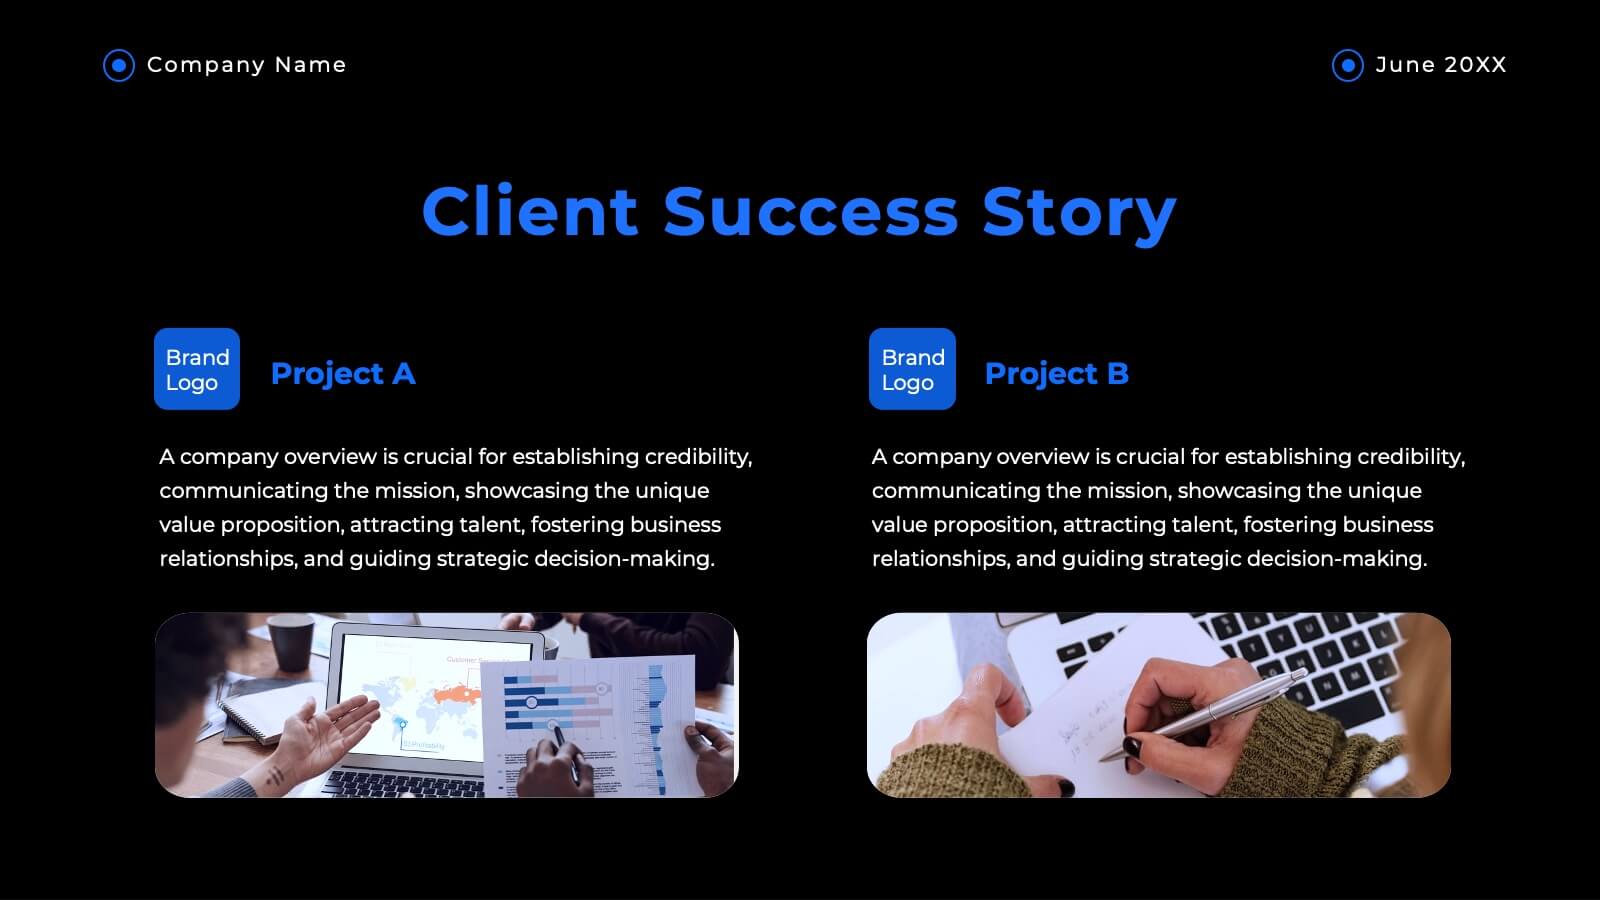
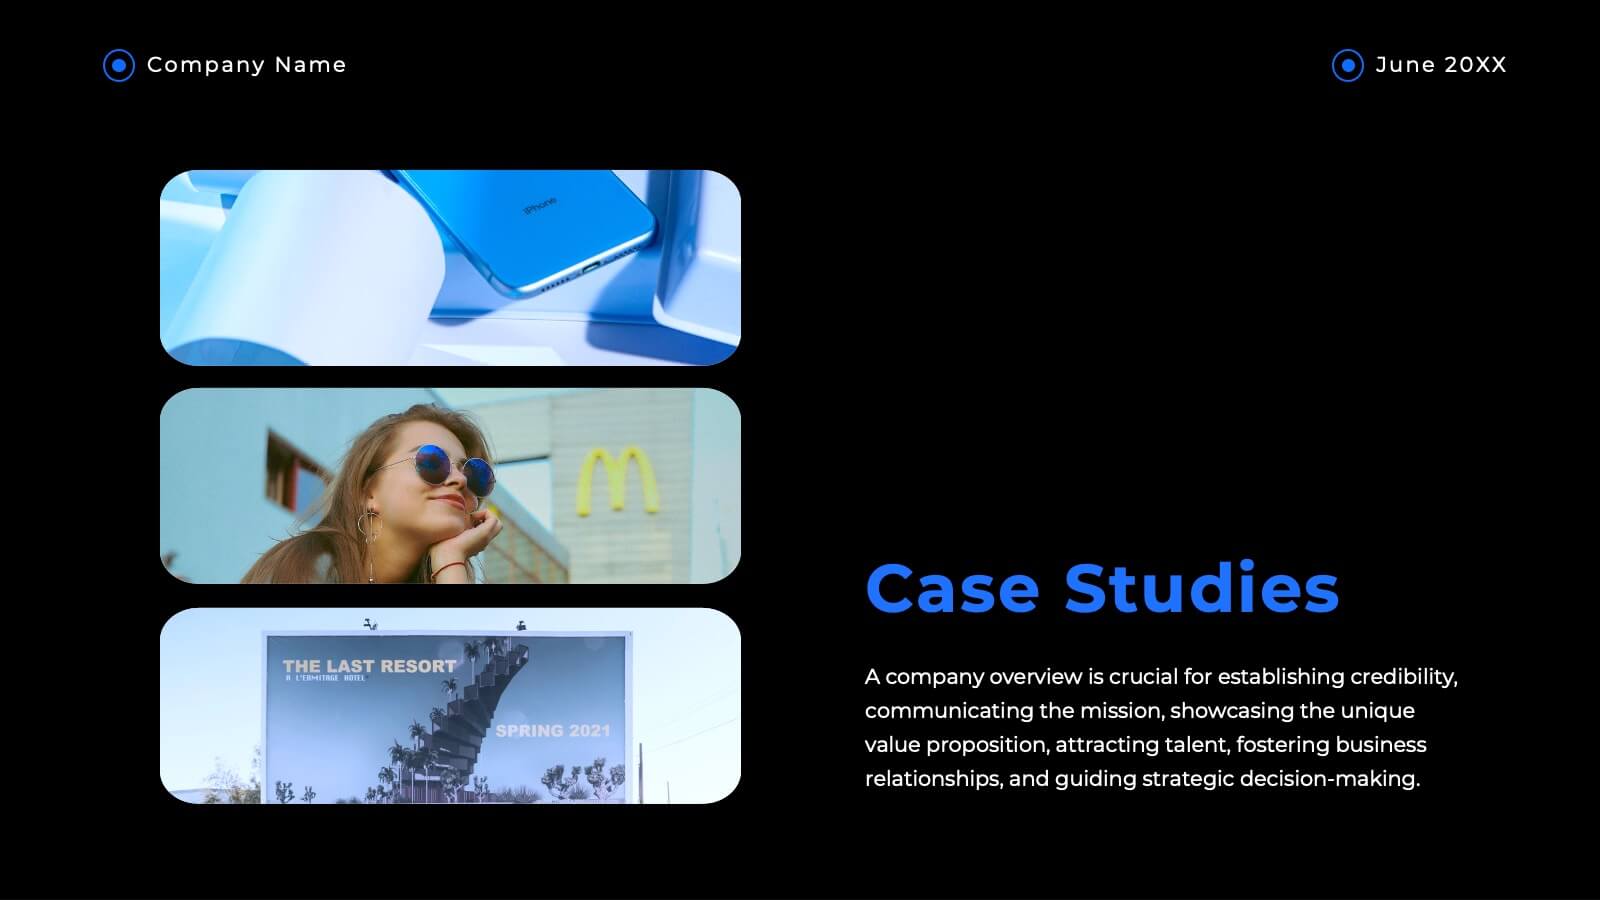
Haven Advertising Agency Proposal Presentation
Wow your clients with this sophisticated agency presentation template! Perfect for showcasing your services, client success stories, and market analysis. Ideal for agencies looking to impress and secure new business. Compatible with PowerPoint, Keynote, and Google Slides, this template ensures your proposals stand out with professional elegance. Perfect for any pitch or proposal.


6 slides
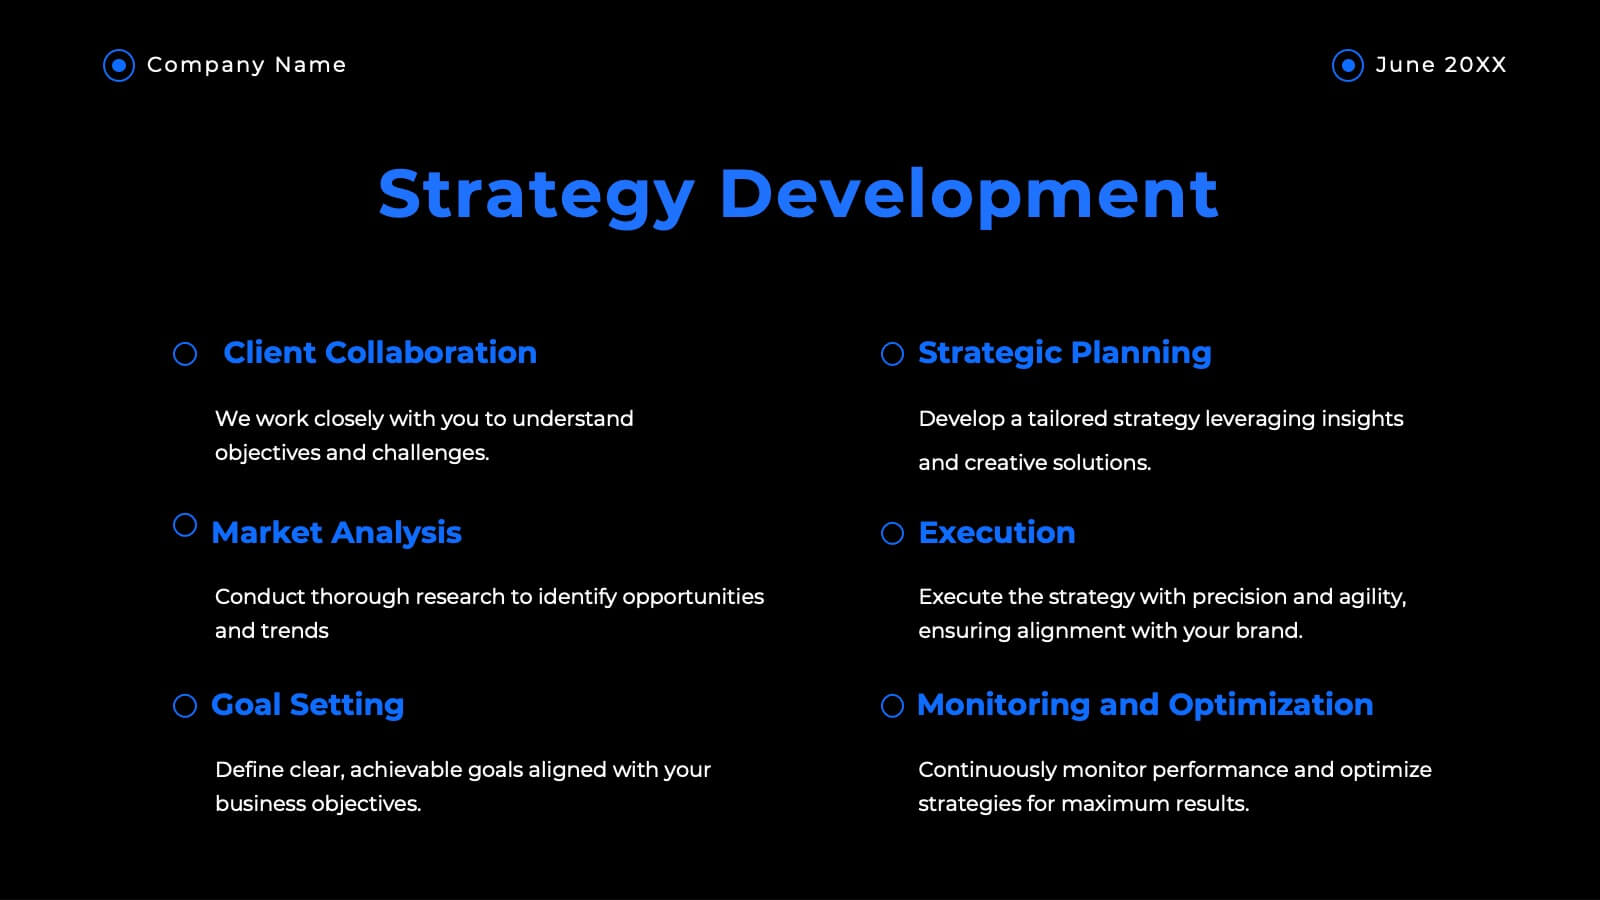
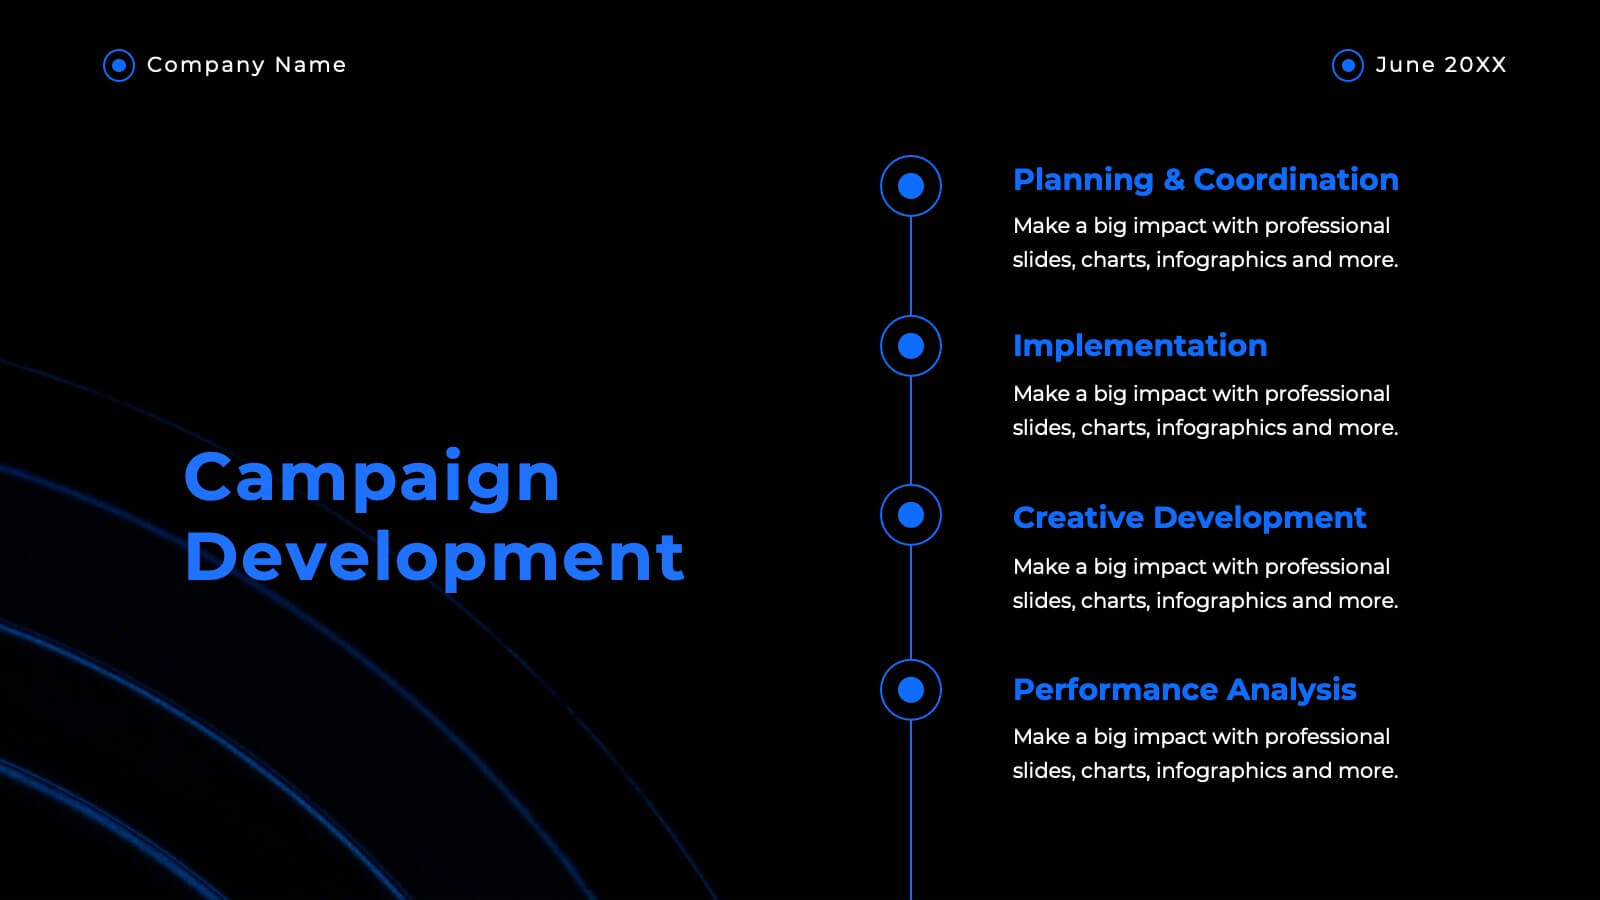
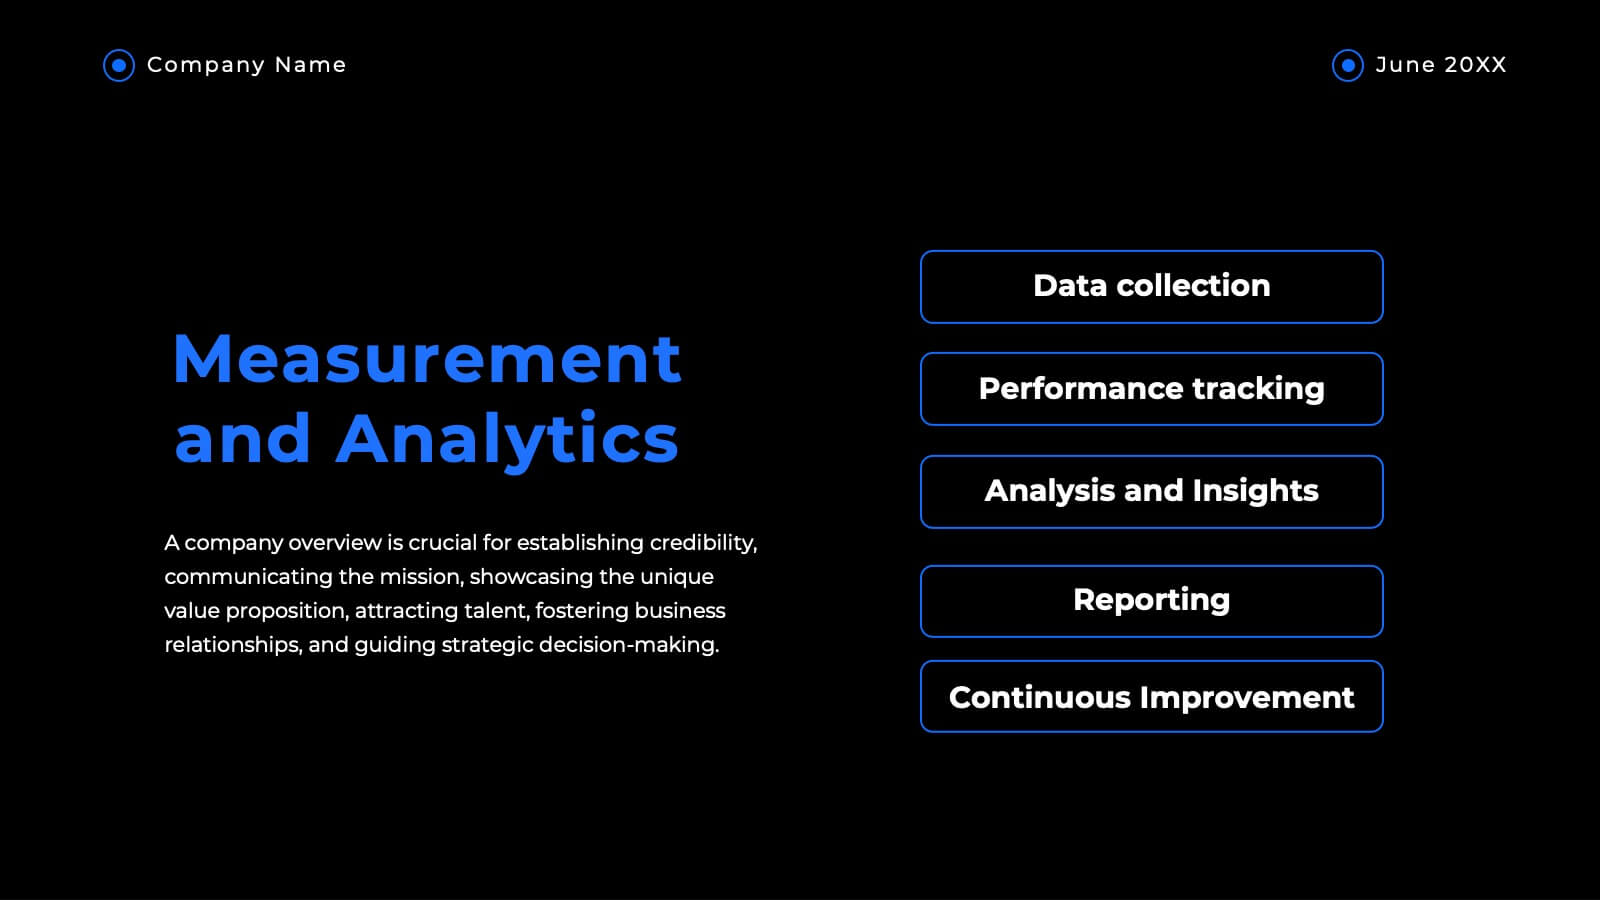
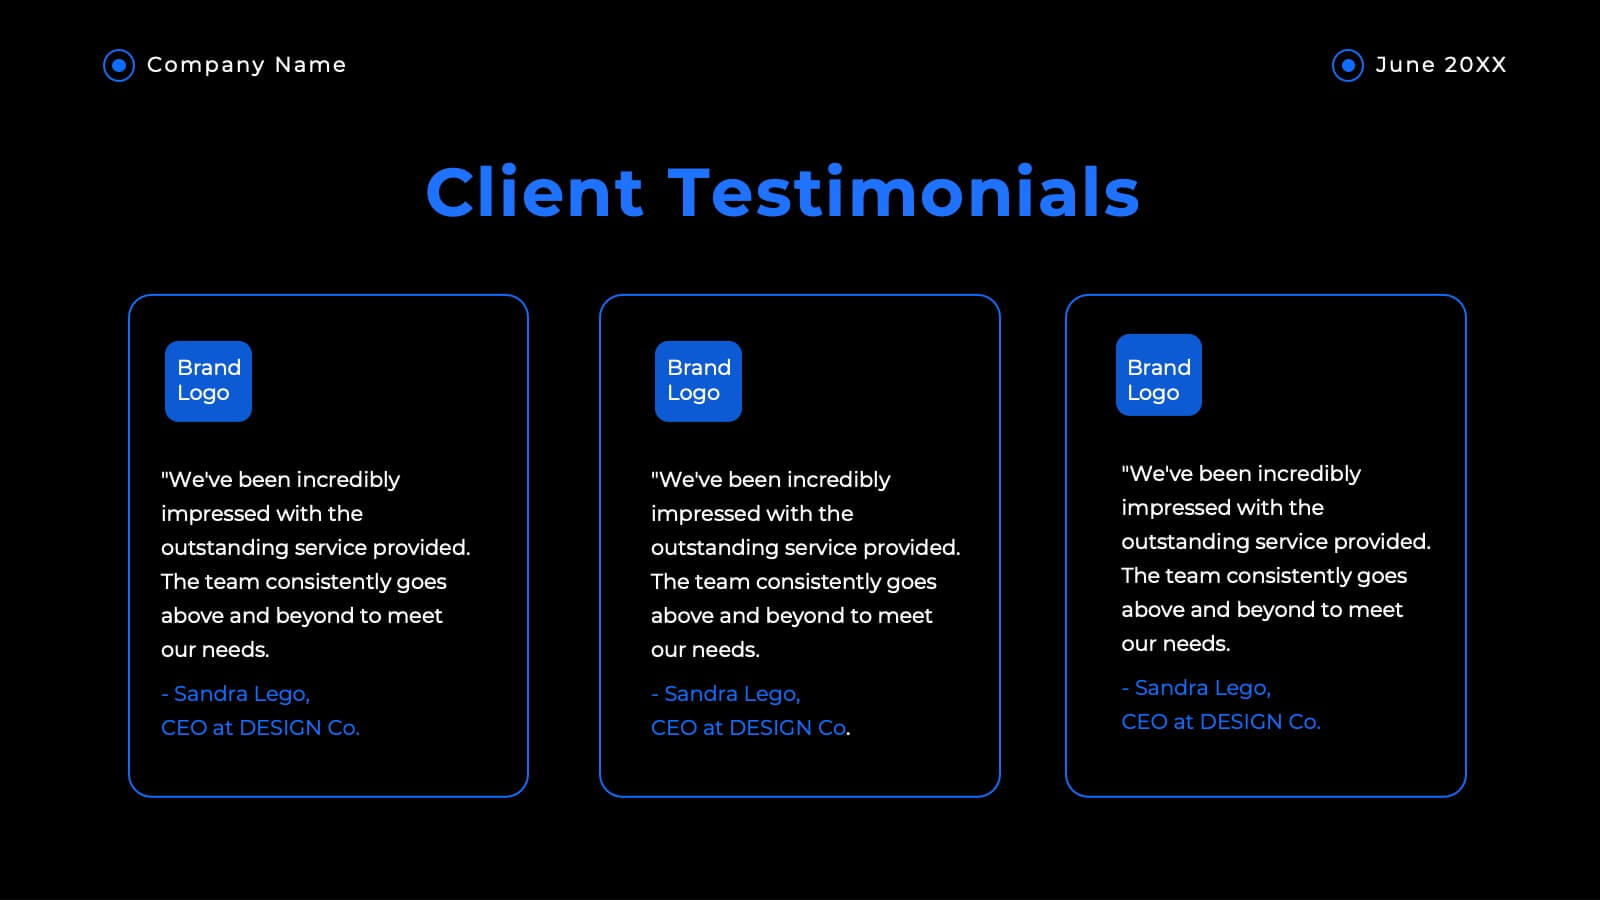
Key Points Overview Presentation
Bring your message to life with a slide that makes every key point feel clear, organized, and easy to follow. This presentation helps you highlight essential ideas, compare insights, and simplify complex information for any audience. Perfect for meetings, reports, or strategy updates. Fully compatible with PowerPoint, Keynote, and Google Slides.


5 slides
Rental Business Milestone Timeline Presentation
Showcase your company's growth journey with this clean Rental Business Milestone Timeline layout. Designed for tracking key achievements, it features a horizontal timeline with icons and customizable date markers. Perfect for business reviews or investor updates, it’s fully editable in PowerPoint, Keynote, and Google Slides for a professional presentation


3 slides
Decision-Making Bowtie Framework
Clarify choices and consequences with the Decision-Making Bowtie Framework Presentation. This slide design uses the bowtie model to organize factors before and after a decision, helping audiences visualize causes, potential outcomes, and risk management strategies. Ideal for leadership, business strategy, or operations meetings. Customize each side with key points, contributing factors, and mitigation actions. Includes editable labels, flexible layout options, and is fully compatible with PowerPoint, Keynote, and Google Slides.


7 slides
Human Resources Management Infographic Presentation
Human Resources are responsible for ensuring that an organization has the right people in the right roles, with the right skills and knowledge, to achieve its goals and objectives. This template is a great way to tell the story of your company and provide information about it. This template is compatible with Powerpoint, Keynote and Google Slides it includes 7 unique slides that are ready for you to design and customize with your own information, text and graphs. You can easily change the colors to your needs and add images. This is an informative way to highlight your business and its vision.


7 slides
Security Service Infographic Presentation
Security is the practice of protecting people, information, and assets from harm or damage. It is essential for compliance, business continuity, and protecting an organization's reputation. This template is designed to help you showcase or discuss security services, products or any other topic related to this. This template contains security graphics, and you can easily add your logo or icon to make the template more fun and eye catchy. This template allows you to customize the slides with any color scheme that suits your brand and communicate important features of your business.


5 slides
Technology Innovation Infographics
Technology innovation refers to the process of creating and introducing new or improved technologies that have the potential to bring about significant advancements in various industries and sectors. These vertical infographics explores the world of technology innovation and its impact on various industries. These templates are designed to showcase the latest advancements, emerging trends, and transformative technologies that are shaping our digital landscape. These enable you to showcase the transformative power of technology and inspire your audience to embrace the opportunities it presents.


7 slides
Academic Year Schedule and Class Structure Presentation
Organize your school week with clarity using the Academic Year Schedule and Class Structure Presentation. Perfect for teachers, school coordinators, and academic planners, this timetable slide helps map out subjects and activities across days and periods. Fully customizable in PowerPoint, Keynote, Google Slides, and Canva for seamless editing.


10 slides
Growth Strategy in Four Steps Presentation
Achieve sustainable business expansion with the Growth Strategy in Four Steps presentation. This structured template guides teams through progressive development phases, using clear visuals to illustrate key milestones and percentage-based improvements. Ideal for entrepreneurs, marketers, and business strategists, this slide layout is fully customizable and compatible with PowerPoint, Keynote, and Google Slides for seamless integration into your workflow.


5 slides
Importance of Sex Education Infographics
Sex Education is an important aspect of human development, but it can be a difficult topic to discuss. It is important for individuals to be knowledgeable about their own bodies and health, as well as understand healthy relationships and consent. These Infographics are visual tools designed to illustrate the need for sex education in schools and society. This template includes statistics, data, and facts about the benefits of sex education, including reducing the risk of sexually transmitted infections and unintended pregnancies, promoting healthy relationships, and empowering young people to make informed decisions about their sexual health.


7 slides
E-Learning Infographic Presentation Template
An E-learning Infographic is an informative design that shows all the different ways that e-learning can be used in your classroom, as well as the benefits associated with each one. This infographic illustrates the popularity of e-learning and gives tips for creating compelling learning materials. This template is equipped with all the resources needed to create your e-learning infographic. It comes fully customizable and ready-to-use. This Infographic template provides a bare-bone structure and design, leaving space for you to add your own content and create the best presentation!


6 slides
Business Value Chain Strategy Presentation
Optimize Business Processes with a Seamless Flow using this Business Value Chain Strategy presentation template. Designed to visualize key activities in a structured, interconnected format, this template helps highlight value-adding processes, strategic improvements, and operational efficiencies. Featuring a chain-linked design, dynamic colors, and customizable text placeholders, this template is perfect for business strategists, process analysts, and executive teams. Fully editable and compatible with PowerPoint, Keynote, and Google Slides, making it an essential tool for clear, impactful presentations.