


Features
- 2 Unique slides
- Fully editable and easy to edit in Microsoft Powerpoint, Keynote and Google Slides
- 16:9 widescreen layout
- Clean and professional designs
- Export to JPG, PDF or send by email


Do you have any questions?
Recommend


4 slides
Lean Agile Implementation Roadmap Presentation
Present your Lean Agile journey with this upward roadmap diagram. Designed for project managers and Agile teams, this layout visualizes four progressive stages using icons and curved arrows. Ideal for showcasing phased adoption, sprint milestones, or transformation goals. Fully customizable in PowerPoint, Keynote, and Google Slides for easy adaptation.


4 slides
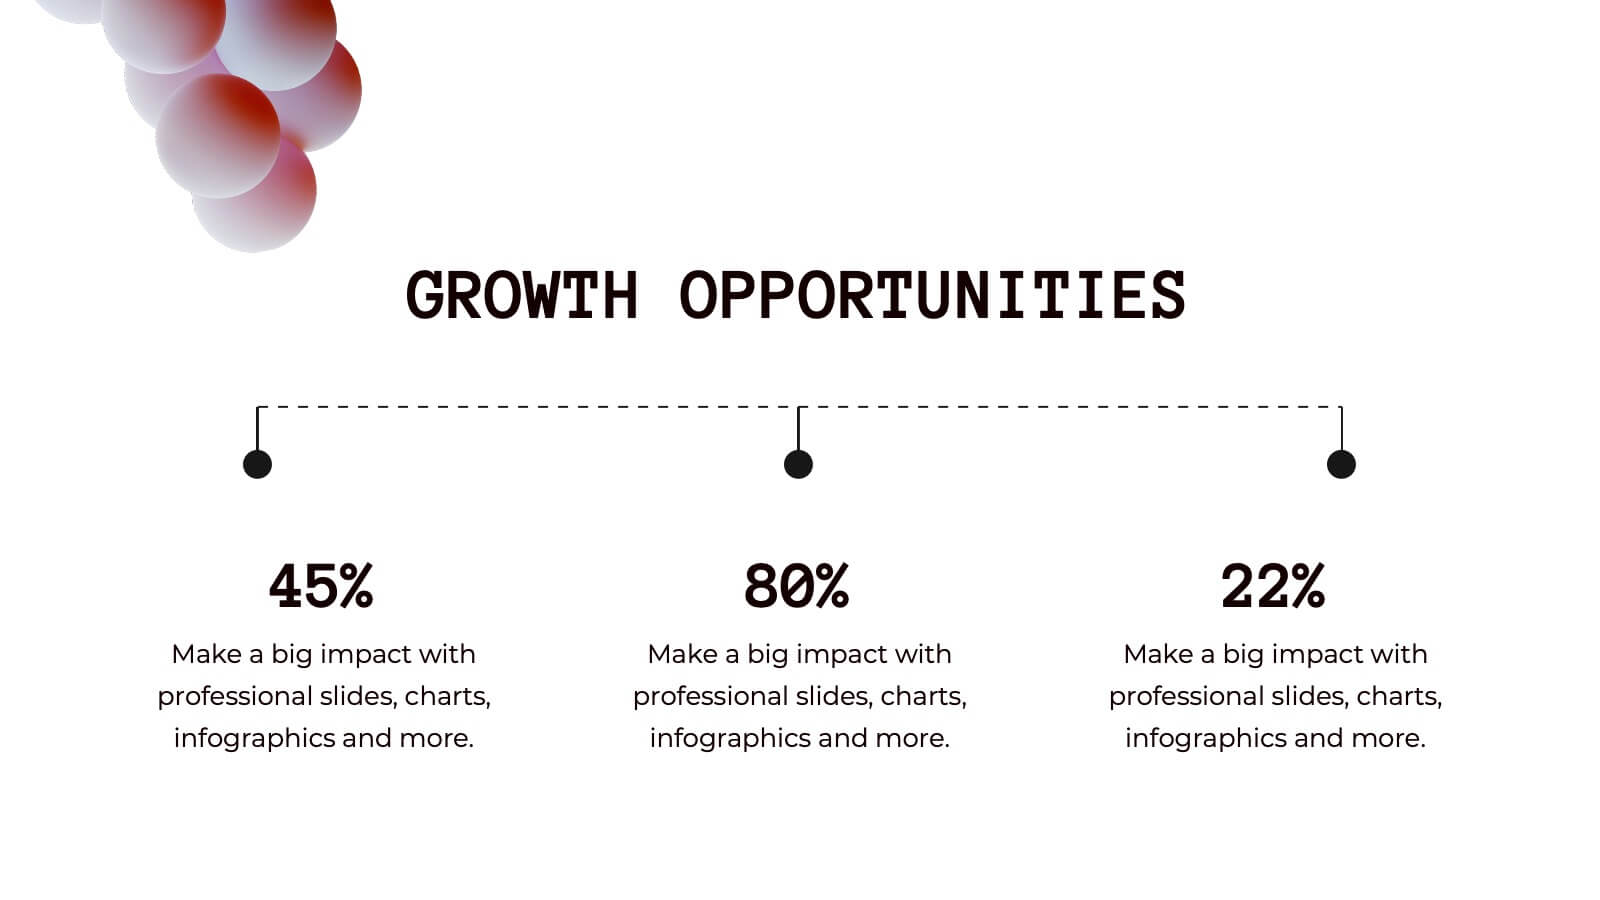
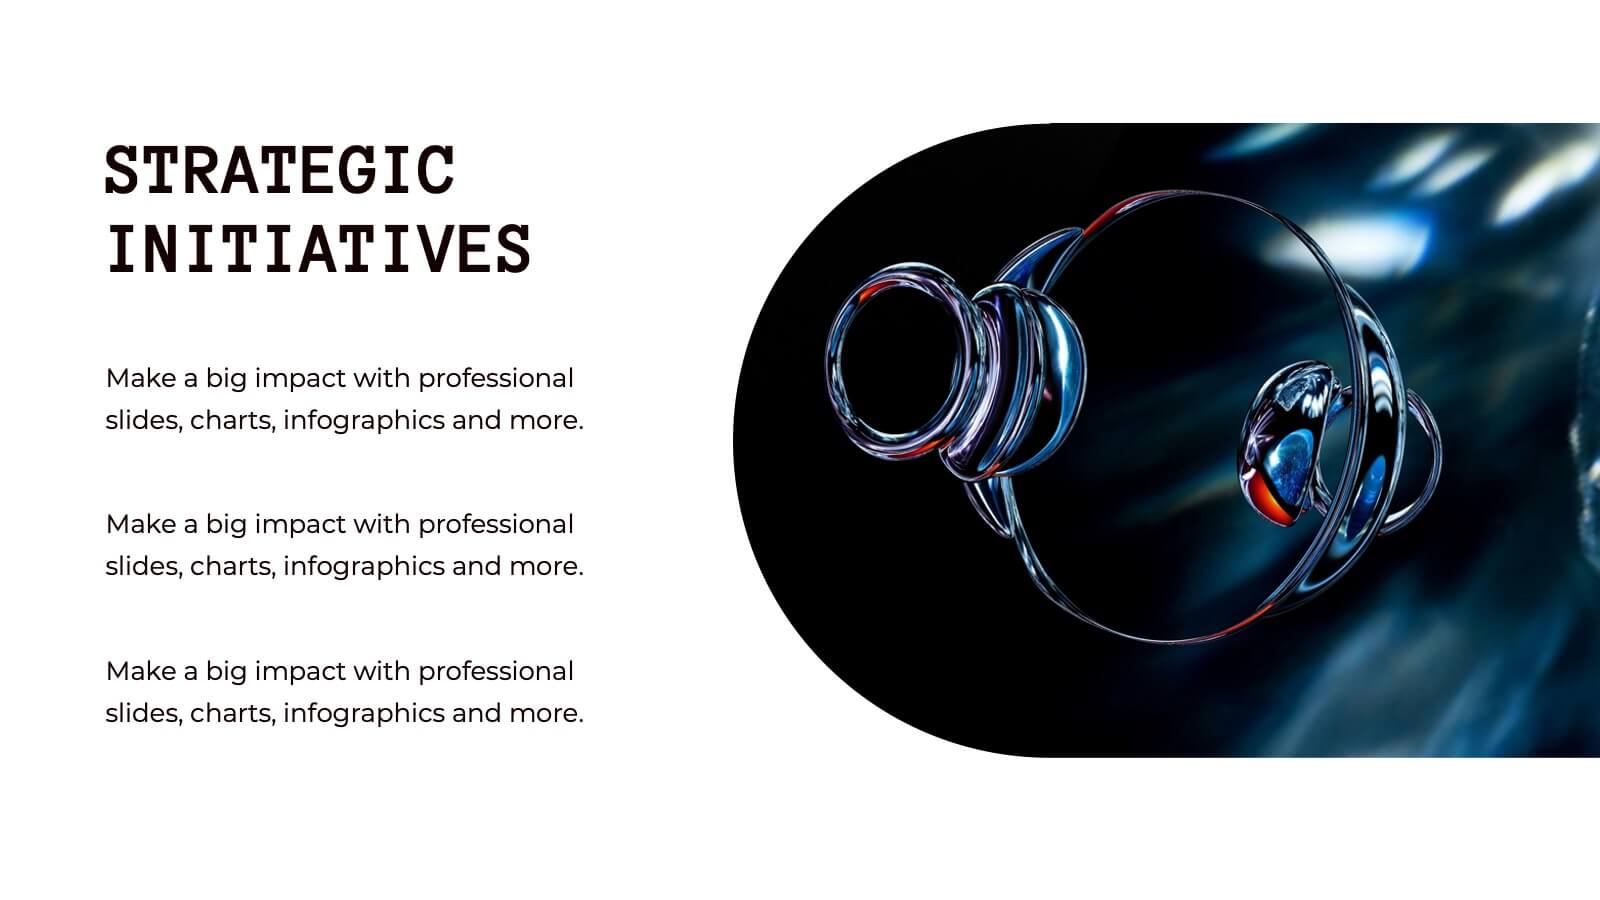
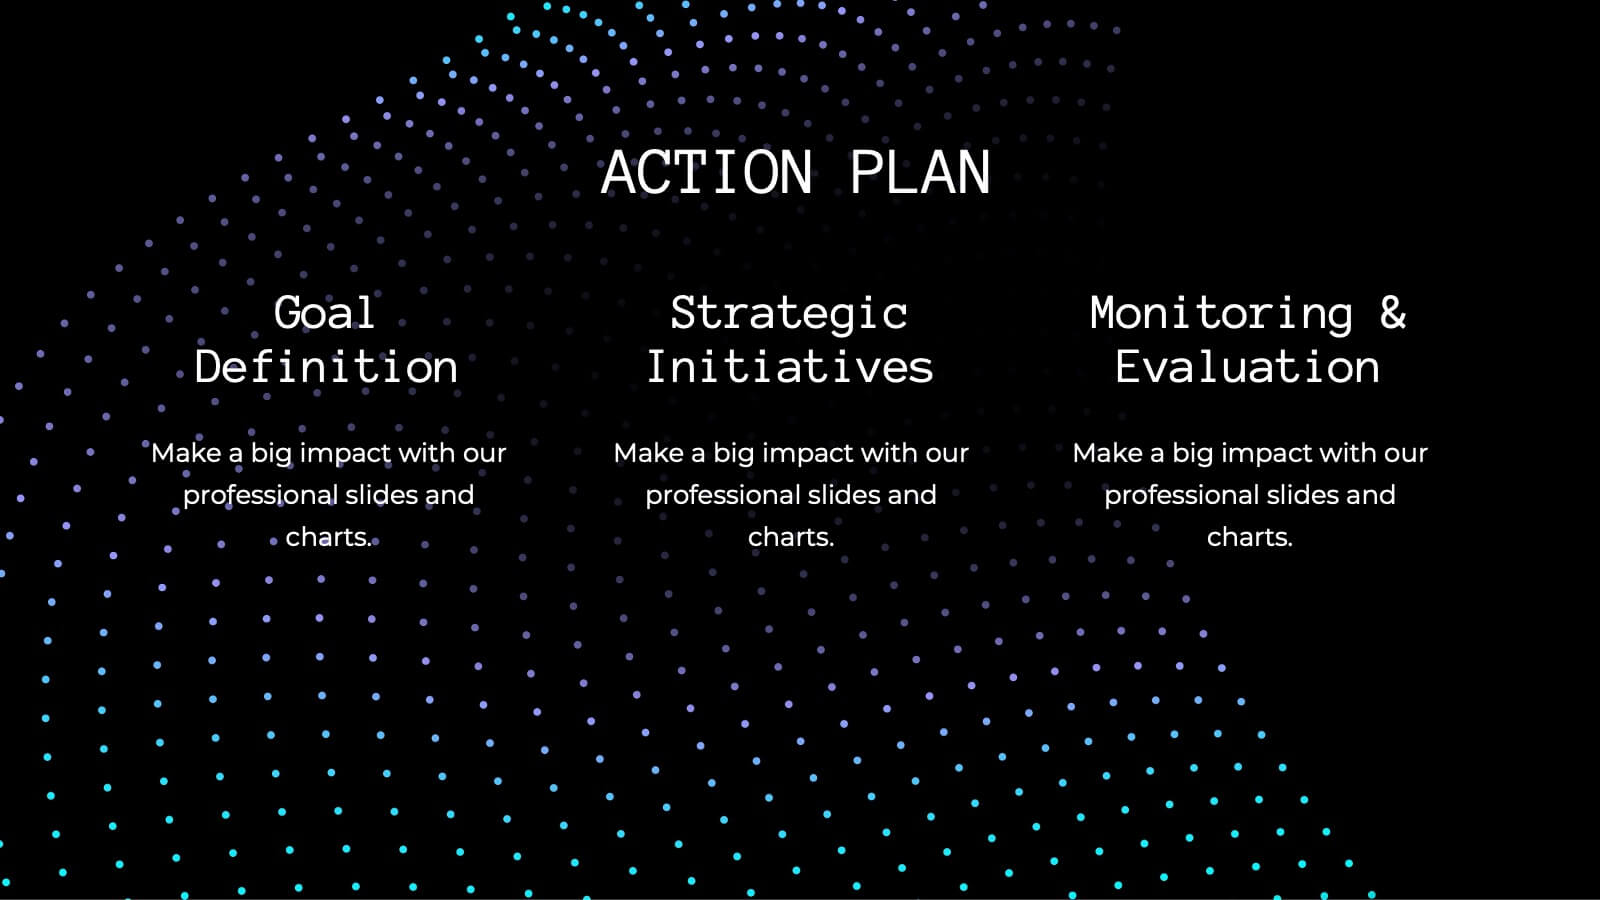
Business Growth and Strategy Plan Presentation
Showcase your company’s path forward with this Business Growth and Strategy Plan Presentation. Designed with a curved arrow layout, it visually maps out three key milestones or initiatives. Ideal for strategic roadmaps, planning sessions, or executive updates. Fully editable in Canva, PowerPoint, or Google Slides.


4 slides
Psychological Drivers in Consumer Behavior Presentation
Unlock deeper insights into buyer motivations with the Psychological Drivers in Consumer Behavior Presentation. This visually compelling template highlights four key drivers influencing decision-making, from logic to emotion. Perfect for marketing strategies, brand positioning, and behavioral research. Fully editable in Canva, PowerPoint, Google Slides, and Keynote.


15 slides
Business Infographic Presentation Template
A business is an organization engaged in commercial, industrial, or professional activities. A Business Infographic is a visual representation of information related to business topics like marketing, sales, finance, project management, customer service, and more. Using the graphics, charts, icons, and other design elements provided, create the best presentation. These infographics are usually used to help explain business concepts, show trends and results, and communicate information to employees, stakeholders, customers, and for students. Use this for presentations, reports and websites!


5 slides
Clear Strategy in Five Stages Presentation
Outline your strategic roadmap with this five-step cube staircase layout. Perfect for planning, growth tracking, or project milestones, each stage is color-coded with icons and numbered steps for clarity. Easy to edit in PowerPoint, Keynote, and Google Slides—ideal for business planning, strategy sessions, or performance reviews.


5 slides
5-Stage Growth Plan Presentation
Take your audience on a visual journey through each phase of success with this sleek step-by-step presentation. Designed to illustrate progress, milestones, and development stages clearly, it’s ideal for business planning or strategy discussions. Fully editable and compatible with PowerPoint, Keynote, and Google Slides for effortless customization.


5 slides
IT Operations Management
Illustrate complex workflows with this gear-themed infographic designed for IT operations management. Each gear represents a key step or stage, perfect for showcasing interconnected processes, system automation, or IT service flow. Easy to customize in PowerPoint, Keynote, and Google Slides. Clean, professional layout with space for icons and concise text.


5 slides
Visual Gap Analysis Between Goals and Results Presentation
Hit the bullseye by clearly showing the gap between what was planned and what was achieved. This sleek, target-based presentation design helps visualize discrepancies between goals and results in a way that's easy to grasp and great for decision-making. Fully compatible with PowerPoint, Keynote, and Google Slides.


4 slides
Startup Investor Pitch Deck
Command investor attention with this dynamic Startup Pitch Deck slide. Featuring bold metrics, sleek data visualizations, and clean typography, it's designed to highlight growth and business potential. Fully editable in PowerPoint, Keynote, and Google Slides—ideal for tech, finance, and innovation-driven startups.


6 slides
IT Architecture System Infographic
IT architecture, referred to as information technology architecture, is a structured framework that defines how an organization's technology systems, applications, processes, and data interact and work together to support its business goals and objectives. This infographic template visually explains the components and structure of an IT architecture system within an organization. The visuals are included to simplify your technical concepts and guide your viewers through the intricacies of IT. This infographic can be customized to fit the specific needs of different organizations. Compatible with Powerpoint, Keynote, and Google Slides.


7 slides
Cloud Architecture Infographic
Cloud technology is reshaping the digital landscape, and understanding its architecture is paramount. Dive into the intricacies of cloud systems with our cloud architecture infographic, crafted in a crisp white and serene blue palette. This visual tool demystifies the layers and components that constitute cloud frameworks. IT professionals, enterprise architects, and business decision-makers will greatly benefit from this structured depiction. Fully tailored for a smooth experience on PowerPoint, Keynote, and Google Slides, this infographic serves as a cornerstone for all looking to harness the potentials of cloud infrastructure.


6 slides
School Goals and Administration Presentation
Visualize key academic priorities with this notebook-style layout, perfect for school administrators and teachers. Featuring colorful pushpin markers and a two-page spread, this template is great for outlining goals, responsibilities, or class guidelines. Fully editable in PowerPoint, Keynote, and Google Slides for customized, classroom-ready presentations.


5 slides
Editable Mind Mapping Presentation
Clarify complex thoughts with the Editable Mind Mapping Presentation. This sleek template features a central profile design with five branching points to visualize ideas, processes, or strategies. It's perfect for brainstorming sessions, team collaboration, or project planning. Fully customizable and compatible with PowerPoint, Keynote, and Google Slides.


6 slides
Property Investment Analysis Presentation
Evaluate Property Investment Analysis with this insightful presentation template. Perfect for real estate investors, financial analysts, and property managers, it features key factors, risk assessments, and investment opportunities in a visually structured format. Fully editable and compatible with PowerPoint, Keynote, and Google Slides for seamless customization.


8 slides
30-60-90 Day Business Plan Presentation
Set clear goals and track progress effortlessly with this 30-60-90 day business plan template! Designed for professionals, managers, and entrepreneurs, this structured layout helps outline priorities, set milestones, and ensure a smooth transition from planning to execution. Fully customizable and compatible with PowerPoint, Keynote, and Google Slides for seamless presentations.

21 slides
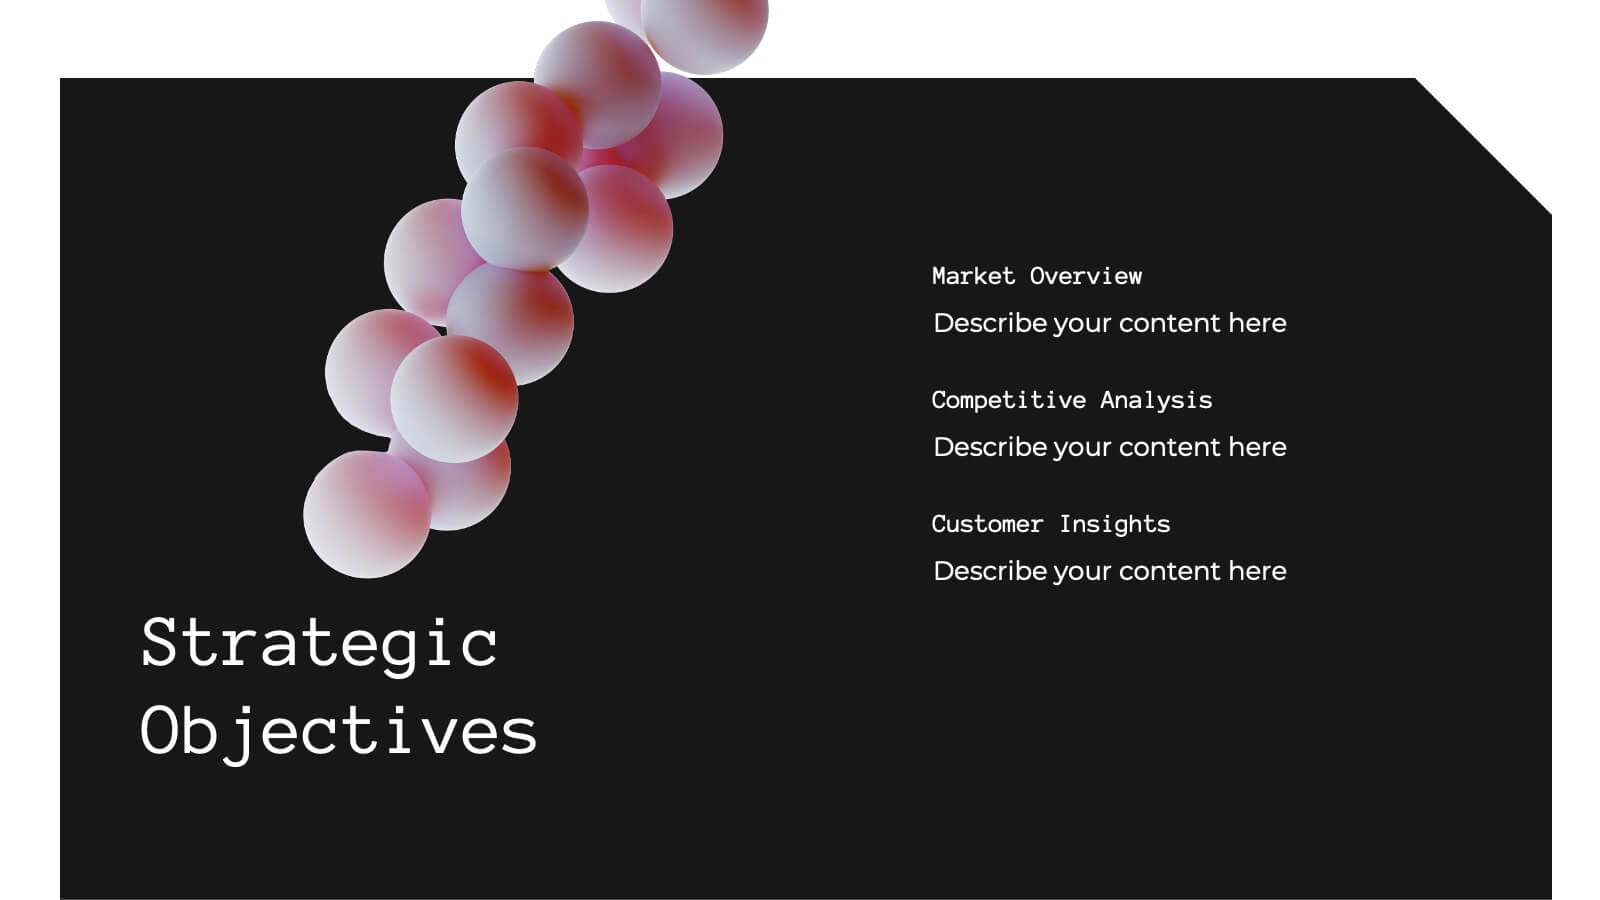
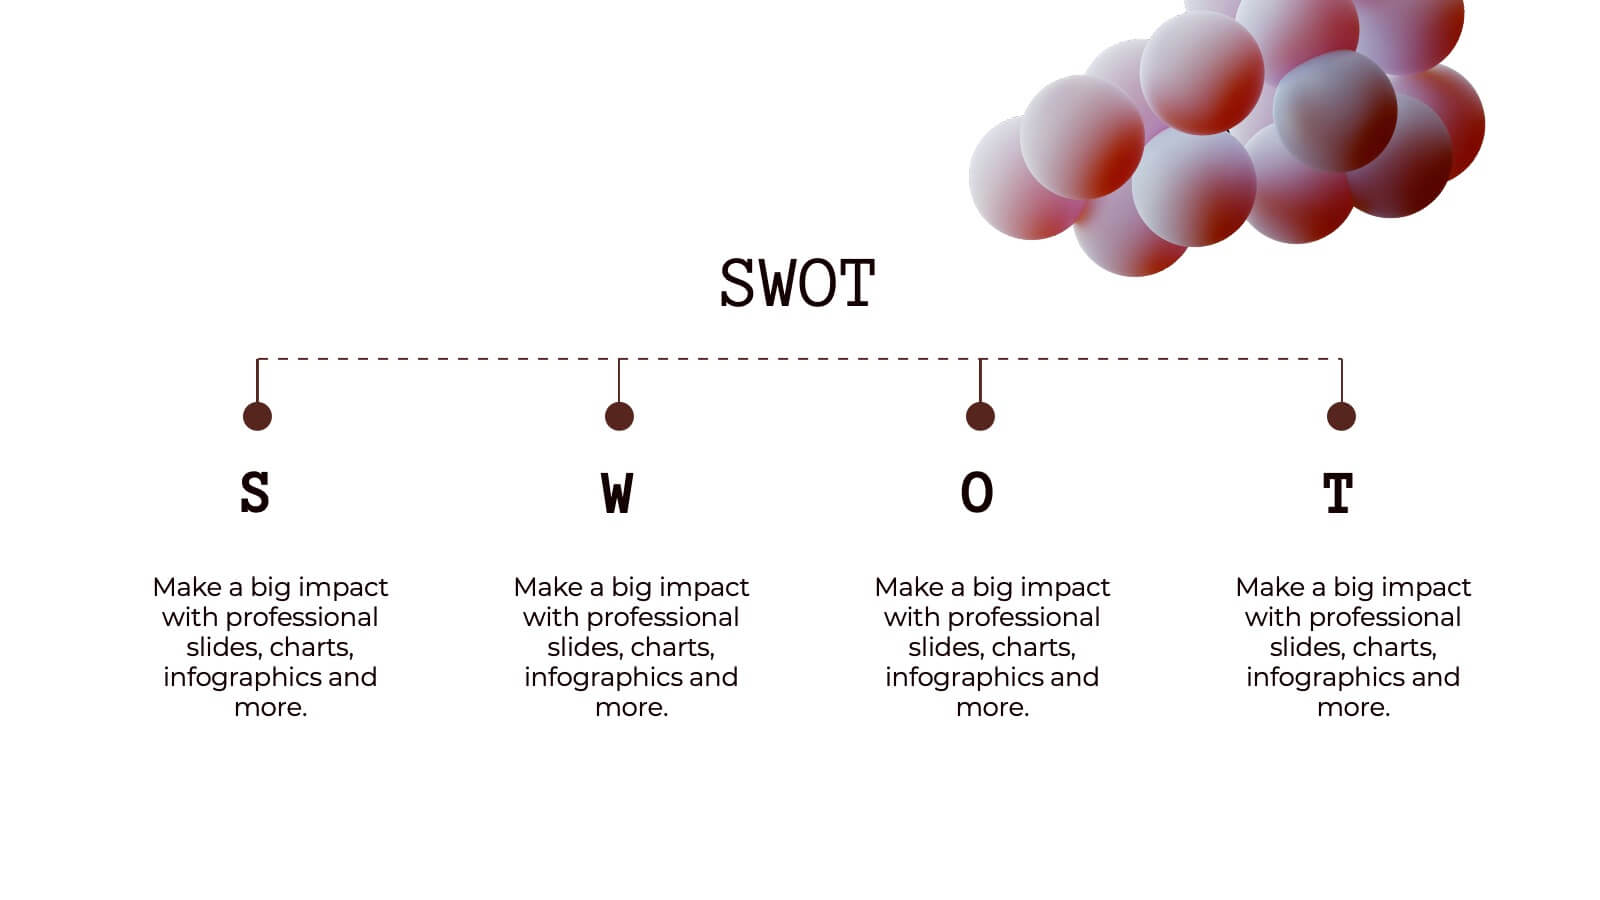
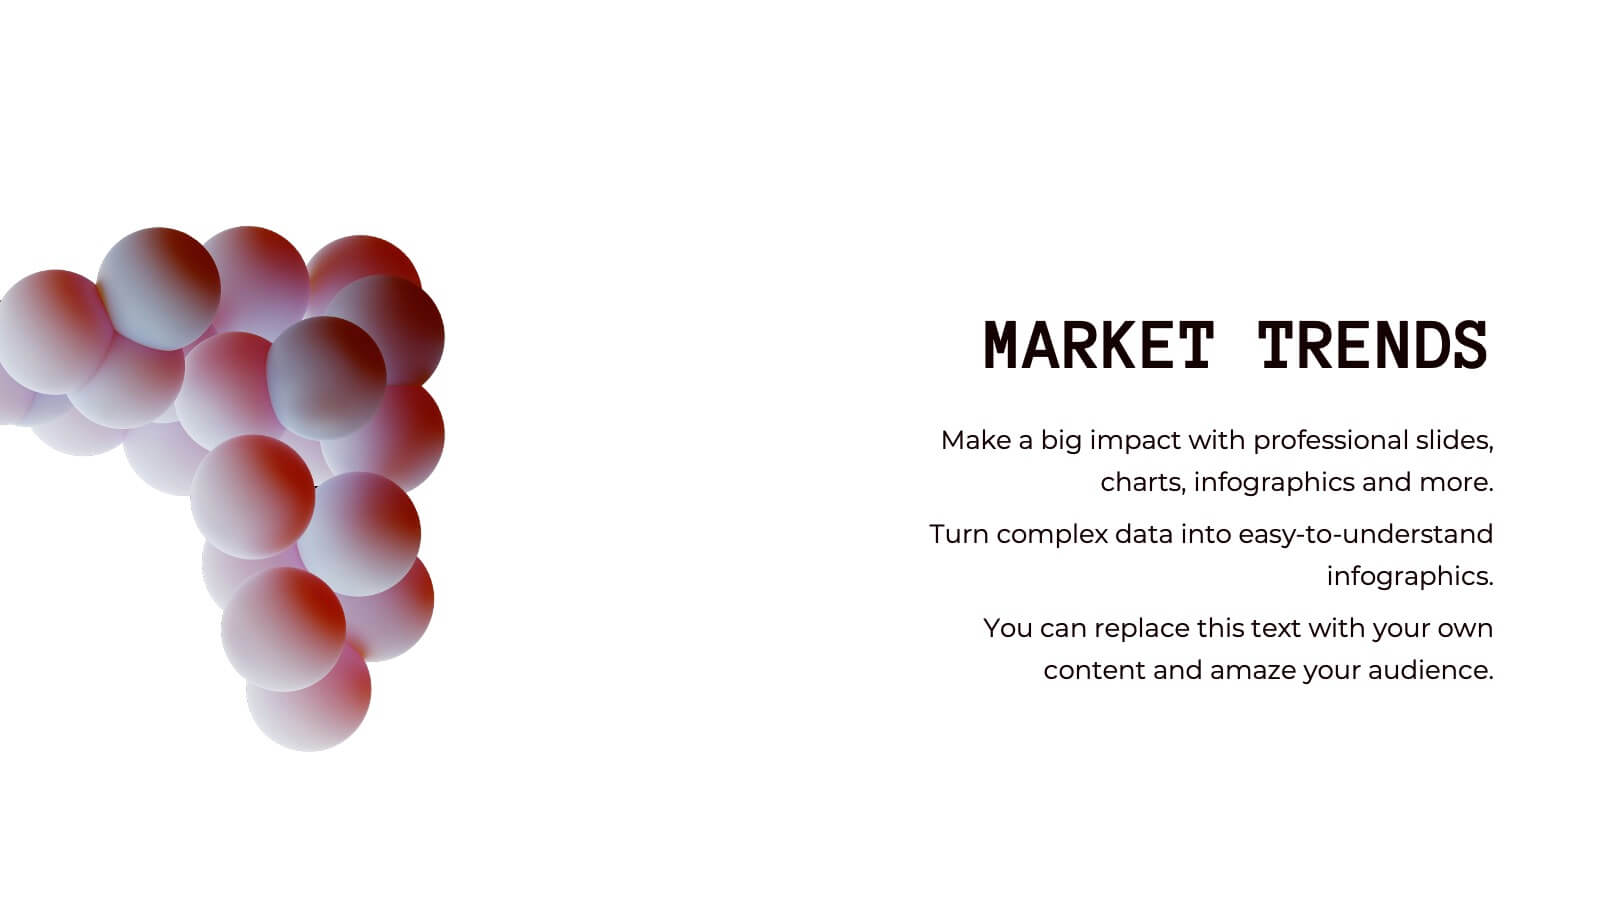
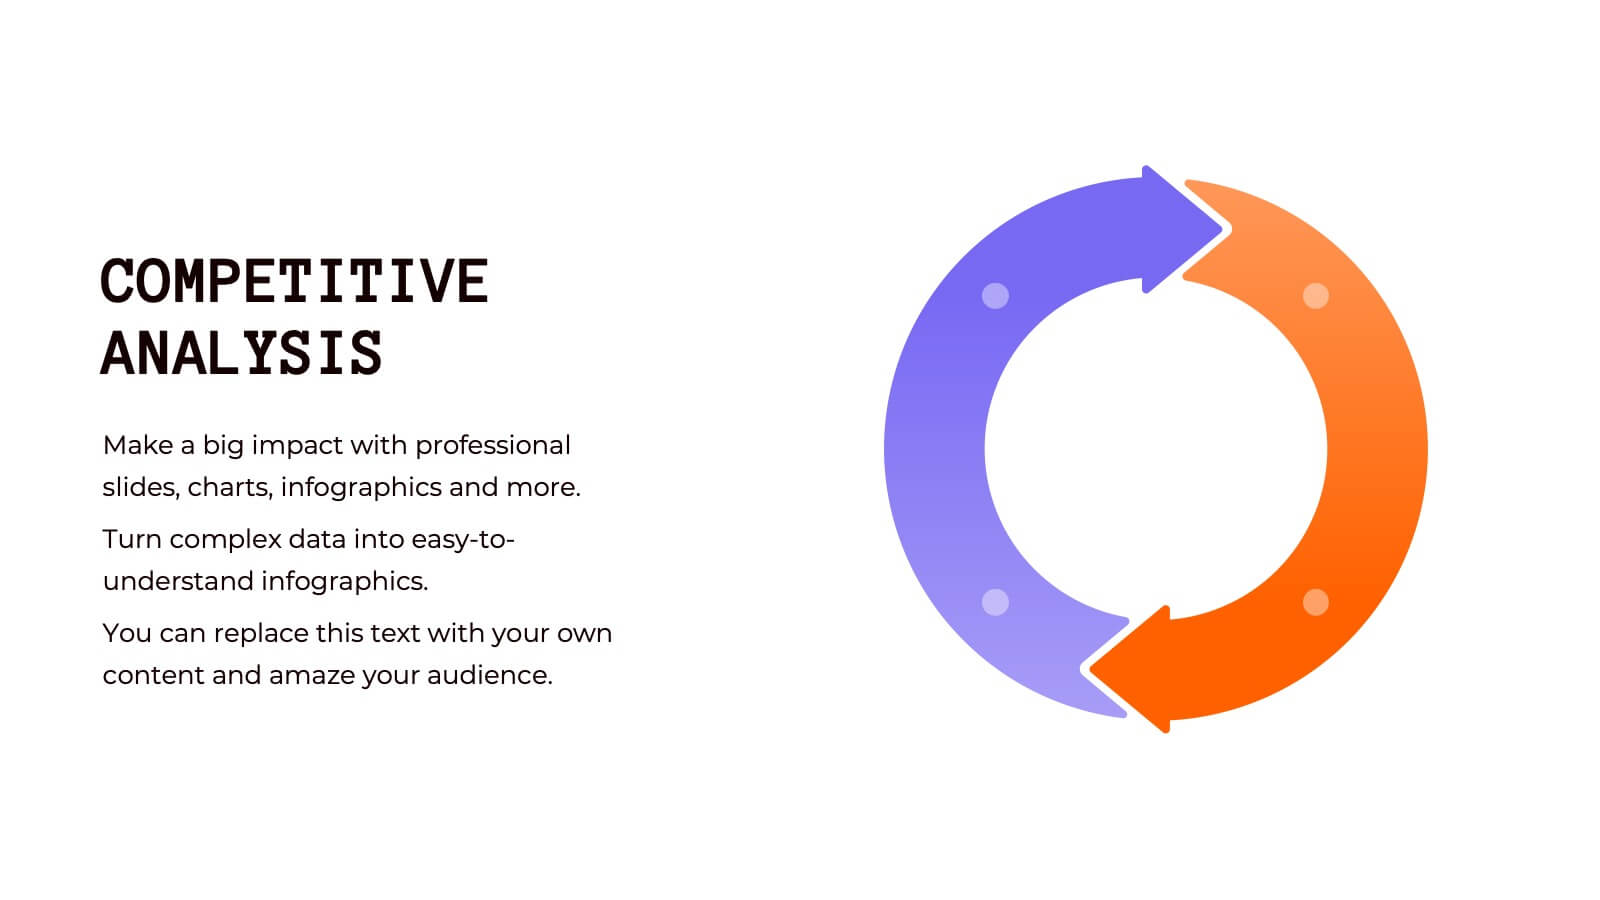
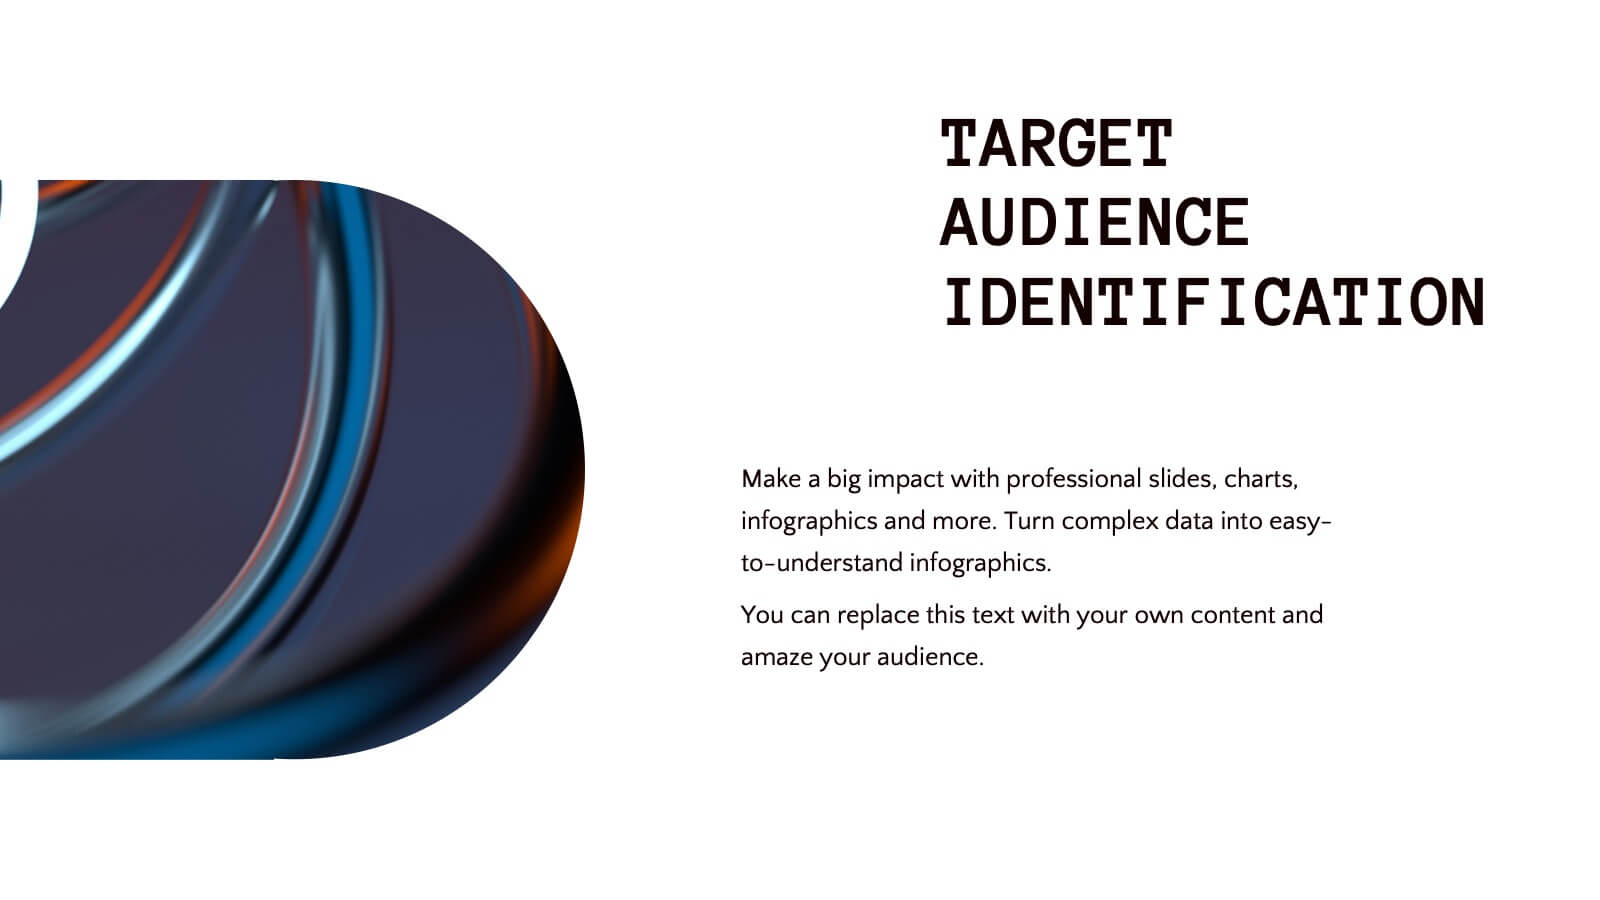
Mermaid Corporate Strategy Proposal Presentation
Present your corporate strategy with confidence using this sleek, modern proposal template! It covers strategic objectives, market trends, SWOT analysis, and resource allocation, ensuring a comprehensive overview of your plan. Fully customizable and compatible with PowerPoint, Keynote, and Google Slides, this template is ideal for launching new initiatives and achieving business goals.


5 slides
Natural Disasters in the World Infographics
Natural Disasters are catastrophic events that occur as a result of natural processes or phenomena, and they can have severe impacts on human life, property, and the environment. These infographics are visually striking presentation templates that highlight various types of natural disasters that occur worldwide. It provides an overview of the most common natural disasters, their causes, and their impact on the environment and human lives. It is suitable for educational presentations, environmental discussions, disaster preparedness campaigns, and any other context where understanding natural disasters is essential.