


Features
- 6 Unique slides
- Fully editable and easy to edit in Microsoft Powerpoint, Keynote and Google Slides
- 16:9 widescreen layout
- Clean and professional designs
- Export to JPG, PDF or send by email


Do you have any questions?
Recommend


6 slides
Oceania Language Map Infographic
Oceania encompasses the entirety of the Pacific Ocean and its islands. Embark on an enlightening journey through the linguistic tapestry of Oceania with our captivating Oceania Language Map Infographic. This template is your guide to understanding the rich array of languages spoken across this diverse and cultural region. Compatible with Powerpoint, Keynote, and Google Slides. This allows you to incorporate a vibrant and culturally symbolic color palette reflecting the diversity of Oceania. Utilize icons representing different languages for a visually appealing representation.


4 slides
Business Milestone Roadmap Presentation
Visualize your company's journey with this curved-road milestone infographic. Perfect for tracking key goals, quarterly achievements, or strategic plans, this template uses clear markers along a winding path to emphasize progress and direction. Ideal for business updates, project timelines, or growth strategies. Fully editable in PowerPoint, Keynote, and Google Slides.


10 slides
Checklist and Action Plan List Presentation
Stay organized and achieve goals efficiently with this checklist and action plan template. Designed for task tracking, project management, and strategic planning, it provides a clear visual structure for prioritizing tasks. Perfect for professionals and teams aiming for productivity. Compatible with PowerPoint, Keynote, and Google Slides for seamless editing and presentation.


7 slides
Competitive Advantage Through Value Chain
Make your value chain comparison stand out with this bold, visual slide that maps two sides head-to-head. Perfect for highlighting competitive advantages, strategic differences, and operational gaps. This template is clear, customizable, and ready to plug into PowerPoint, Keynote, or Google Slides.


10 slides
Startup Pitch Deck Presentation
Make your big idea impossible to ignore with a sleek, investor-ready design that tells your startup’s story with clarity and confidence. This presentation helps you outline your vision, market potential, and business strategy in a compelling way. Fully compatible with PowerPoint, Keynote, and Google Slides for effortless customization.


5 slides
Mental Health Counseling Infographics
Mental health counseling is a form of therapy that focuses on helping individuals improve their mental and emotional well-being. These infographic templates are designed to raise awareness about mental health counseling and its benefits. This aims to educate and inform individuals about the importance of seeking professional help for mental health concerns and highlights the various aspects of mental health counseling. Use these to present your next educational presentation on mental health or online platforms, this provides essential information and visual aids to encourage the benefits of seeking counseling.


6 slides
Data Table Format Presentation
Bring clarity to your data with a clean, modern layout that helps your audience compare details at a glance. This presentation is perfect for pricing, feature breakdowns, or structured business insights, keeping information organized and easy to read. Fully compatible with PowerPoint, Keynote, and Google Slides.
26 slides
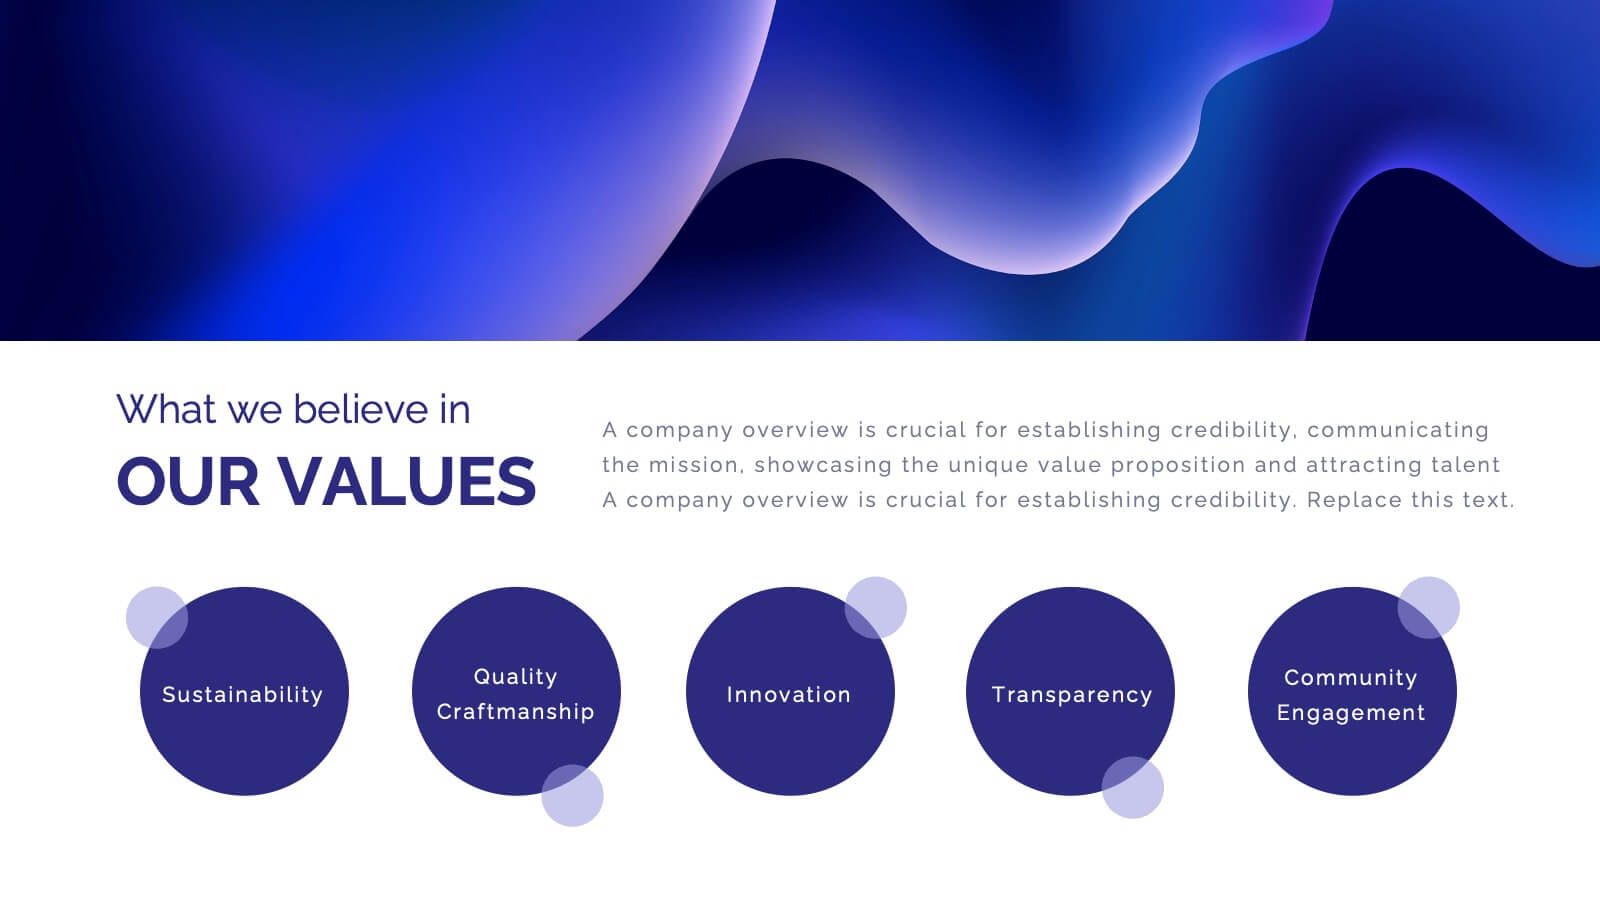
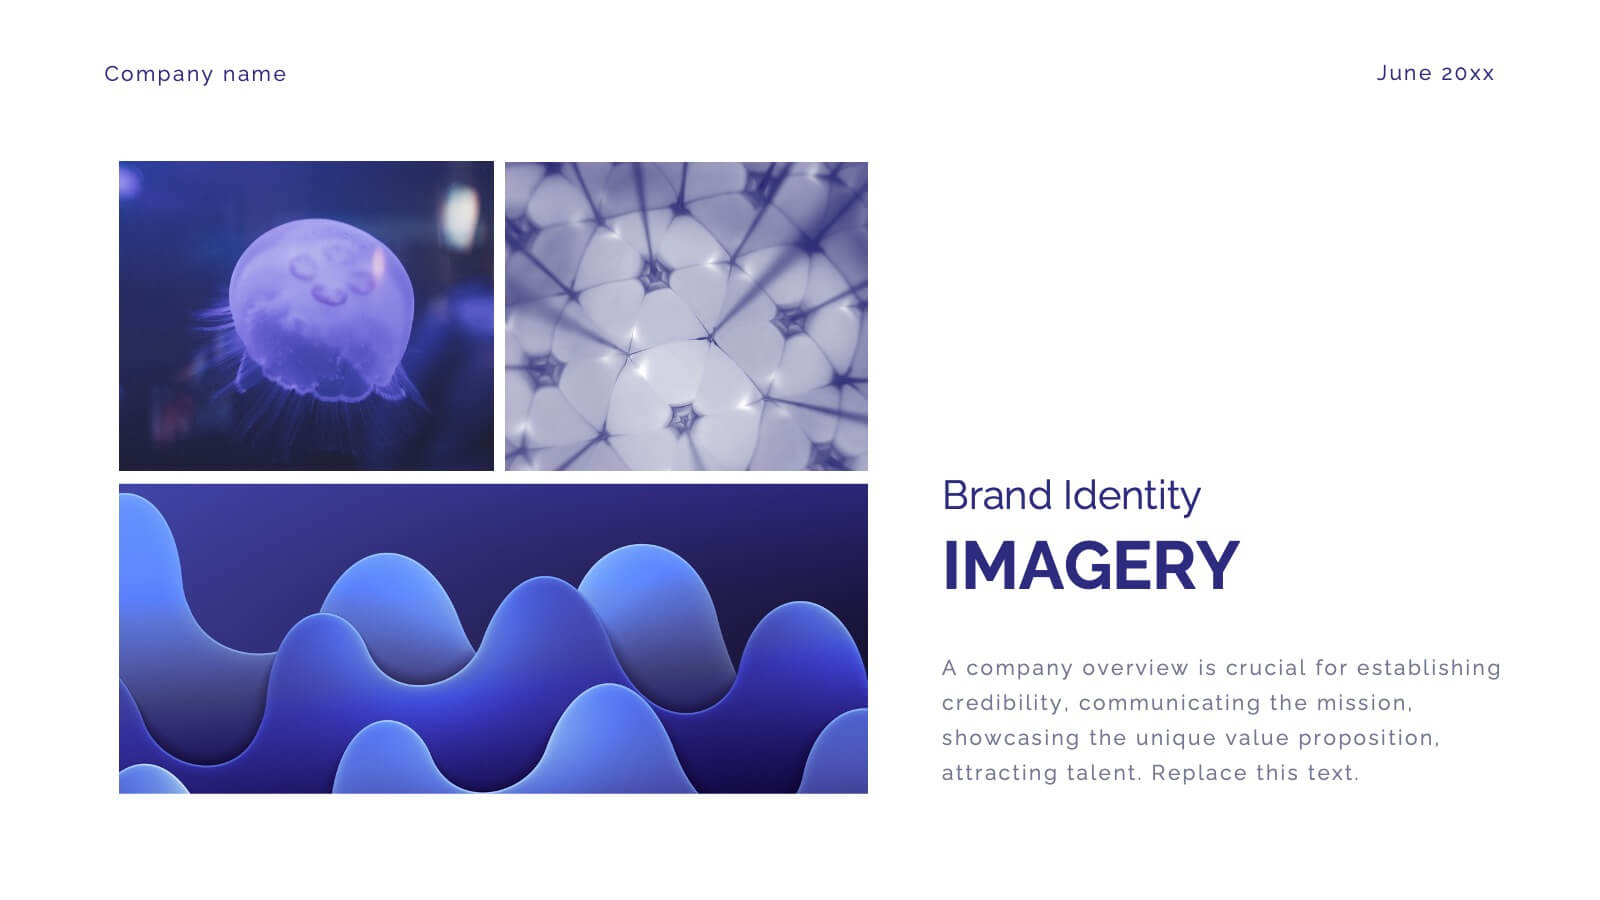
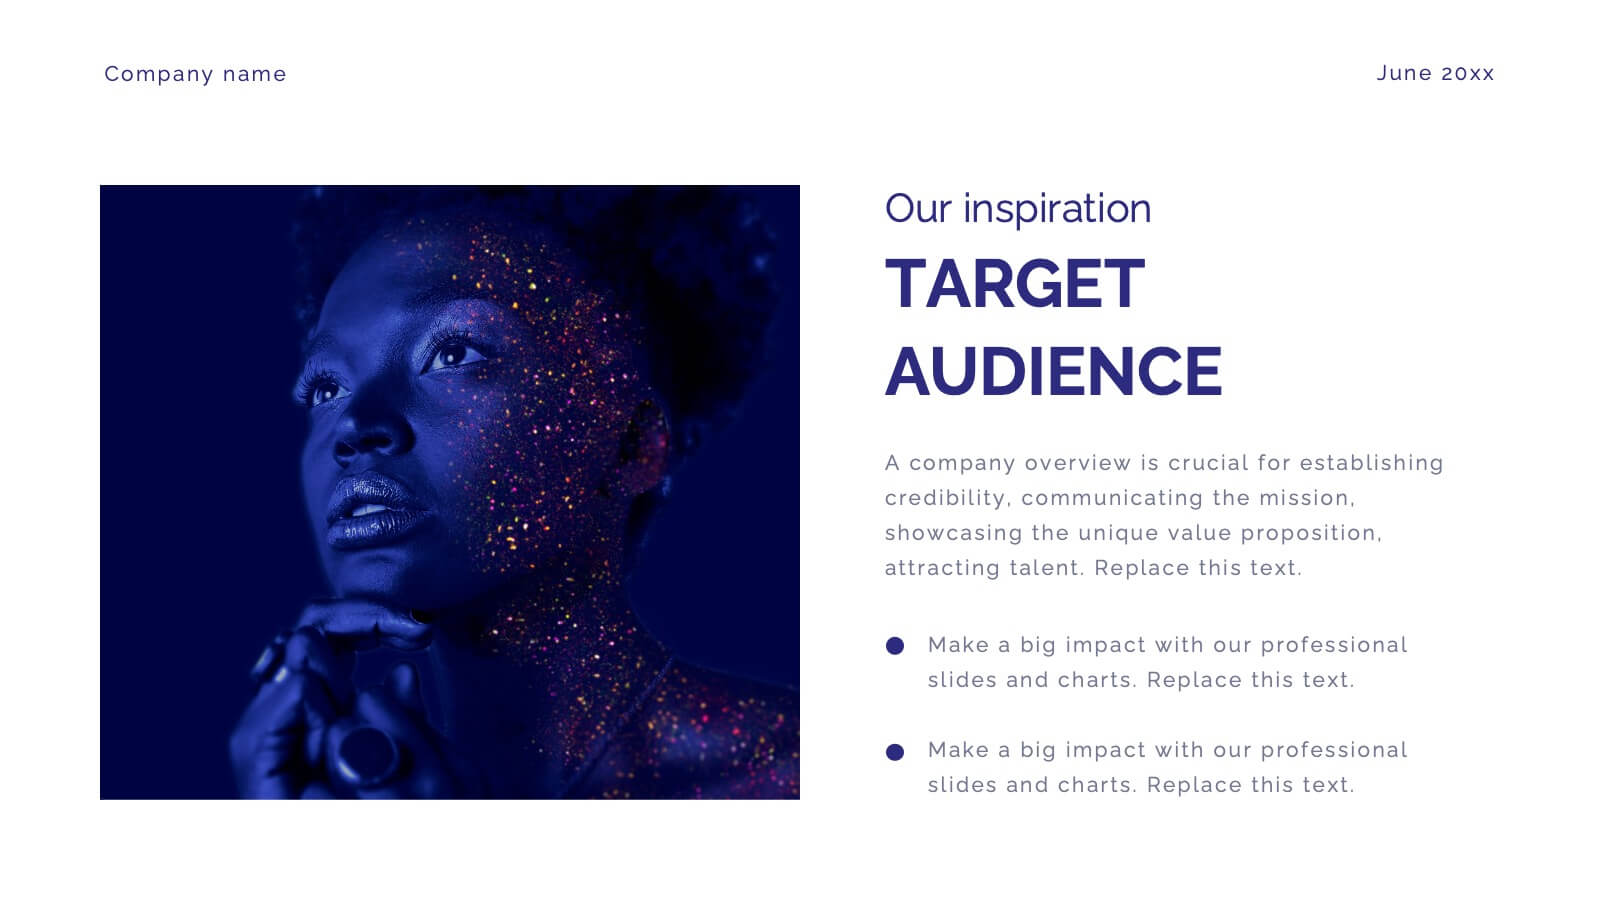
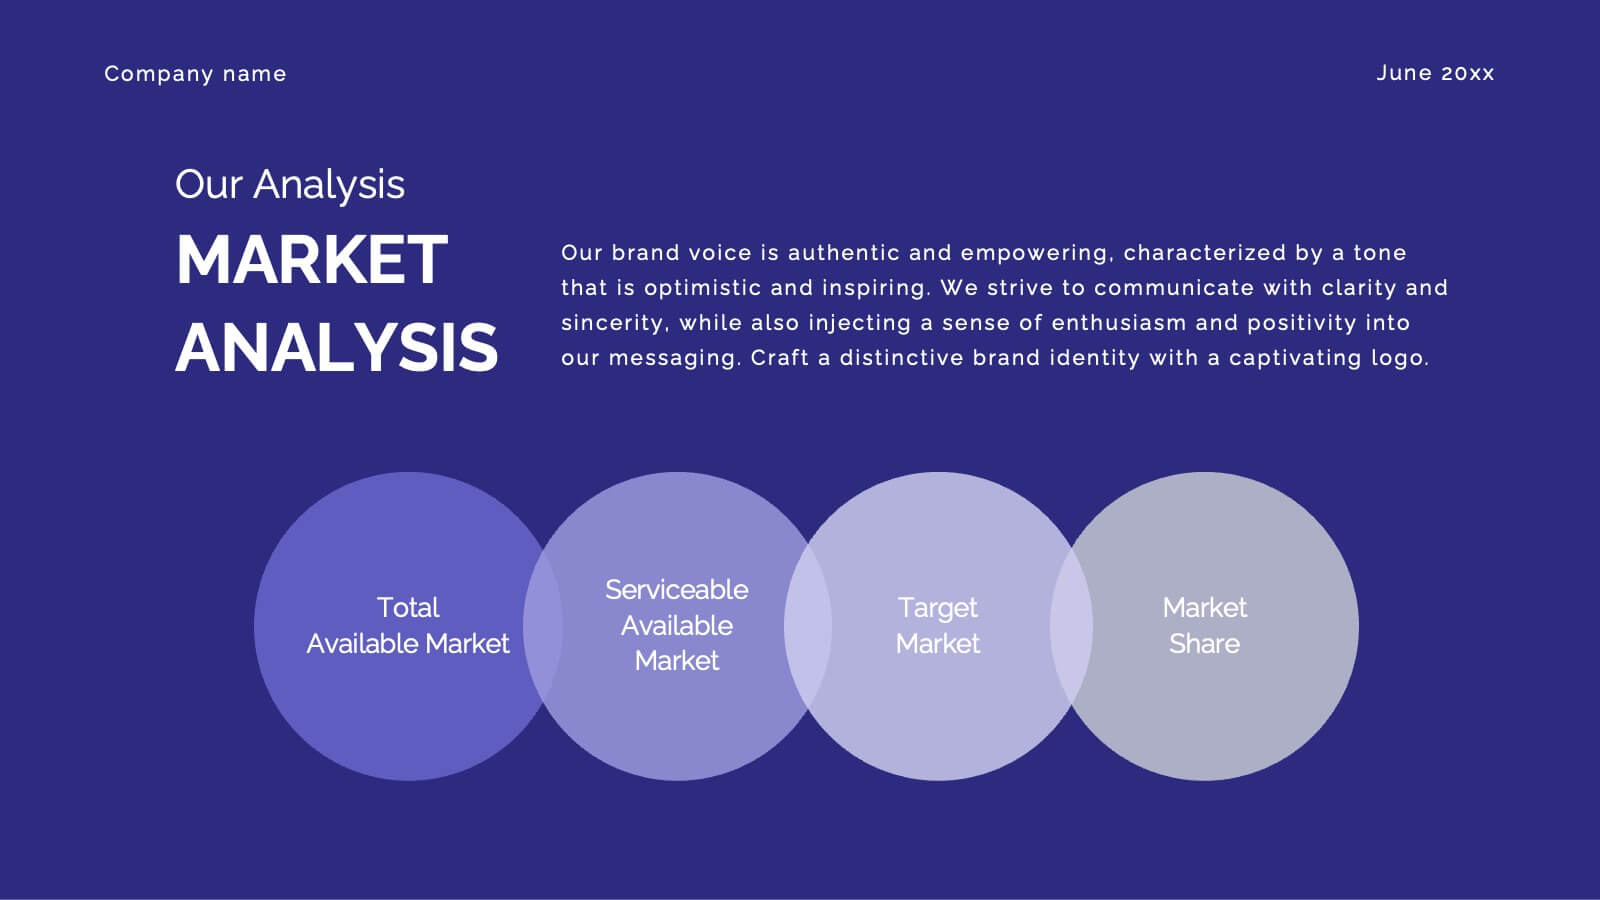
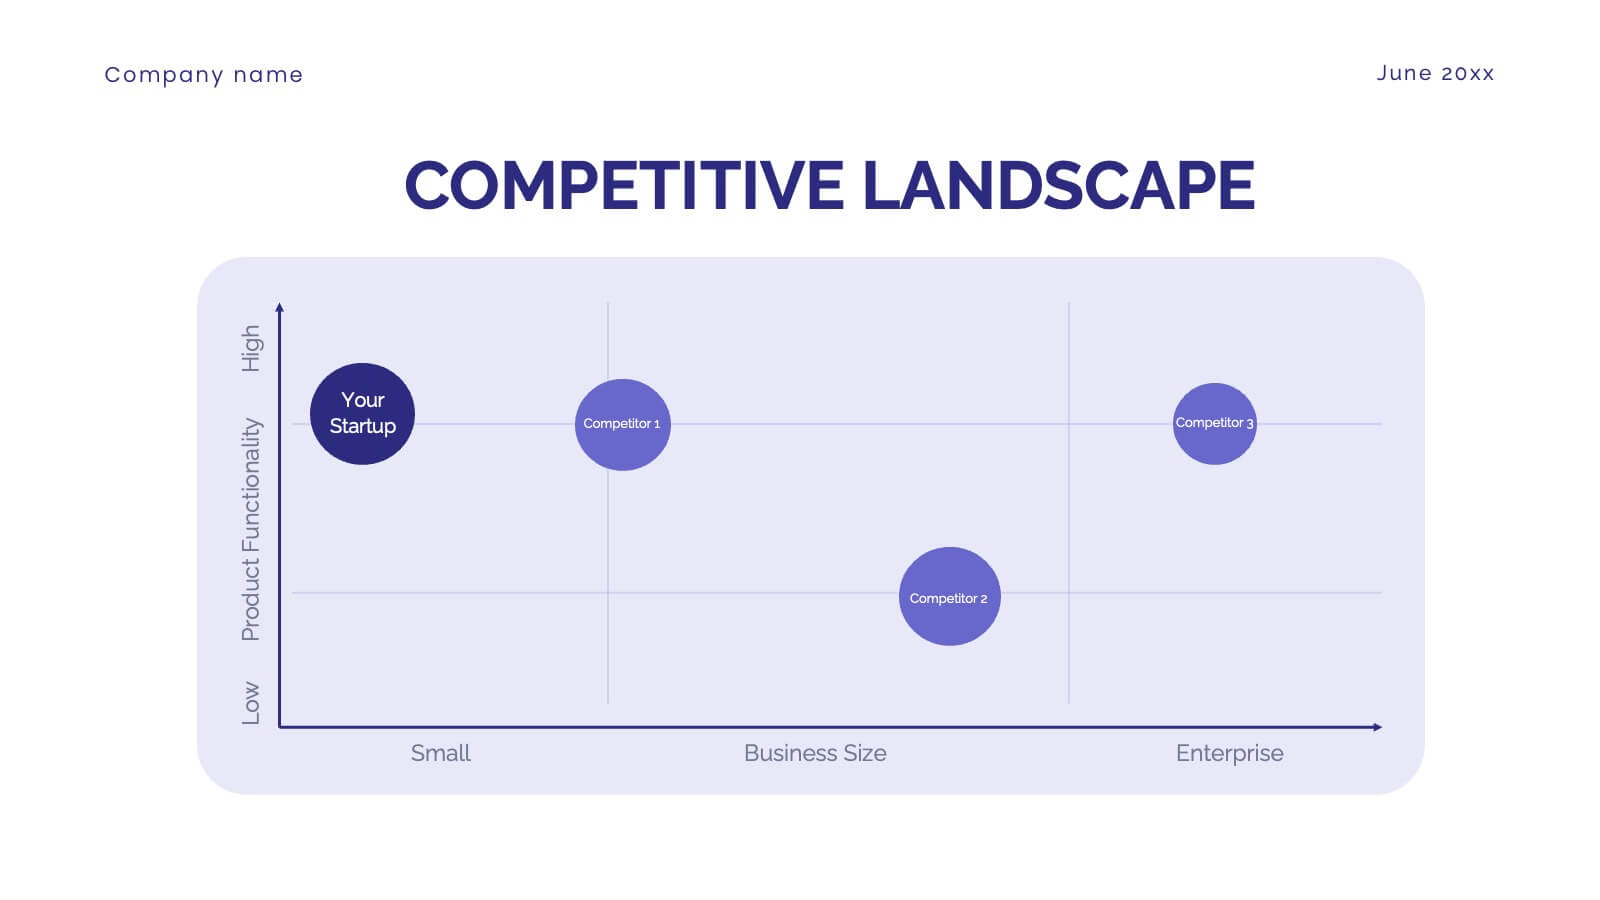
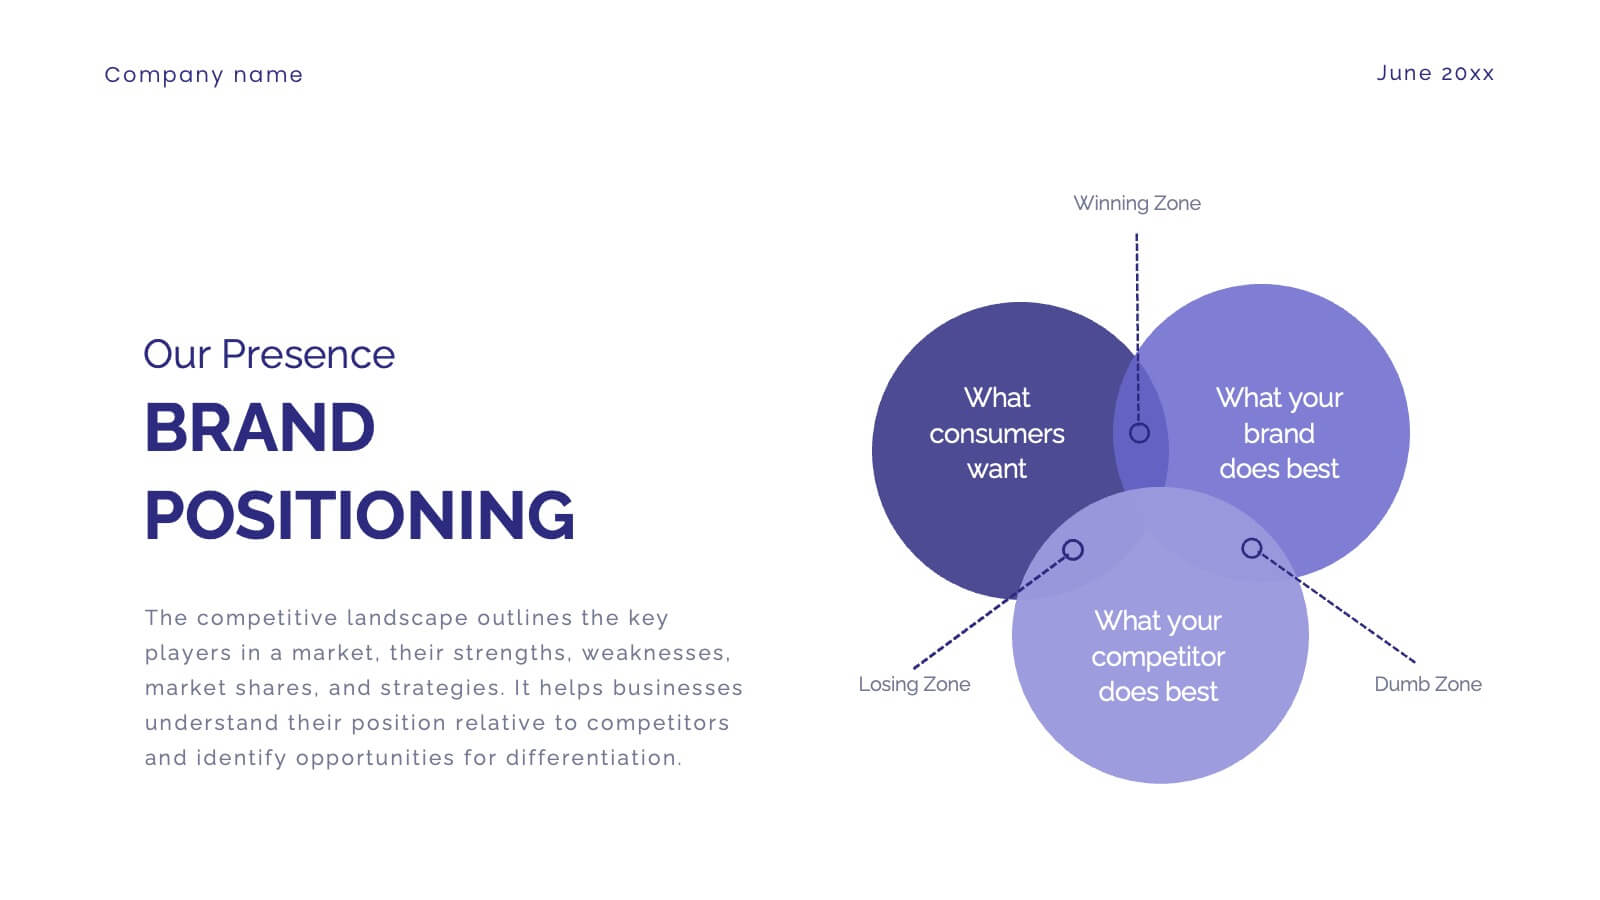
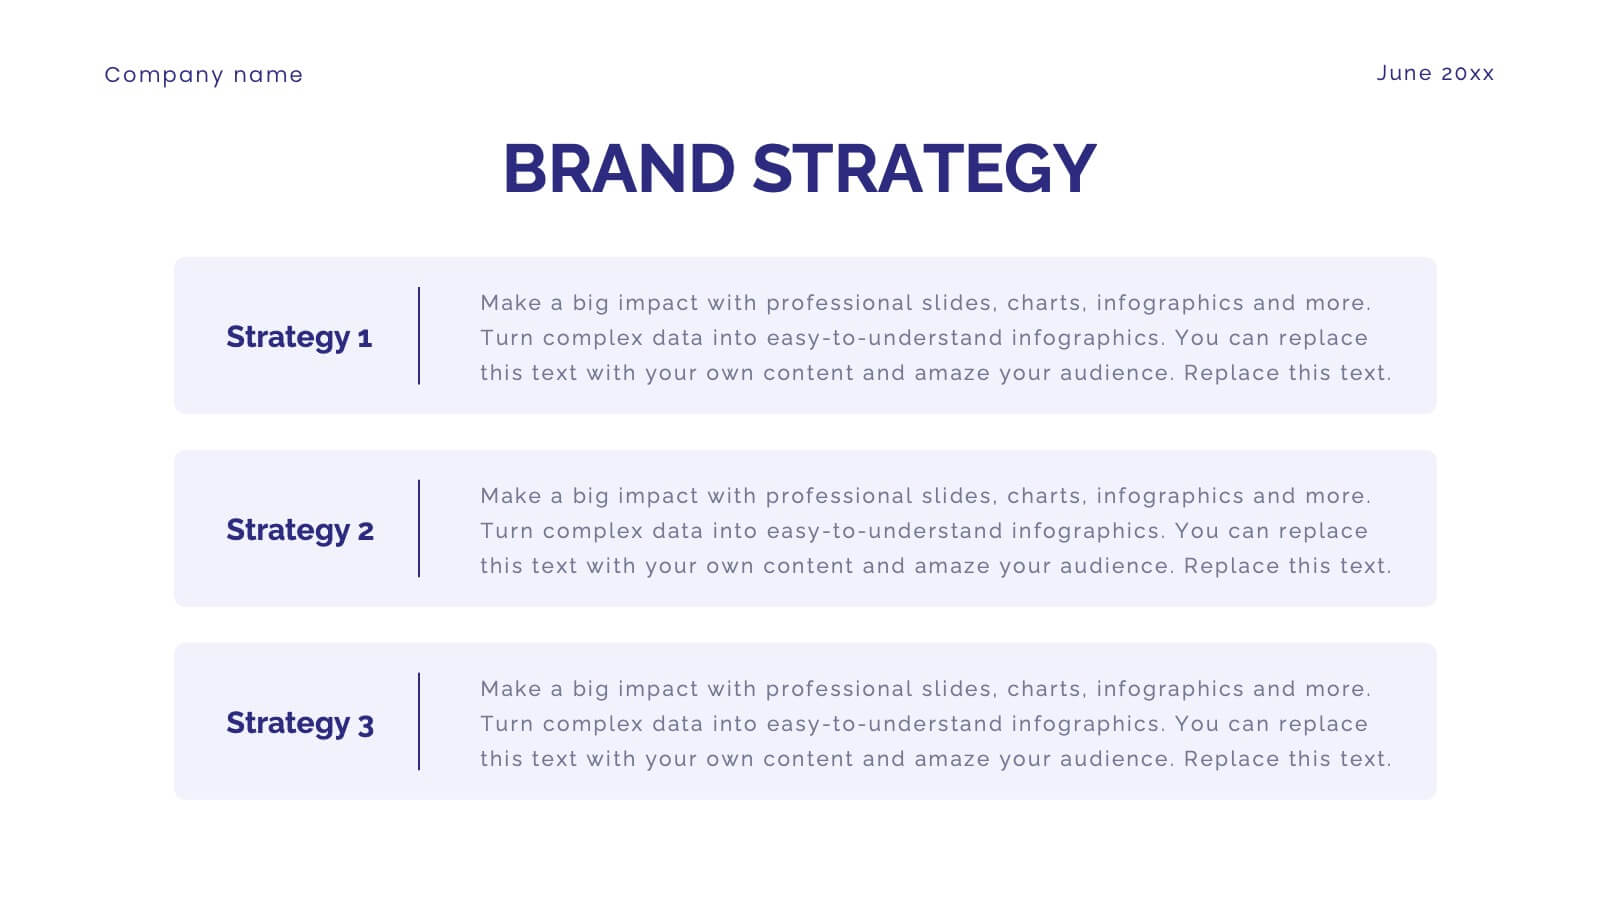
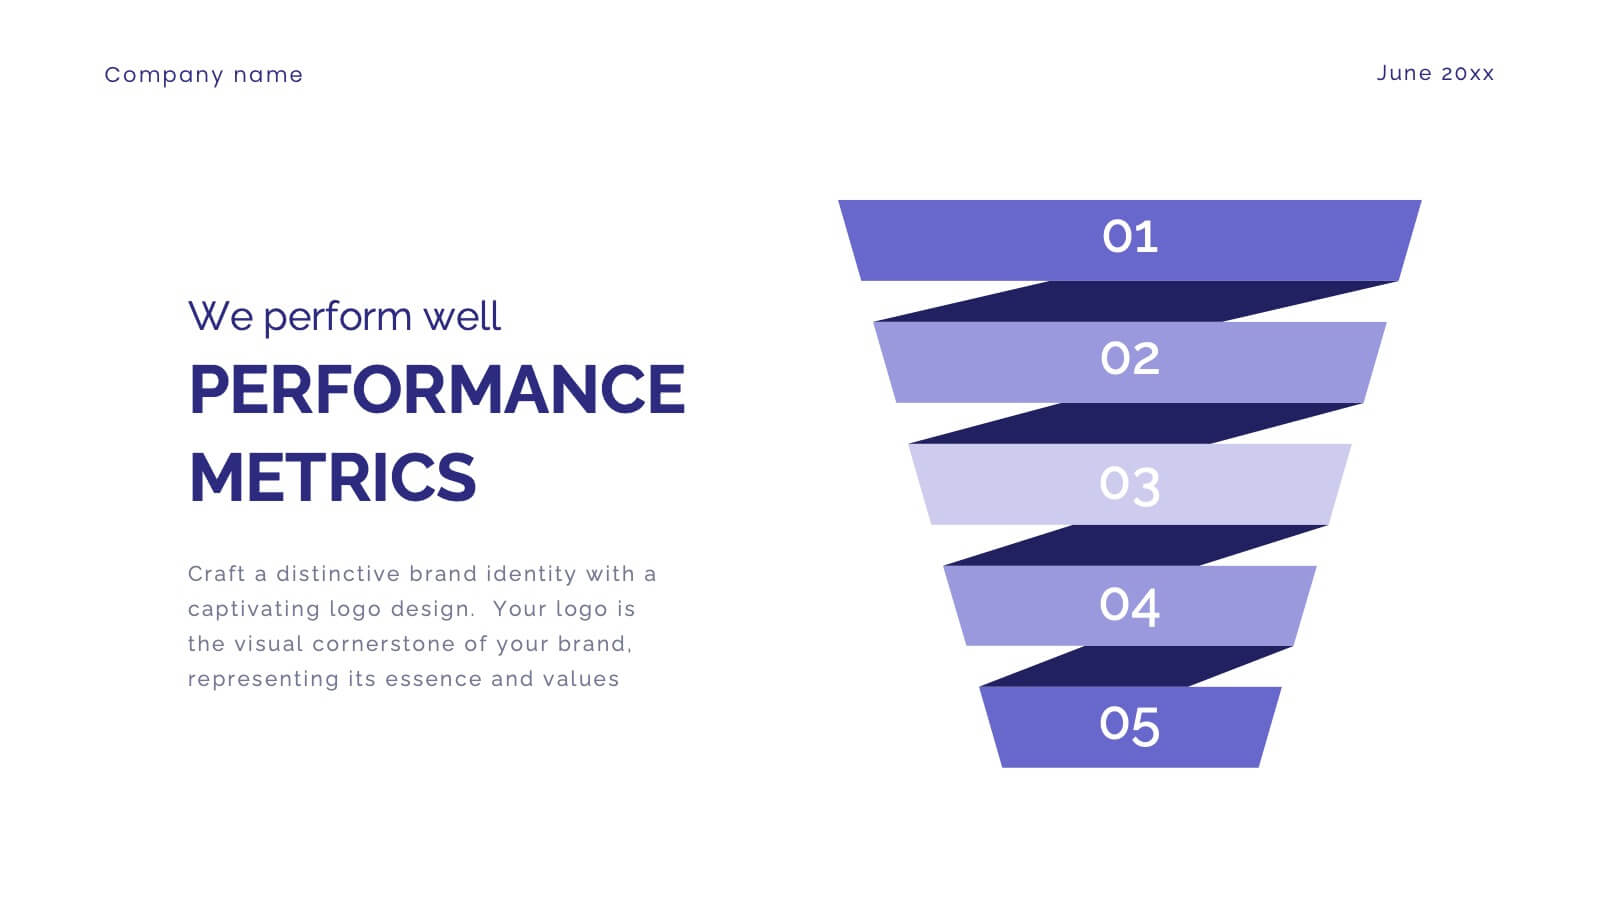
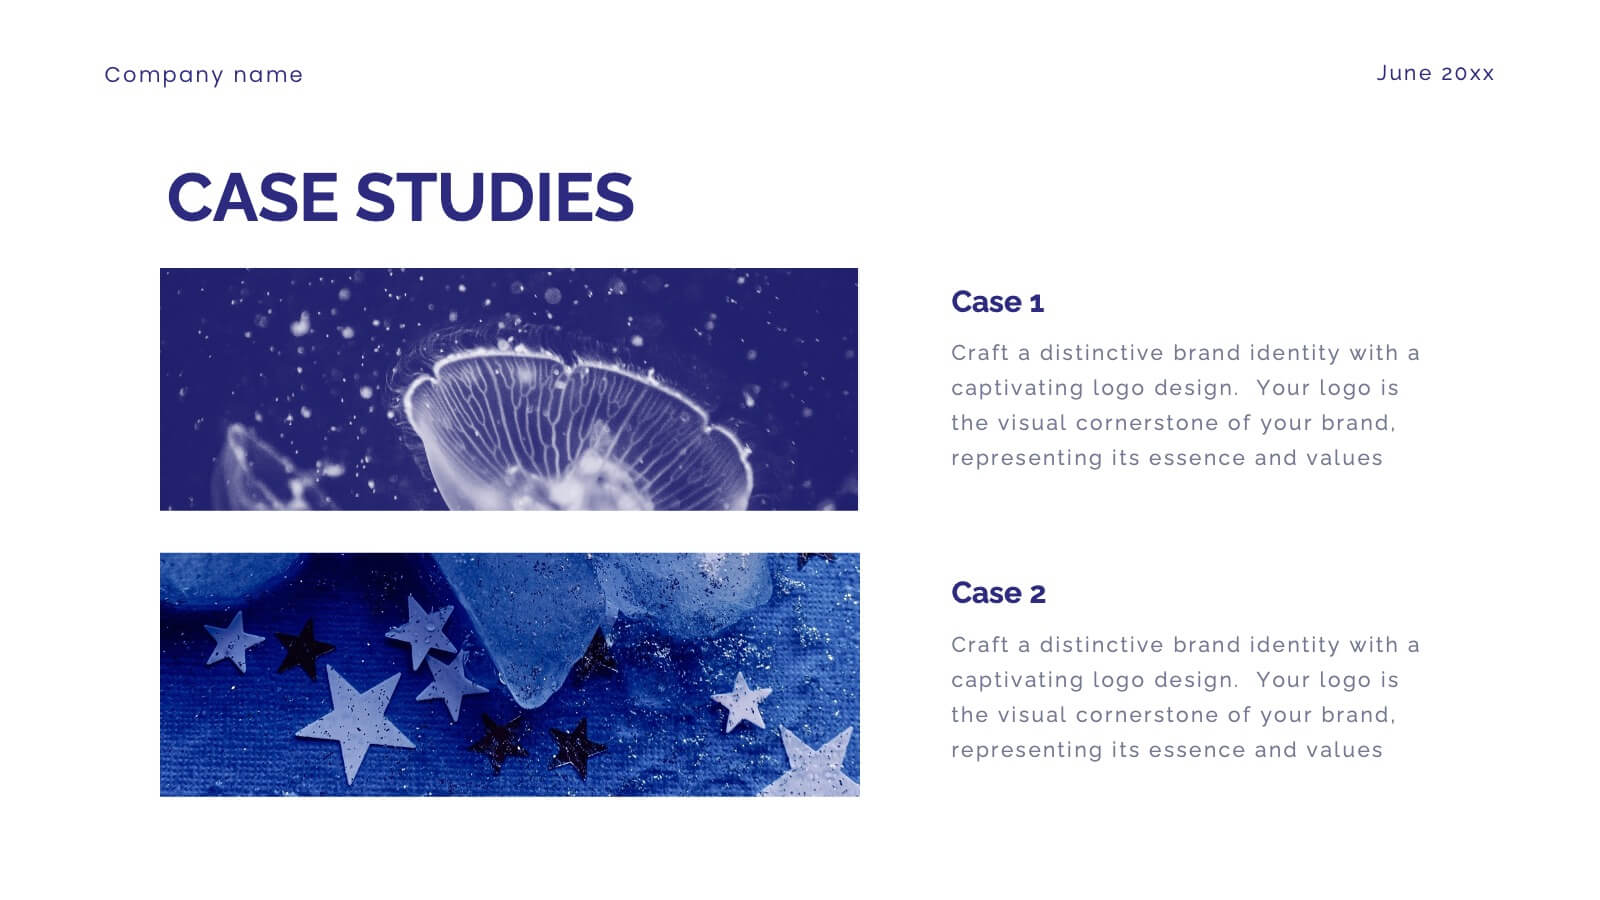
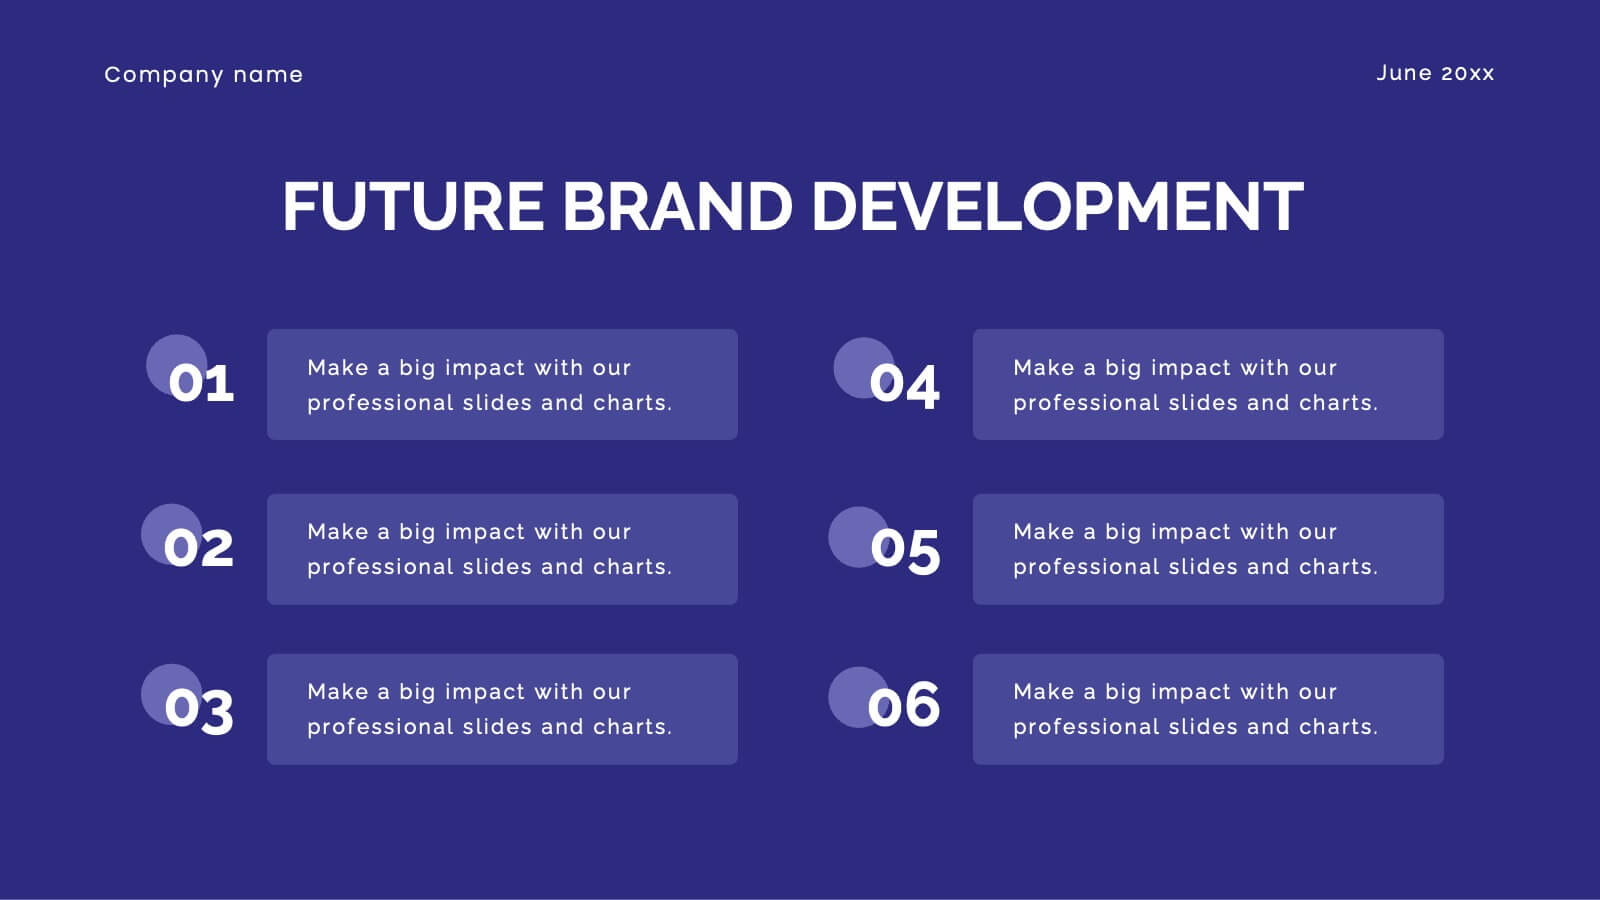
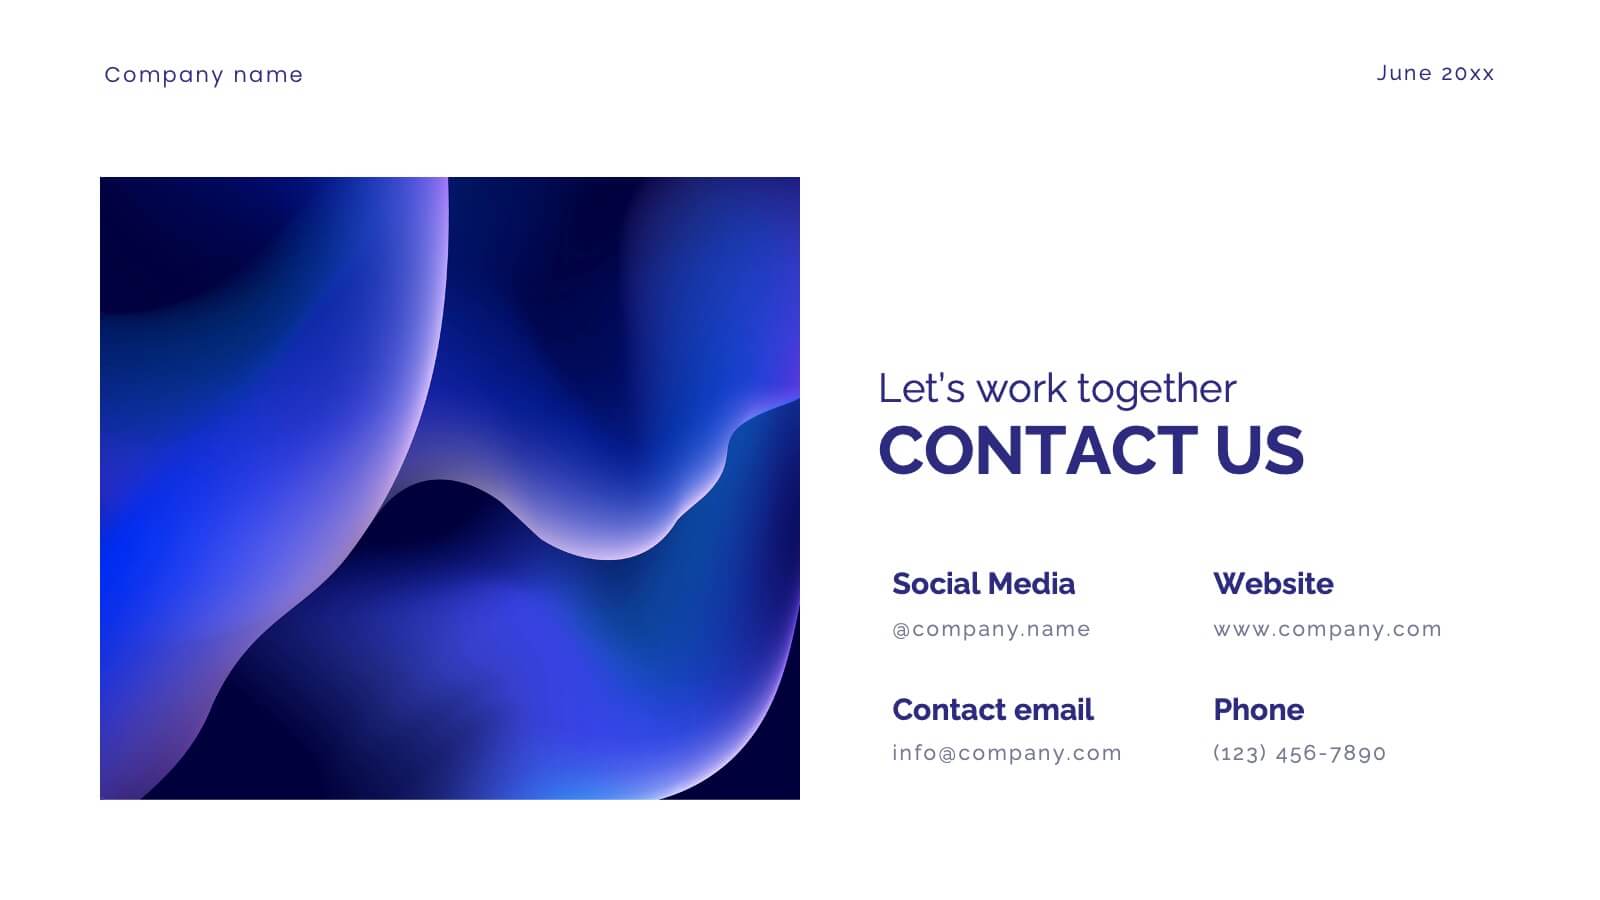
Glimmer Brand Development Pitch Deck Presentation
Elevate your brand with this comprehensive rebranding presentation template! Perfect for detailing your logo, color scheme, and market analysis, it includes slides for brand positioning, competitive landscape, and performance metrics. Engage your audience with clear visuals and structured content. Compatible with PowerPoint, Keynote, and Google Slides for seamless presentations on any platform.


7 slides
Porter's Five Forces Diagram
Porter's Five Forces is a strategic framework developed by Michael Porter that helps analyze the competitive environment of an industry. The five forces are represented in a diagram to understand the competitive dynamics and attractiveness of an industry or market. In this infographic template, the forces are represented as five segments of a circle or a graphical illustration with arrows and descriptions. Compatible with Powerpoint, Keynote, and Google Slides. This template is a powerful, bold, and insightful tool that dissects competitive forces, revealing strategic insights for businesses.


6 slides
Goal Setting and Strategic Planning Presentation
Present objectives and action plans with the Goal Setting and Strategic Planning template. Featuring a modern segmented design, this layout is perfect for outlining priorities, initiatives, and milestones. Fully editable in Canva, PowerPoint, and Google Slides, allowing you to adapt colors, icons, and text to match your business vision.


5 slides
Data-Driven Statistics Slide Presentation
Turn your numbers into a story that’s clear, bold, and easy to follow. This modern layout is perfect for presenting metrics, comparisons, or performance insights with precision and style. Customize colors, data, and text effortlessly—compatible with PowerPoint, Keynote, and Google Slides for seamless editing and presentation flexibility.


8 slides
AI Trends and Future Technology Presentation
Step into the future with this sleek, modern template designed to visualize cutting-edge concepts in artificial intelligence. Featuring futuristic robot graphics and a clean circular flow layout, this design is perfect for showcasing tech trends, automation strategies, or AI-driven innovations. Each section is color-coded and icon-supported for easy customization. Ideal for tech startups, AI researchers, and innovation consultants. Fully editable in PowerPoint, Keynote, and Google Slides.


5 slides
Information Technology Uses Infographics
Navigate the digital era with our information technology uses infographics, a synthesis of design and functionality. Presented in the trustworthy shades of blue and the vibrant hues of green, this template captures the essence of IT applications across spectrums. Whether you're an educator or tech enthusiast, these vertical, creatively designed infographics serve as a conduit to explain the intricacies of contemporary tech use. Compatible with Powerpoint, Keynote, and Google Slides. Complete with expressive icons and customizable image placeholders, this visual aid is crafted for clarity, making complex IT concepts engaging for audiences.


26 slides
Casey Presentation Template
Casey is a professionally designed modern, clean, and bold PowerPoint template that’s a great way to show off your data or highlight your services. This product is perfect for corporate customers who need an easy-to-edit template with bold colors and clean designs. With its easy to read charts, visible text, and bright colors this template will really captivate your audience. A perfect way to visualize your data and present your company in style to keep your audience engaged. Whether you are trying to get attention or just make your business stand out, this template will help you achieve that.


5 slides
Physical Science Infographics
Immerse in the realm of physical sciences with our physical science infographics template. Set against a deep cosmos of blues and purples, this template serves as a bridge between complex scientific principles and audiences, ideal for educators, students, and science communicators. The design, balancing creativity and informativeness, integrates stunning graphics and icons, turning data and facts into captivating visual stories. This dark-themed, visually engaging layout is not just an educational tool, but a spark that ignites curiosity and exploration in classrooms, scientific presentations, or educational content, making science both profound and accessible.


6 slides
Green Business Practice Implementation Presentation
Showcase your sustainability strategy with this Green Business Practice Implementation Presentation. Featuring a segmented lightbulb diagram, this slide is ideal for outlining eco-friendly initiatives, sustainable development goals, or ESG compliance efforts. Perfect for corporate sustainability reports or green business planning. Fully compatible with PowerPoint, Keynote, and Google Slides.


6 slides
Monthly Agenda and Events Presentation
The "Monthly Agenda and Events" presentation template features a calendar format, segmented by months, for detailed planning and tracking of events. Each month is color-coded for easy reference and contains placeholders for listing specific tasks or events. This template is perfect for individuals and teams who need to organize and visualize monthly activities, providing a clear overview of upcoming commitments and timelines, ensuring that all events and tasks are completed efficiently throughout the year.