


Features
- 5 Unique Slides
- Fully editable and easy to edit in Microsoft Powerpoint, Keynote and Google Slides
- 16:9 widescreen layout
- Clean and professional designs
- Export to JPG, PDF or send by email


Do you have any questions?
Recommend


22 slides
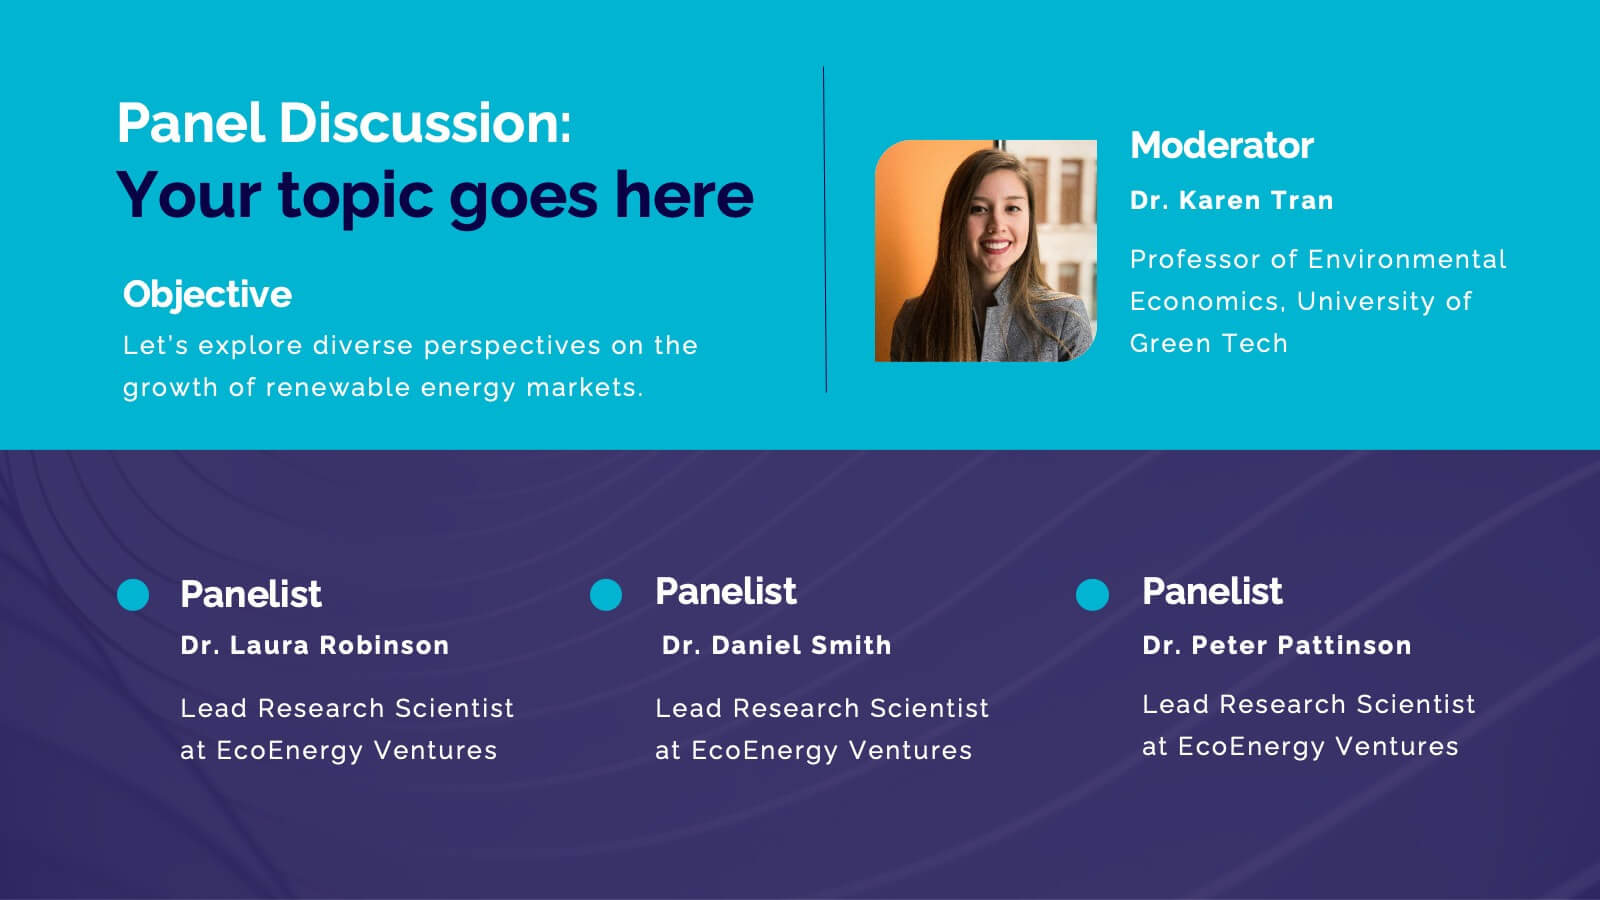
Nimbus Business Development Proposal Presentation
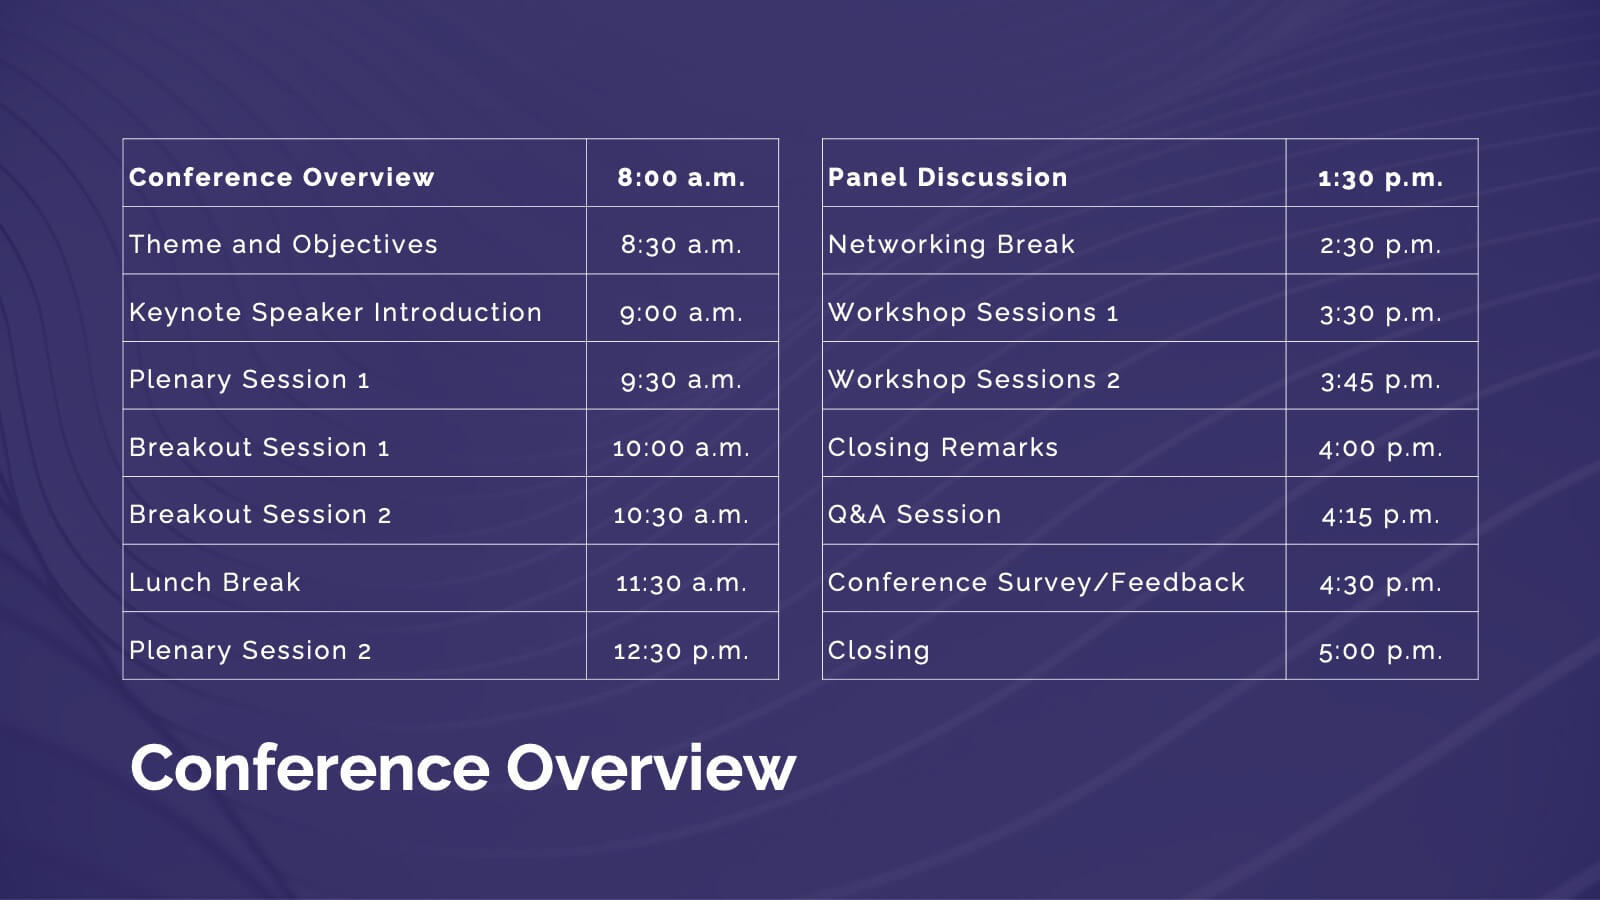
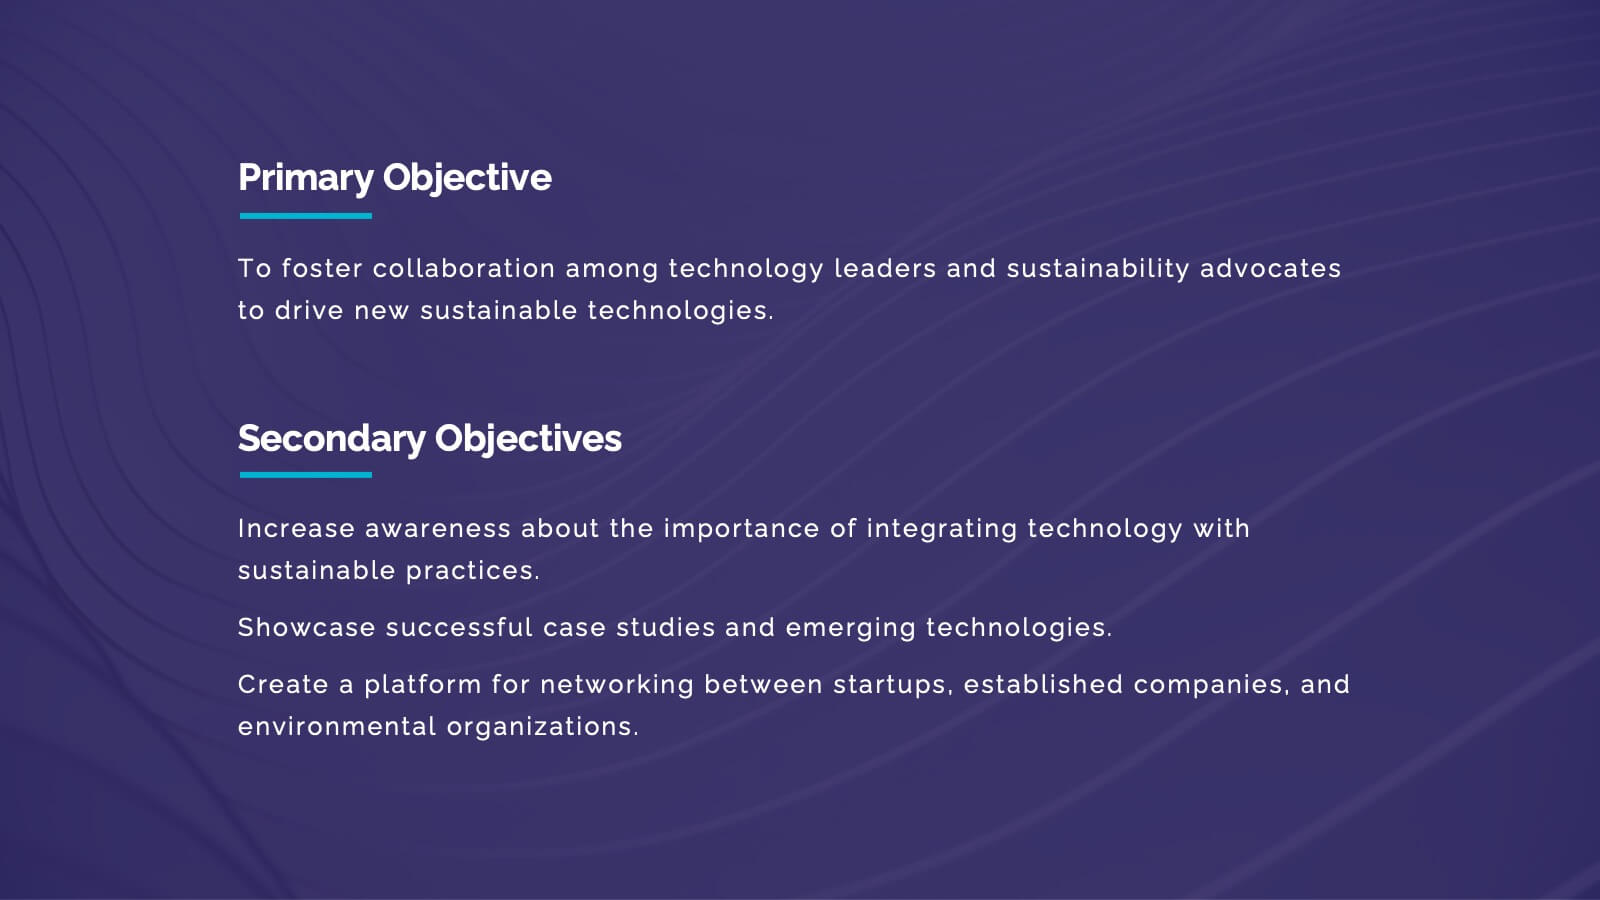
Boost your business presentations with this vibrant, professional template designed for business development proposals. Perfect for detailing conference overviews, themes, objectives, and keynotes, it features a clean and engaging layout. Highlight critical sessions and networking opportunities to captivate your audience. Compatible with PowerPoint, Keynote, and Google Slides, it ensures seamless presentations on any platform.


6 slides
Business Case Study and ROI Breakdown Presentation
Communicate your business impact clearly with the Business Case Study and ROI Breakdown Presentation. Featuring layered building-block visuals, this template is ideal for illustrating return on investment, strategic value, or project outcomes. Perfect for executive briefings and stakeholder presentations. Fully editable in PowerPoint, Keynote, and Google Slides.


6 slides
Professional Business Portfolio Presentation
Present your work with confidence using this sleek Professional Business Portfolio presentation. Designed to showcase your project highlights, performance data, and key insights, this layout features a clean two-column structure with space for visuals, icons, and statistics. Perfect for consultants, agencies, or entrepreneurs wanting to highlight business outcomes. Fully customizable and compatible with PowerPoint, Keynote, and Google Slides.


21 slides
Glacieron Financial Report Presentation
This Financial Report Presentation Template is a professional and visually engaging tool to showcase financial performance, key metrics, and strategic initiatives. It includes slides for performance metrics, financial summaries, competitor insights, and future goals, making it ideal for business reviews and stakeholder meetings. Compatible with PowerPoint, Keynote, and Google Slides for easy customization.


7 slides
Organizational Analysis McKinsey 7S Presentation
Explore the core of organizational alignment with our McKinsey 7S Model presentation template. Perfectly crafted for analyzing and optimizing business structures, this template guides you through the seven essential elements: Strategy, Structure, Systems, Shared Values, Skills, Staff, and Style. Its intuitive design ensures effective communication and clarity in your presentations. Optimized for PowerPoint, Keynote, and Google Slides, it's an invaluable tool for consultants and business strategists aiming to enhance internal coherence and performance.


15 slides
Business Plan Infographic Presentation
Businesses are important components of a healthy economy and society. They create jobs, drive innovation, encourage entrepreneurship, and contribute to the well-being of society. With this template you can create a clear and effective business Infographic for your pitches, or projects. The design is made to enhance your message and inspire your audience. This template can be used for presenting any business information whether it be data, statistics, facts etc. It is compatible with Powerpoint, keynote and google slides so all the elements are editable, and can be changed to fit your needs.


8 slides
Blue Ocean Strategy Business Model Presentation
Chart unexplored market territories with our Blue Ocean Strategy Business Model template! This dynamic presentation tool, designed to simplify complex business strategies, illustrates the pivotal elements of cost reduction and value innovation to unlock new buyer value. Compatible with PowerPoint, Keynote, and Google Slides, it's ideal for strategists aiming to create uncontested market spaces and make competition irrelevant. Perfect for workshops, business meetings, or strategy sessions.


7 slides
Environment United States Map Infographic
An Environment United States Map refers to a map that displays various environmental aspects or features across the United States. This template is a powerful tool for visualizing sustainability initiatives and environmental data across the diverse landscapes of the United States. With a combination of insightful graphics, this template enables you to present a compelling narrative about the nation's environmental efforts. This Infographic is a call to action to protect and preserve our planet, highlighting the efforts that are shaping a more sustainable and harmonious coexistence with nature.


6 slides
Science Project Infographic
Science projects are hands-on activities designed to explore and investigate scientific concepts. This infographic template aims to communicate complex scientific information in a visually appealing and easy-to-understand manner. The infographic provides an overview of the project's key elements, including the question, hypothesis, materials, procedure, results, and conclusion. This serves as a creative and engaging guide to help students choose and plan their science projects for school science fairs or independent research. The infographic uses visuals, illustrations, and icons to enhance understanding and engagement.


4 slides
Editable Cause and Effect Diagram Presentation
Bring clarity to every insight with a bold visual layout that makes connections between actions and outcomes easy to follow. This presentation helps you explain root causes, outline impacts, and guide decision-making with clean, structured graphics. Ideal for reports, planning, and analysis. Fully compatible with PowerPoint, Keynote, and Google Slides.


4 slides
Project Workflow Steps and Flowchart Presentation
Map out each phase of your project with clarity using the Project Workflow Steps and Flowchart Presentation. This detailed template offers a visual grid layout for illustrating task sequences, decision points, and team responsibilities. Ideal for project managers, analysts, and operations teams. Fully editable and compatible with PowerPoint, Keynote, and Google Slides.


22 slides
Lucidia Market Research Presentation
Deliver insightful market research findings with this modern and structured template. It covers key areas such as data analysis, consumer insights, research methodologies, and future directions. Ideal for presenting to stakeholders or clients. Fully customizable for PowerPoint, Keynote, and Google Slides.

25 slides
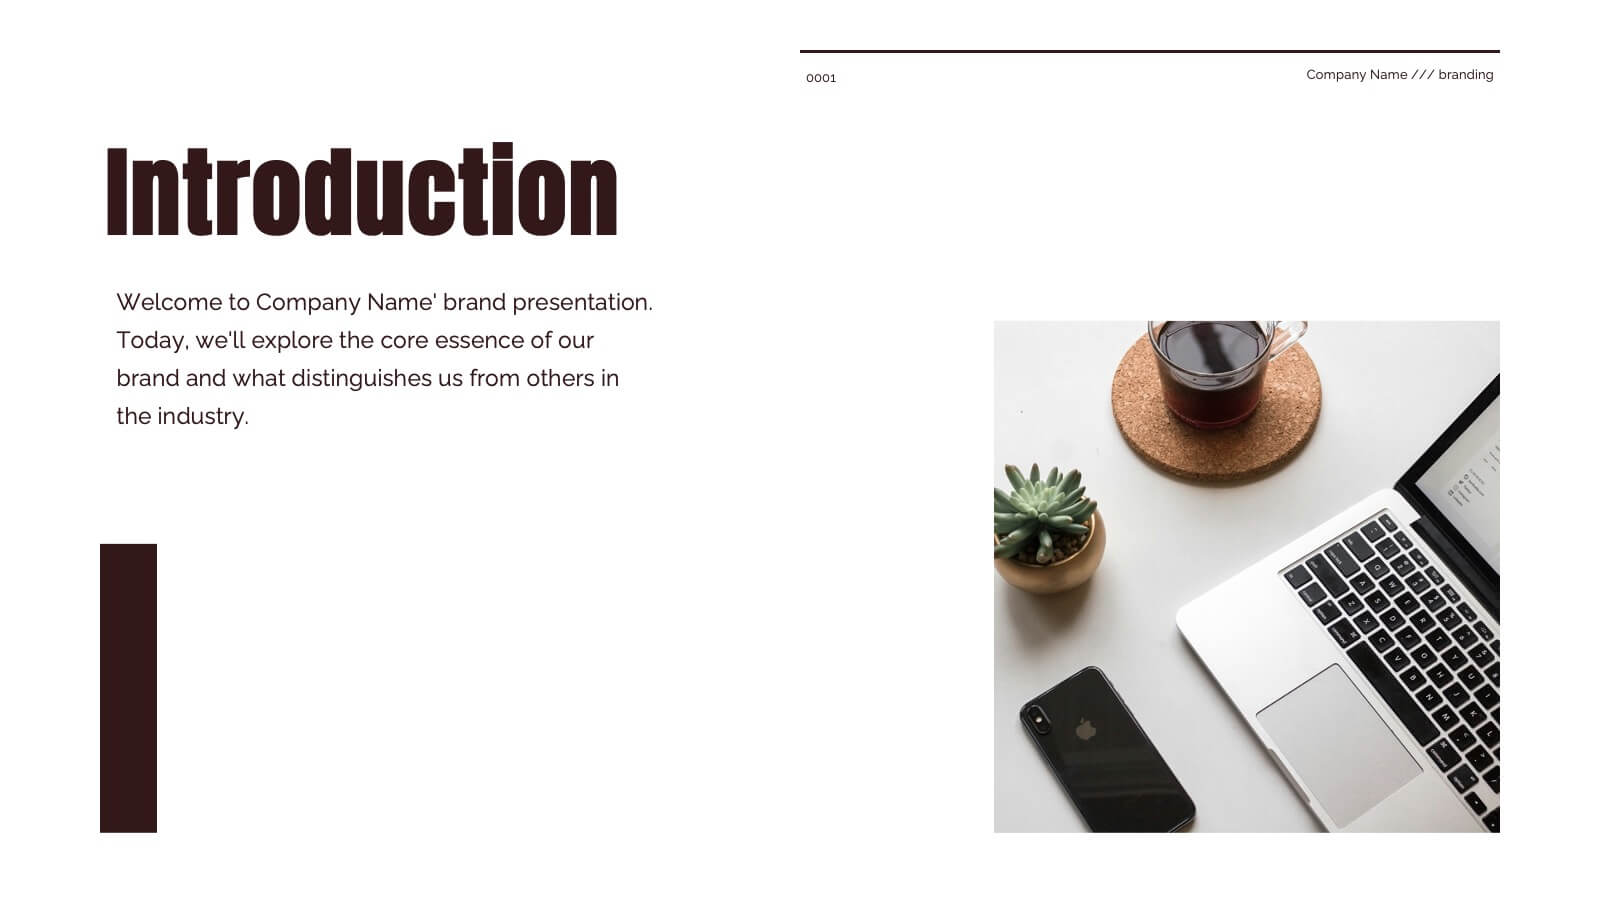
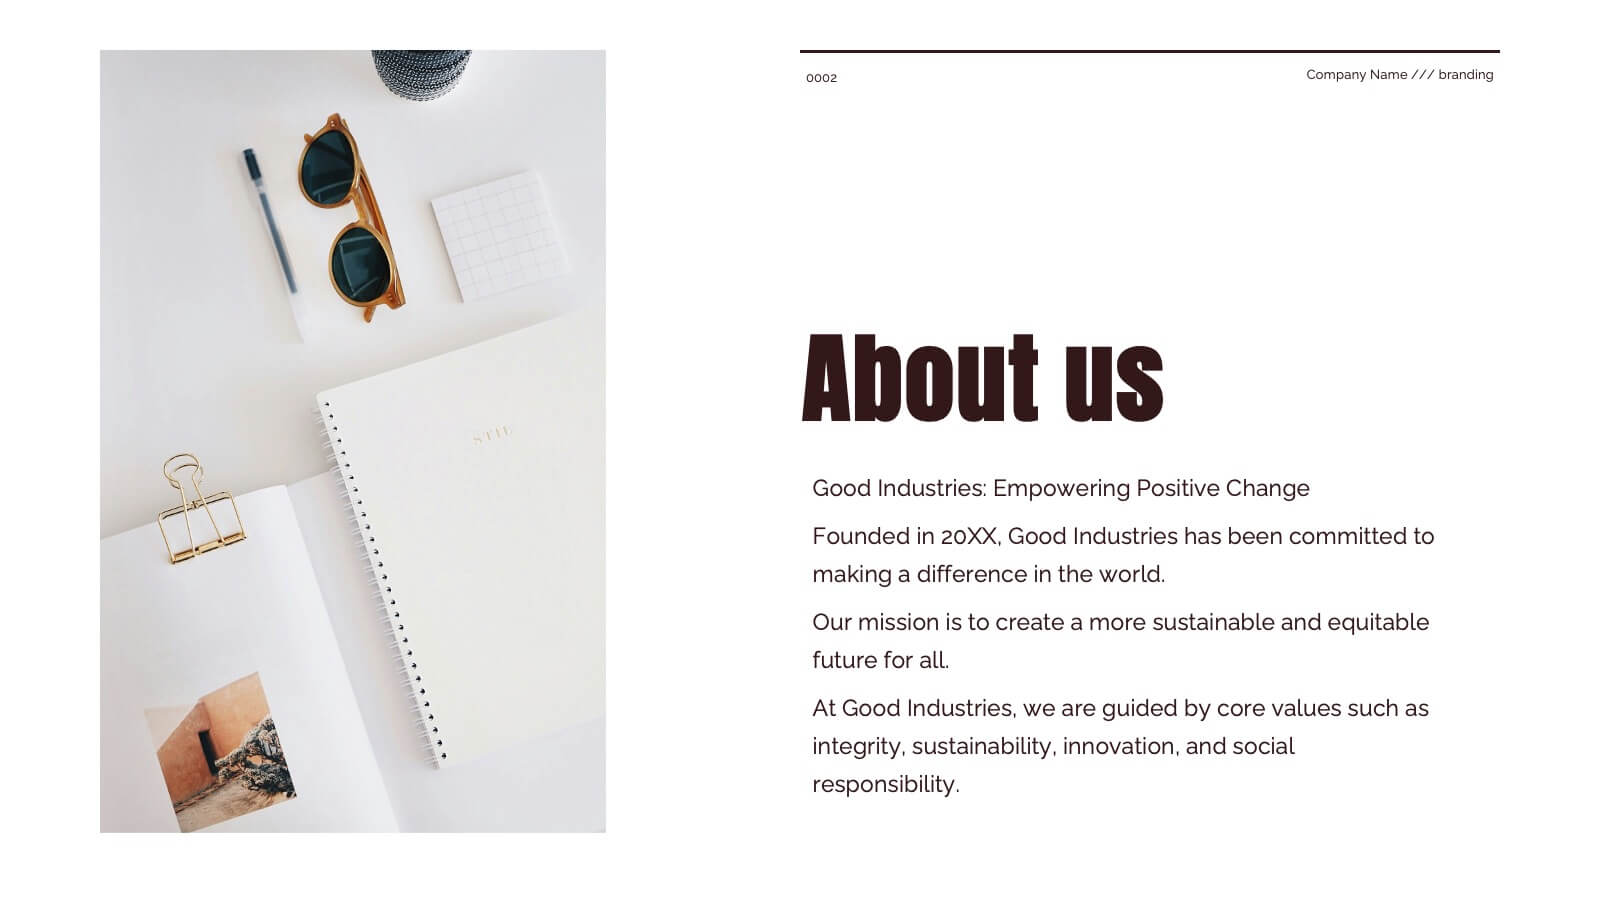
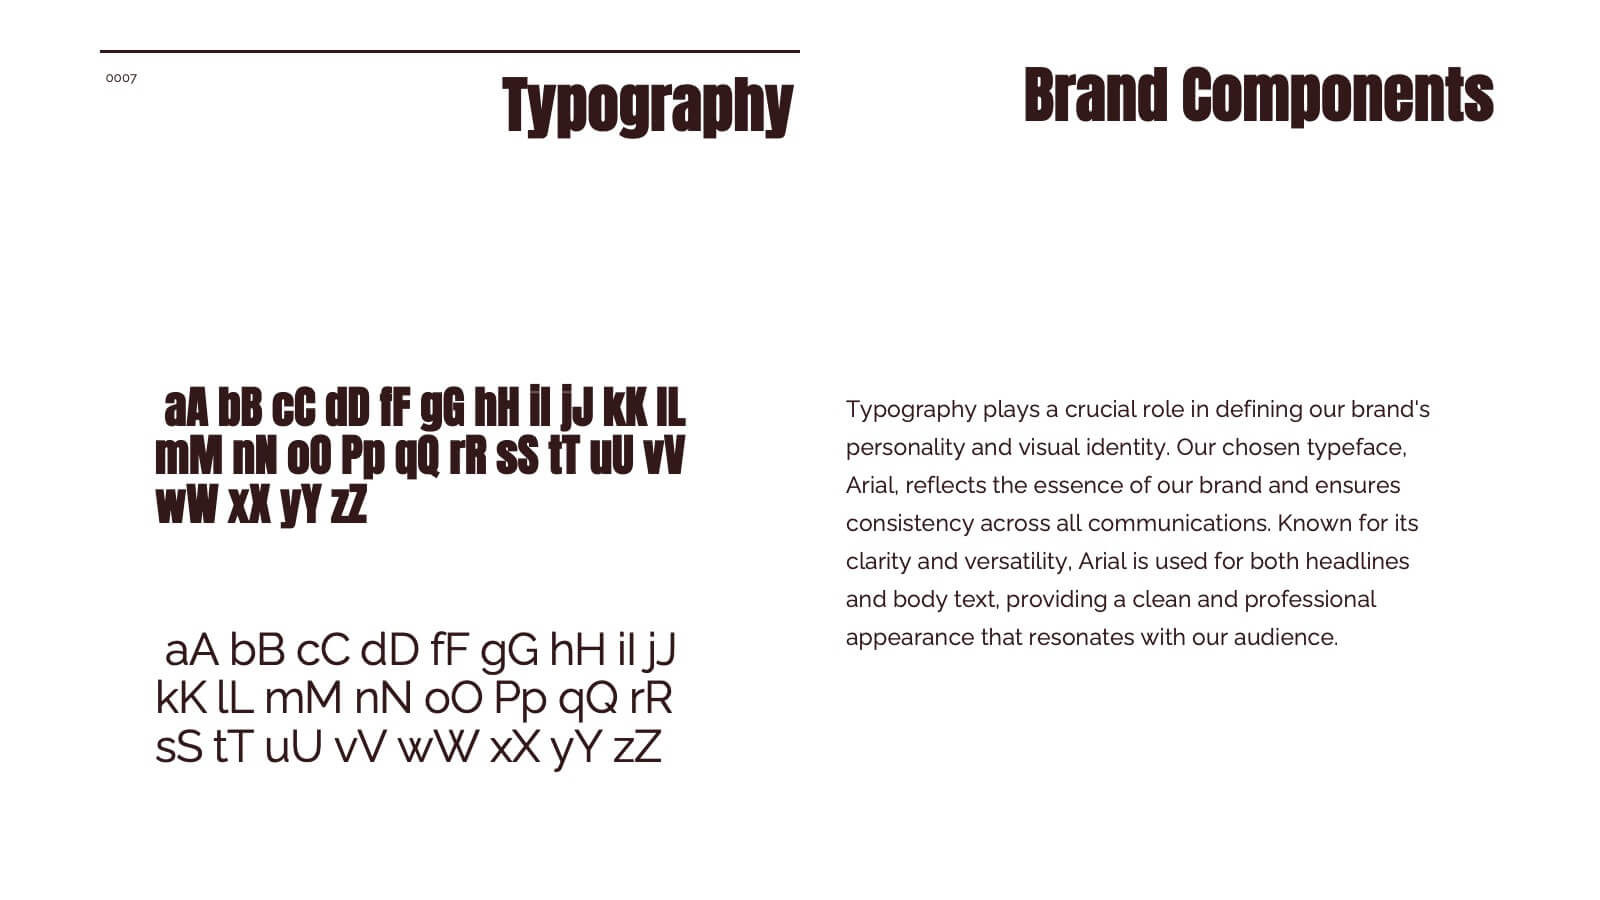
Blaze Brand Identity Presentation
Ignite your brand's potential with this vibrant, blaze-inspired presentation! Ideal for showcasing your brand identity, this template highlights key elements like logo design, color palette, and brand messaging with bold visuals and a modern layout. Perfect for making your brand stand out. Compatible with PowerPoint, Keynote, and Google Slides.


7 slides
Credit Card Infographic Presentation Template
A Credit card Infographic is a stacked chart showing data visualization of credit card types and associated information, including the number of cards owned by different age groups and gender, as well as overall debt. This infographic allows you to cover the ins and outs of credit cards, from rewards to fees and interest rates. This template will help you understand how credit cards work, while comparing cards based on price and other important factors. This Infographic is the perfect way to visualize data, trends and facts in an engaging way that grabs attention and keeps people reading.


10 slides
Effective Team Building Presentation
Spark stronger teamwork with a clean, engaging layout that makes group objectives easy to explain and even easier to remember. This presentation highlights key actions, shared responsibilities, and collaborative strategies in a simple visual flow that supports any team discussion. Fully compatible with PowerPoint, Keynote, and Google Slides.


6 slides
Workforce Skills Gap Assessment Presentation
Identify, visualize, and address talent gaps with the Workforce Skills Gap Assessment Presentation. This template helps you clearly communicate current capabilities versus future needs across departments or teams. Perfect for HR leaders, L&D strategists, and organizational planners. Fully customizable in PowerPoint, Keynote, Canva, and Google Slides.


5 slides
Regional Development in Oceania Map Presentation
The Regional Development in Oceania Map template provides a comprehensive visualization of growth and development metrics across various regions in Oceania. This template is designed to aid in presenting demographic data, economic indicators, or development status in a clear, easily understandable format. It's suitable for reports, presentations, and educational materials. Compatible with PowerPoint, Keynote, and Google Slides.