


Features
- 6 Unique slides
- Fully editable and easy to edit in Microsoft Powerpoint, Keynote and Google Slides
- 16:9 widescreen layout
- Clean and professional designs
- Export to JPG, PDF or send by email


Do you have any questions?
Recommend


6 slides
Business Flow Chart Design Presentation
Bring clarity and momentum to your process with a clean, visual layout that turns complex steps into an easy-to-follow flow. This presentation helps teams map stages, responsibilities, and progress with confidence, making it perfect for planning, strategy, and operations. Fully compatible with PowerPoint, Keynote, and Google Slides.


7 slides
Master Six Sigma Infographic Presentation
Six Sigma is a methodology used by organizations to improve their business processes and eliminate defects. Use this template to explore the key concepts of Six Sigma and how it can be applied in different industries. This templates include helpful illustrations, charts and tips which allow you to present information in a clear and concise way that makes it easy for your audience to understand and take notes. This template has been made using modern fonts, appealing color combinations and simple layouts. The clean and simple design is compatible with Powerpoint, Keynote and Google Slides.


4 slides
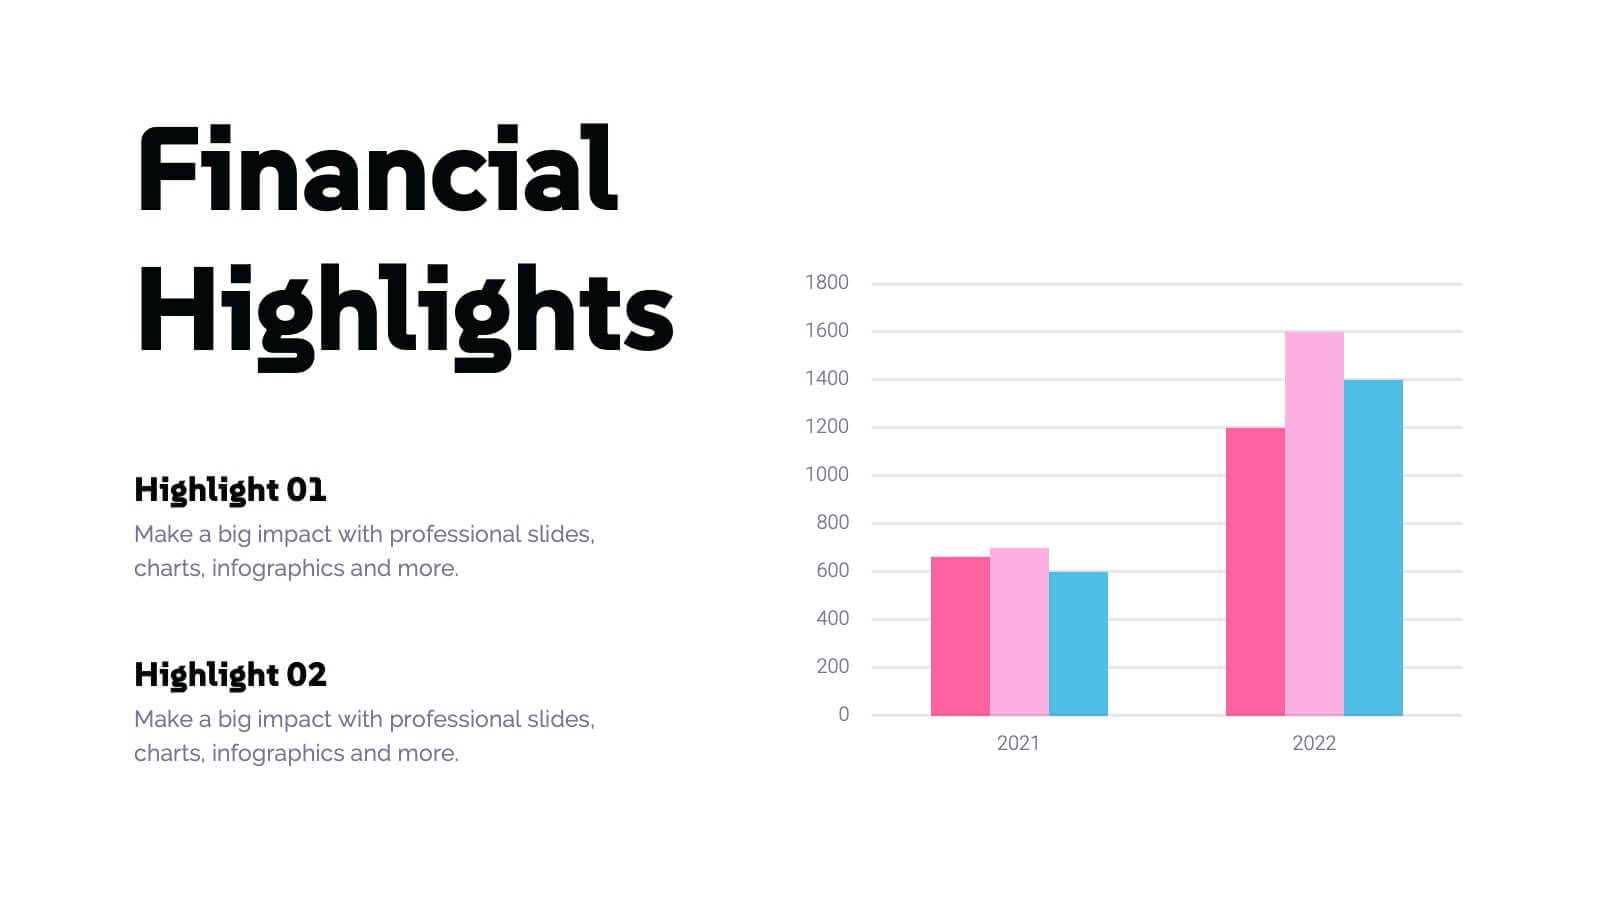
Financial Report Presentation
Enhance your financial presentations with our "Financial Report Presentation" template. Designed for clarity and visual impact, this infographic features a stylized financial bag icon segmented into color-coded sections, each representing a different financial metric such as revenue, expenses, profits, and investments. This creative visual structure allows for a clear and segmented display of your company's financial health, making complex data easily understandable. Ideal for financial analysts, corporate presentations, and investor meetings, this template ensures key financial insights are communicated effectively and efficiently. Compatible with PowerPoint, Keynote, and Google Slides, it's an essential tool for delivering detailed and precise financial reports.


21 slides
Chimera Marketing Campaign Presentation
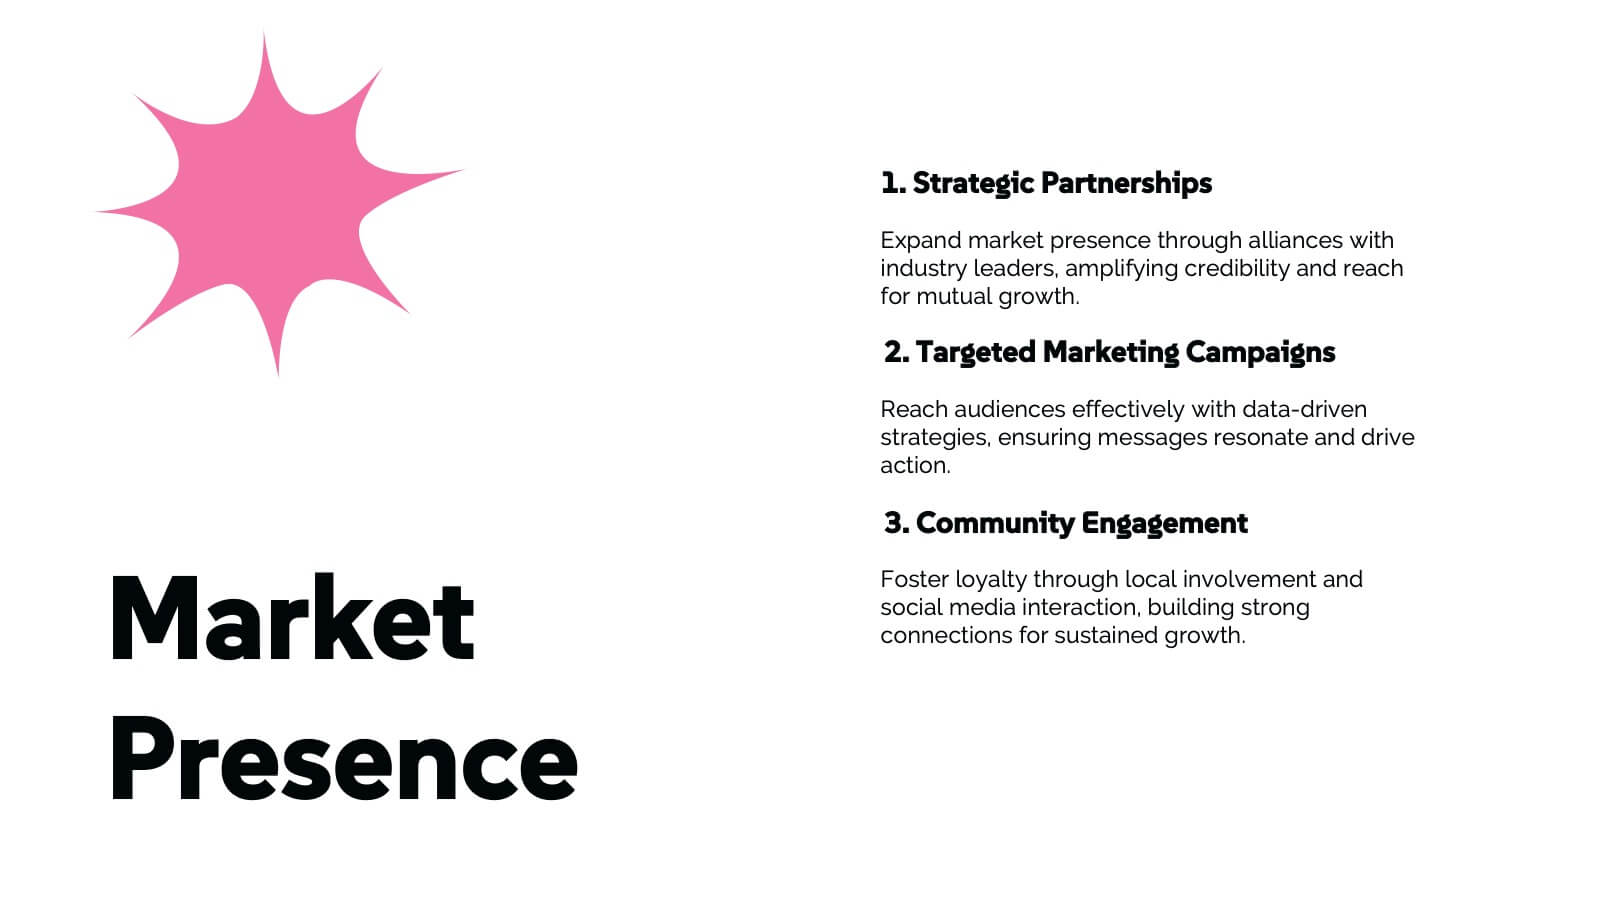
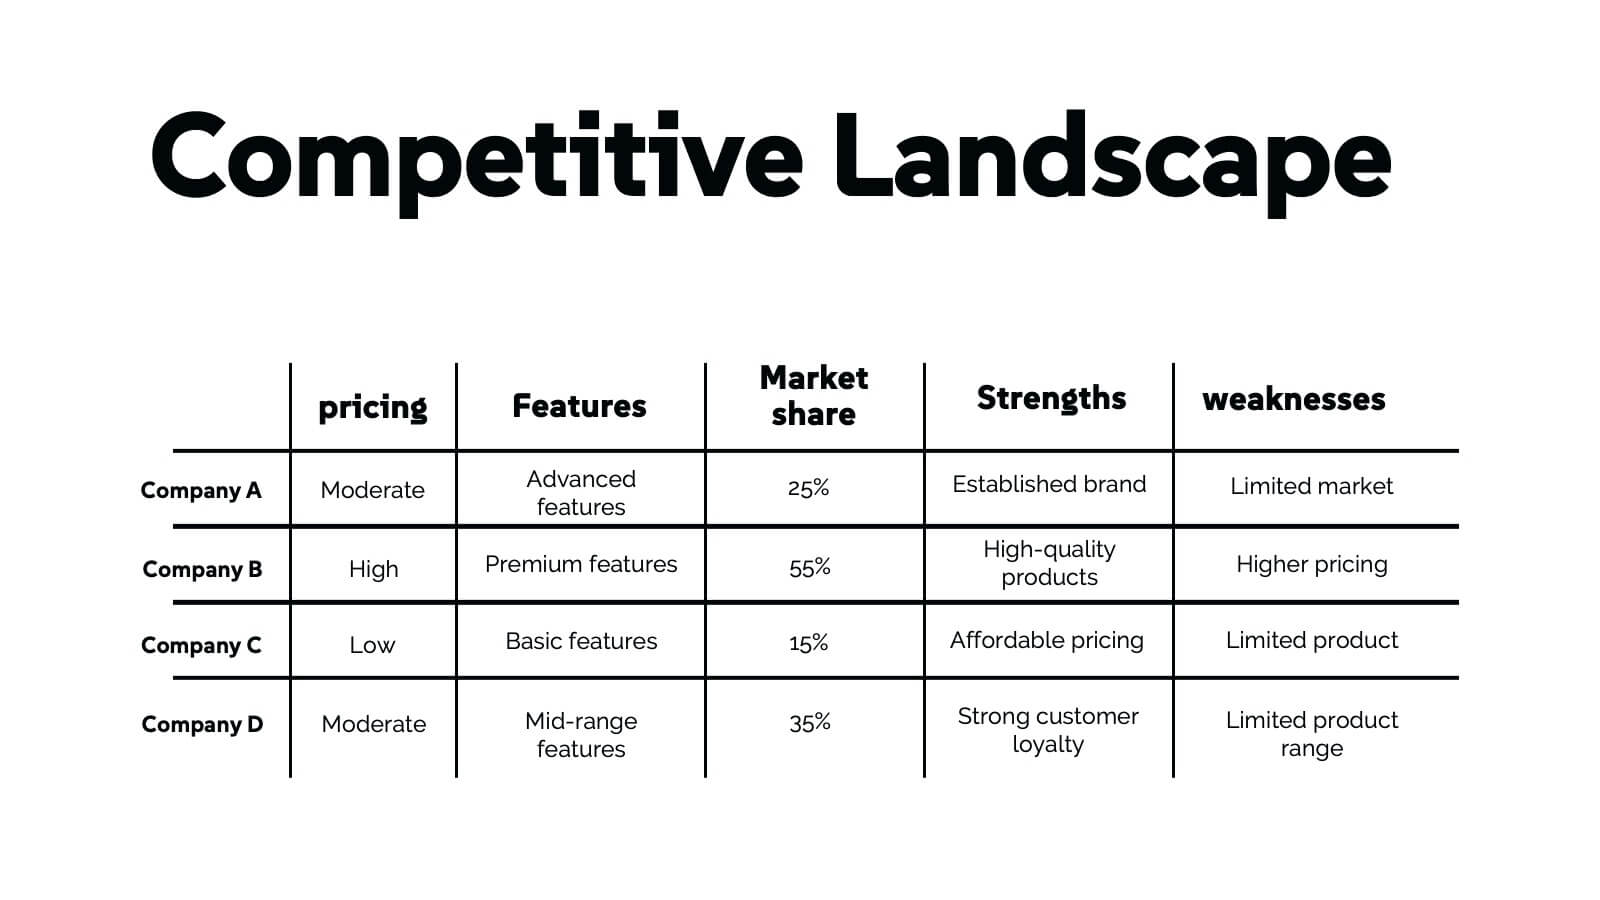
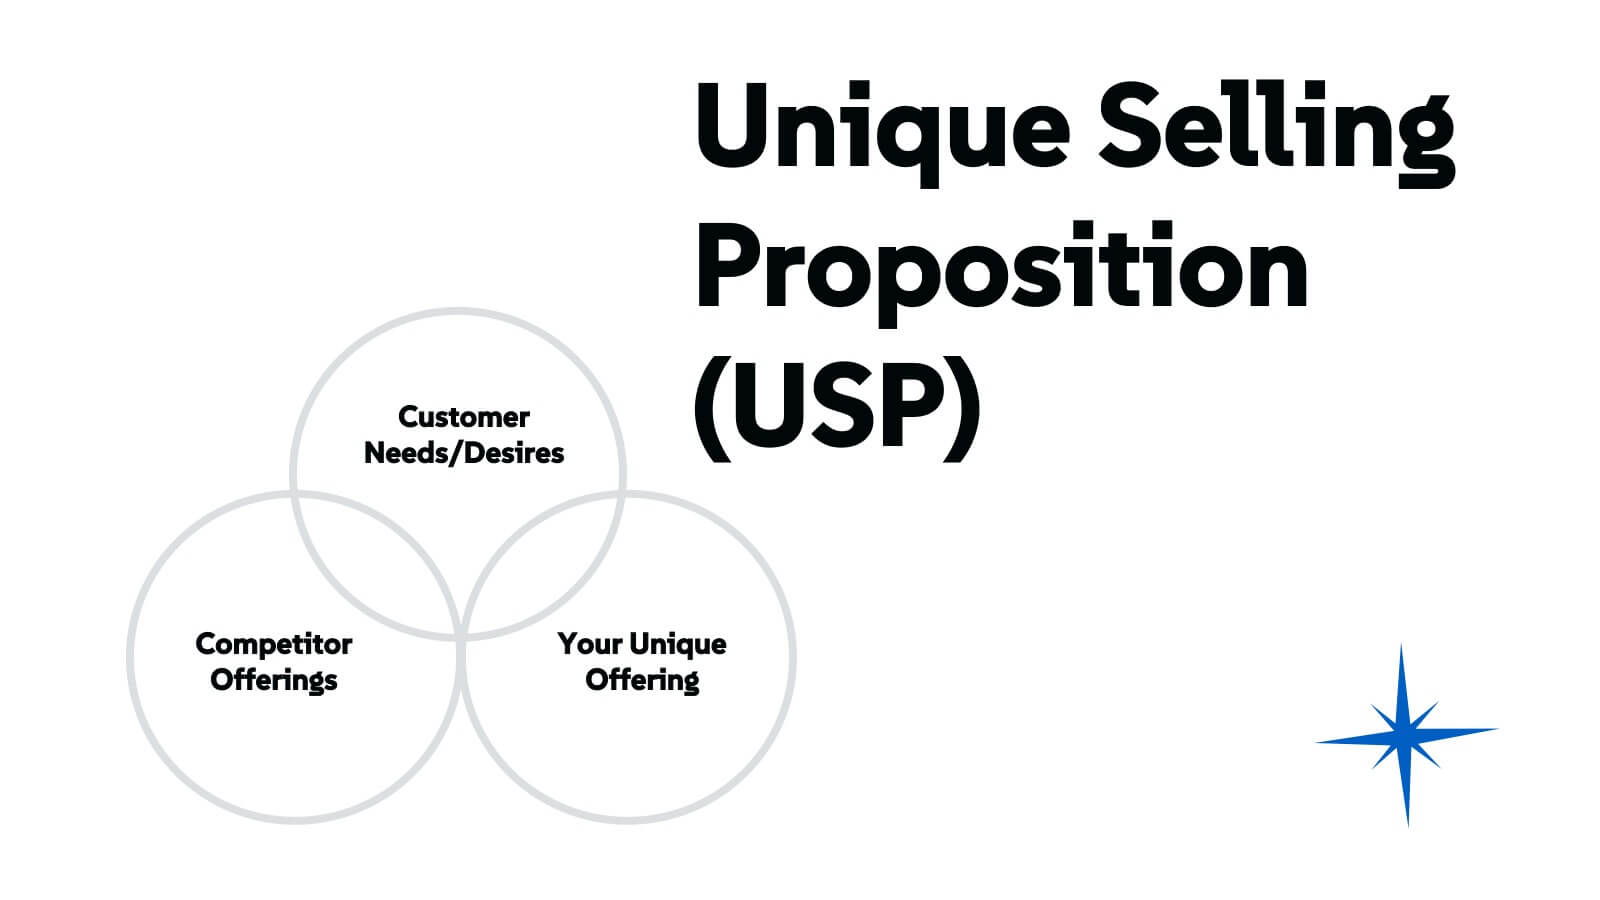
Create a visually engaging digital marketing presentation with this modern template! Covering essential topics like company history, market presence, target audience, and competitive landscape, this template helps you showcase your marketing strategies effectively. Fully customizable, it works seamlessly with PowerPoint, Keynote, and Google Slides for professional presentations every time.


6 slides
SMART Goals Breakdown Presentation
Bring clarity and momentum to your planning with this clean, easy-to-follow slide that breaks down each step of the SMART framework. It helps audiences understand how goals become actionable through structure and measurement. Perfect for training, strategy, or coaching sessions. Fully compatible with PowerPoint, Keynote, and Google Slides.


4 slides
Multi-Stage Process Hexagon Infographic Presentation
Showcase your workflows clearly with the Multi-Stage Process Hexagon Infographic Presentation. This template features a sleek chain of hexagons, ideal for visualizing linear steps, sequential planning, or project phases. Each stage is editable, color-coded, and easy to customize in PowerPoint, Keynote, or Google Slides—perfect for teams, educators, or project managers.

23 slides
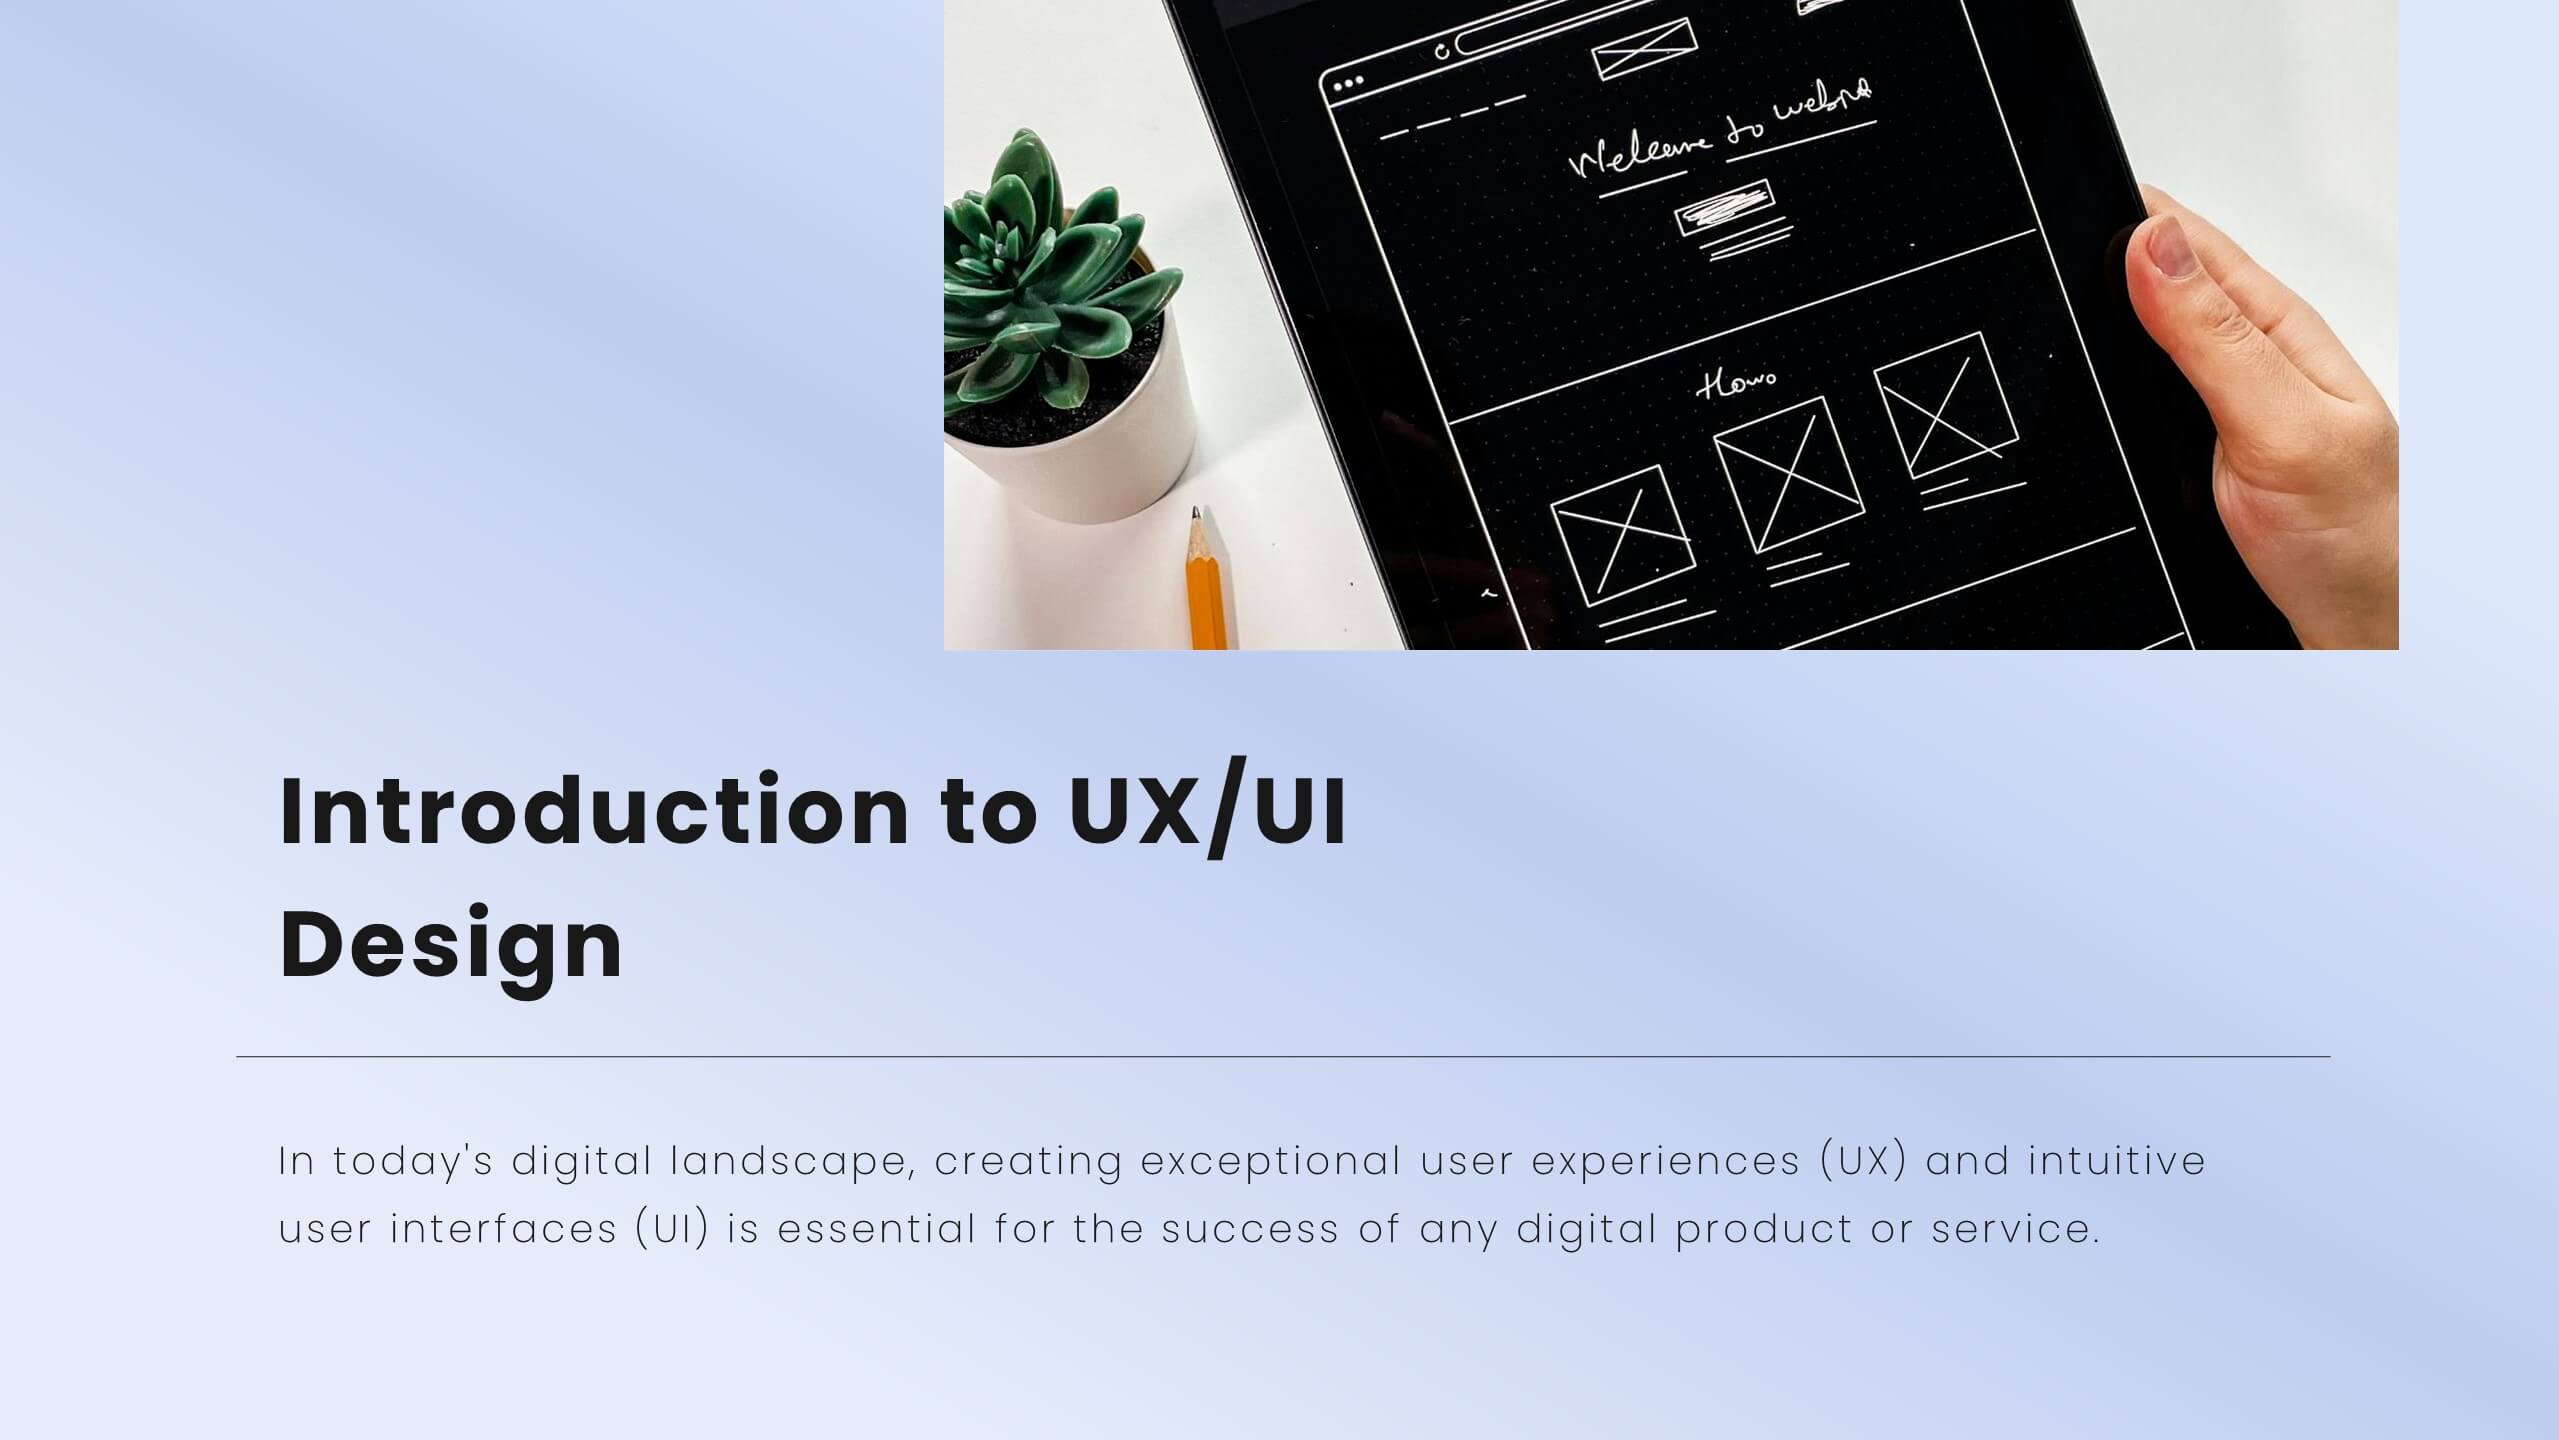
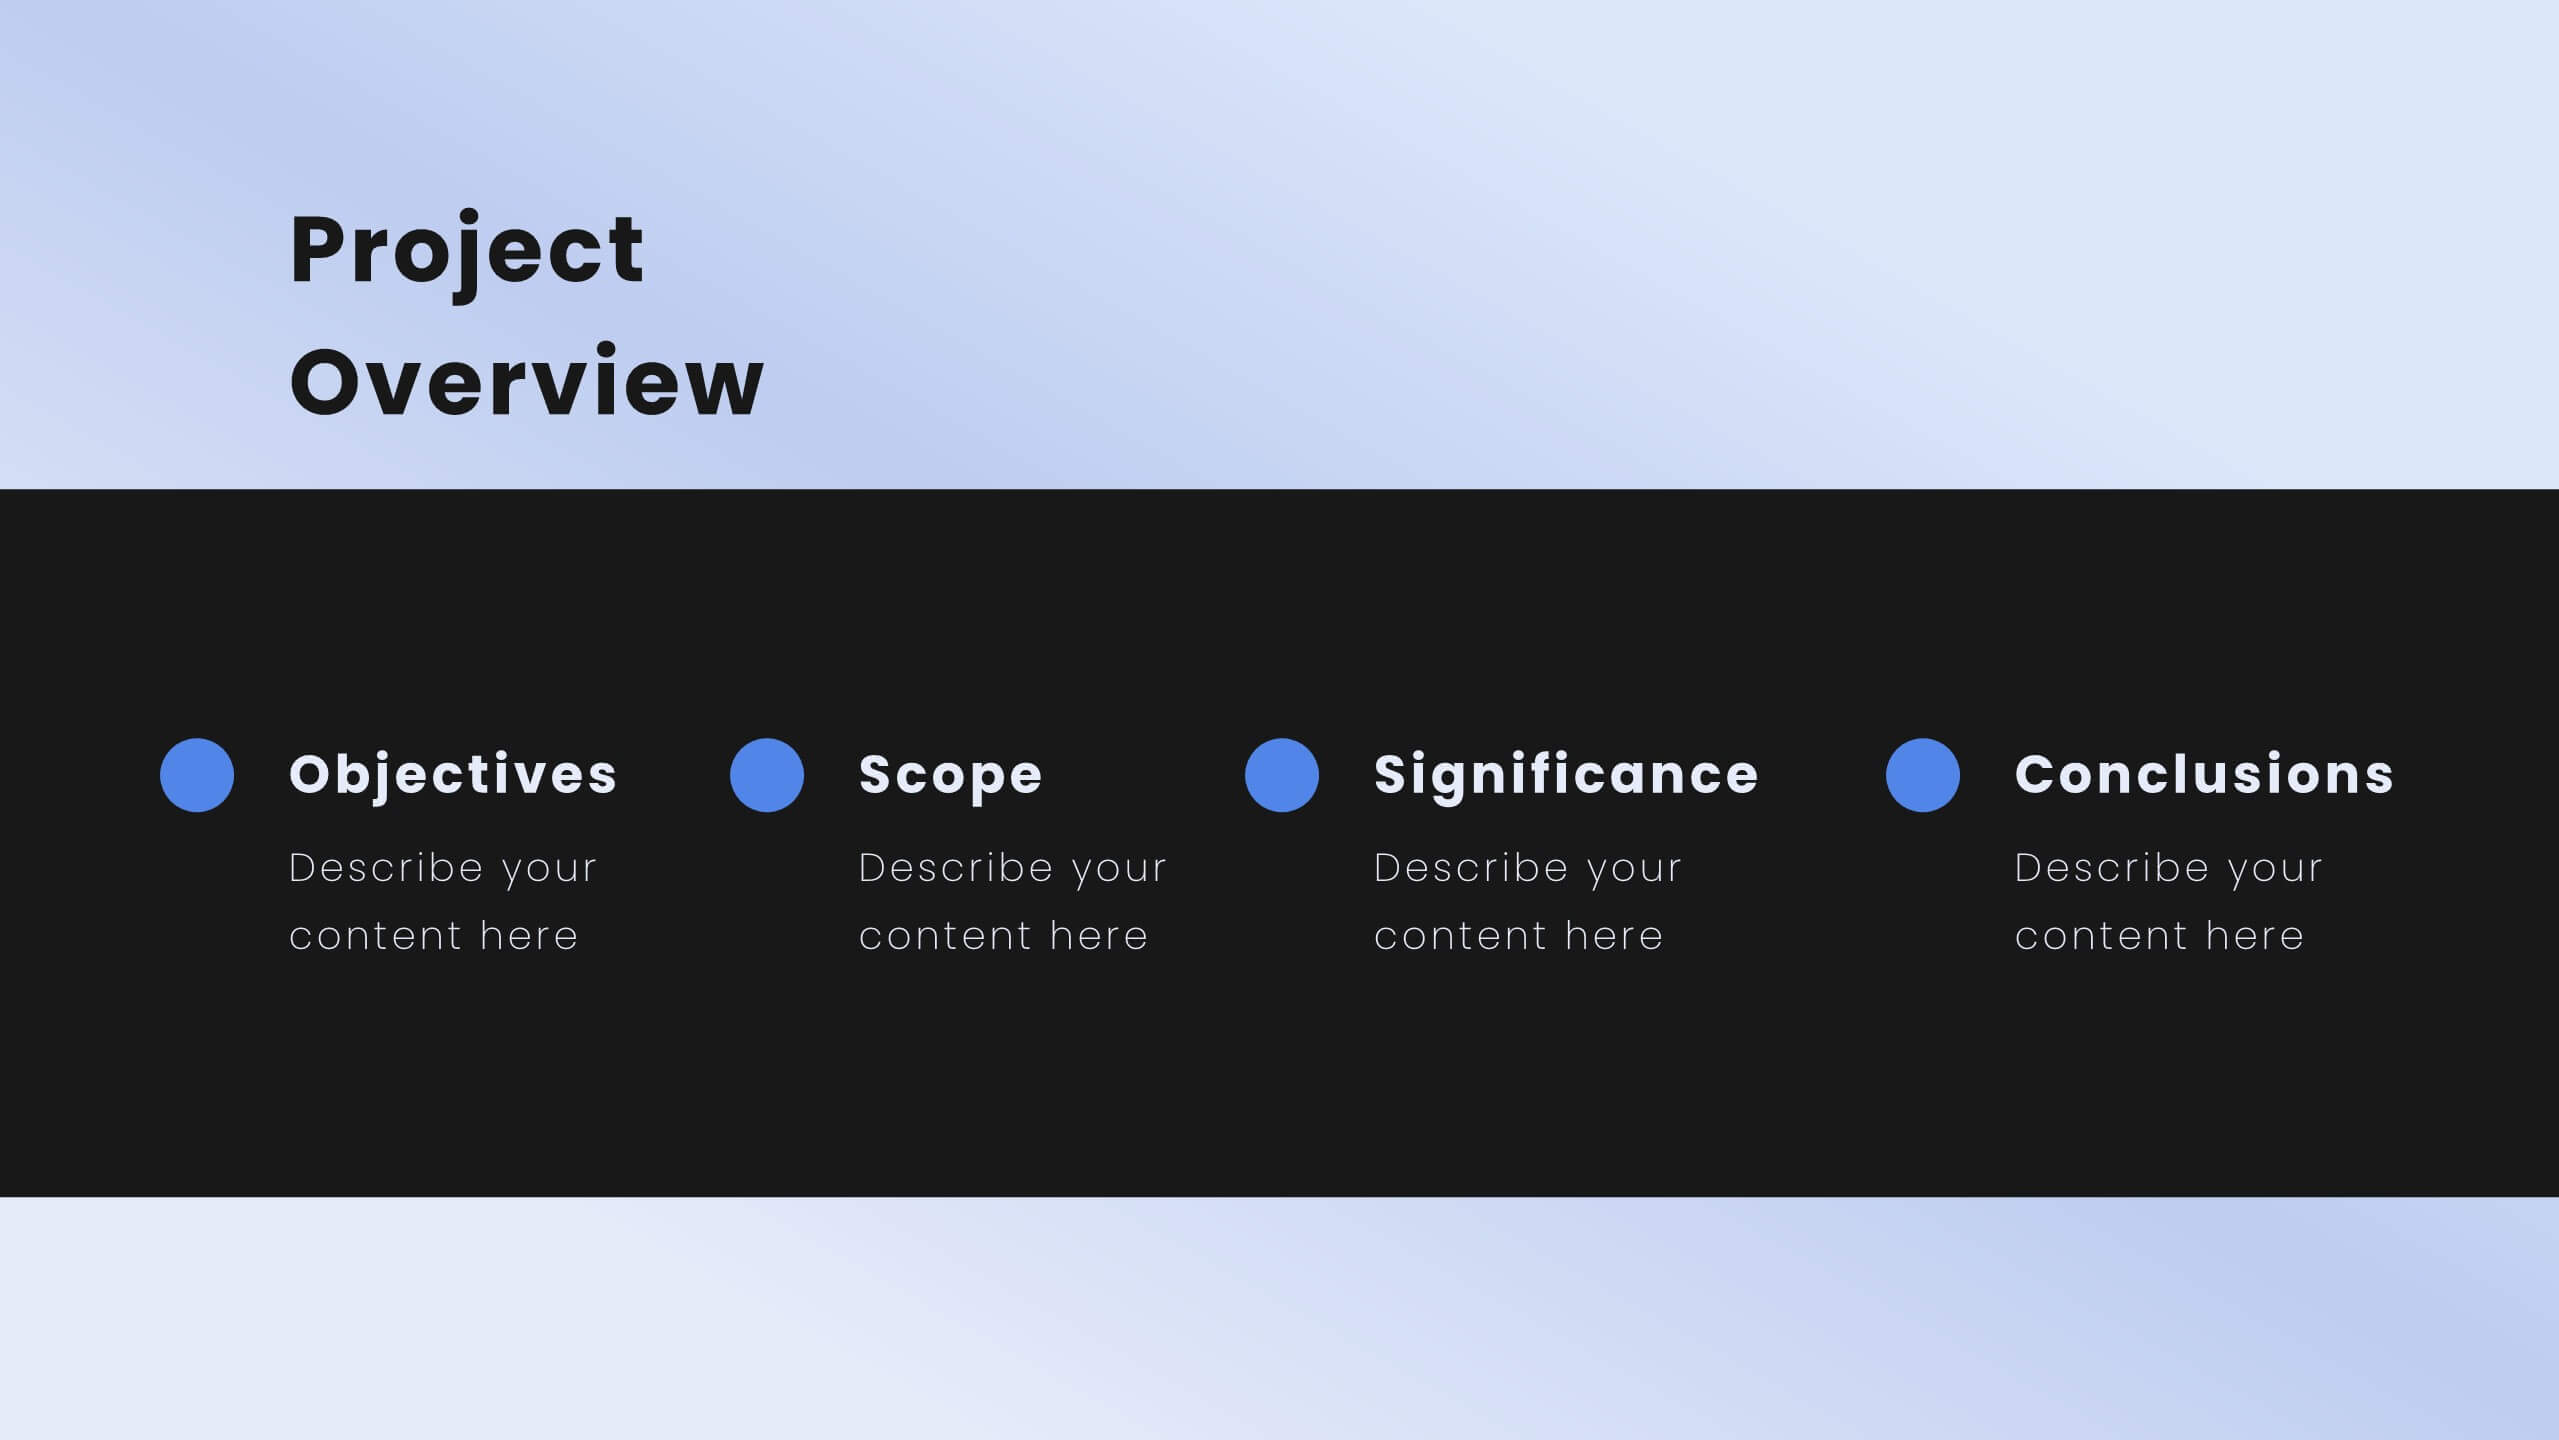
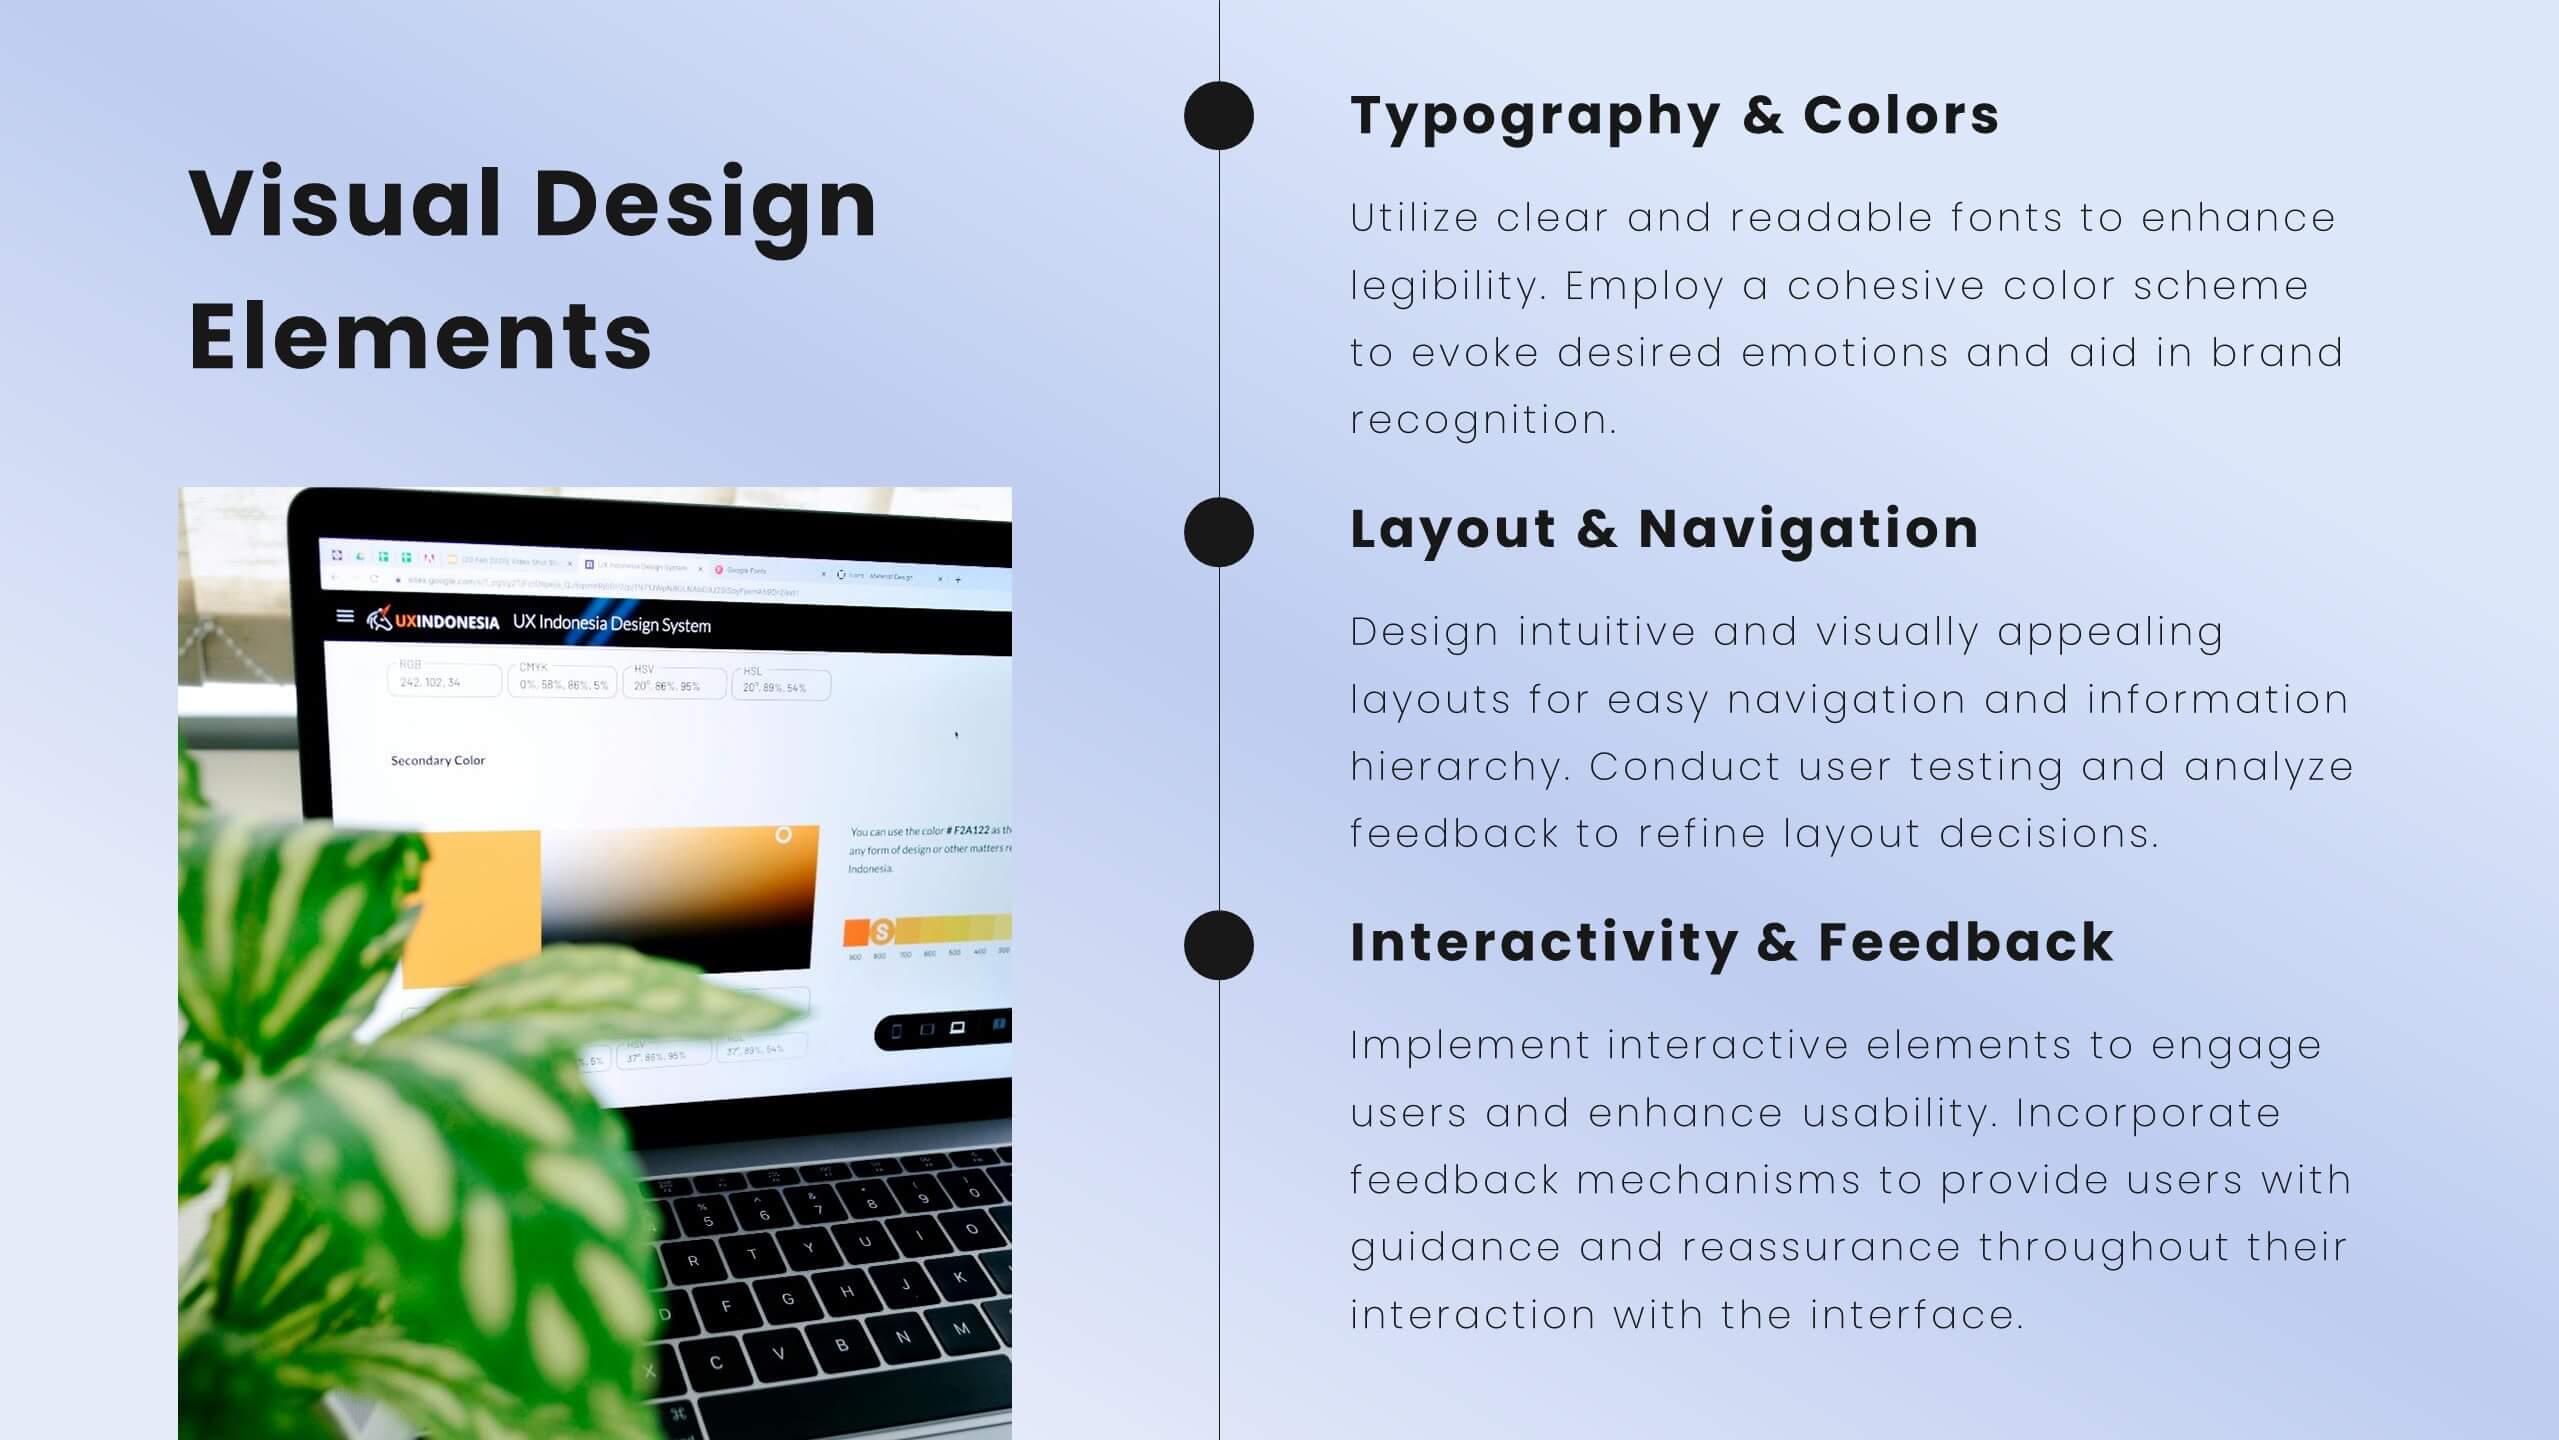
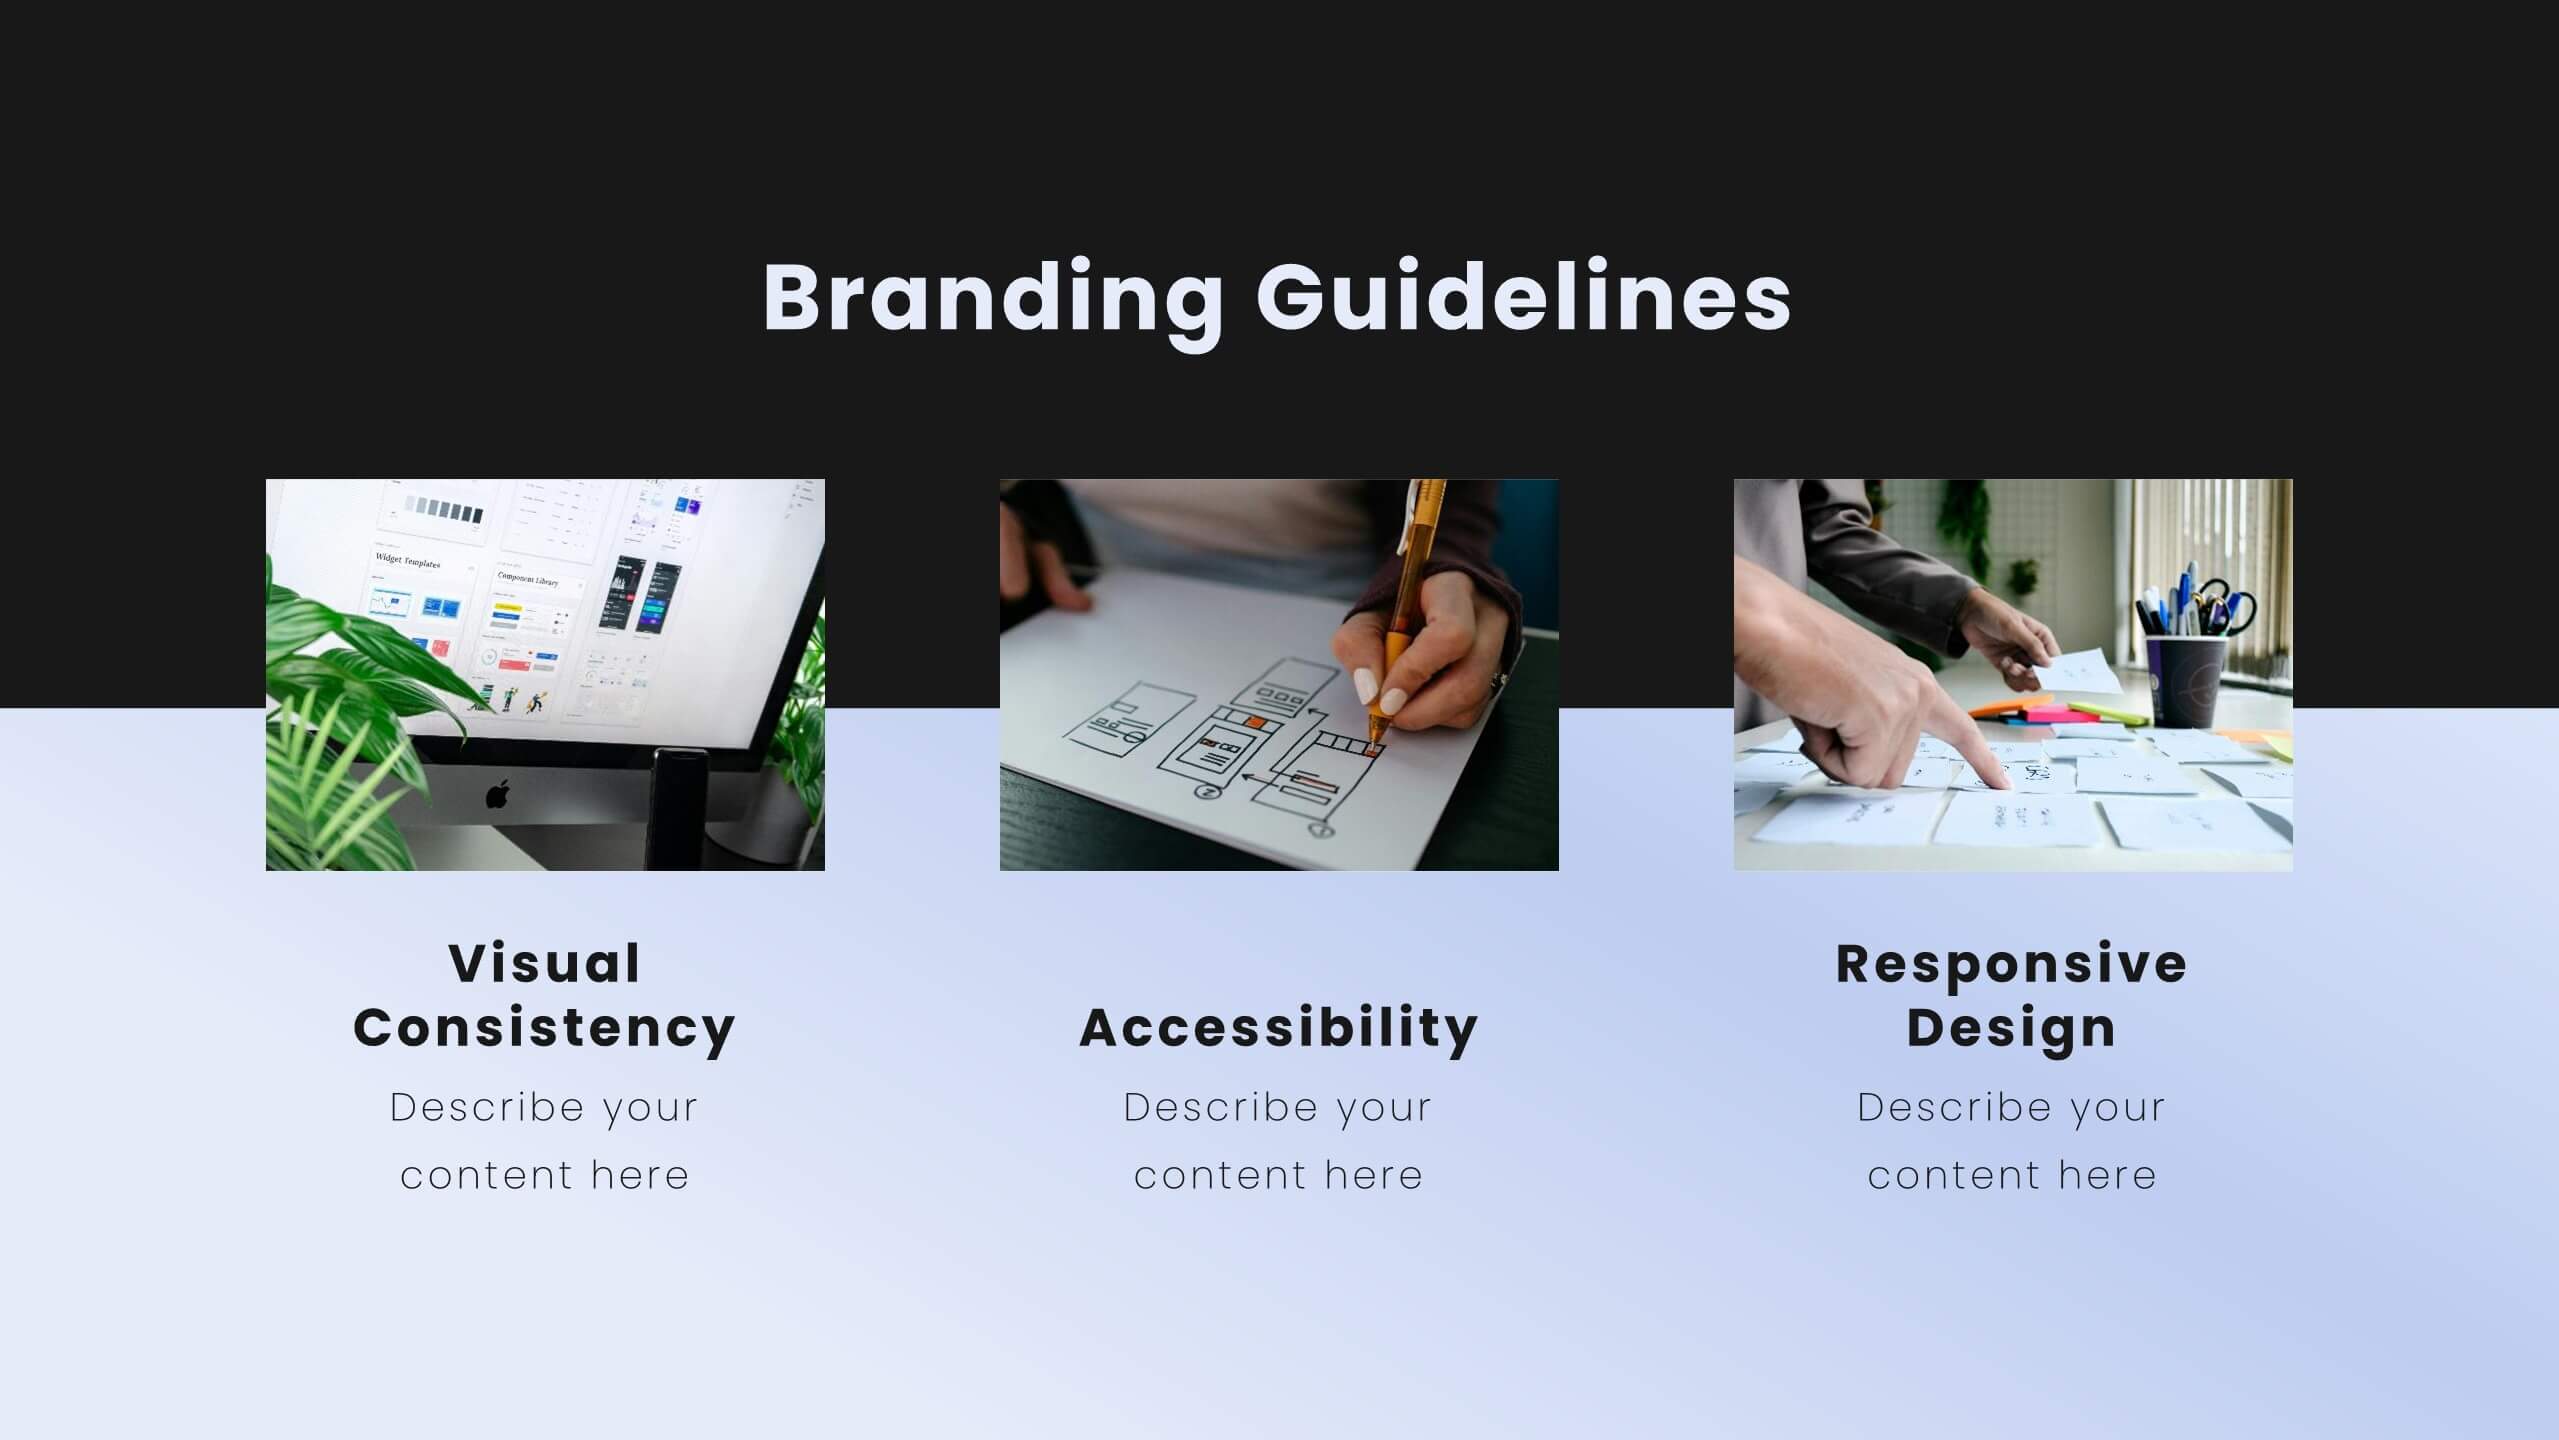
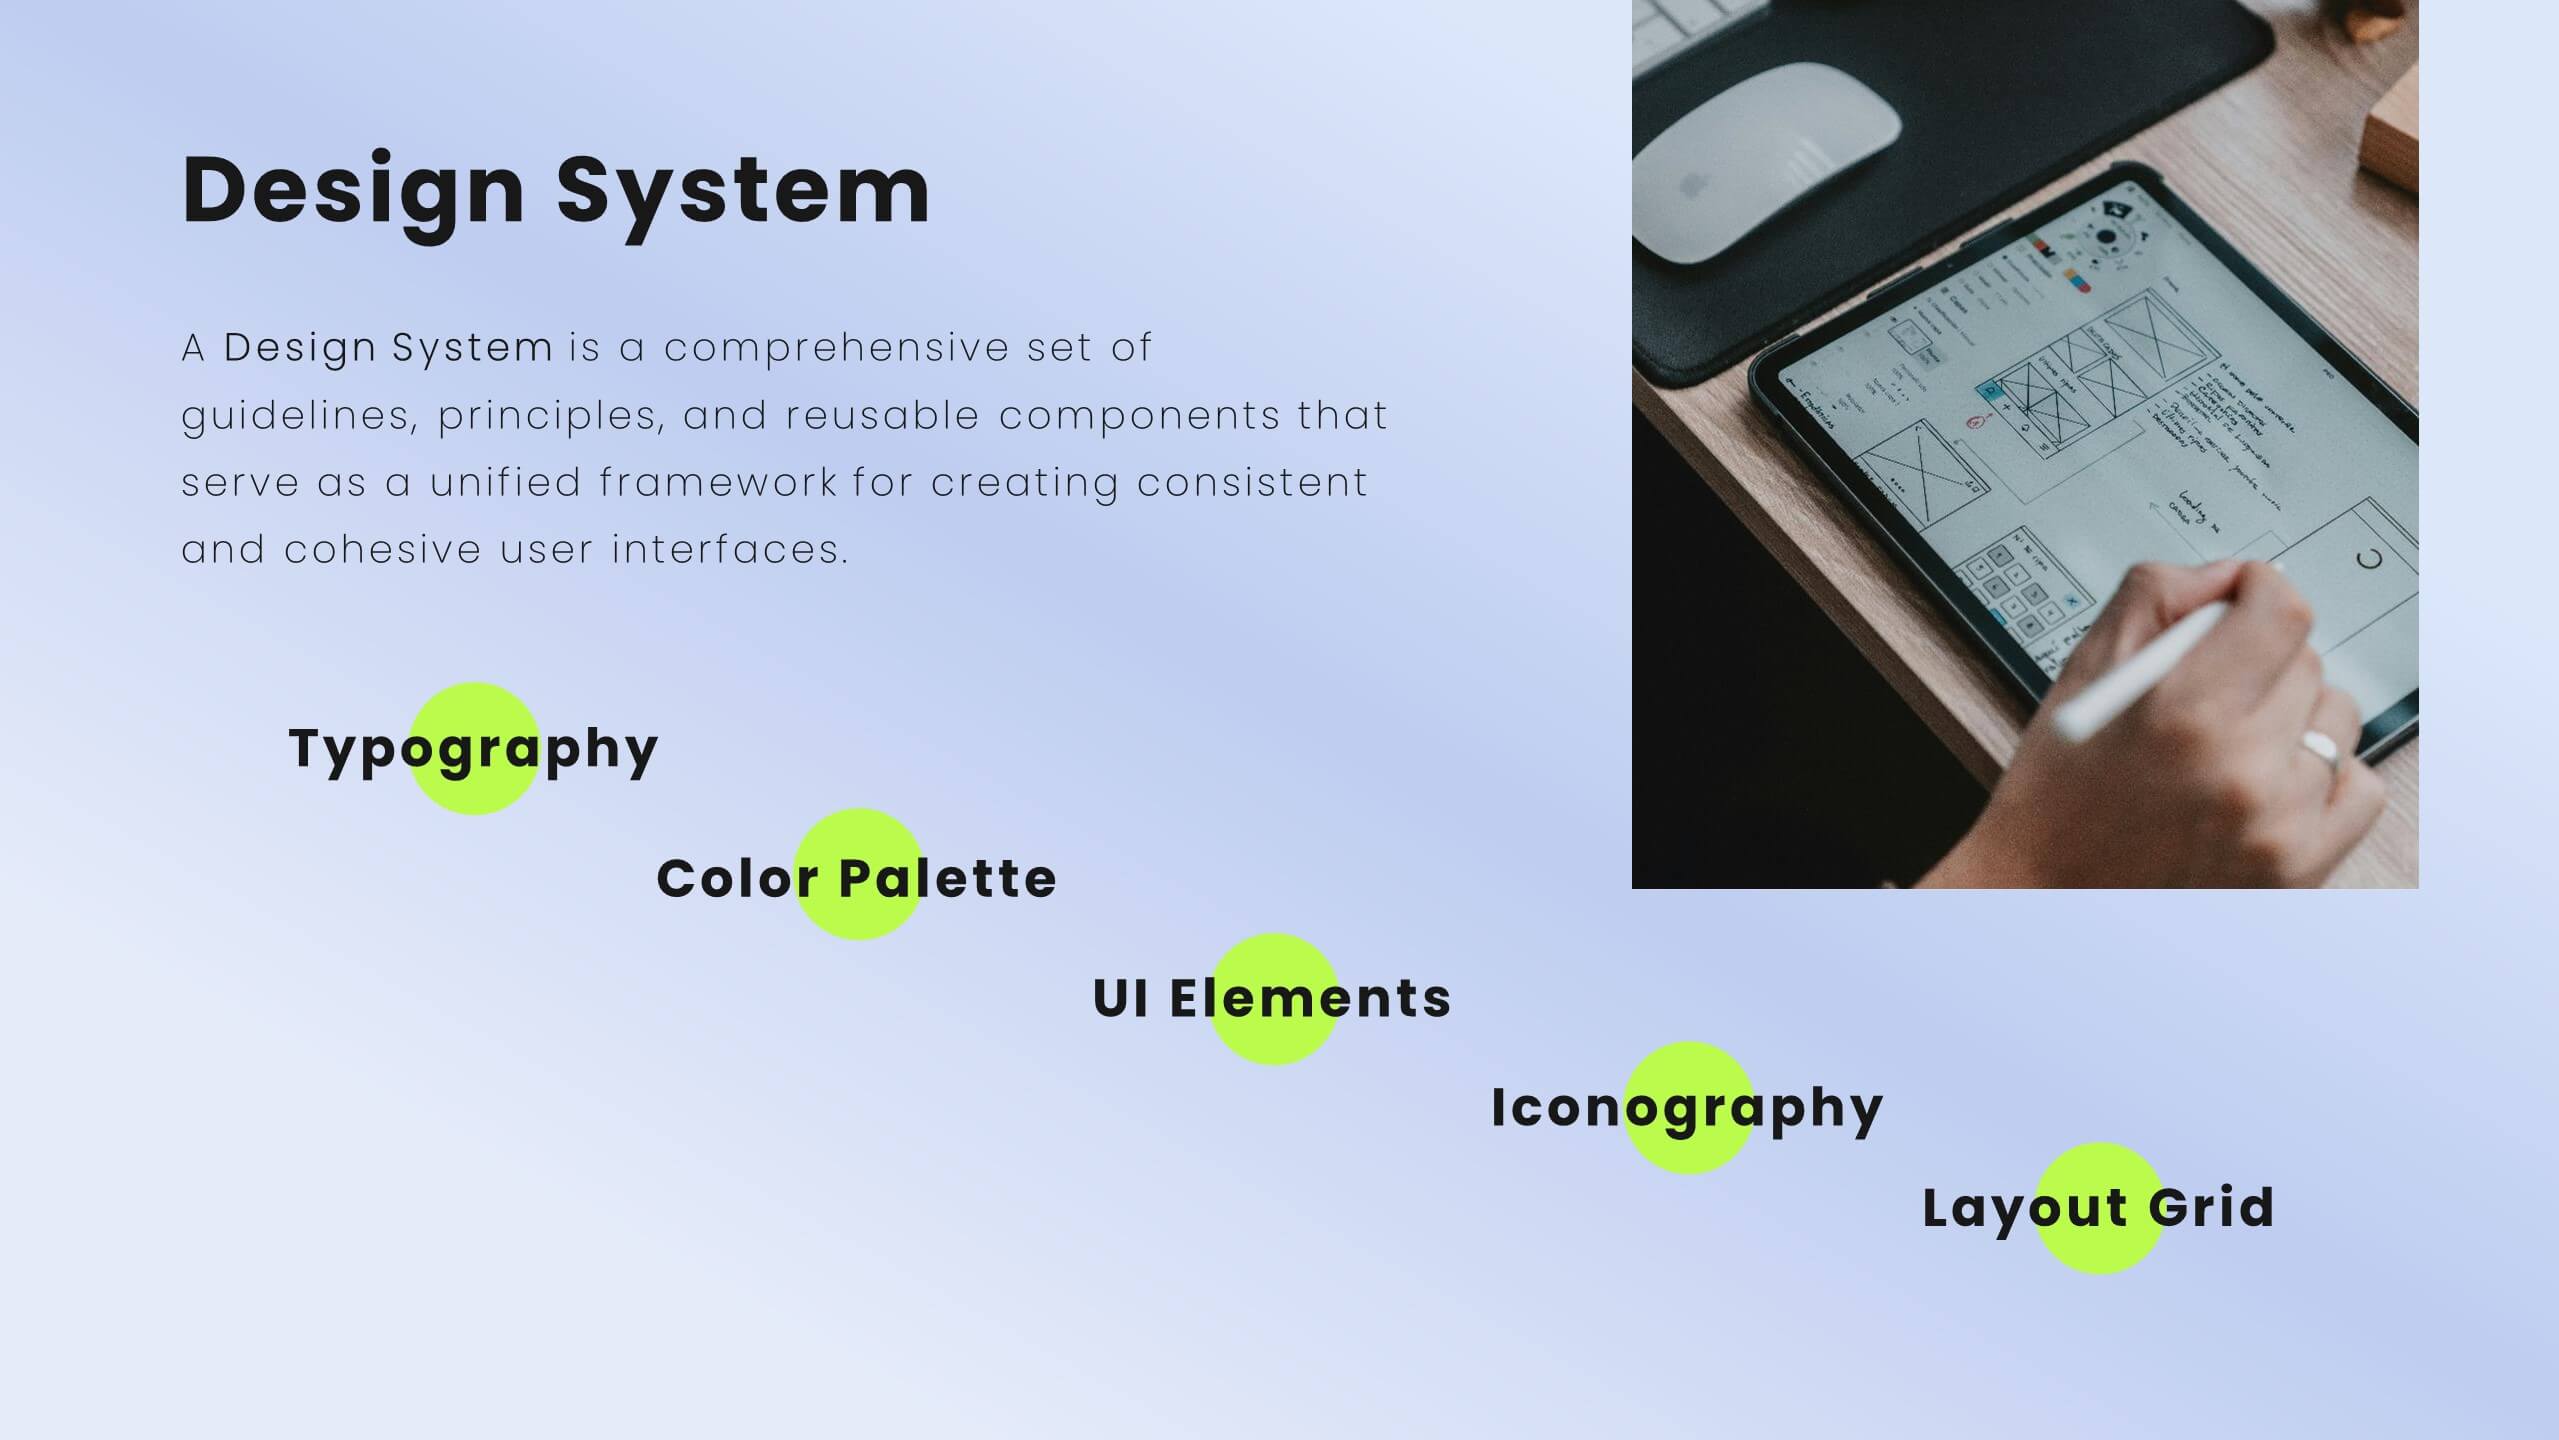
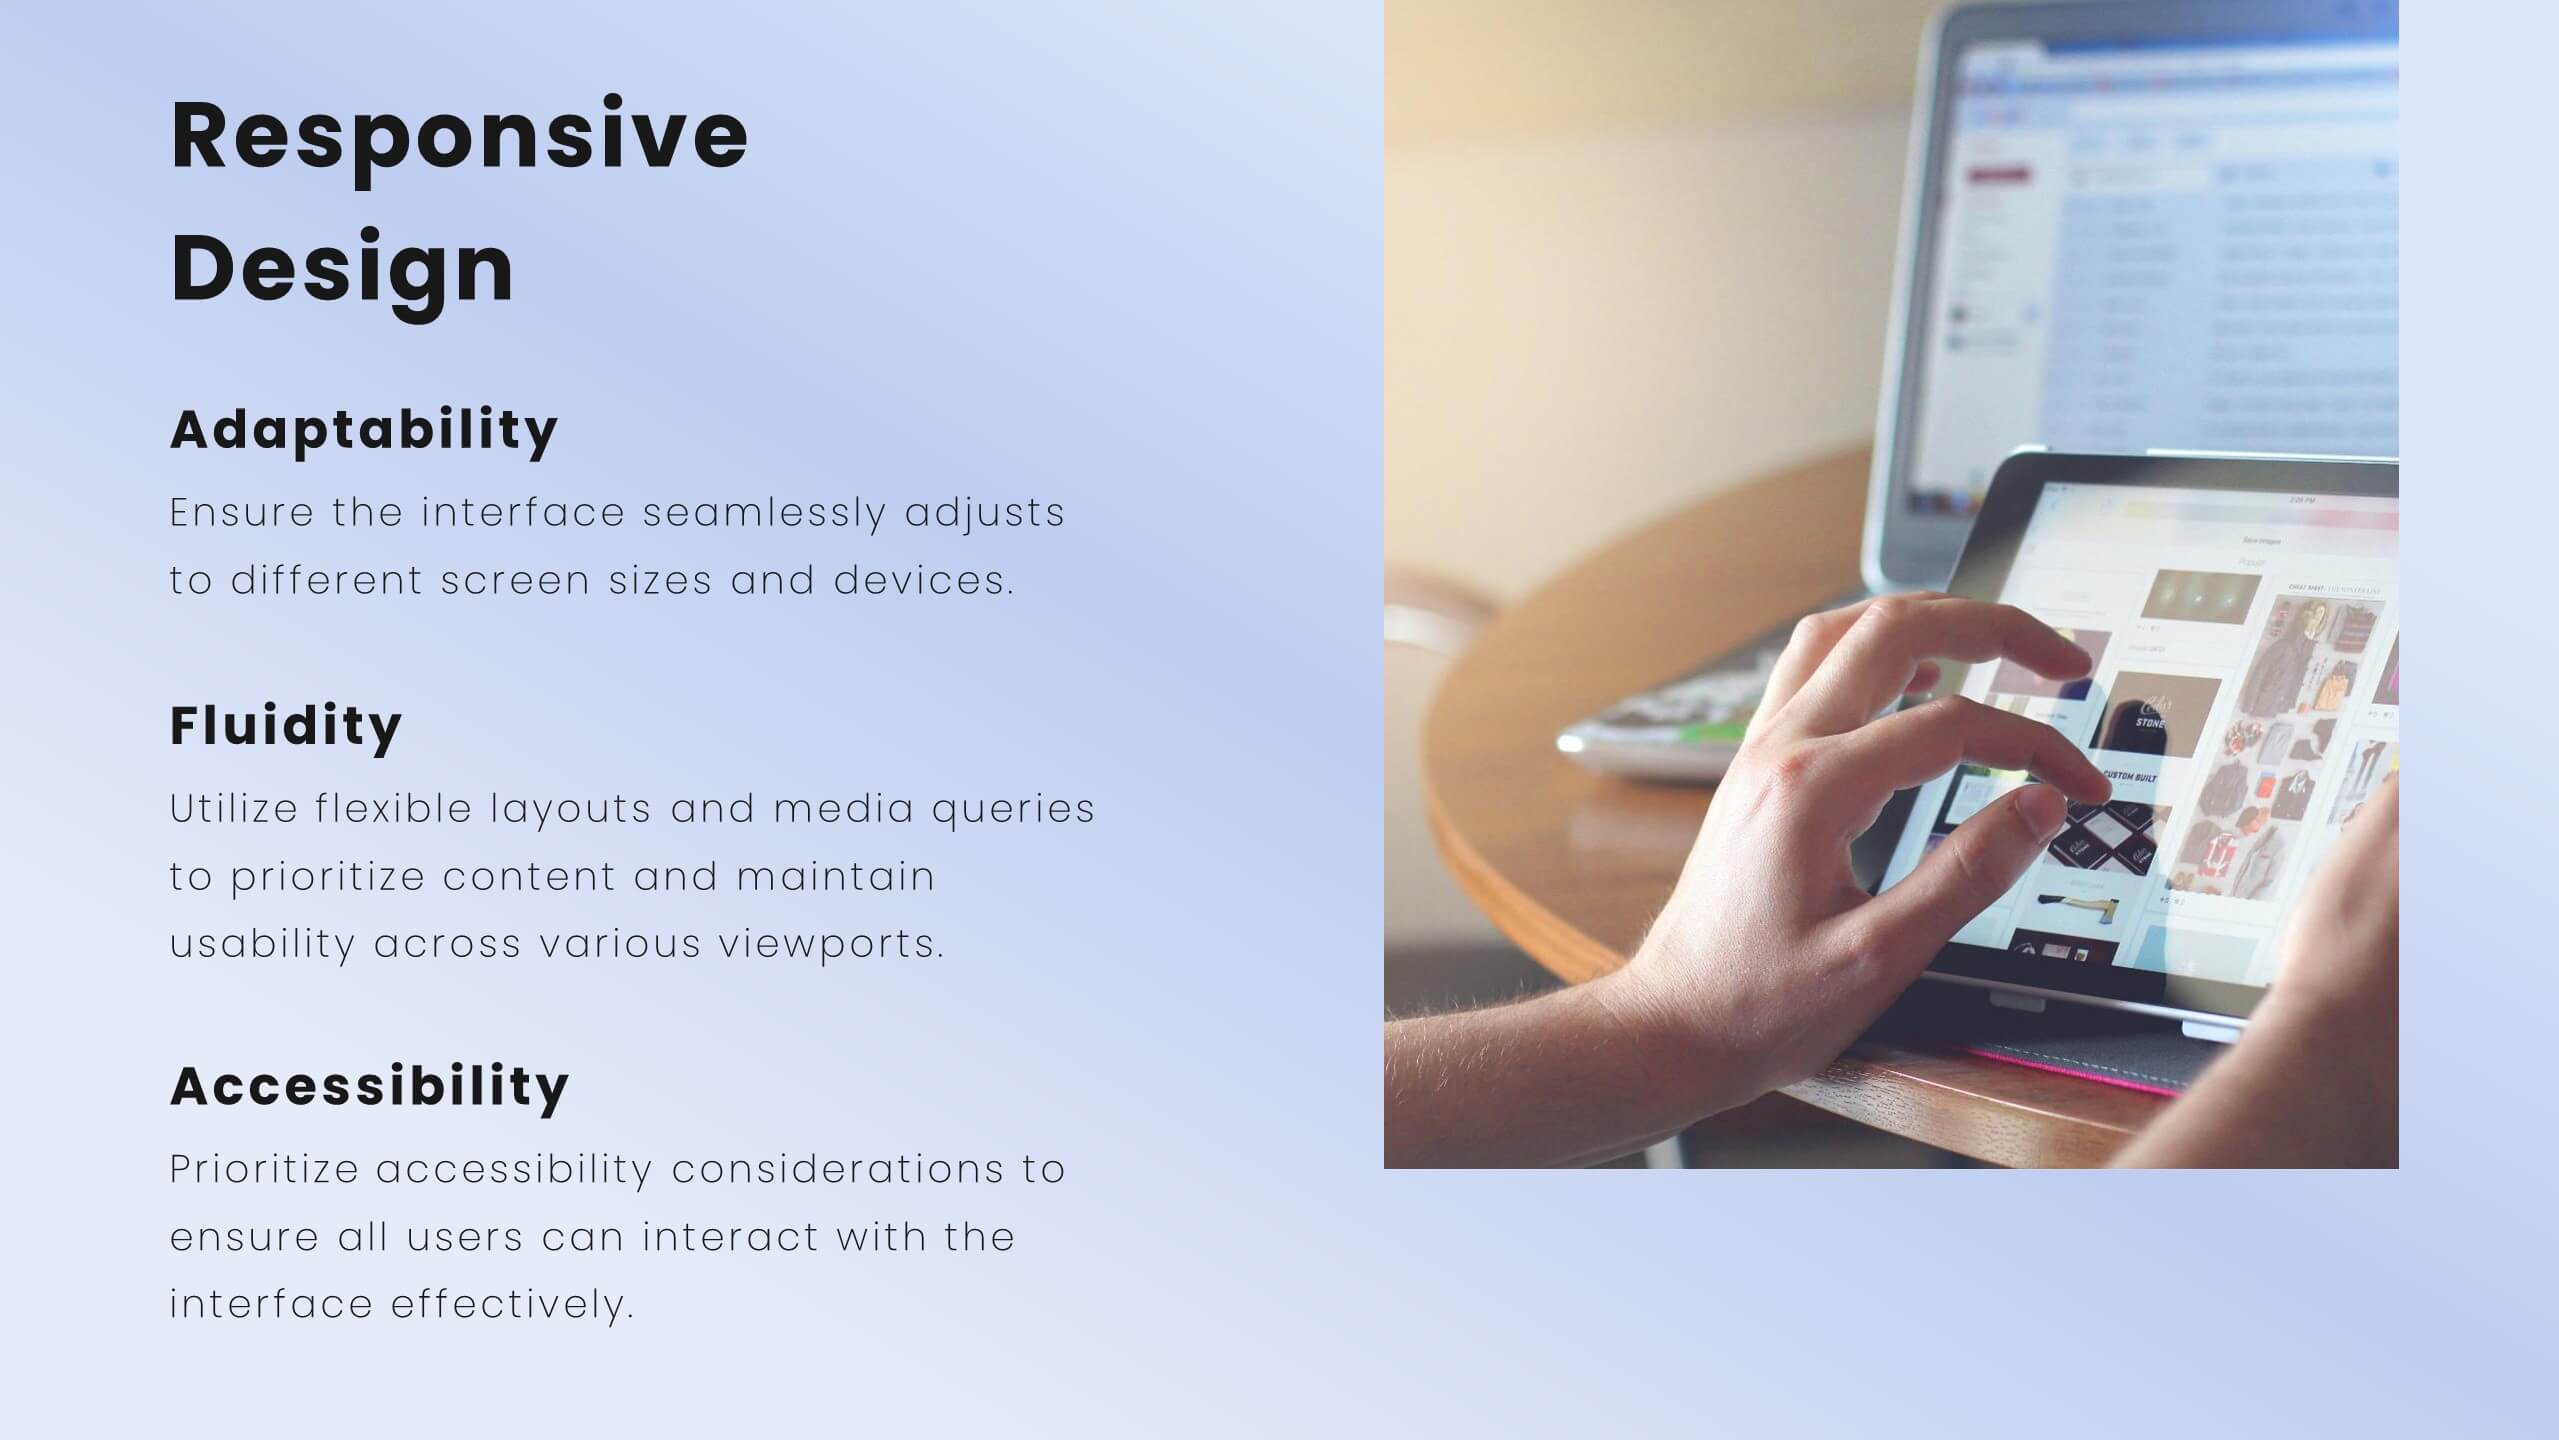
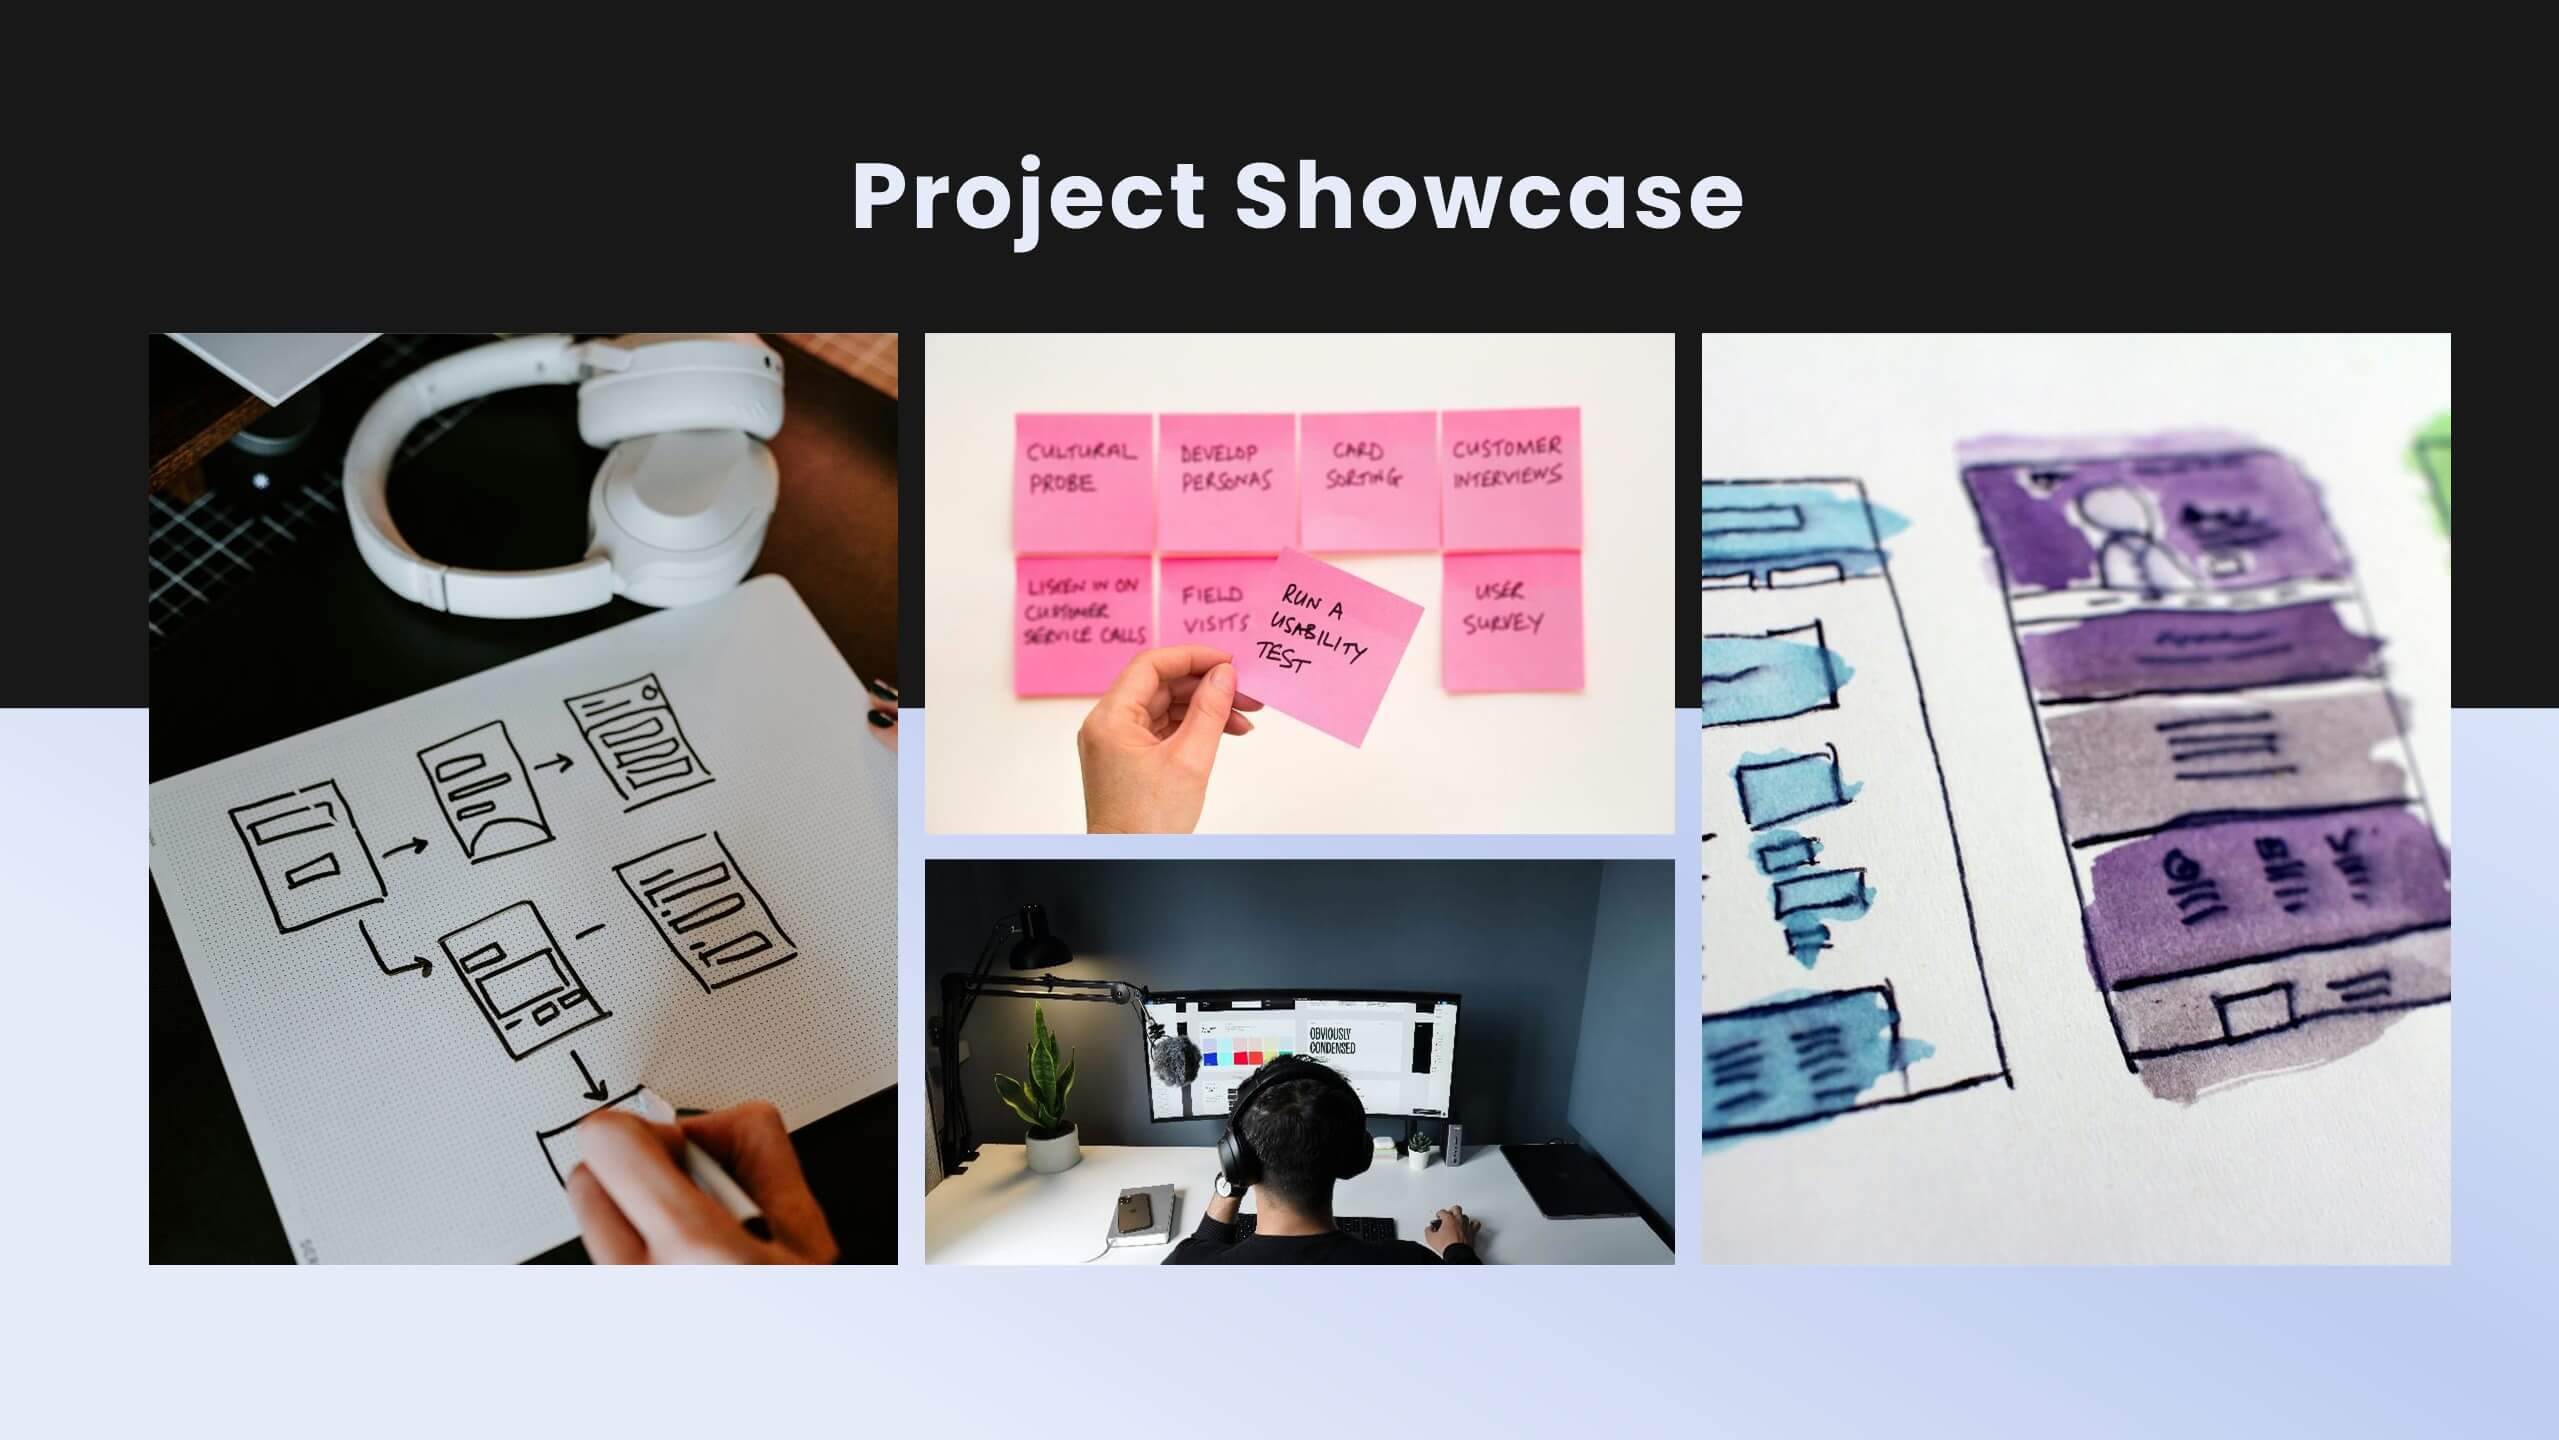
Jigsaw User Experience Proposal Presentation
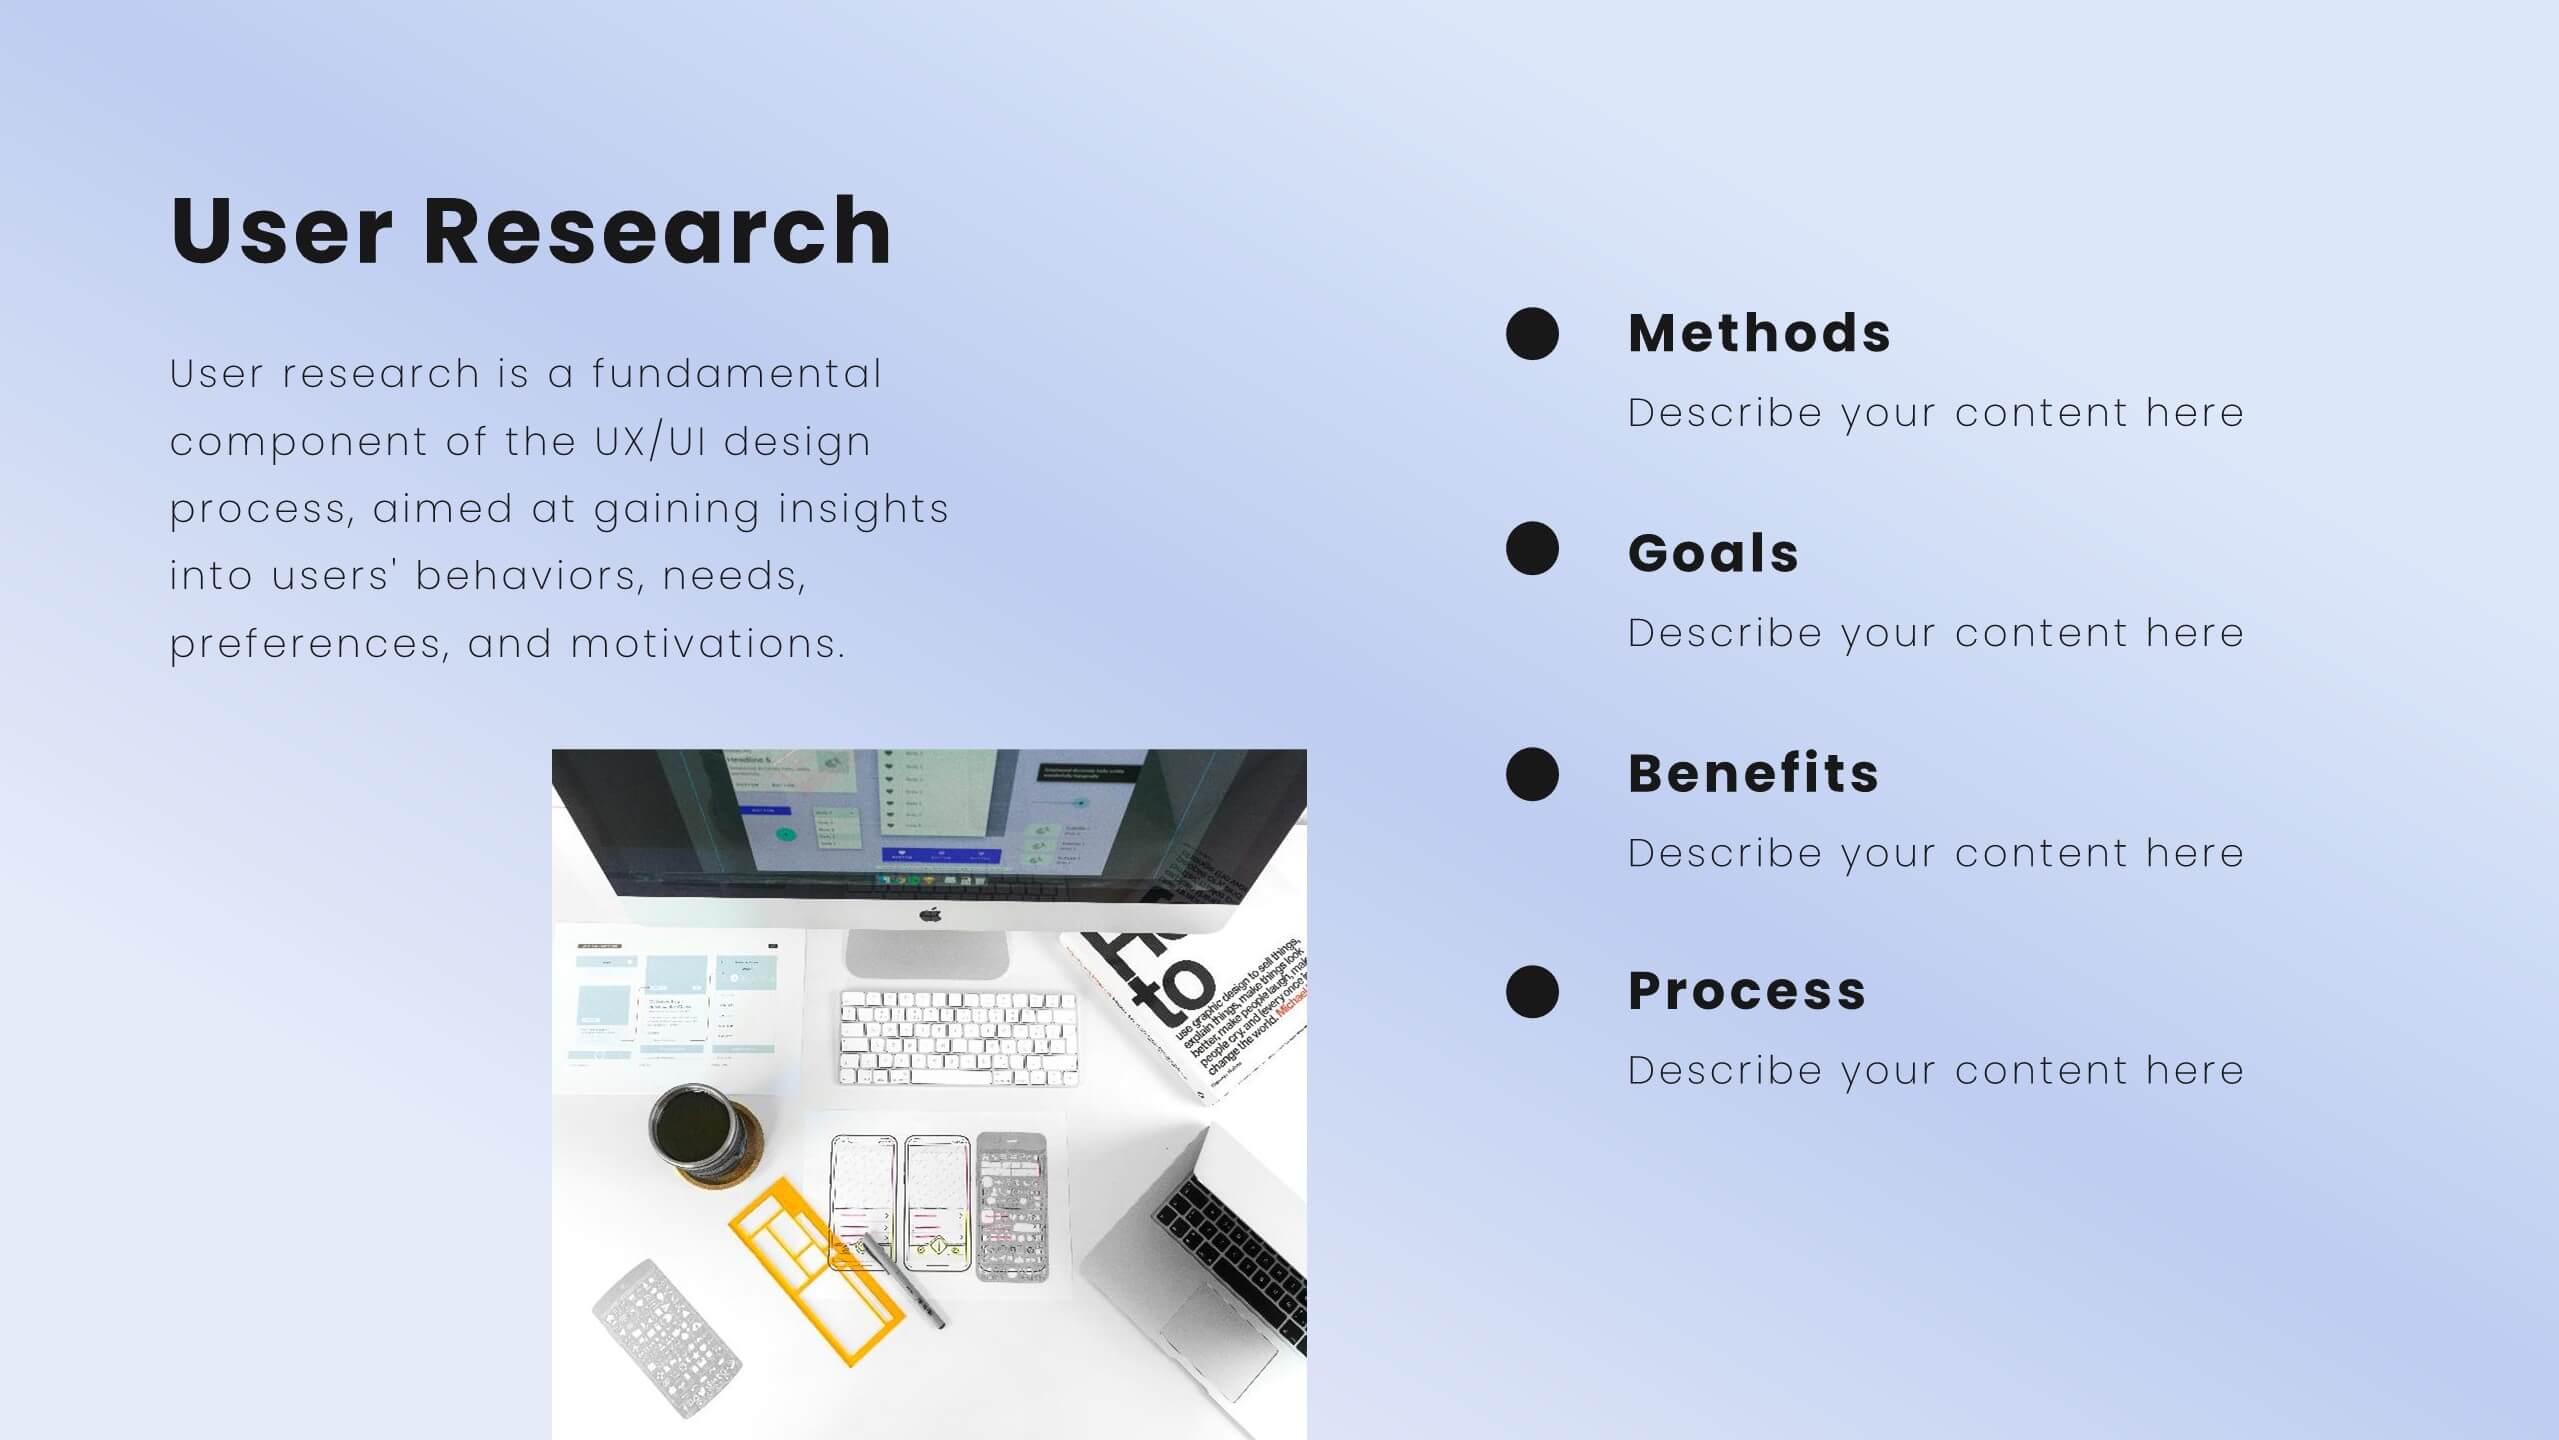
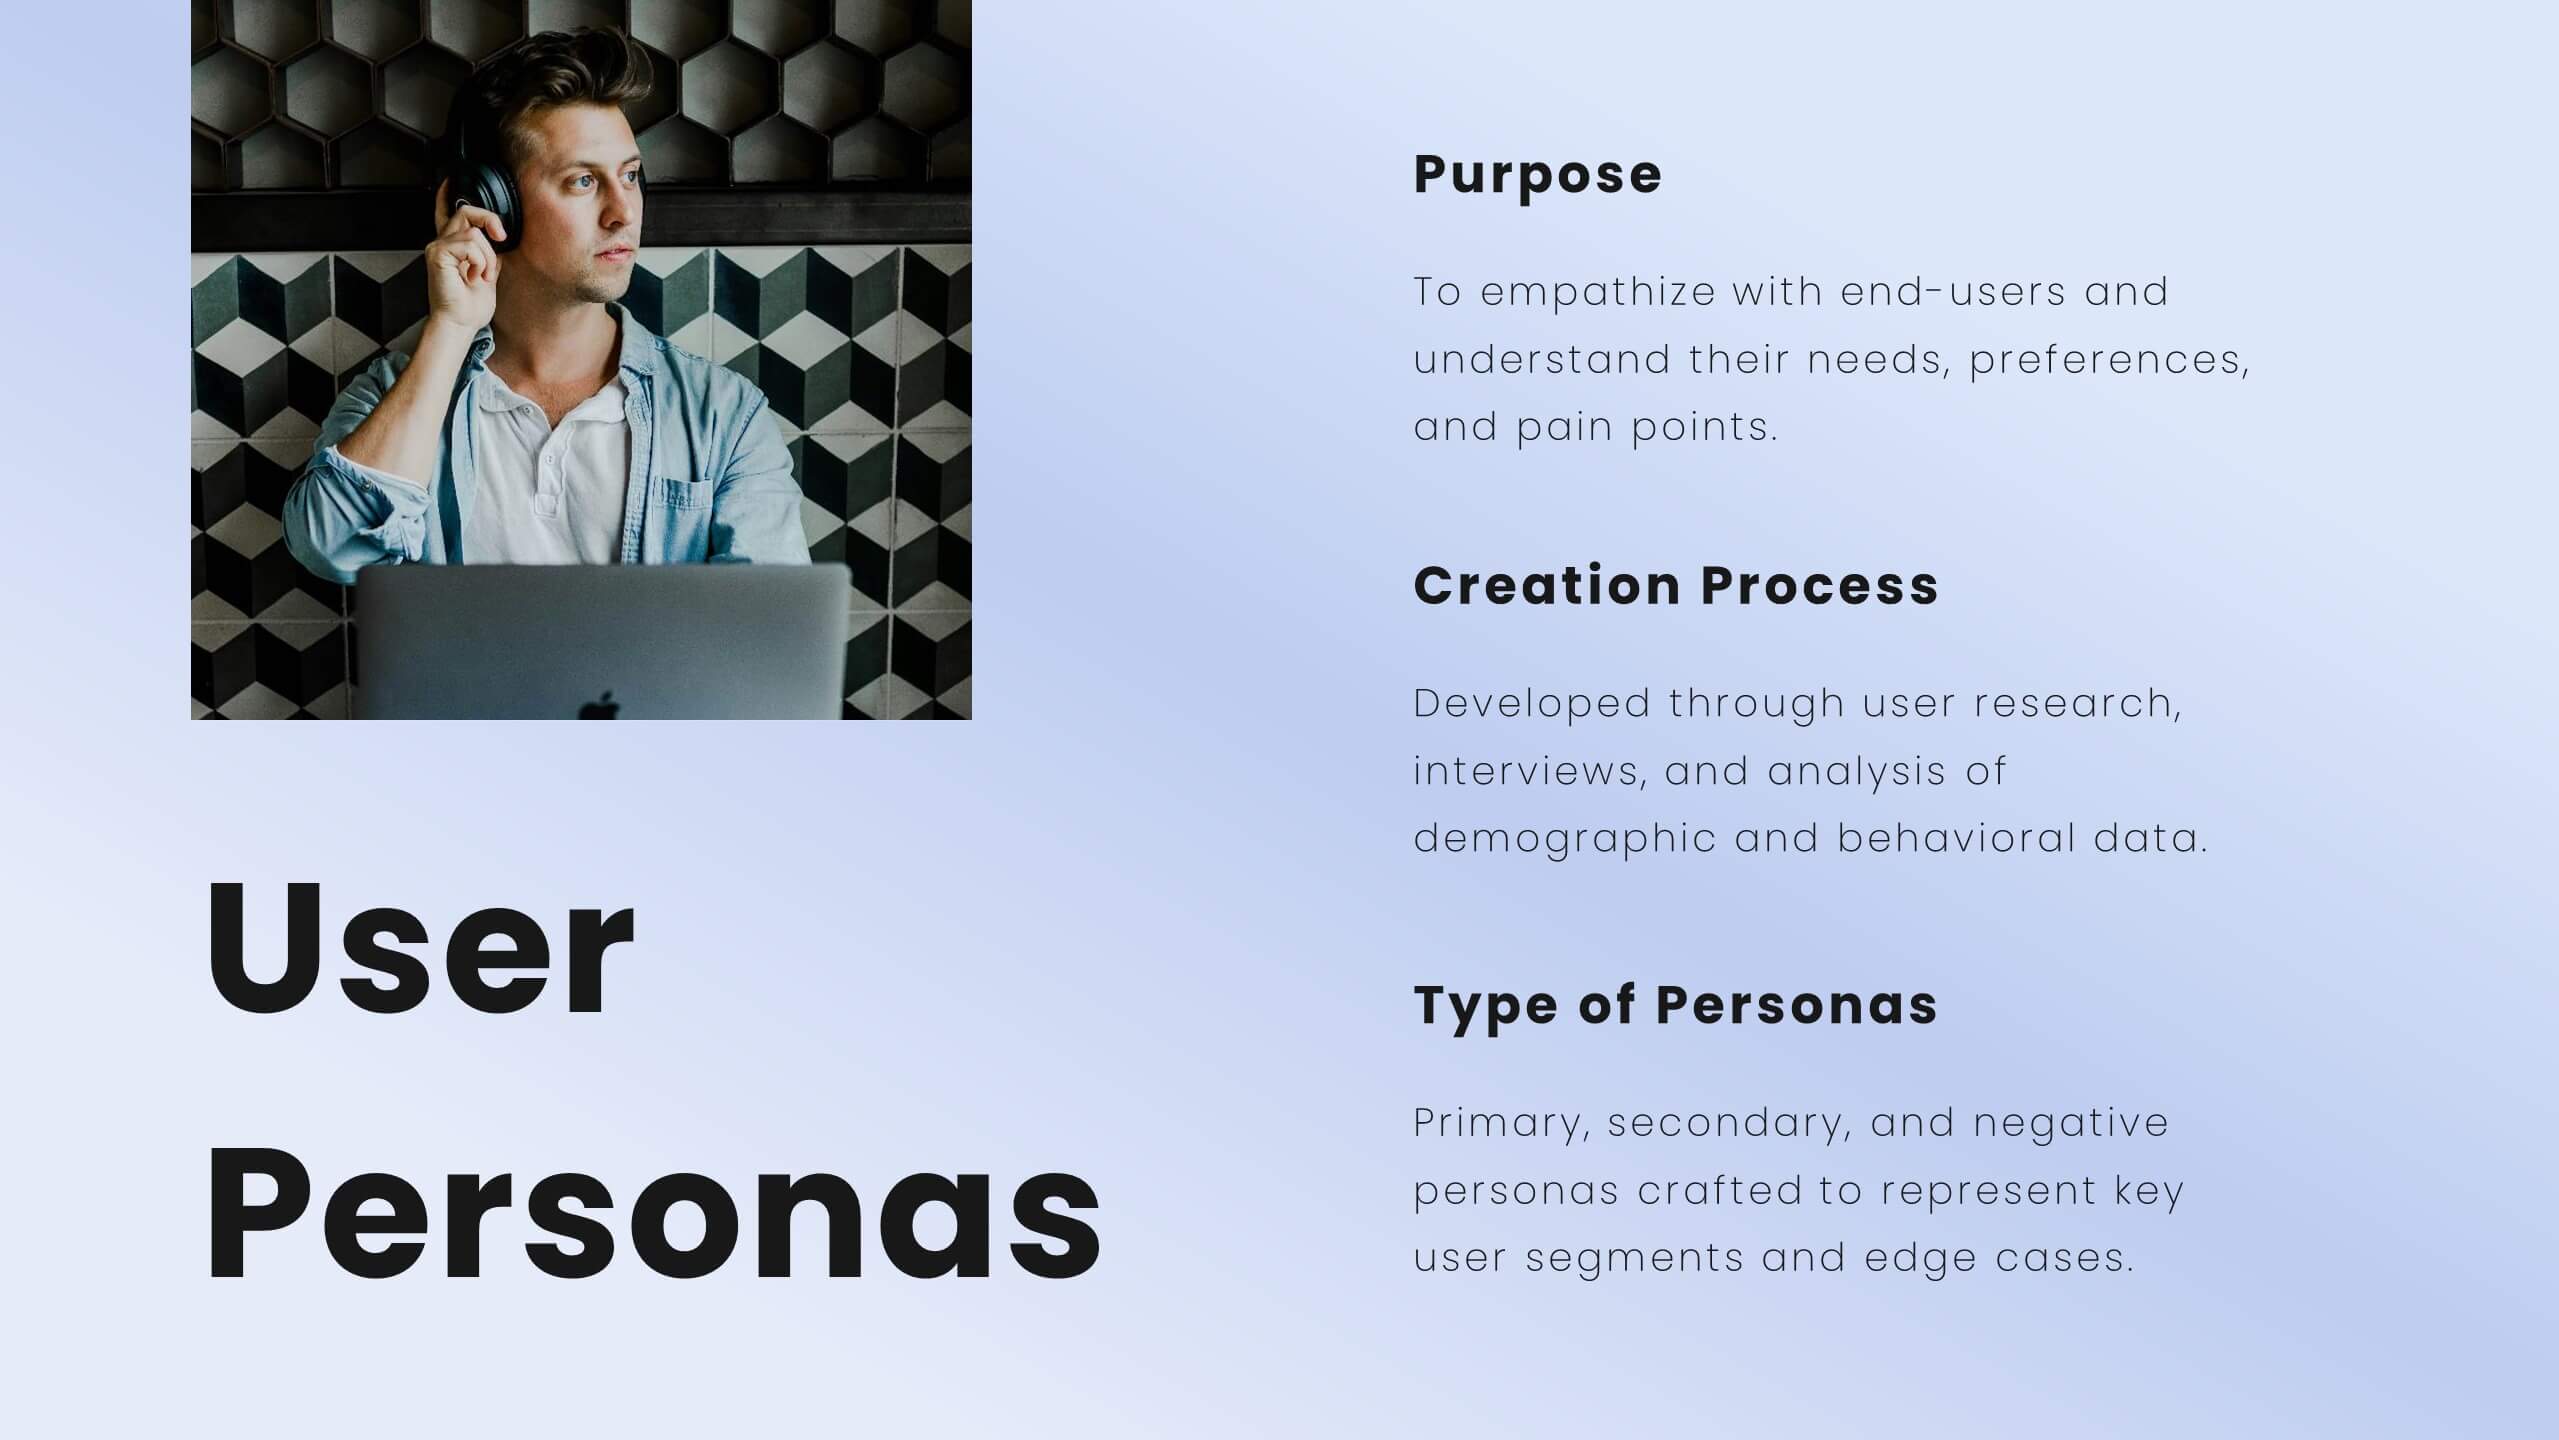
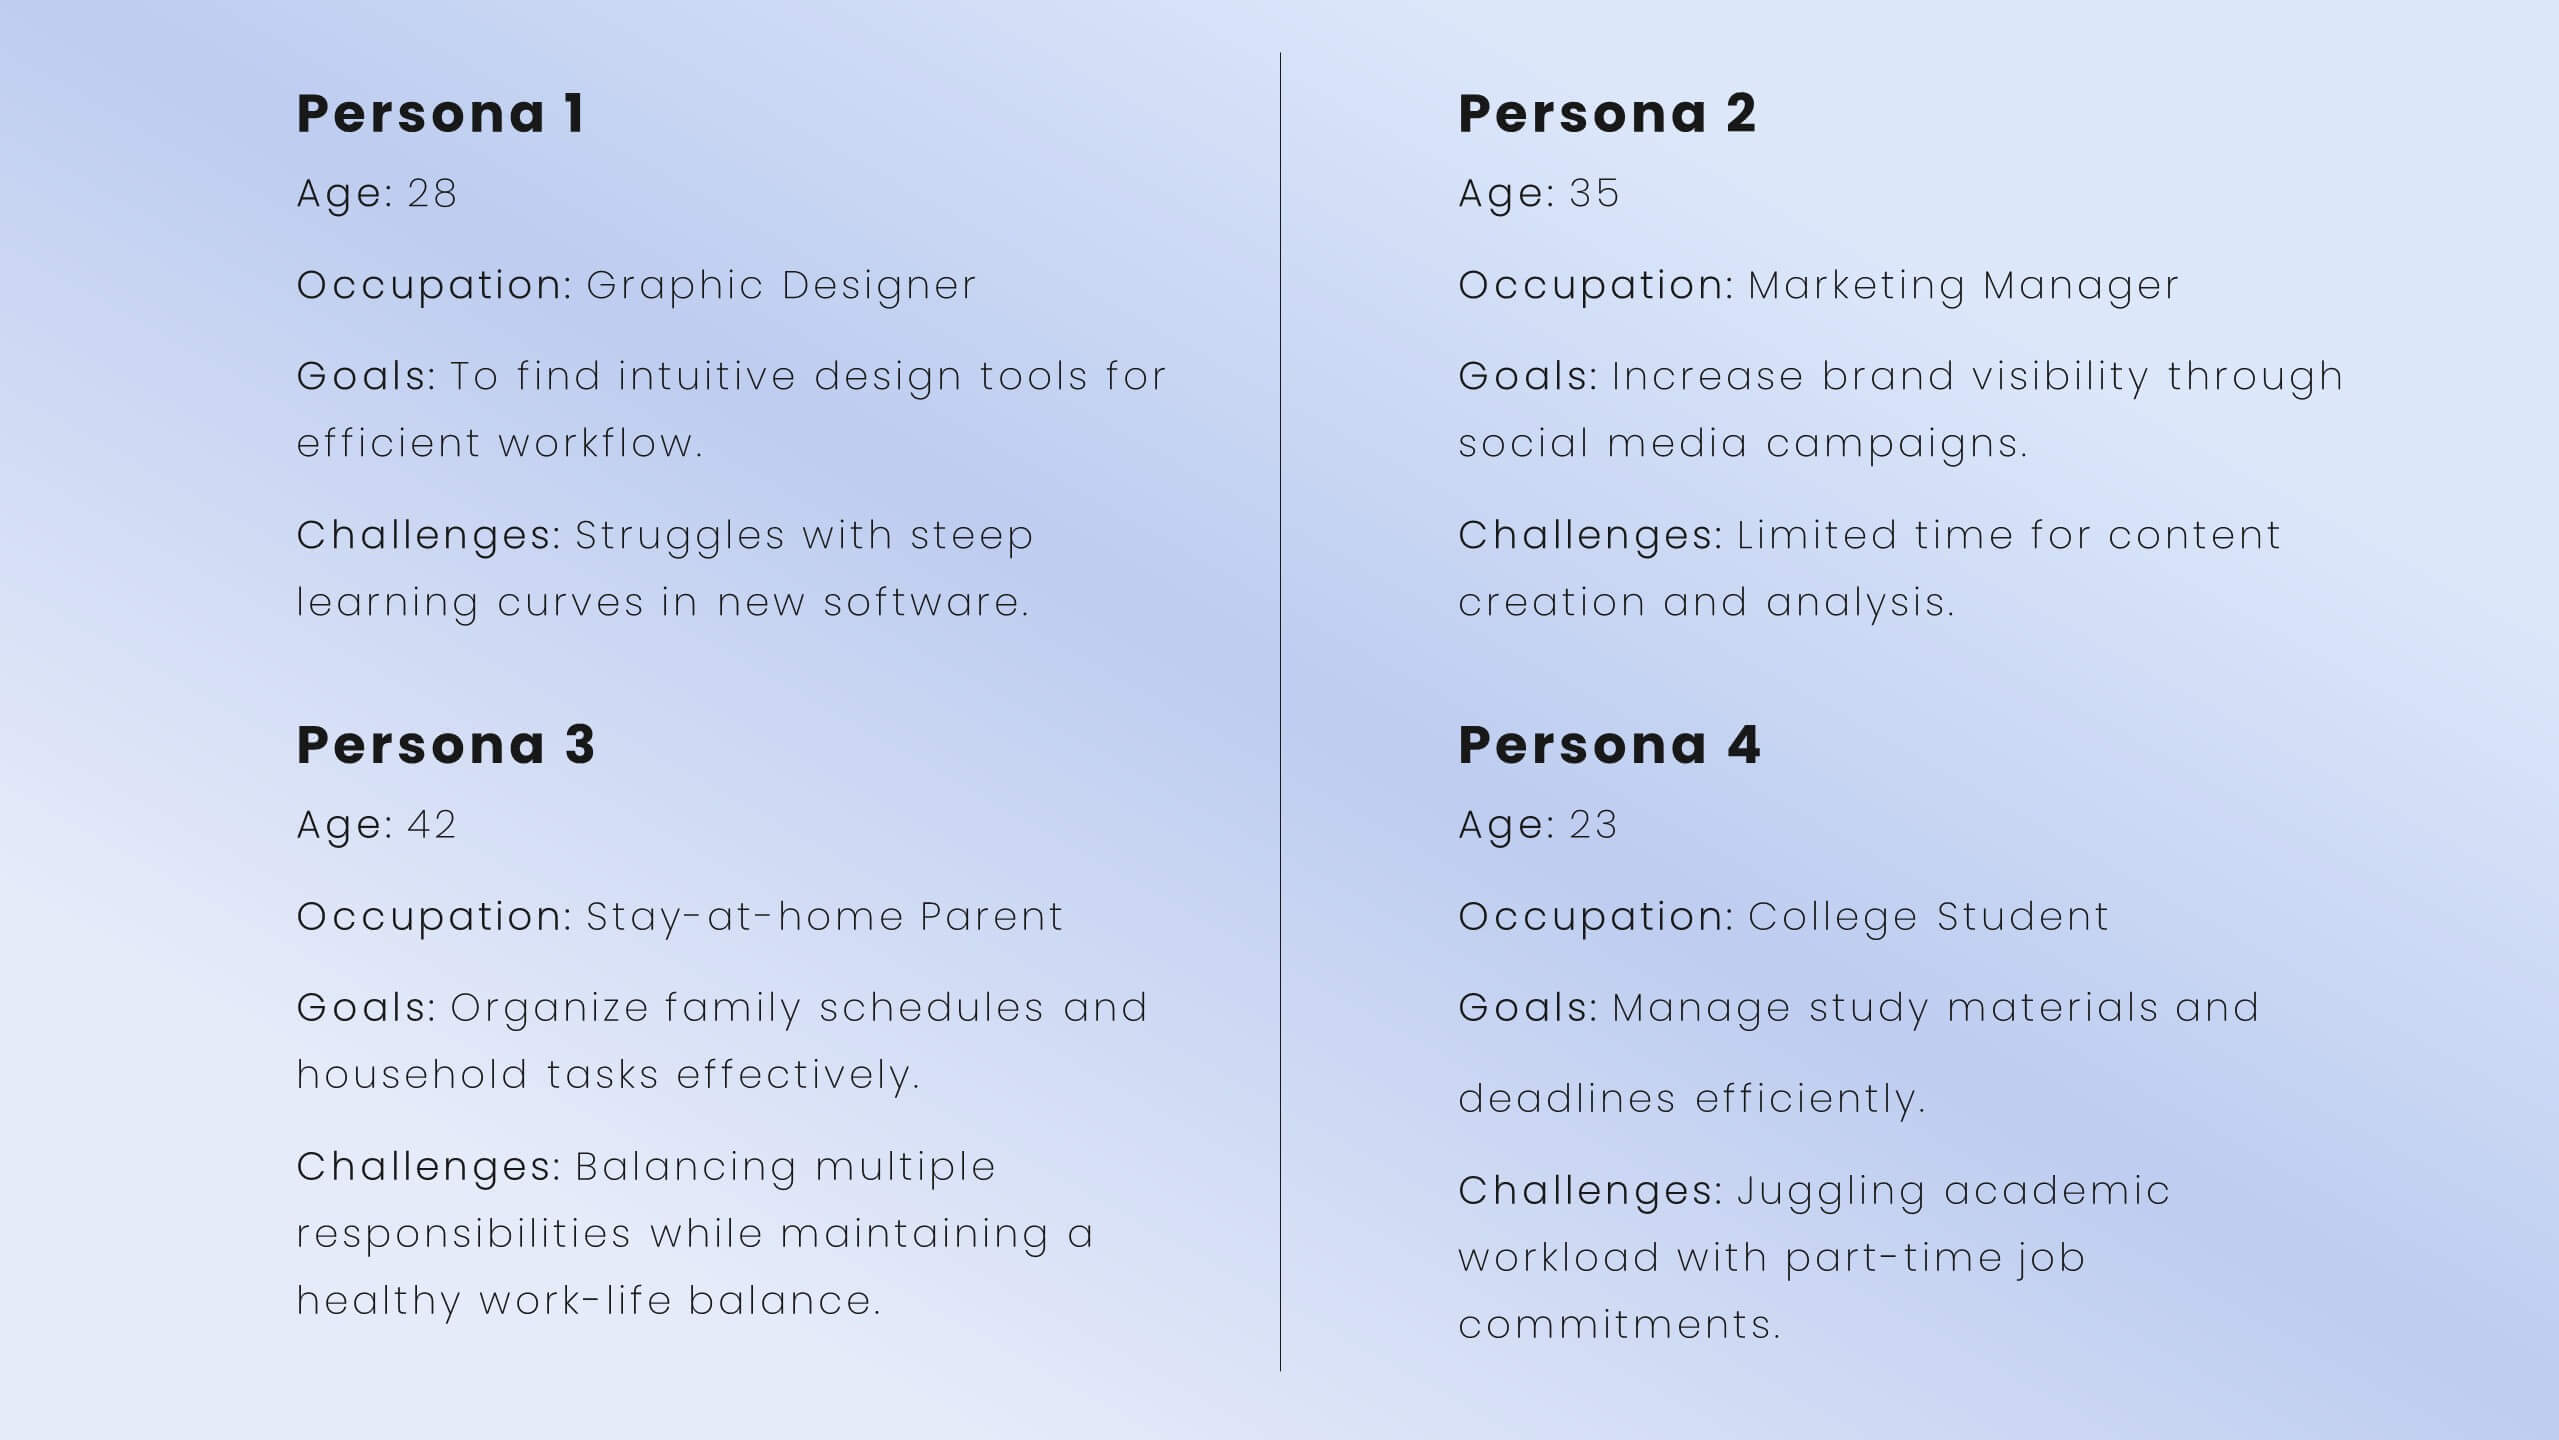
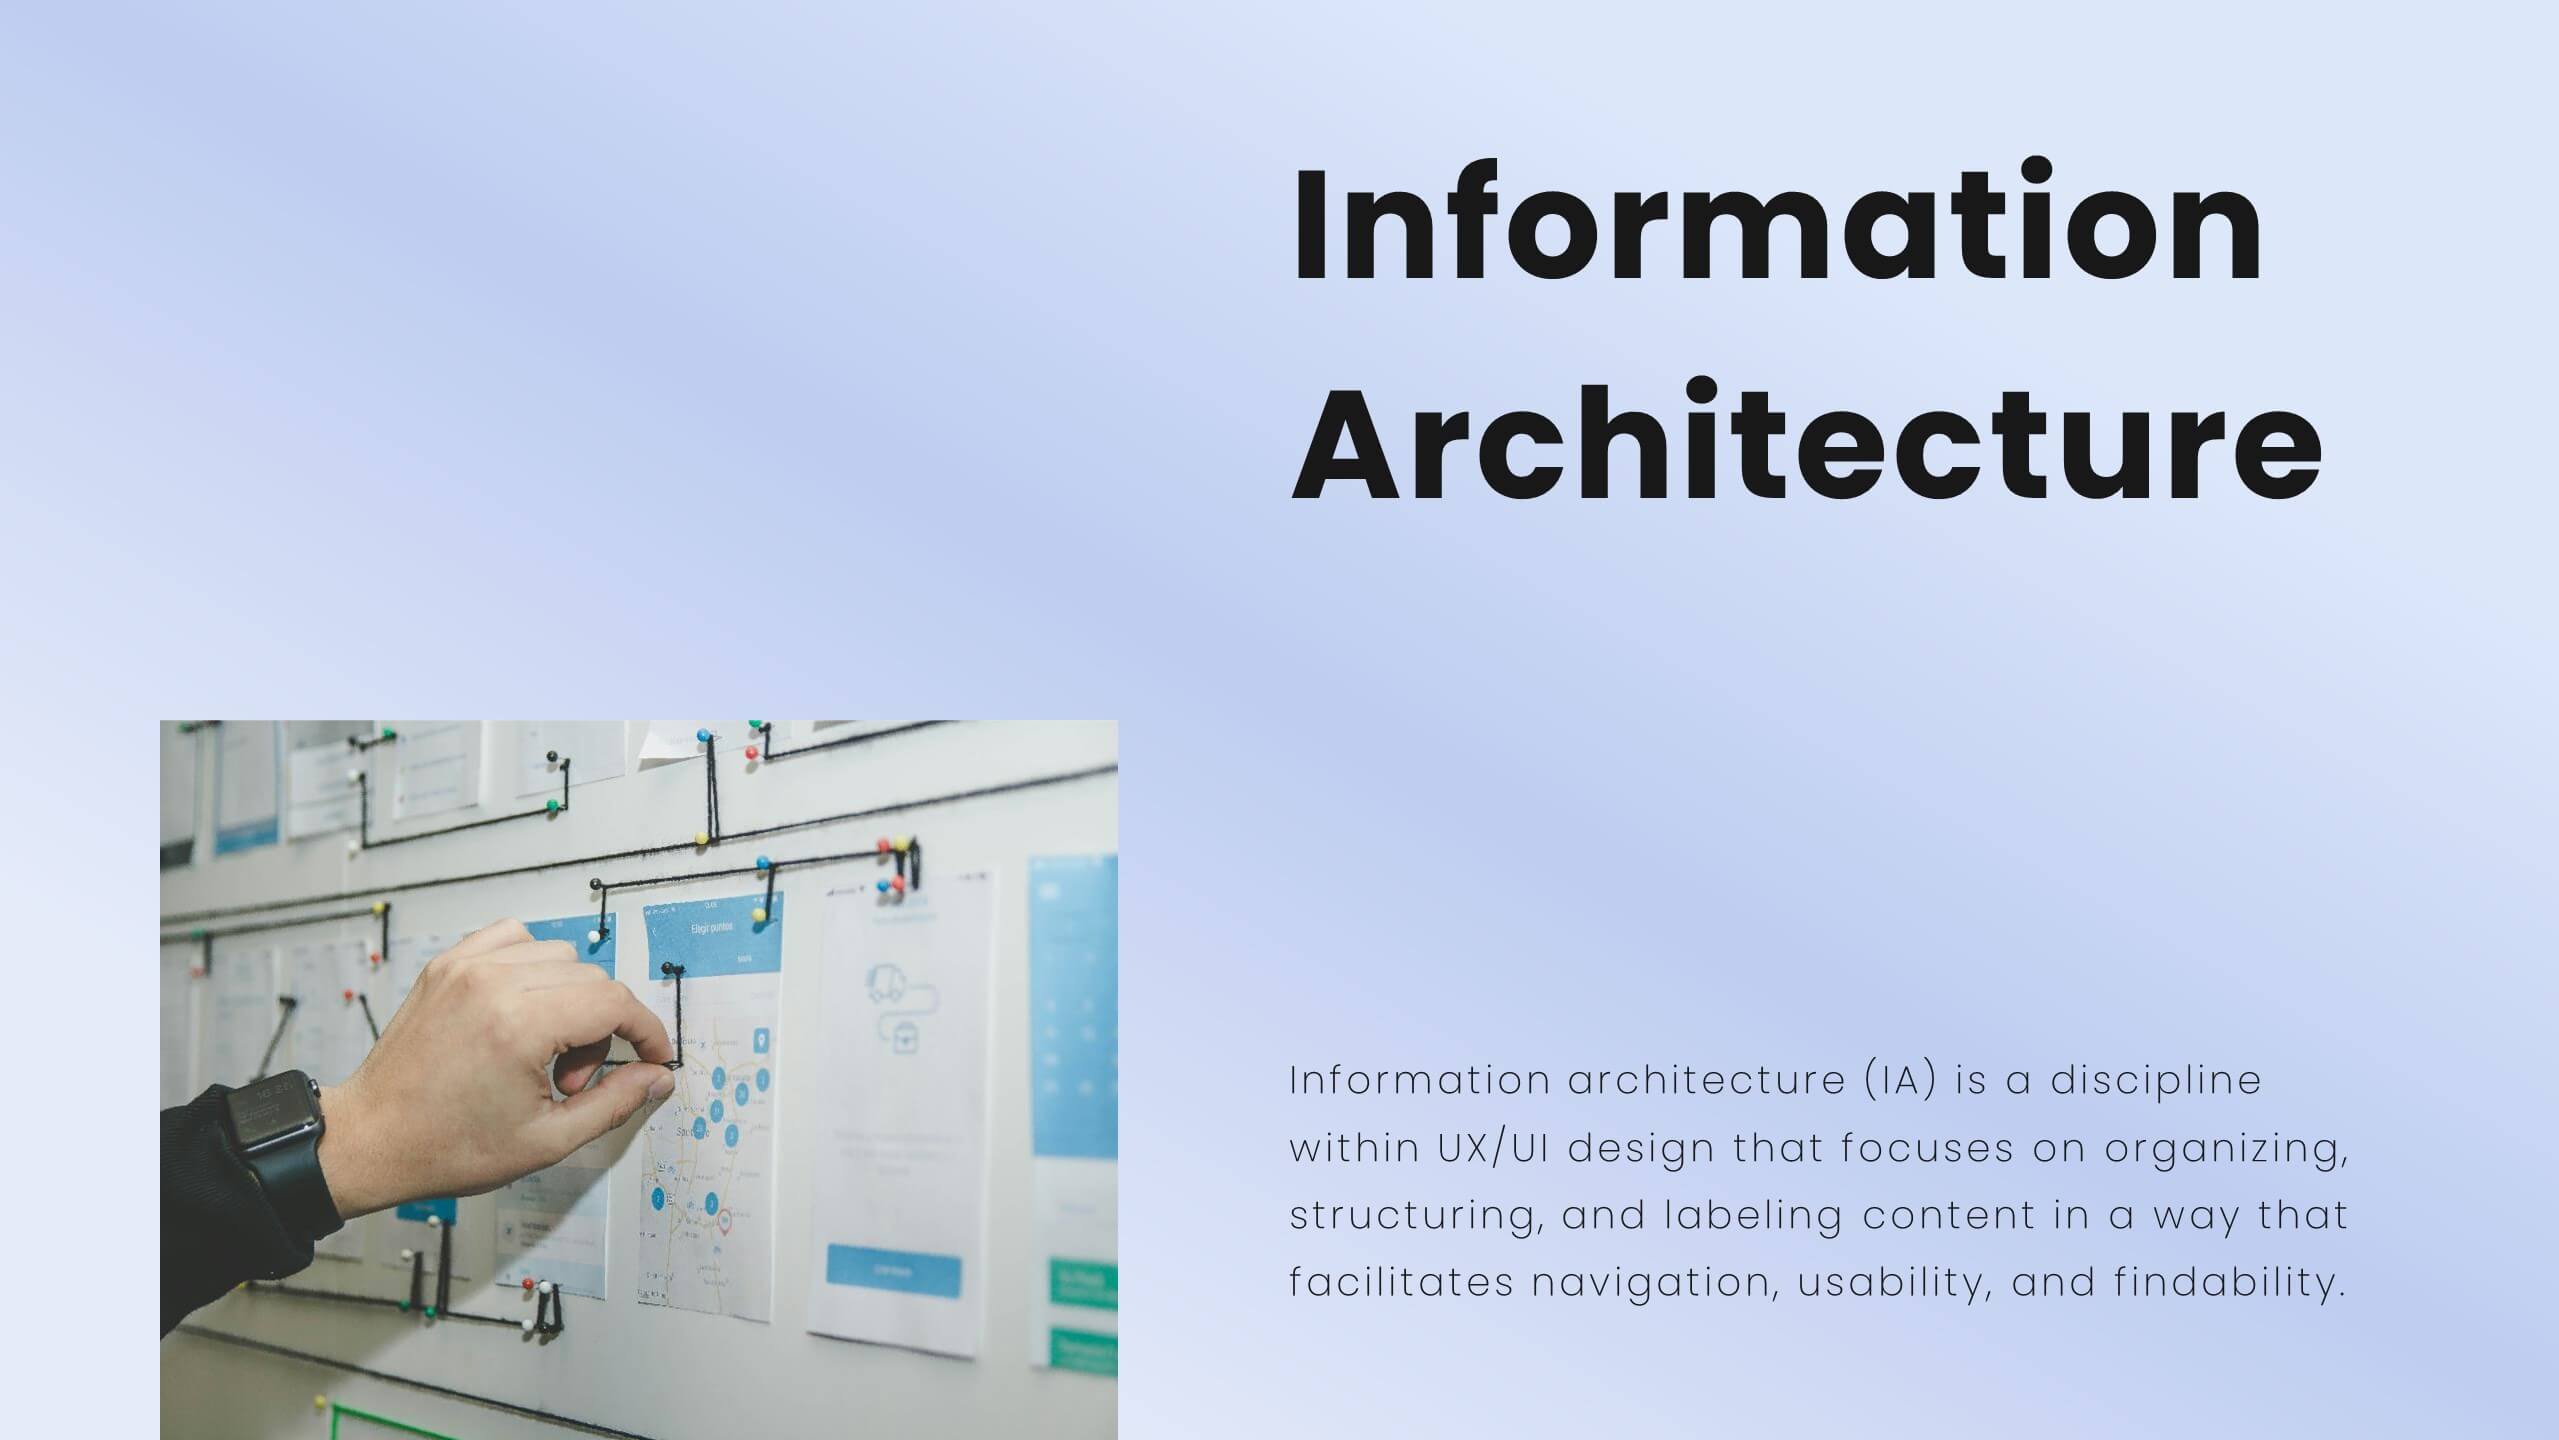
Enhance user experience with this comprehensive UX proposal template! Perfect for outlining user research, personas, and design principles. Ideal for UX/UI designers aiming to present their strategies and solutions. Compatible with PowerPoint, Keynote, and Google Slides, this template ensures your UX proposals are clear, professional, and impactful. Create exceptional user experiences today!


23 slides
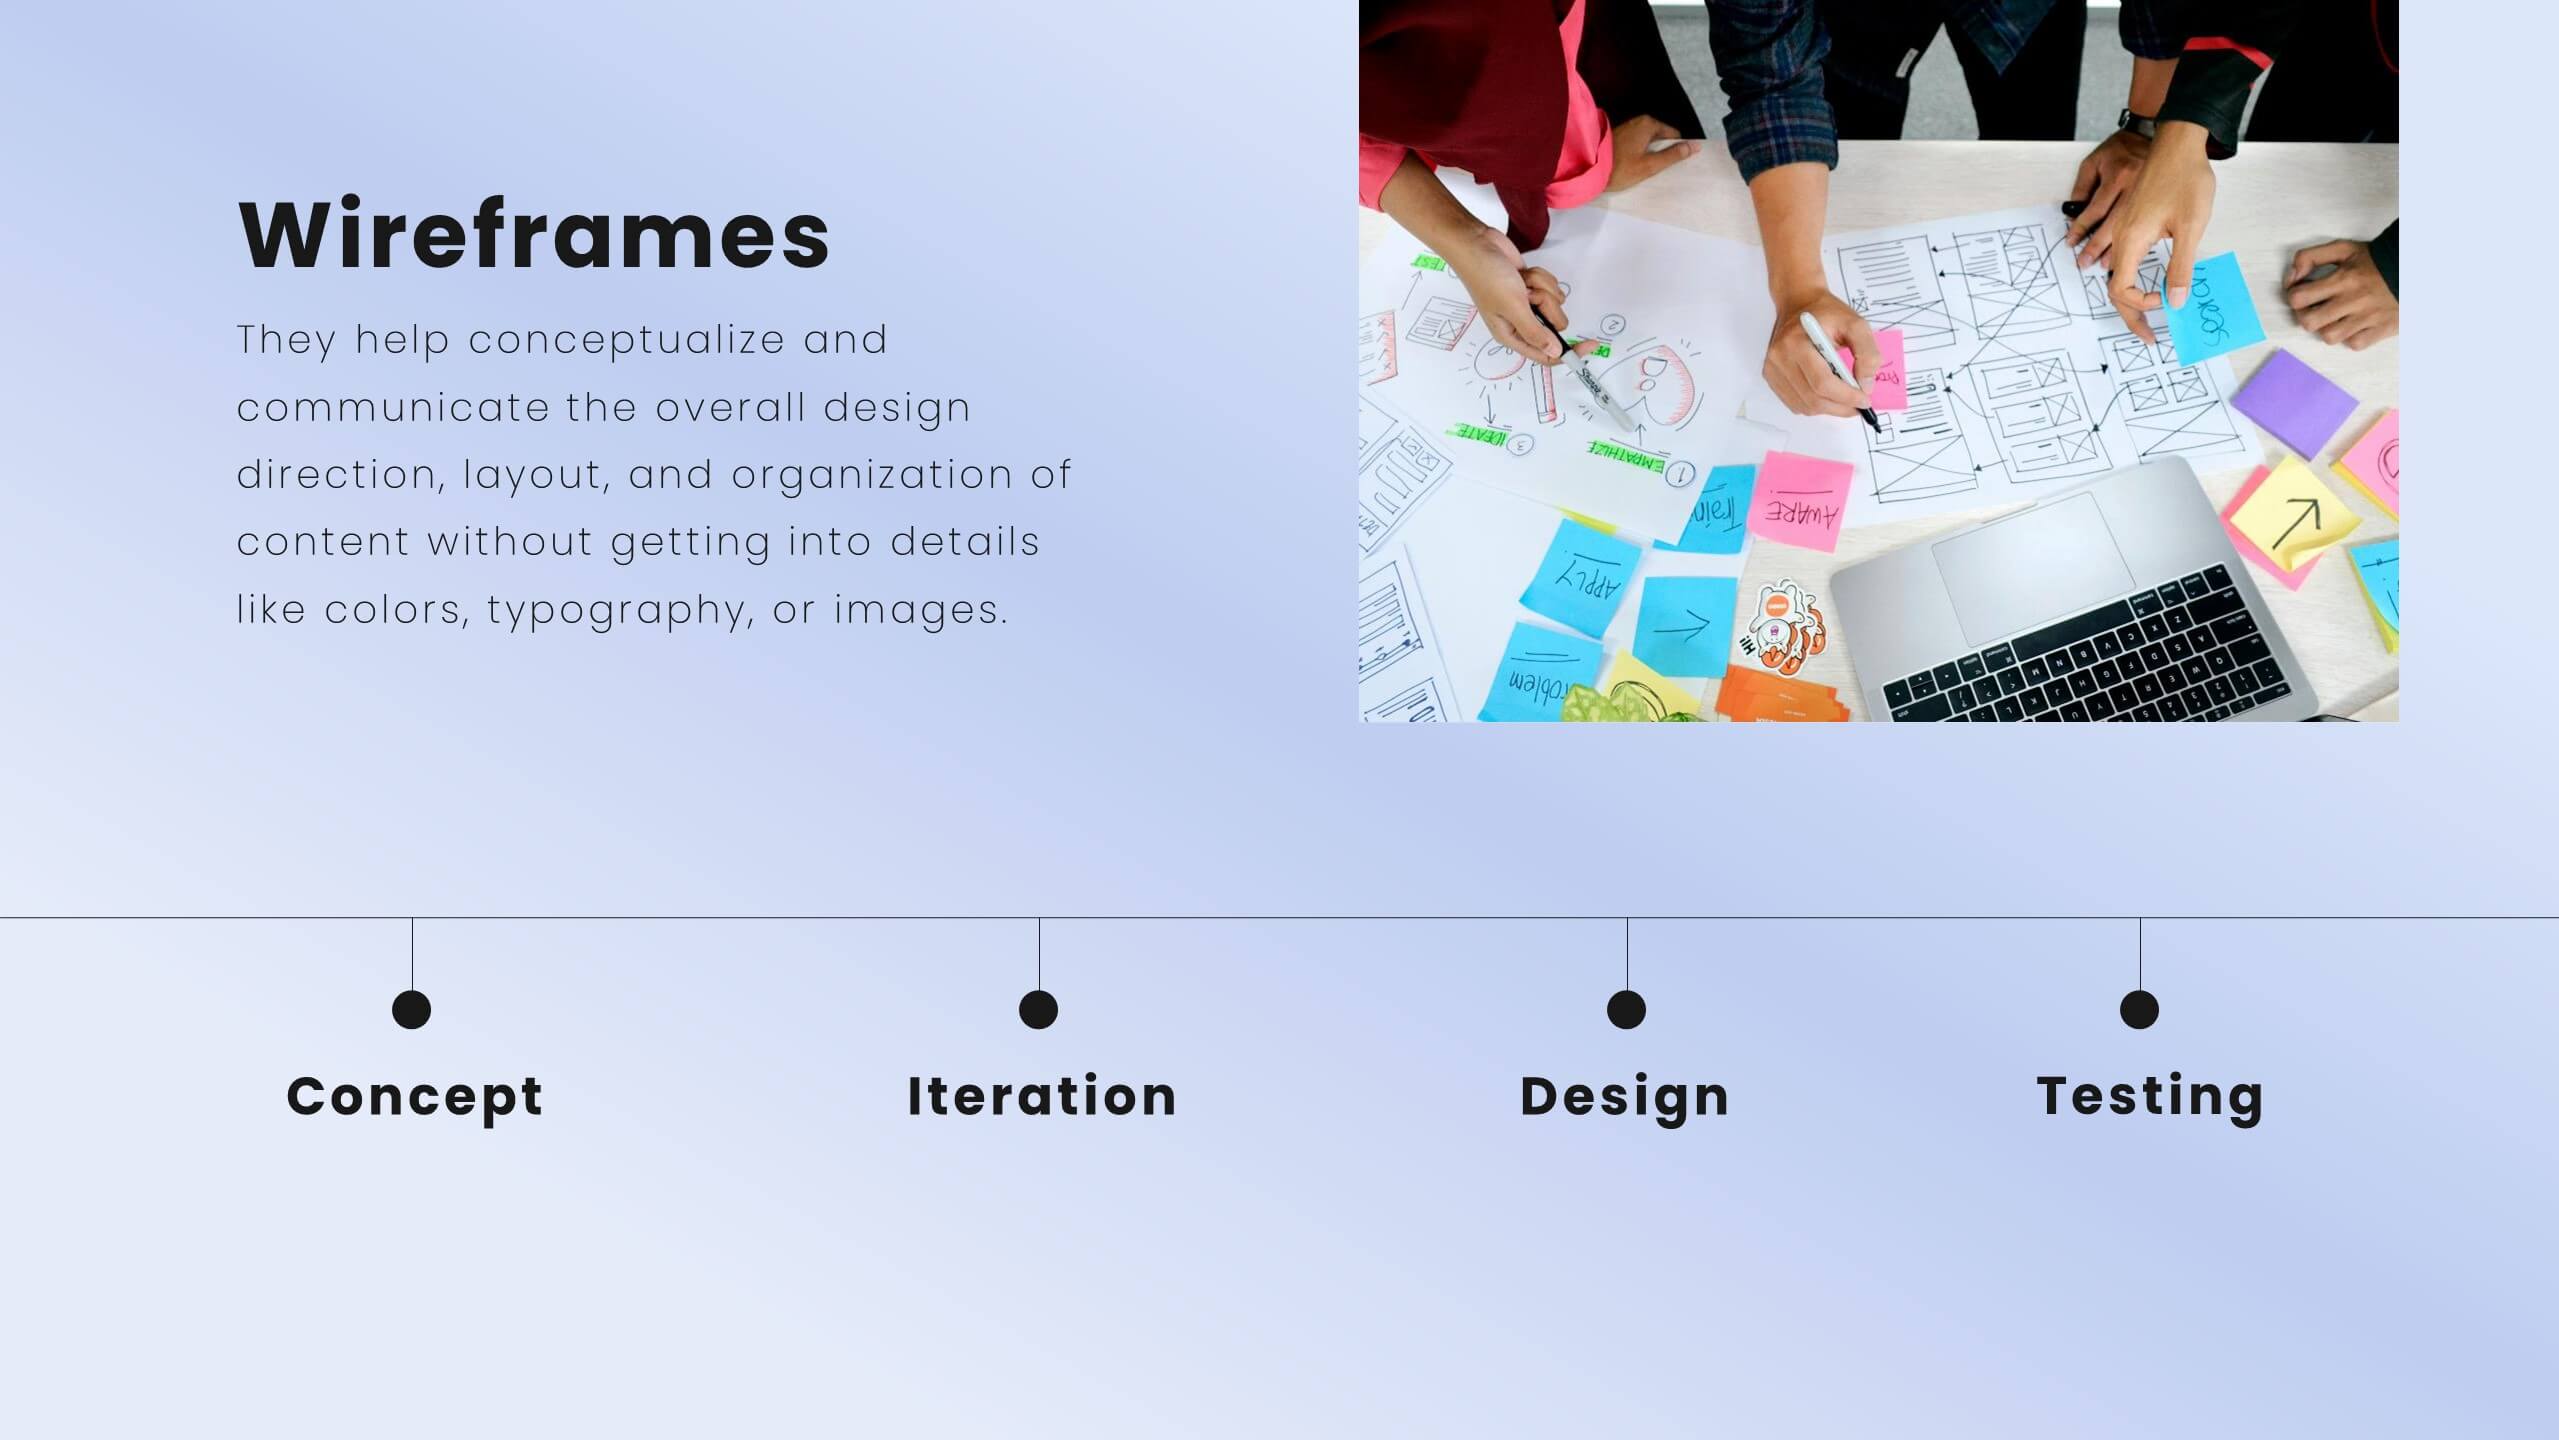
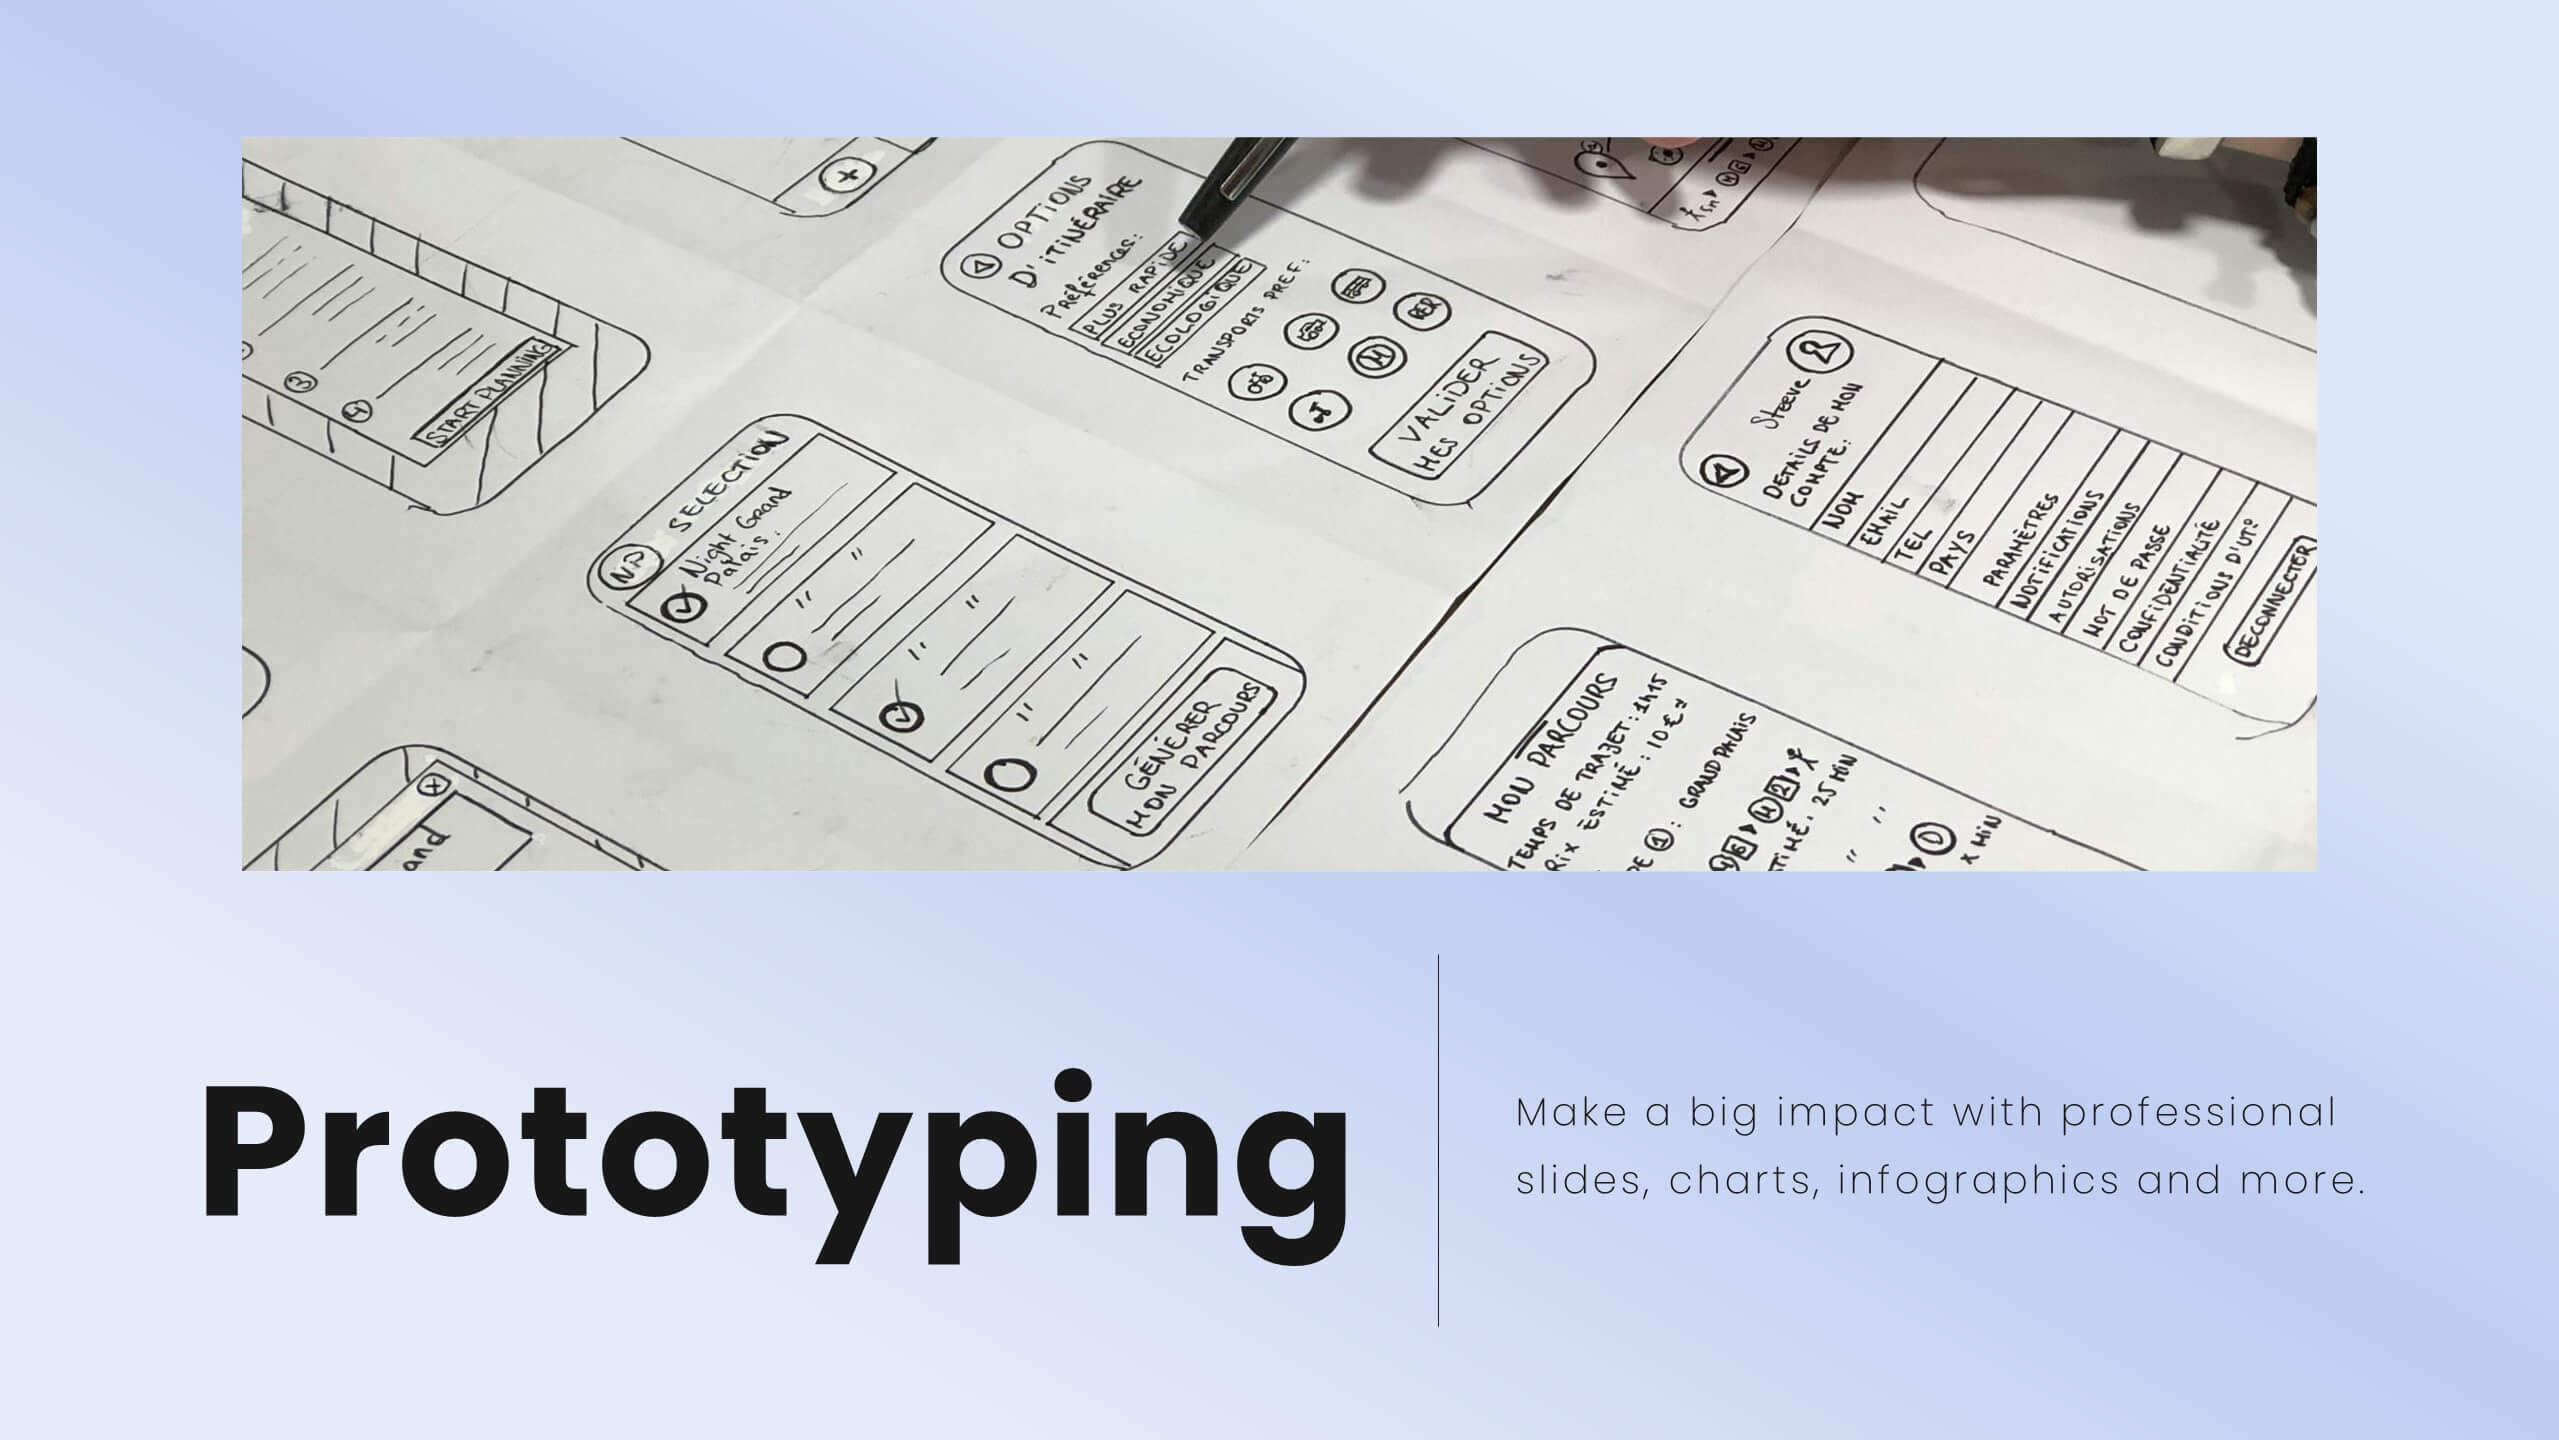
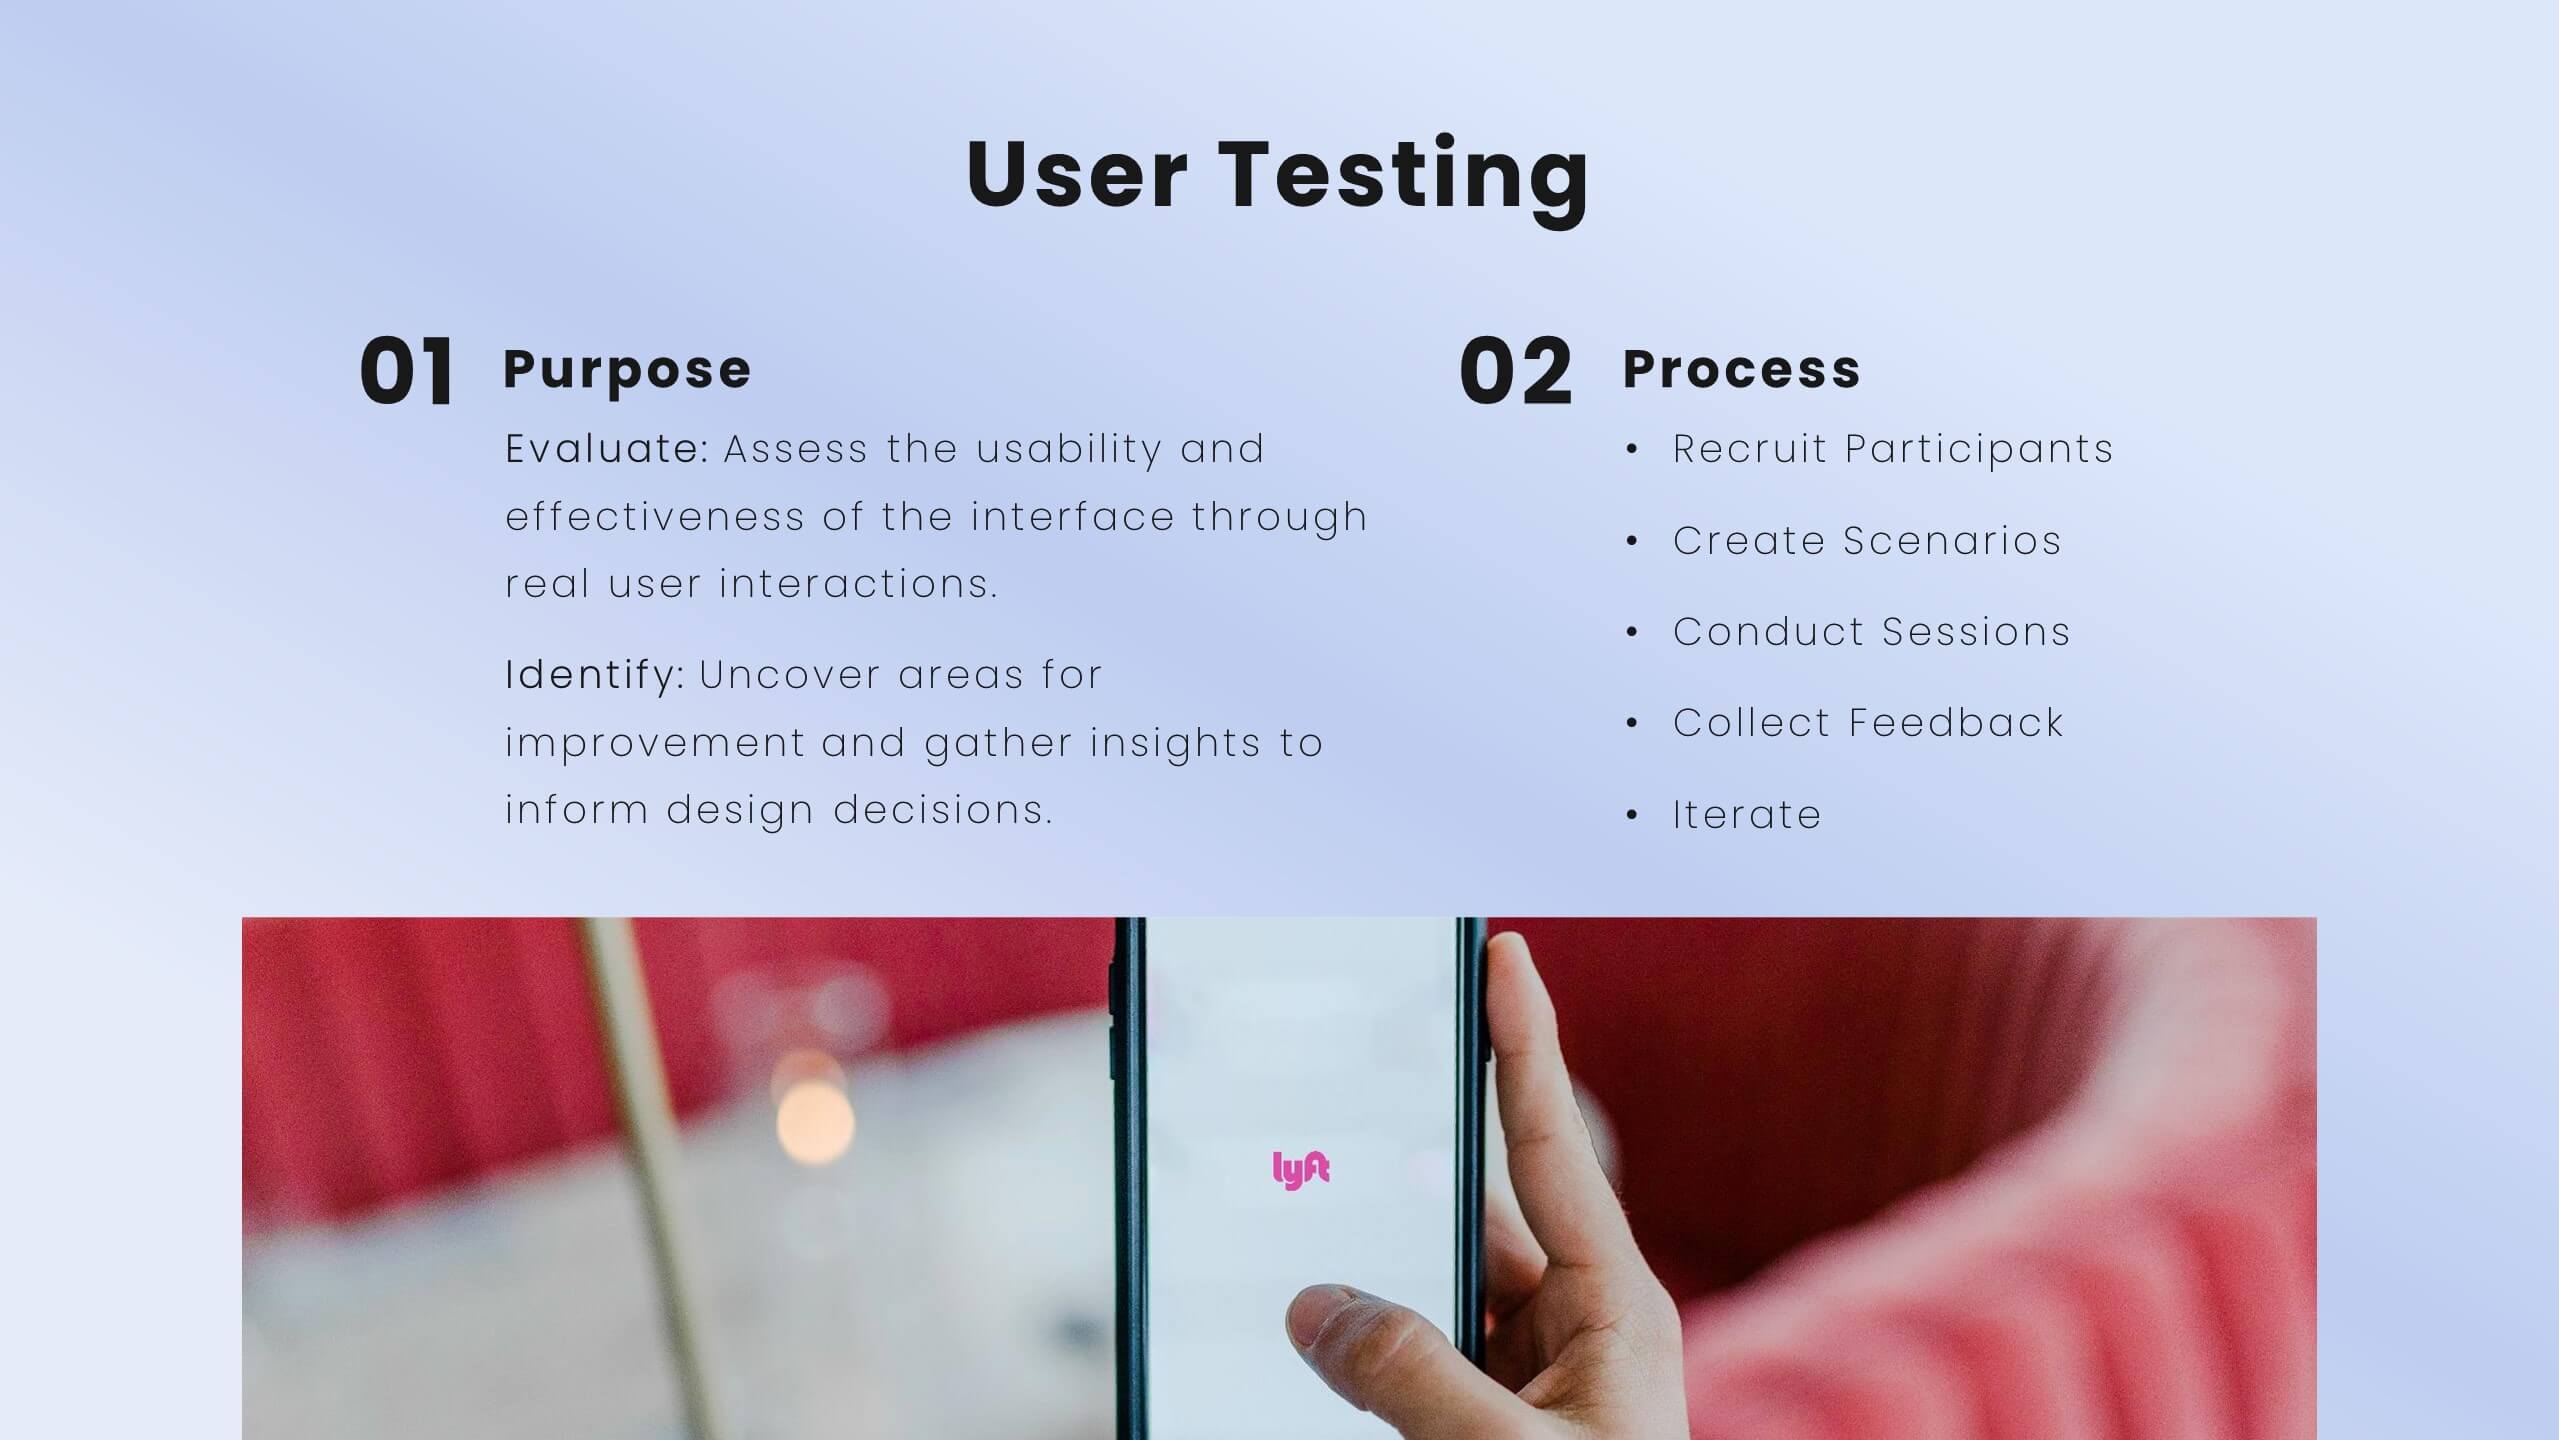
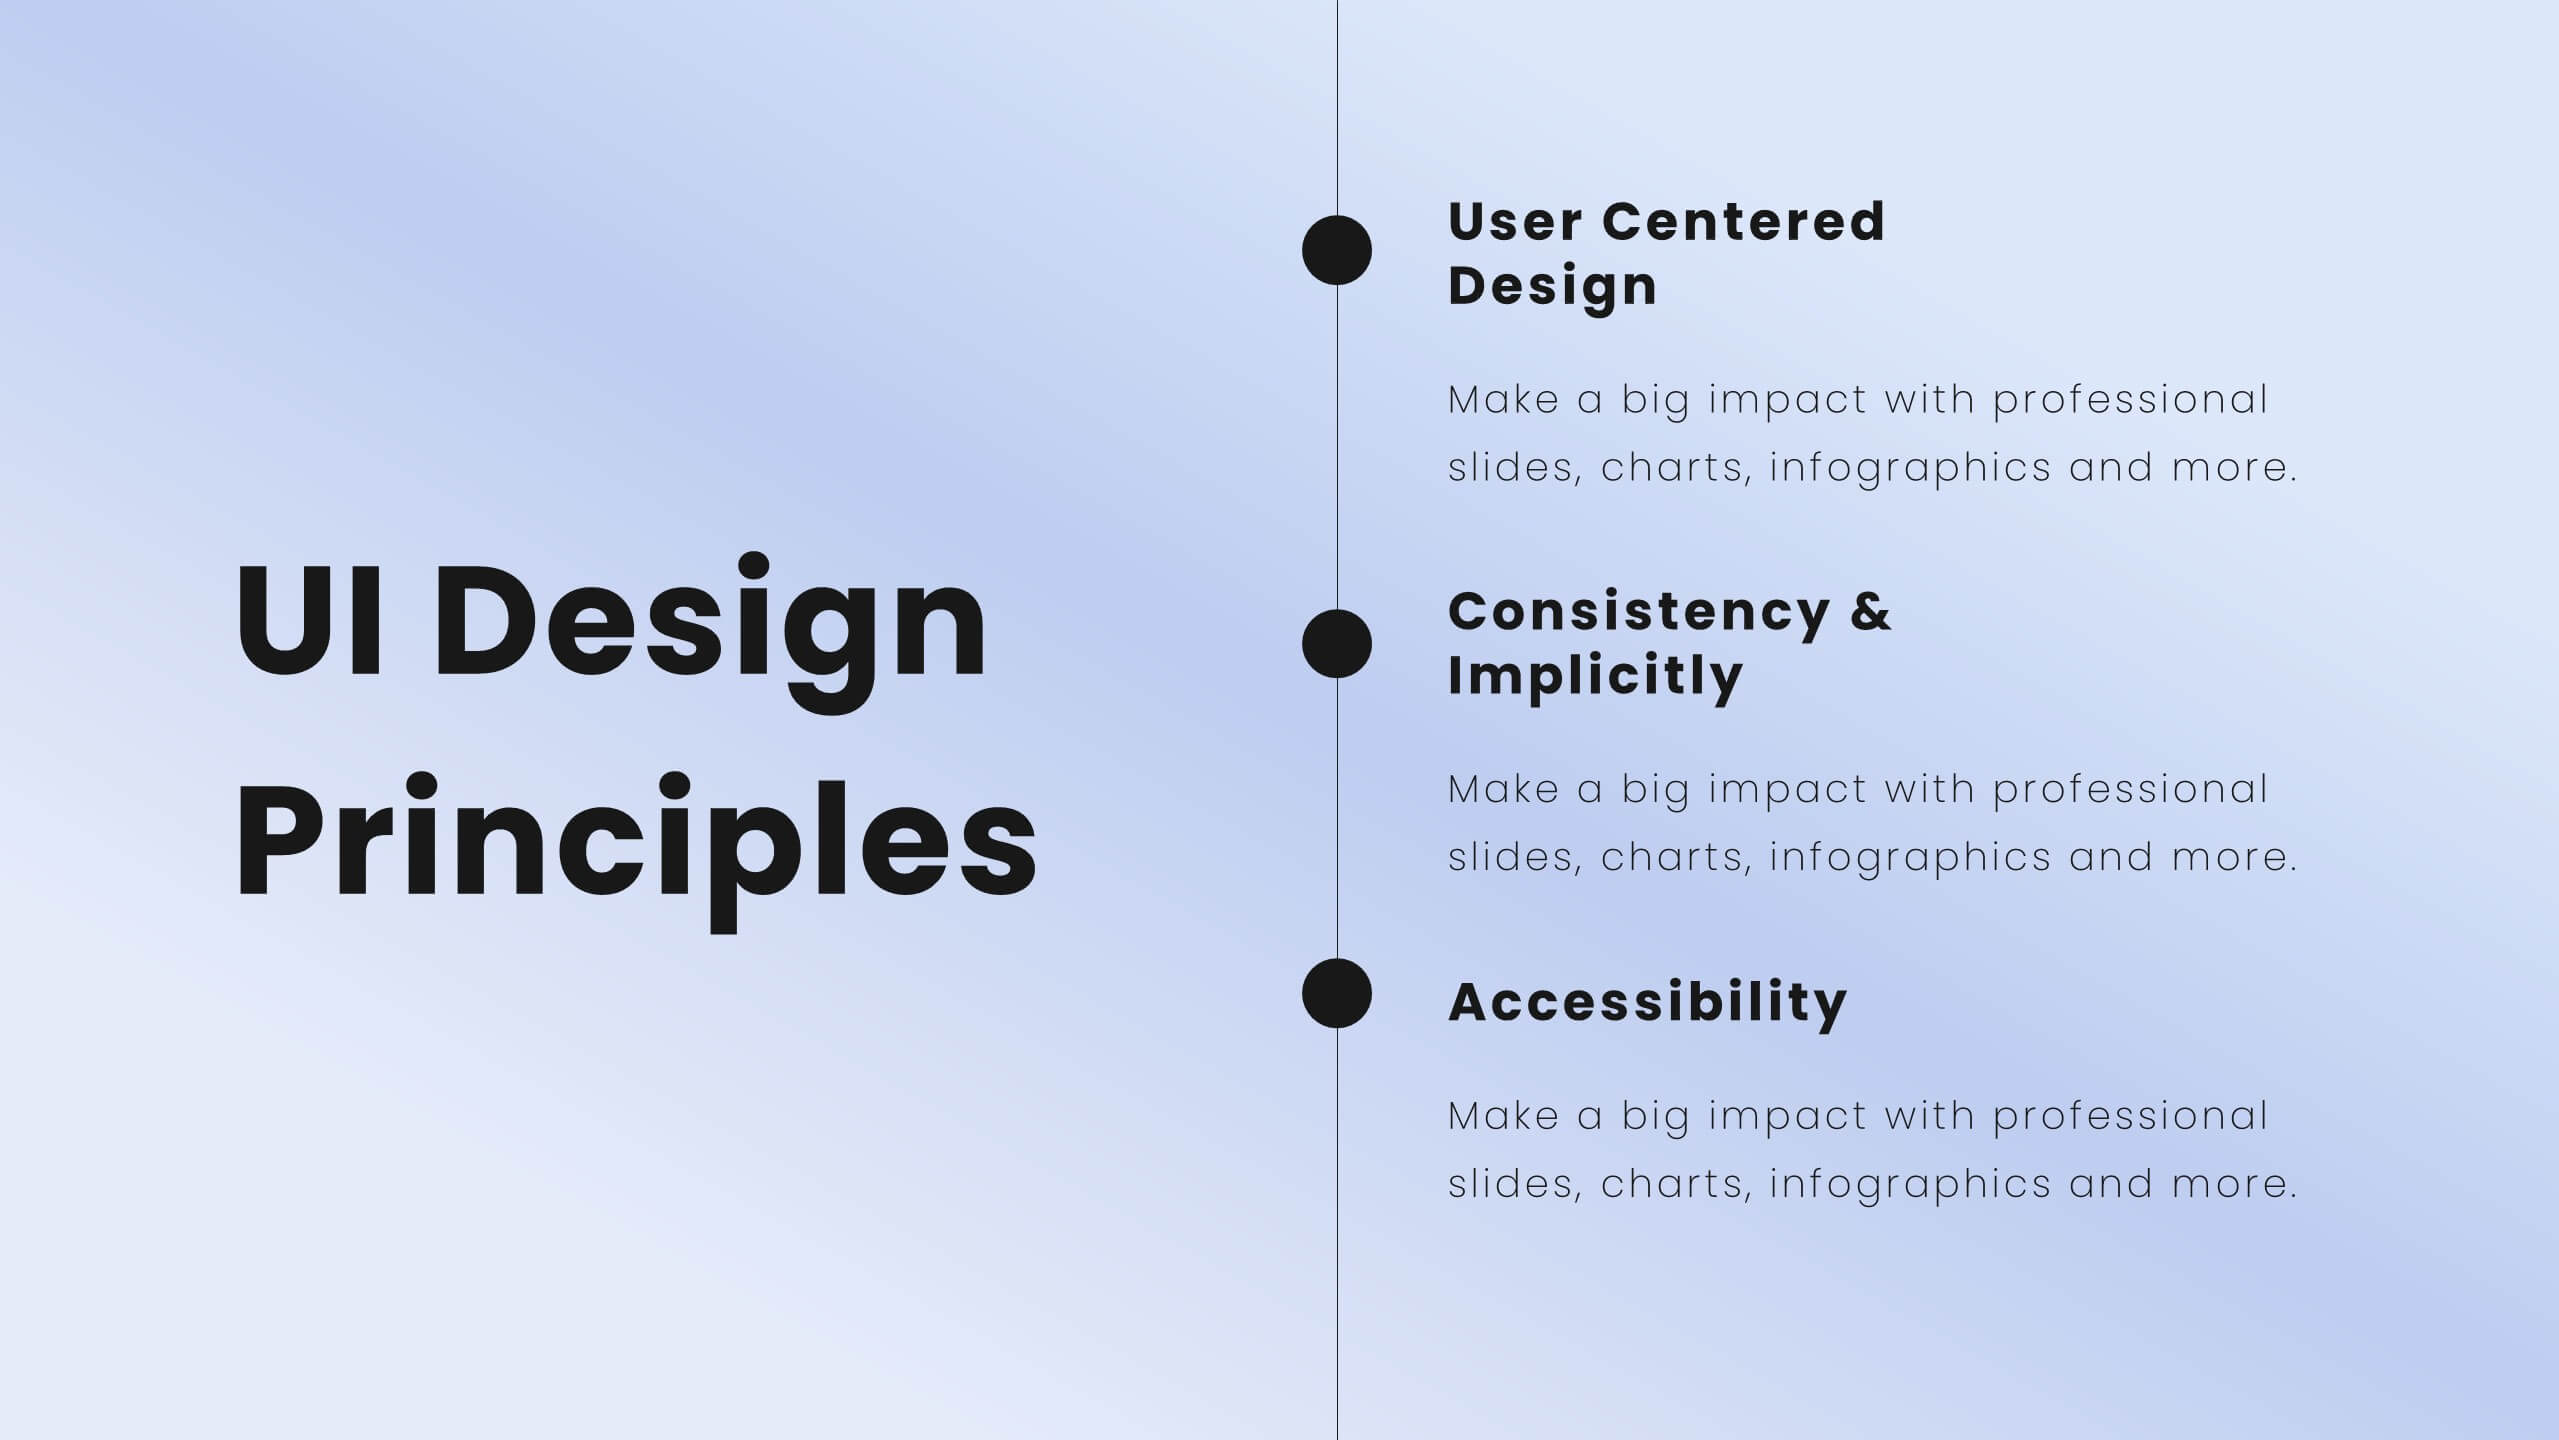
Cycladic UX Design Presentation
The Cycladic UX Design Presentation Template is a bold and vibrant choice for showcasing your UX/UI design projects. With its striking pink and black color scheme, this template is designed to grab attention and keep your audience engaged. It covers all essential aspects of UX design, from project overviews and user research to wireframes, prototyping, and UI design principles. Each slide is thoughtfully designed to present your content clearly and effectively, making it ideal for designers who want to highlight their process, showcase their work, and communicate their design thinking.


5 slides
Scrum Sprint Planning Presentation
Streamline your workflow presentations with this vibrant and intuitive Scrum Sprint Planning slide. Featuring a circular sprint cycle and directional flow, it clearly outlines the iterative process from planning to delivery. Perfect for agile teams presenting timelines, team roles, or workflow overviews. Easily customizable and compatible with PowerPoint, Keynote, and Google Slides.


7 slides
Liability Insurance Infographic
Liability insurance is a type of insurance that provides coverage and protection to individuals and businesses against the risk of being sued and held legally liable for injuries, damages, or losses caused to other individuals or entities. This template is your roadmap to understanding the vital realm of liability insurance, a shield against unexpected financial risks. Compatible with Powerpoint, Keynote, and Google Slides. It lays out the crucial aspects of liability insurance in a clear and engaging manner, ensuring you're well-equipped to protect yourself or your business.


5 slides
Gantt Chart Project Schedule Presentation
Bring structure to your project timeline with a clean, easy-to-read layout that maps tasks, durations, and progress at a glance. This presentation helps teams stay aligned, visualize schedules, and track milestones with clarity and precision. Fully compatible with PowerPoint, Keynote, and Google Slides.


6 slides
Employee Feedback Survey Results Presentation
Showcase Employee Feedback Survey Results with a data-driven and professional layout designed for clear visualization and analysis. This PowerPoint, Keynote, and Google Slides-compatible template features stacked bar charts for easy trend comparison, helping you present workplace insights effectively. Fully customizable with editable text, colors, and labels, this template ensures a seamless and engaging presentation of employee feedback metrics.


4 slides
Aviation Logistics and Scheduling Presentation
Coordinate timelines and optimize operations with the Aviation Logistics and Scheduling presentation. This layout uses a control tower illustration to visualize four key scheduling points—ideal for showcasing flight operations, airport coordination, or air traffic planning. Great for logistics teams, airline operations managers, or aviation consultants. Fully editable in PowerPoint, Keynote, and Google Slides.


7 slides
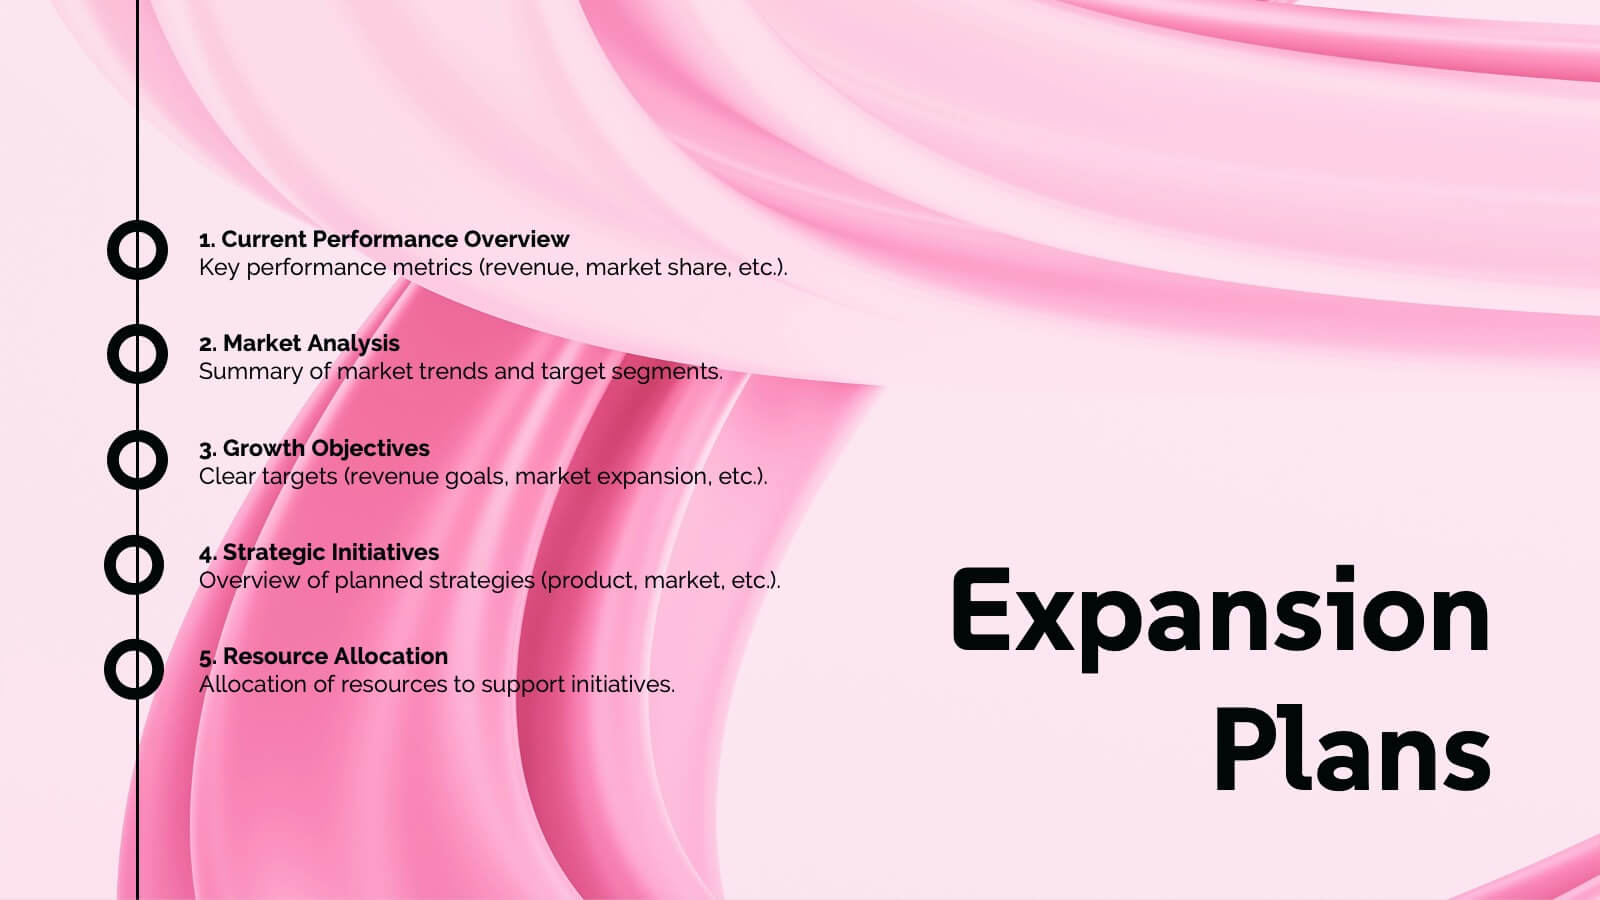
Business Plan Strategy Infographic
A business plan is a written document that outlines a company's goals and the strategy it will use to achieve those goals. This infographic template is a comprehensive roadmap for how a business intends to operate, grow, and succeed in its market. Compatible with Powerpoint, Keynote, and Google Slides. This template is meticulously designed to help you craft a well-structured business plan, empowering entrepreneurs and professionals to navigate their journey to success. Let this be your compass as you navigate the complexities of entrepreneurship and strive for business excellence!


5 slides
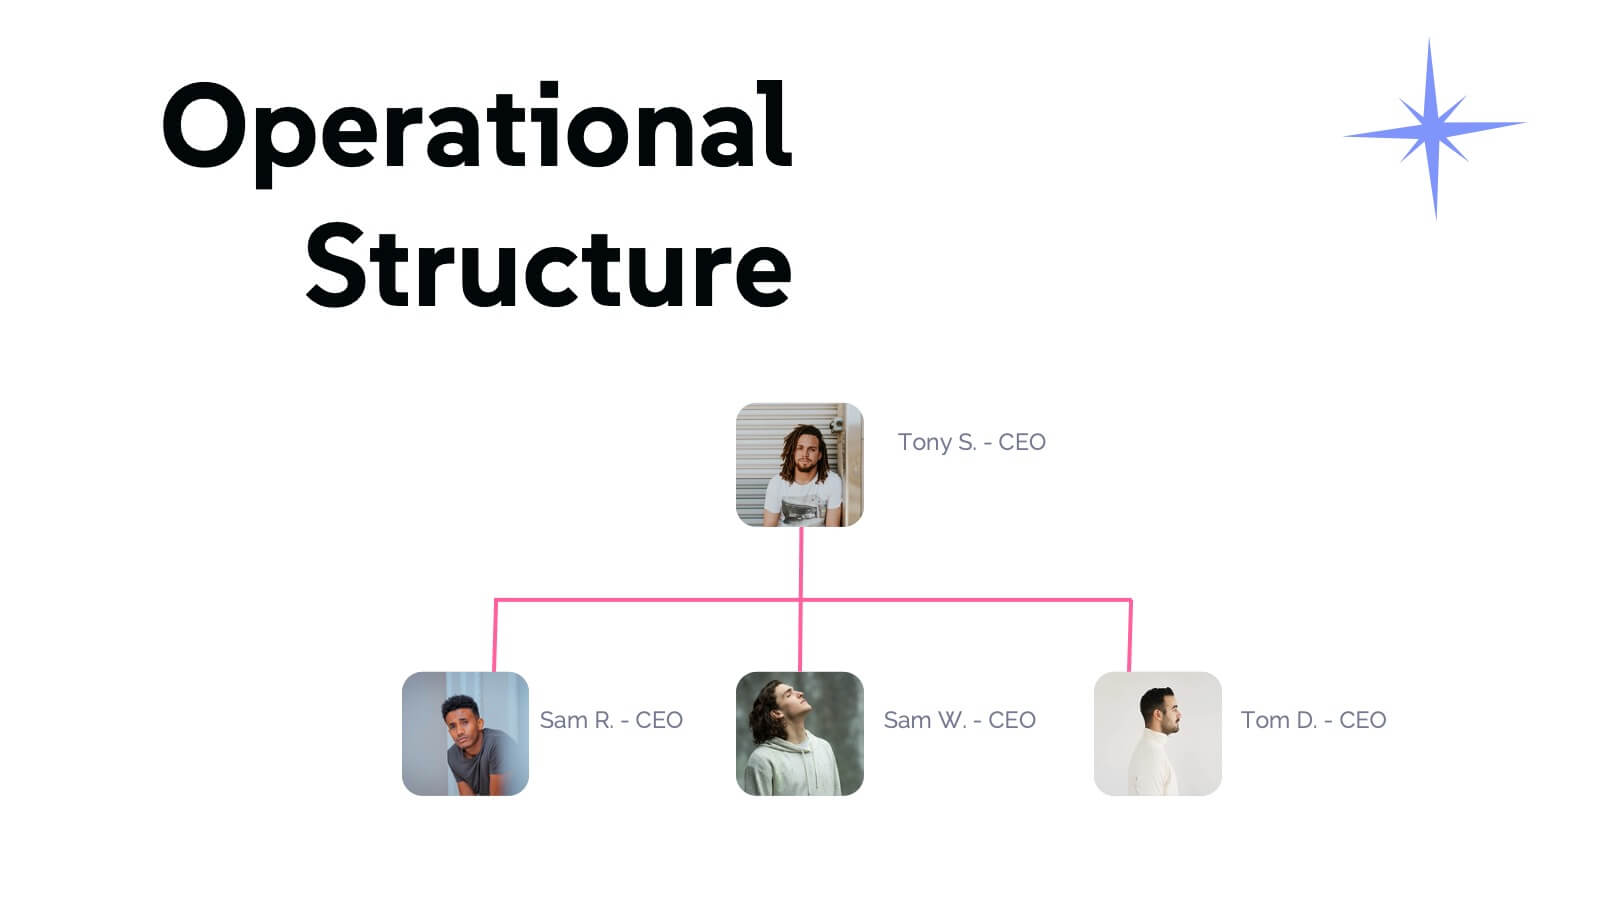
Operational Workflow Process Chart Presentation
Streamline your operations with the Operational Workflow Process Chart Presentation. This template provides a clear visual layout to map out step-by-step processes, helping teams align on roles, timelines, and dependencies. Perfect for training, reporting, or system audits—fully customizable in PowerPoint, Canva, and Google Slides.


7 slides
Business Concept Mind Map Presentation
Visualize strategic thinking with the Business Concept Mind Map Presentation. This clear, central-diagram layout helps organize six core ideas around a business theme, making complex concepts easy to grasp. Ideal for planning, brainstorming, or presentations. Fully editable and compatible with PowerPoint, Keynote, and Google Slides for maximum flexibility.


26 slides
Tempo Brand Identity Presentation
Introduce and elevate your brand with this versatile presentation template designed to reflect your company's vision and values. Perfect for businesses looking to showcase their brand strategy, components, and touchpoints with clarity and professionalism. This presentation features thoughtfully designed slides covering brand identity components, visual guidelines, target audience insights, and future development plans. Use dedicated sections to outline your unique selling proposition, positioning, and strategy. With its clean layout and attention to detail, it's ideal for presenting a cohesive and impactful brand narrative. Compatible with PowerPoint, Google Slides, and Keynote, this template is fully customizable. Edit colors, text, and images to align with your brand aesthetics and messaging. Deliver your presentation with confidence, ensuring your audience is inspired by a polished and professional brand identity.