


Features
- 8 Unique Slides
- Fully editable and easy to edit in Microsoft Powerpoint, Keynote and Google Slides
- 16:9 widescreen layout
- Clean and professional designs
- Export to JPG, PDF or send by email


Do you have any questions?
Recommend


5 slides
Psychological Depth Iceberg Insight
Explore the layers of thought, emotion, and motivation with the Psychological Depth Iceberg Insight Presentation. This template is designed to help visualize conscious vs. subconscious drivers—ideal for leadership training, behavior analysis, or mindset coaching. Fully editable in PowerPoint, Keynote, and Google Slides to fit your narrative.


4 slides
Patient Care Plan and Metrics Presentation
Turn healthcare data into meaningful stories with this modern and professional presentation. Perfect for highlighting patient progress, clinical outcomes, and care efficiency, it balances visuals and data for clarity and impact. Easy to edit and fully compatible with PowerPoint, Keynote, and Google Slides for smooth customization.


7 slides
Business Structure Infographic
Understanding a business's organizational structure is pivotal for effective operations, strategy, and growth. Our business structure infographic, colored in shades of blue, white, green, and yellow, lays out these intricacies in a visually compelling manner. Whether you're showcasing hierarchies, operational roles, or departmental divides, this infographic captures it all. Tailored for business students, entrepreneurs, and corporate trainers, this tool simplifies complex concepts. Seamlessly integrated with PowerPoint, Keynote, and Google Slides, it provides a dynamic aid to ensure your presentations are both enlightening and engaging.


7 slides
One-Page Business Model Overview Presentation
Simplify your business strategy with this One-Page Business Model slide. Perfect for pitches or internal reviews, it maps out key elements like partners, activities, customers, and revenue on a single page. Clean, customizable blocks help communicate your vision clearly—ideal for startups, entrepreneurs, and teams needing quick business clarity.


5 slides
IT Security and Data Protection Presentation
Communicate your cybersecurity objectives with impact using this clean, shield-based visual layout. This presentation slide features five distinct steps with matching icons, perfect for detailing protocols like data governance, firewall strategies, or access control measures. Ideal for IT professionals, network admins, or compliance teams. Fully customizable and compatible with PowerPoint, Keynote, and Google Slides.


10 slides
Effective Team Communication Presentation
Streamline your Effective Team Communication with this modern infographic template. Designed to enhance collaboration and workflow clarity, this slide helps visualize key communication strategies for better team efficiency. Fully customizable in PowerPoint, Keynote, and Google Slides, making it perfect for corporate training, leadership meetings, and project planning.


20 slides
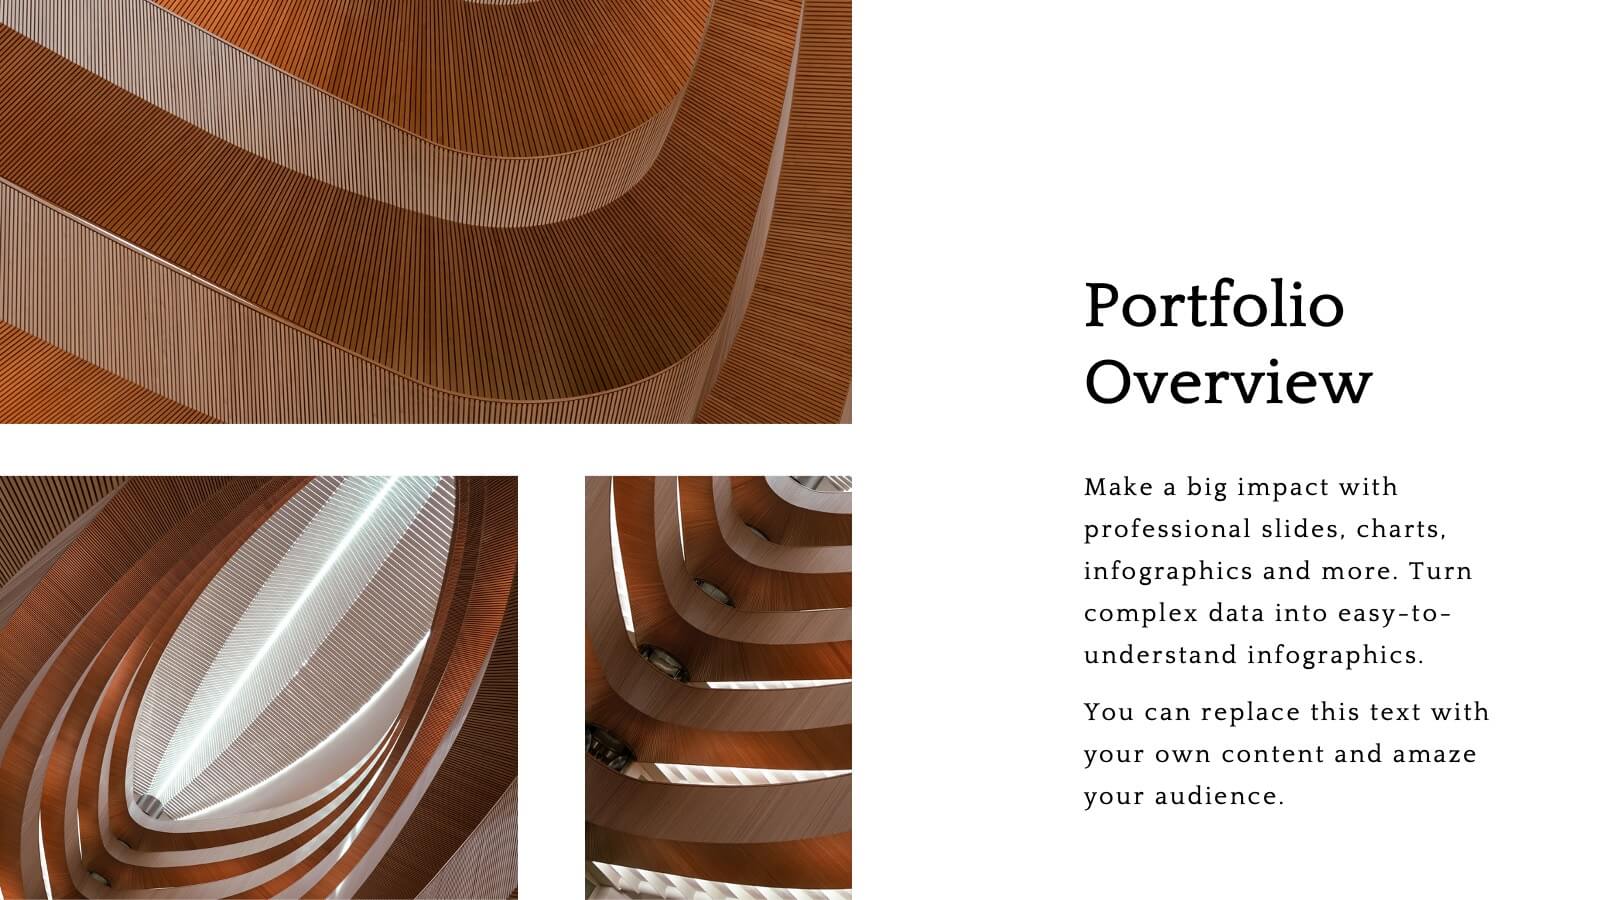
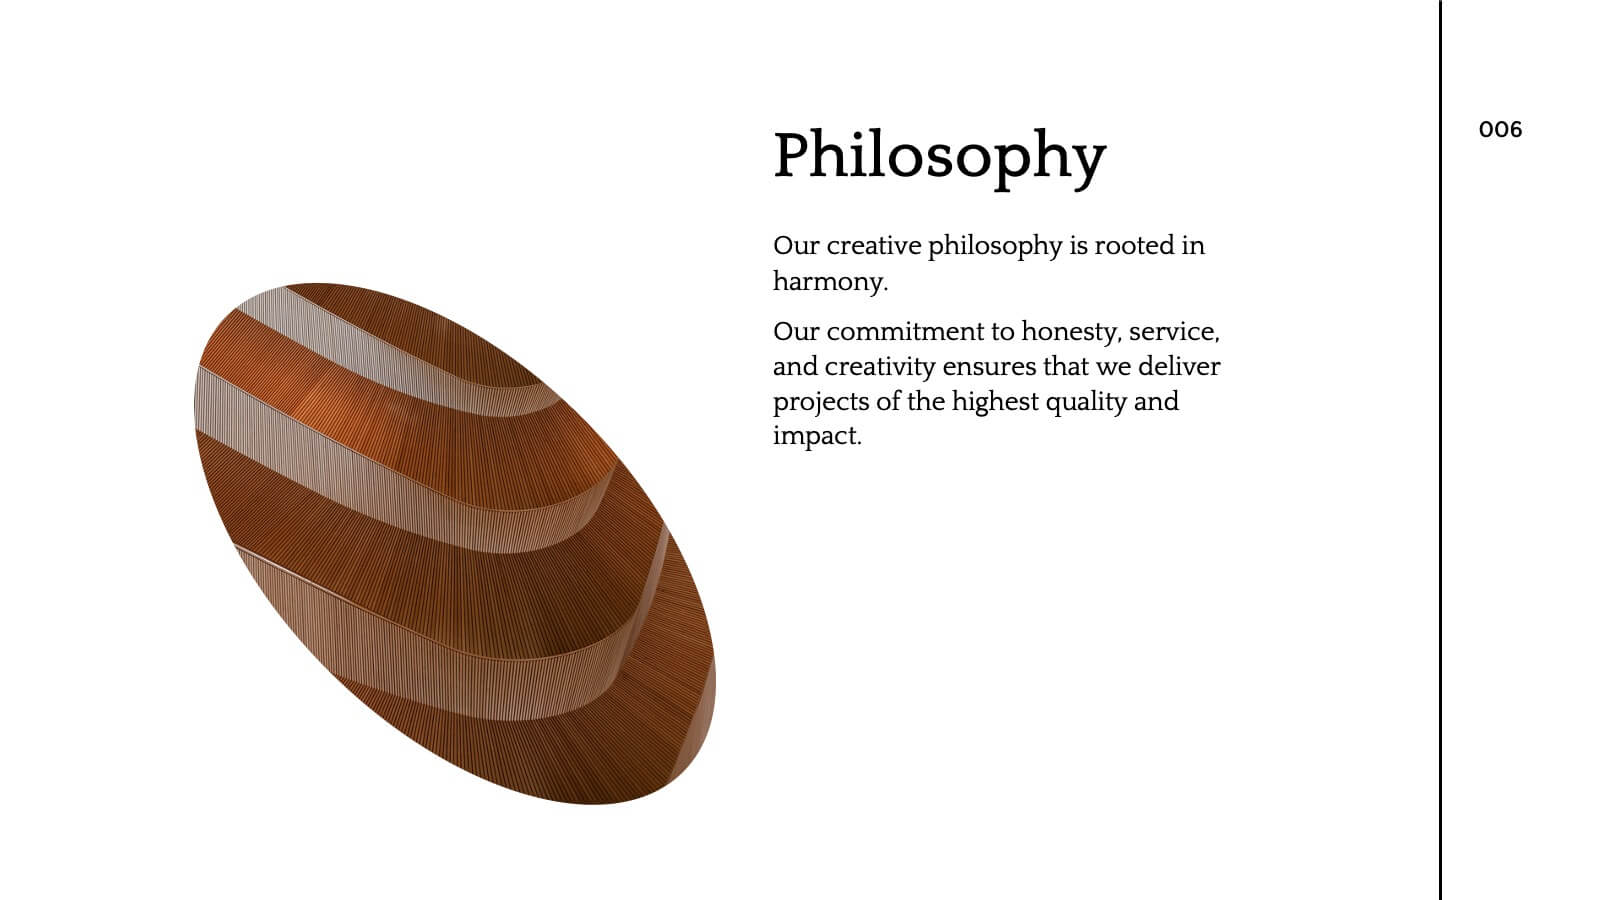
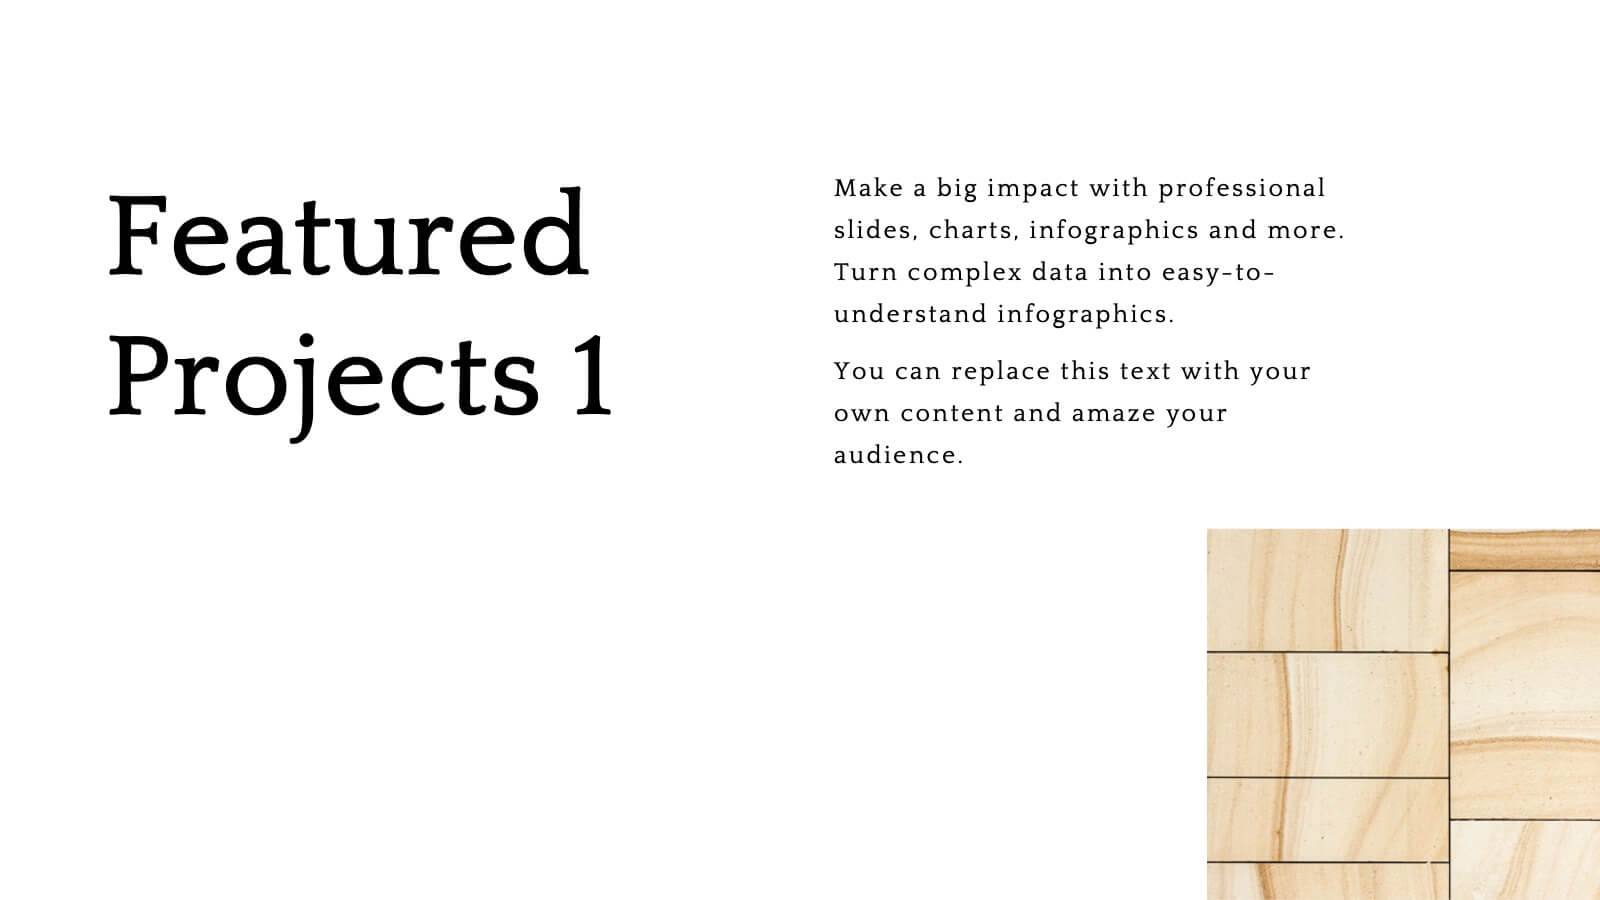
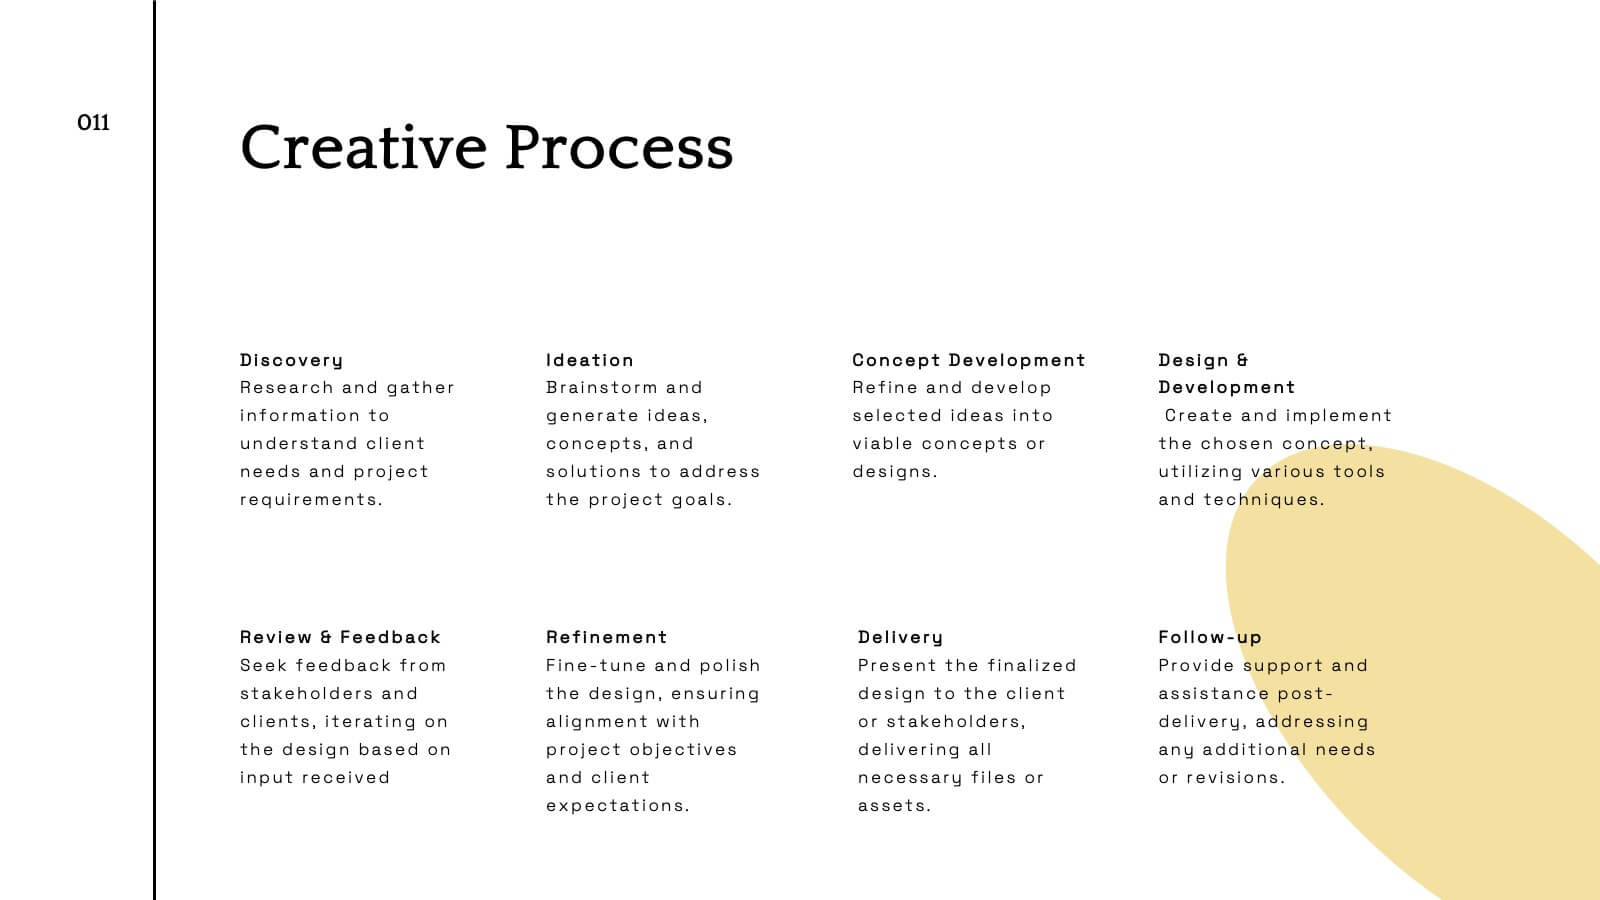
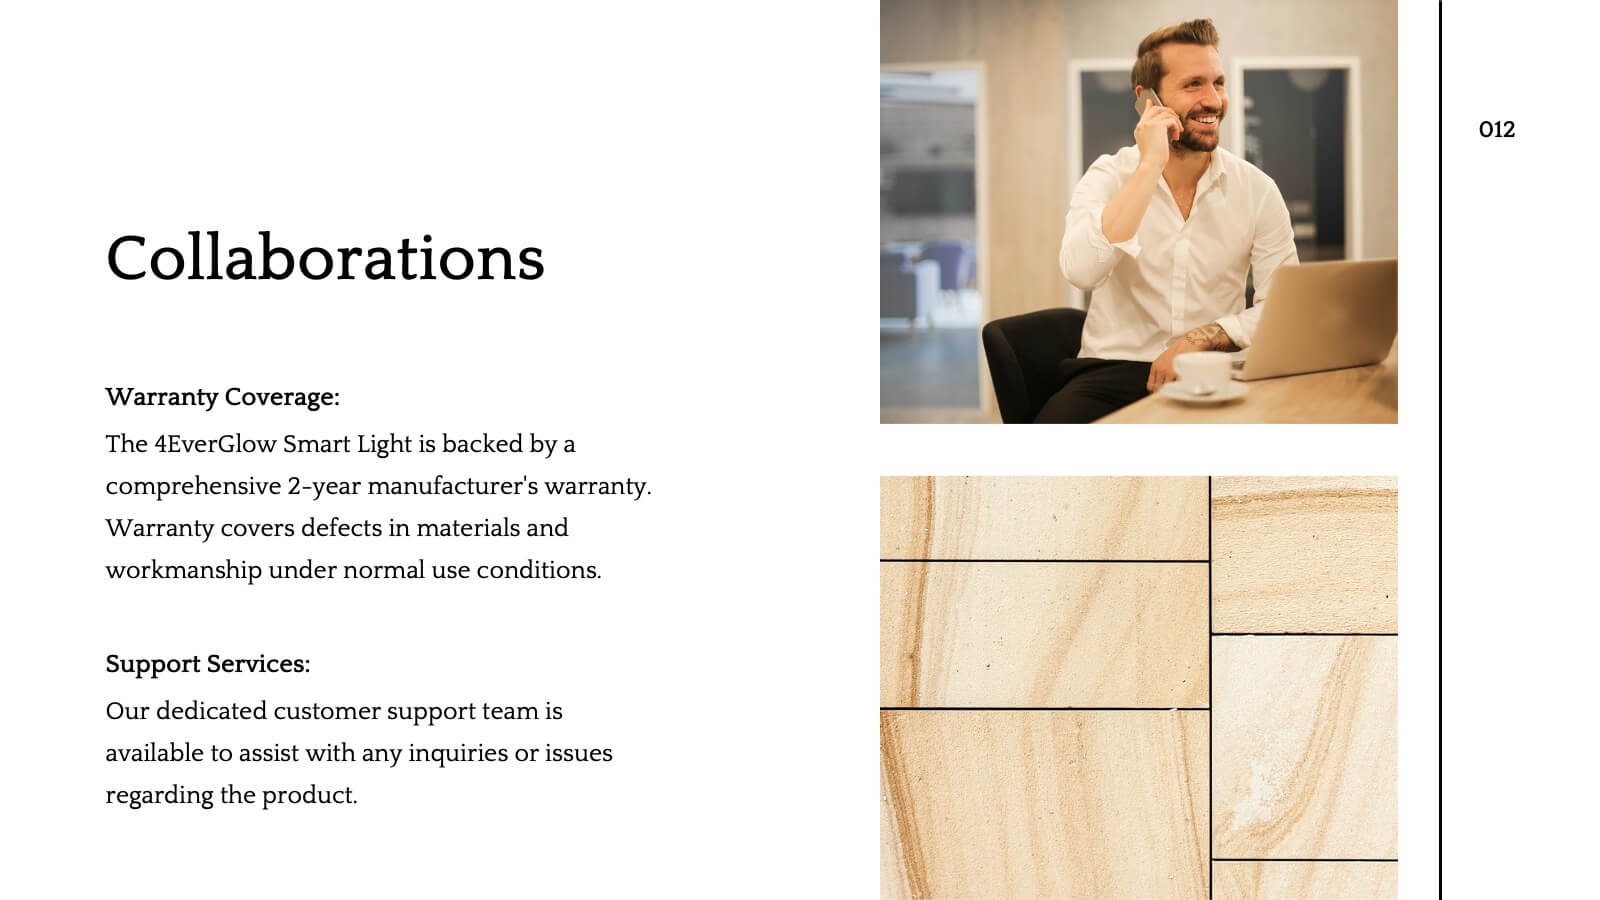
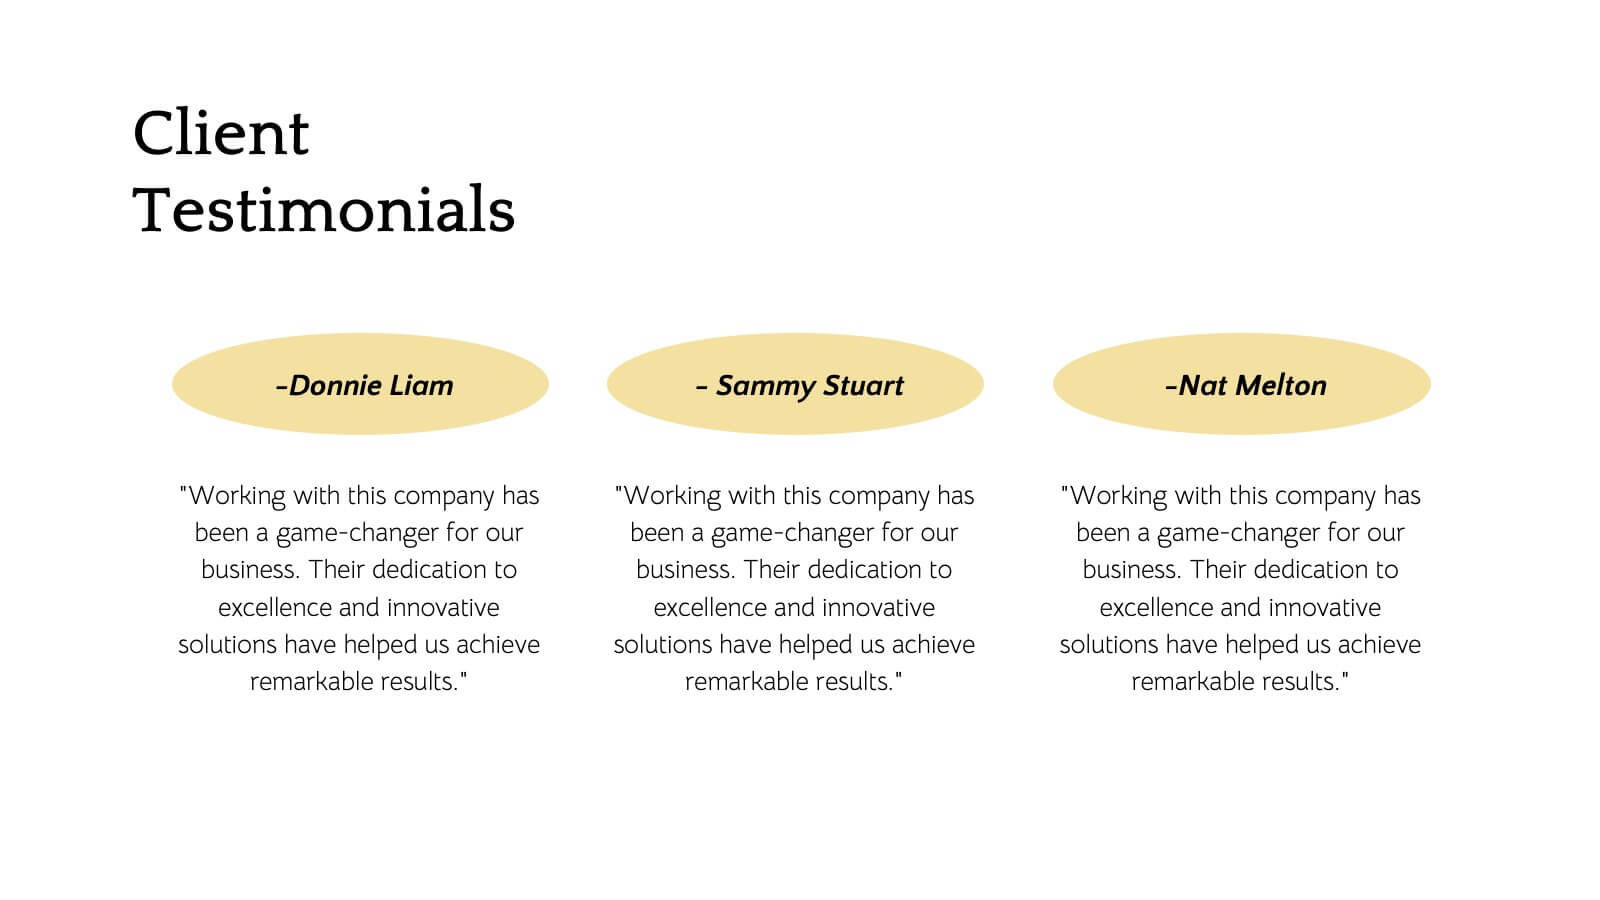
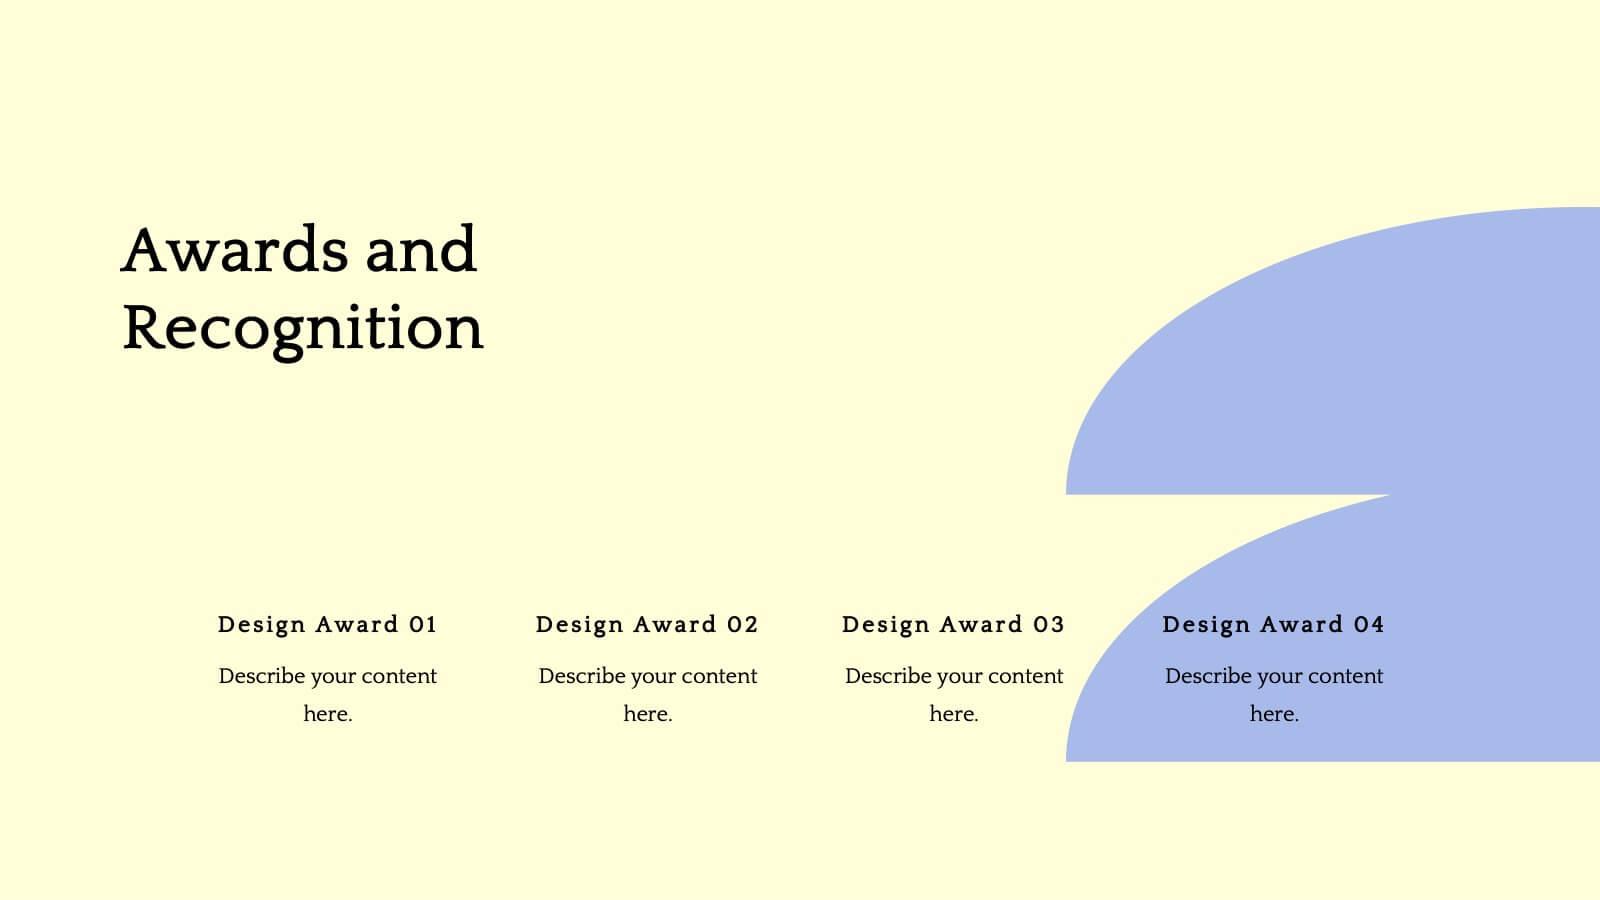
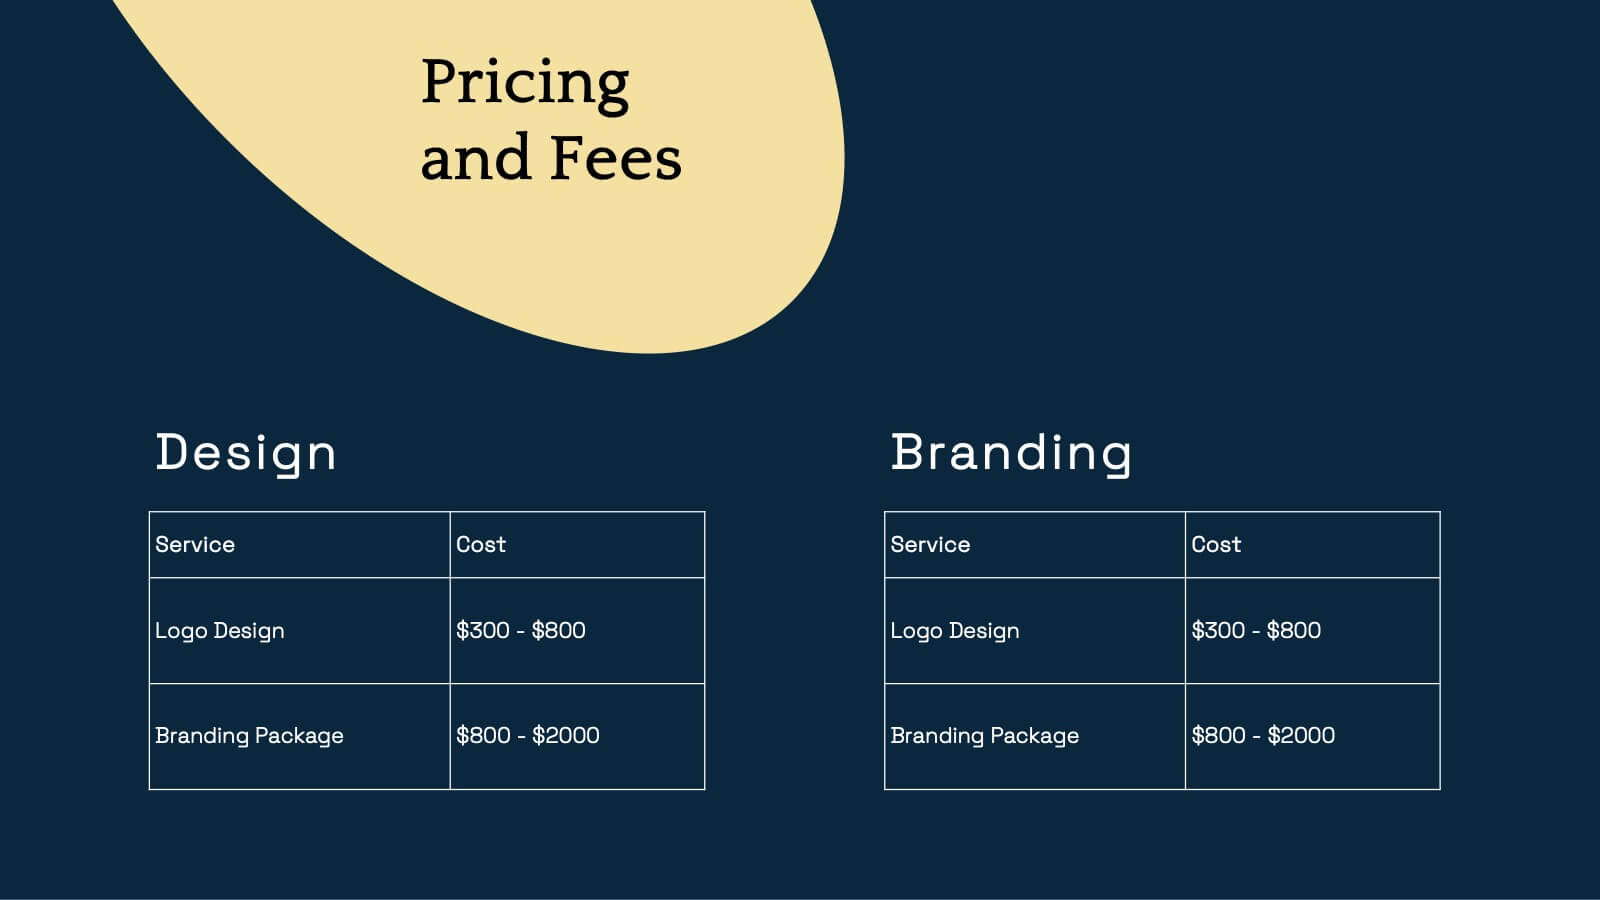
Scriptorium Design Portfolio Presentation
Showcase your creative work with a sophisticated design portfolio presentation template tailored for designers and creators. This template includes clean, minimalist slides to highlight your introduction, portfolio overview, design philosophy, and style. Showcase featured projects with dedicated project highlight slides, complete with client testimonials and awards for added credibility. With sections for your design process, services, pricing, and blog integration, this template provides a professional framework for sharing your creative journey. The editable layout ensures seamless customization to reflect your unique brand, making it suitable for freelancers, agencies, or design teams. Compatible with PowerPoint, Google Slides, and Keynote, this versatile template offers an elegant way to communicate your expertise and leave a lasting impression on clients or stakeholders. Tailor it to your needs and take your portfolio presentations to the next level!


5 slides
Social Media Marketing Infographics
Social Media Marketing is an essential component of any modern marketing strategy. These vertical infographics can be used to provide valuable insights into the most effective social media platforms, the latest trends in social media marketing, and tips and strategies for optimizing social media campaigns. These are an excellent way to communicate complex information in an easy-to-digest format and can be used for marketing and educational purposes. Use these infographics to Include data on user demographics, engagement rates, platform-specific best practices, and industry benchmarks.


26 slides
Coffee Shop Warm Company Profile Presentation
Coffee shops have become an important part of modern culture, especially in urban areas, and they come in various styles and themes. This presentation template is designed to bring the essence of your coffee haven to life. From the first sip to the last drop, let this presentation showcase the soul-warming experience your coffee shop provides. Fully customizable and compatible with Powerpoint, Keynote, and Google Slides. Utilize warm colors like browns, oranges, and yellows to evoke a cozy, comforting atmosphere. The template integrates coffee cup icons, latte art, and coffee bean graphics for a coffee-centric theme.


6 slides
Stakeholder Analysis Chart Infographic
Stakeholder analysis is a process used by organizations to identify and assess the interests, concerns, expectations, and potential impact of various individuals, groups, or entities that have a stake in a particular project, decision, or initiative. The goal of this infographic is to better understand the perspectives and needs of different stakeholders and to use this information to inform decision-making and project planning. This template summarizes the importance of stakeholder analysis in project management or organizational decision-making. This compatible with Powerpoint, Keynote, and Google Slides.


4 slides
Editable SWOT Layout Slide Presentation
Kickstart your strategy session with a clean, modern slide that makes evaluating strengths, weaknesses, opportunities, and threats feel simple and organized. This presentation helps teams break down key insights using a balanced, easy-to-read layout designed for clarity and impact. Perfect for planning and decision-making. Fully compatible with PowerPoint, Keynote, and Google Slides.


7 slides
SCRUM Roles Infographic
Dive into the agile world with our SCRUM roles infographic. This template is designed to depict the various roles within the SCRUM framework, offering clarity and insight into the collaborative heart of agile methodologies. With a clean white canvas set against hues of blue, it provides a modern yet comprehensive overview of the roles. Ideal for agile coaches, trainers, and organizations transitioning to agile methodologies, this infographic is tailored to showcase the importance of each role. With its compatibility, spanning PowerPoint, Keynote, and Google Slides, presentations are bound to be a breeze, regardless of the platform you favor.


7 slides
Growth Mindset Infographic Presentation
A Growth Infographic is a visual representation of data that displays the growth of a particular business, industry, or market over time. It can be used to illustrate growth in areas such as revenue, profits, customer base, or market share. This growth template includes a timeline and graphs that shows the change in data over time, presented in a visually appealing way using icons, symbols, and color-coding. Use this infographic to include additional information such as industry trends, key drivers of growth, and future projections. Easily edit in Powerpoint, Keynote, and Google Slides.

21 slides
Flare Creative Portfolio Presentation
Showcase your creative work with this elegant portfolio template! Perfect for highlighting projects, client testimonials, and services offered. Ideal for artists, designers, and creatives aiming to impress clients and collaborators. Compatible with PowerPoint, Keynote, and Google Slides, this template ensures your portfolio is clear, professional, and visually stunning. Make your work shine!


25 slides
Siren Rebranding Project Plan Presentation
This sleek brand presentation template covers essential elements like market analysis, brand guidelines, positioning, and audience insights. It's designed to showcase your brand identity and development strategies with a modern layout. Compatible with PowerPoint, Keynote, and Google Slides, it’s perfect for delivering professional and engaging brand presentations.


4 slides
Business SWOT Evaluation Presentation
Break down business strategies with this visually structured SWOT analysis layout. Present strengths, weaknesses, opportunities, and threats in a clean, quadrant-style format. Ideal for reports, pitches, or internal reviews. Fully editable in PowerPoint, Keynote, and Google Slides for clear, impactful analysis that drives smarter decision-making and strategic alignment.


6 slides
Brain Development Infographic
Brain Development refers to the growth, maturation, and organization of the brain throughout an individual's life, starting from early prenatal stages and continuing into adulthood. This infographic template serves as a valuable educational resource for educators, parents, healthcare professionals, and anyone interested in understanding the fascinating process of brain development. This infographic highlights the stages and factors that shape brain growth, to help promote awareness and emphasize the importance of creating supportive environments for brain development. Compatible with Powerpoint, Keynote, and Google Slides.