


Features
- 2 Unique slides
- Fully editable and easy to edit in Microsoft Powerpoint, Keynote and Google Slides
- 16:9 widescreen layout
- Clean and professional designs
- Export to JPG, PDF or send by email


Do you have any questions?
Recommend


4 slides
Island Nations & Business Opportunity Map Presentation
Spotlight key business opportunities across island nations with the Island Nations & Business Opportunity Map Presentation. This slide includes a world map with customizable markers and labels, ideal for showcasing strategic locations, growth markets, or project hubs. Easy to edit in Canva, PowerPoint, and Google Slides to match your brand.


21 slides
Fortuna Product Development Plan Presentation
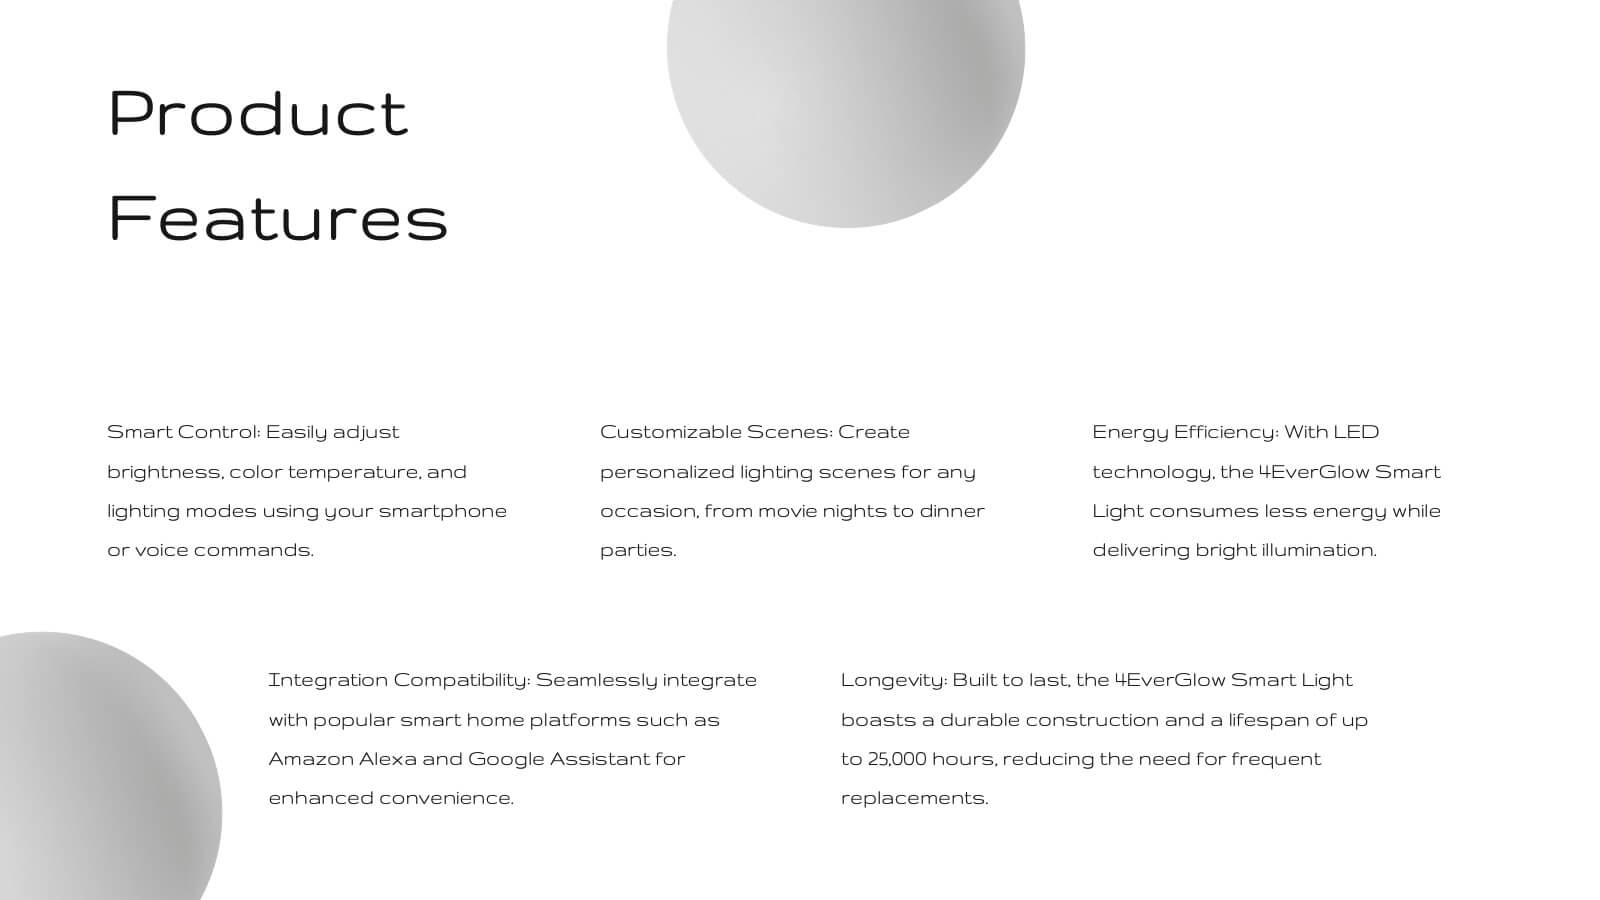
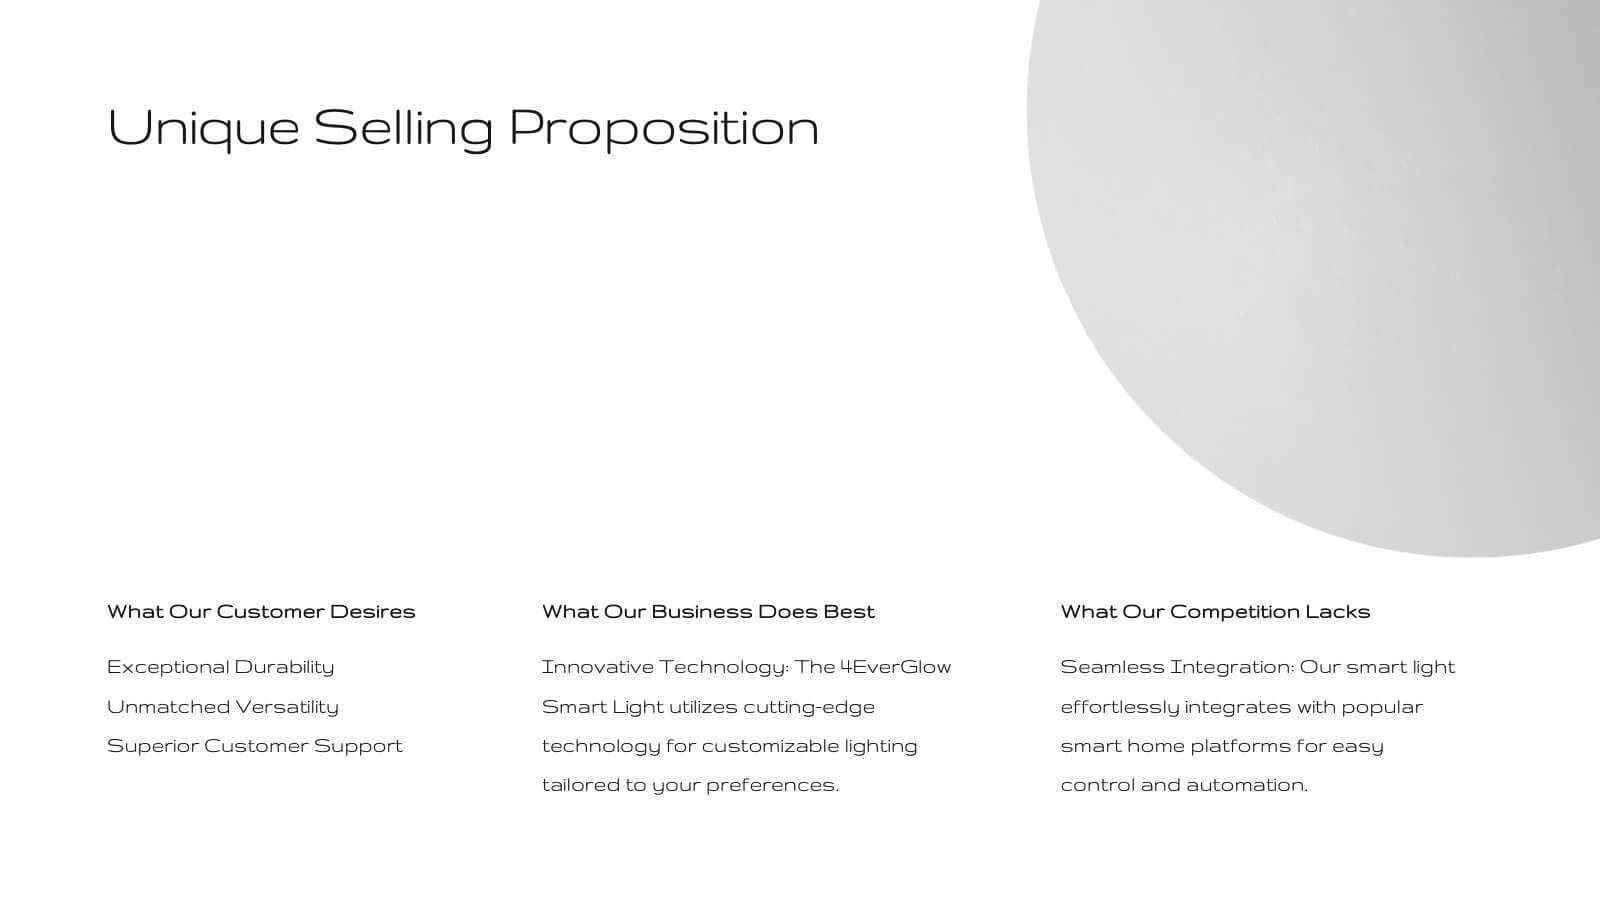
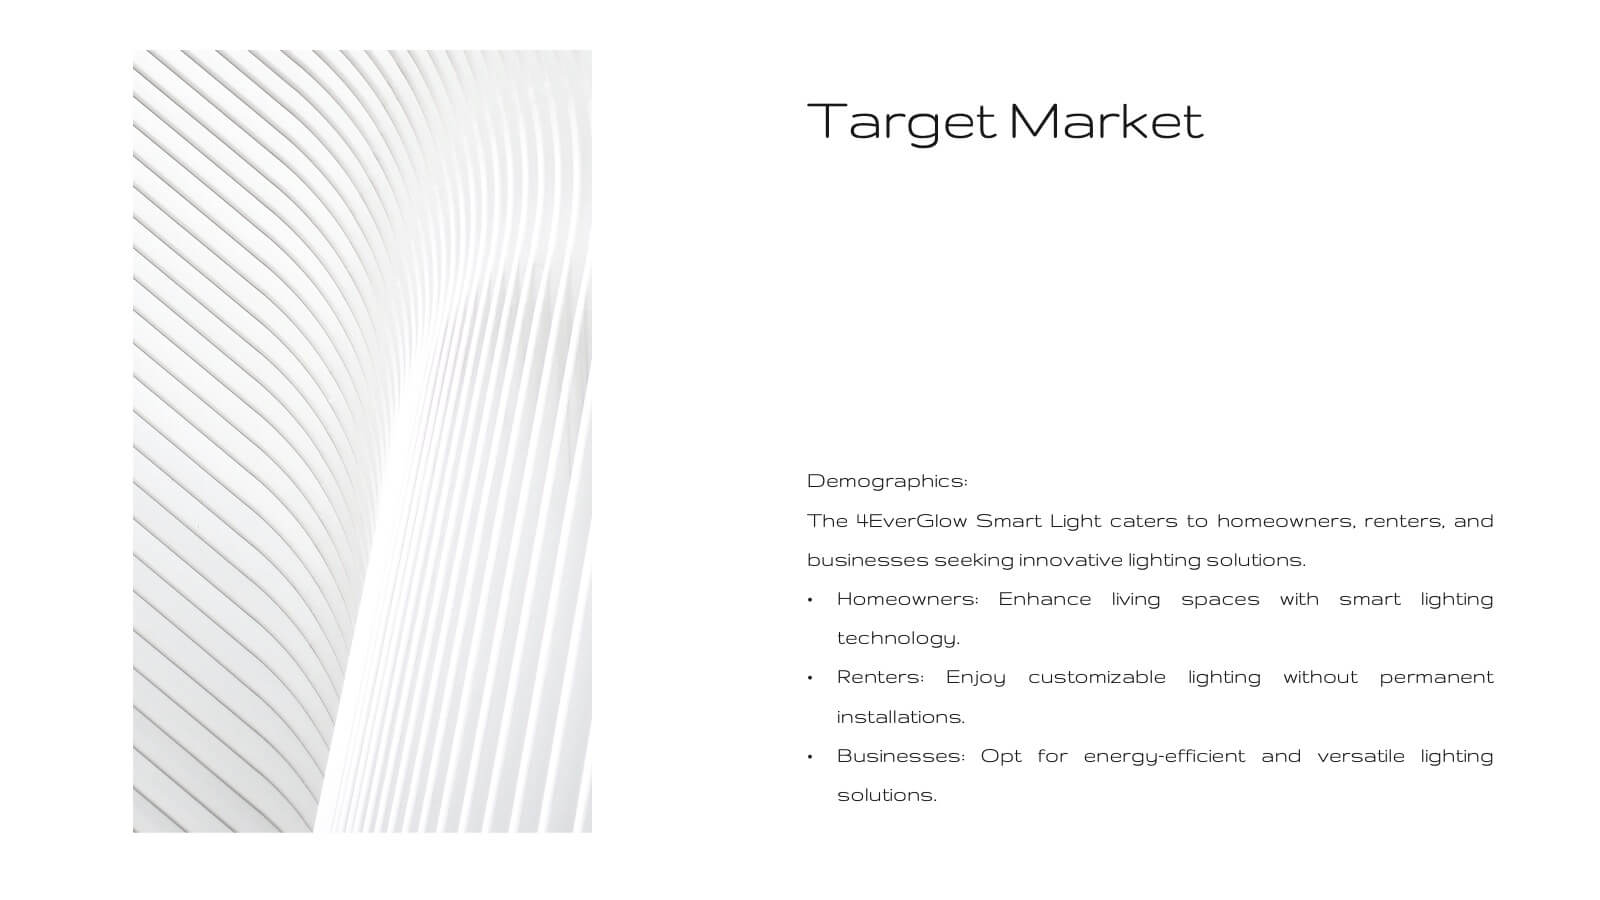
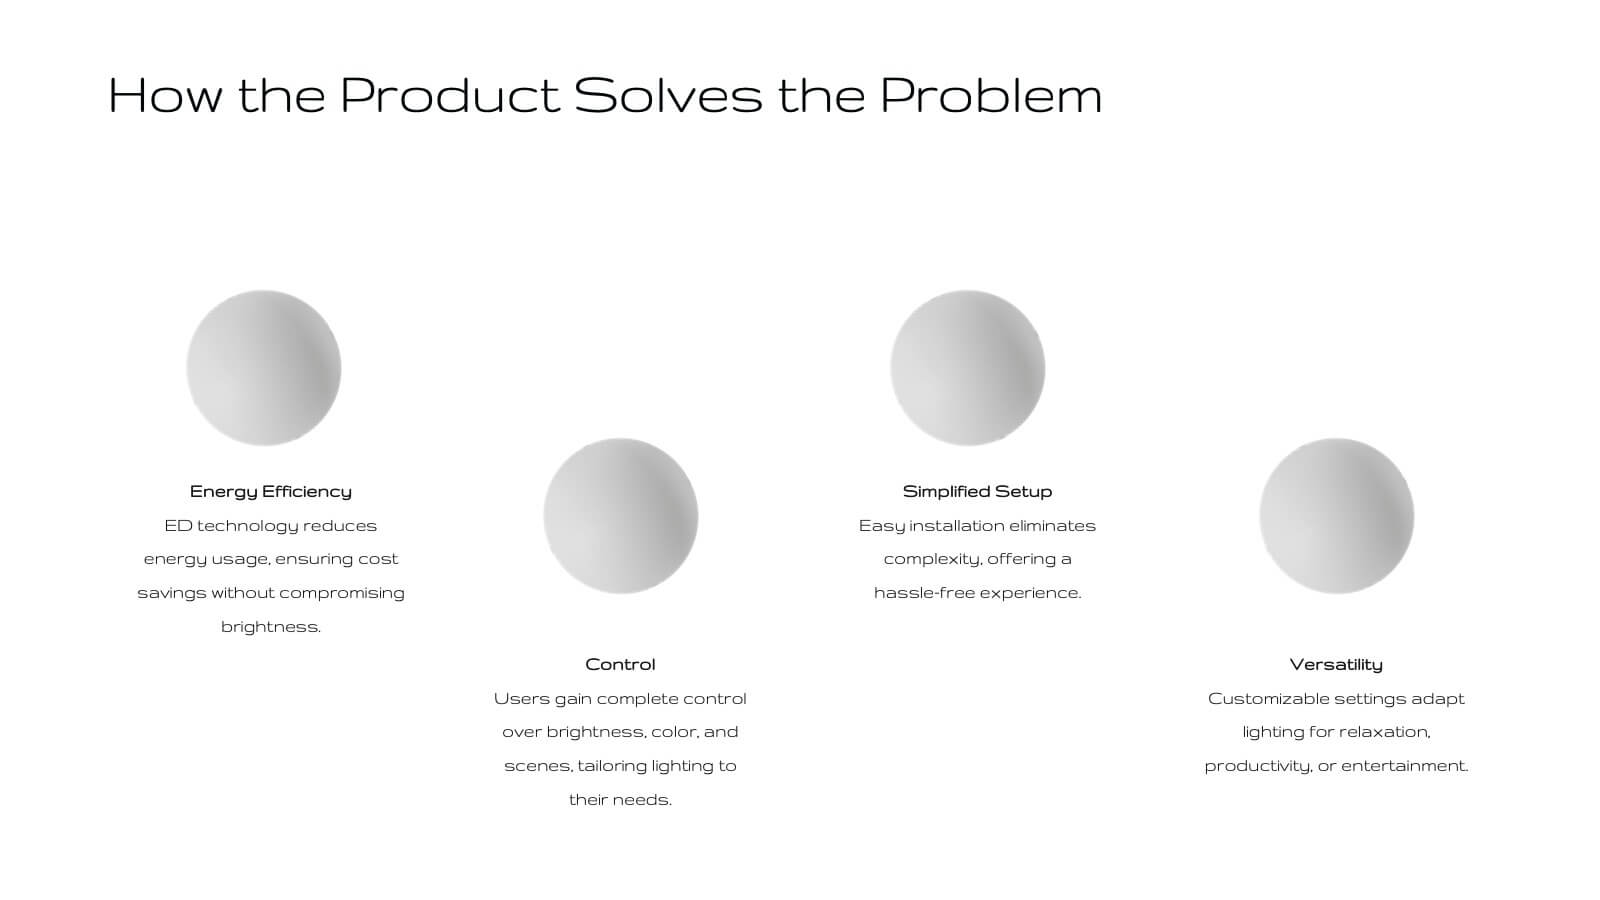
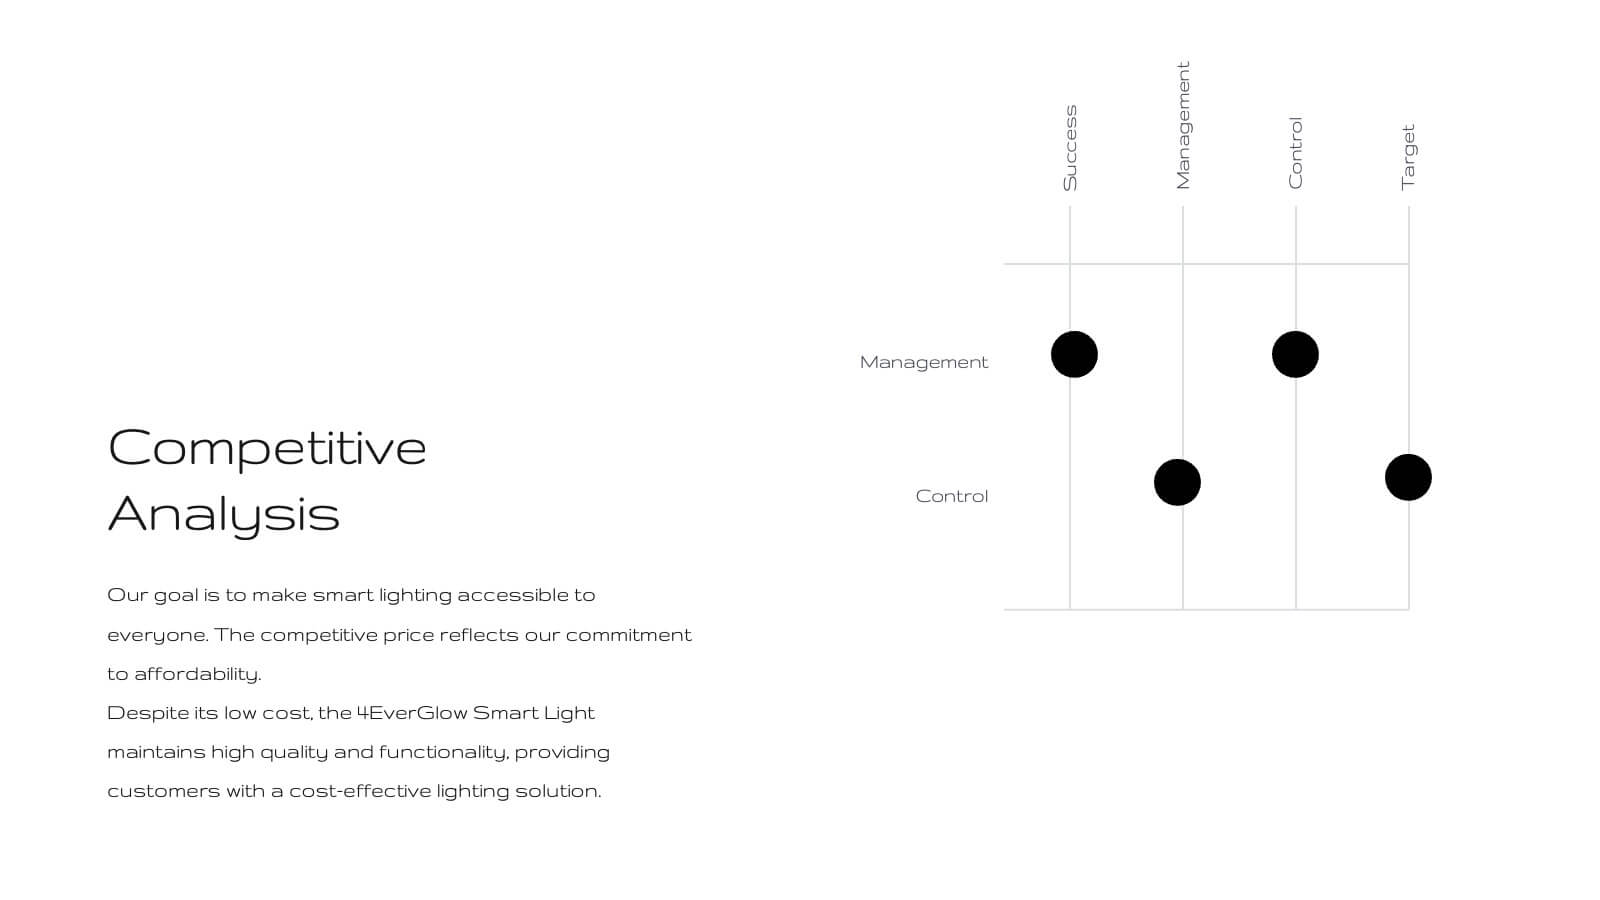
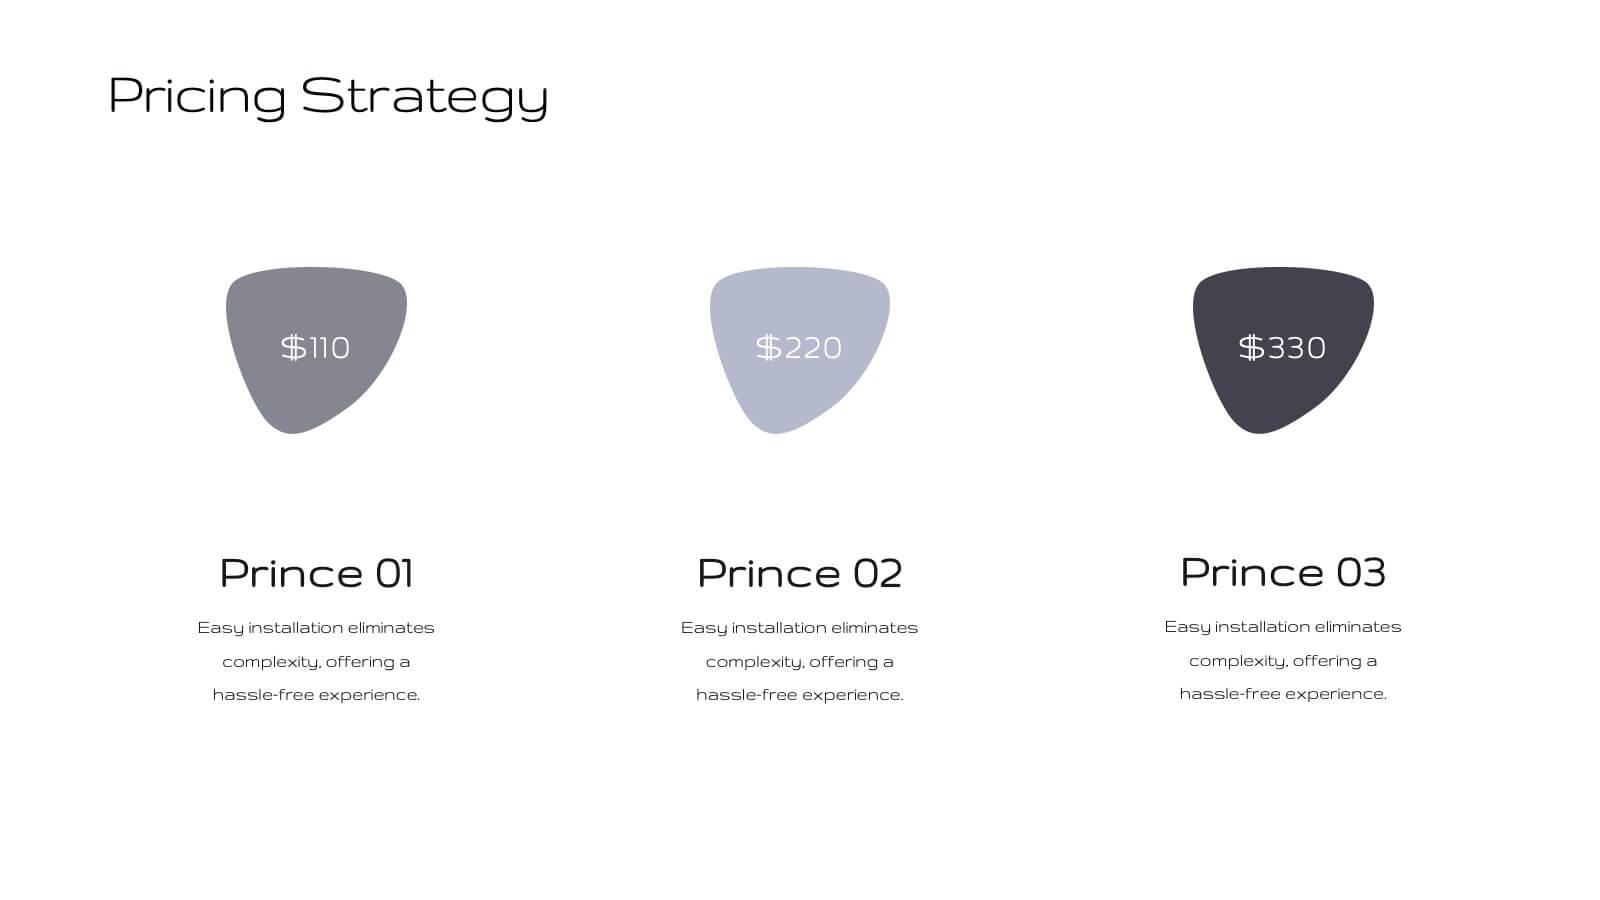
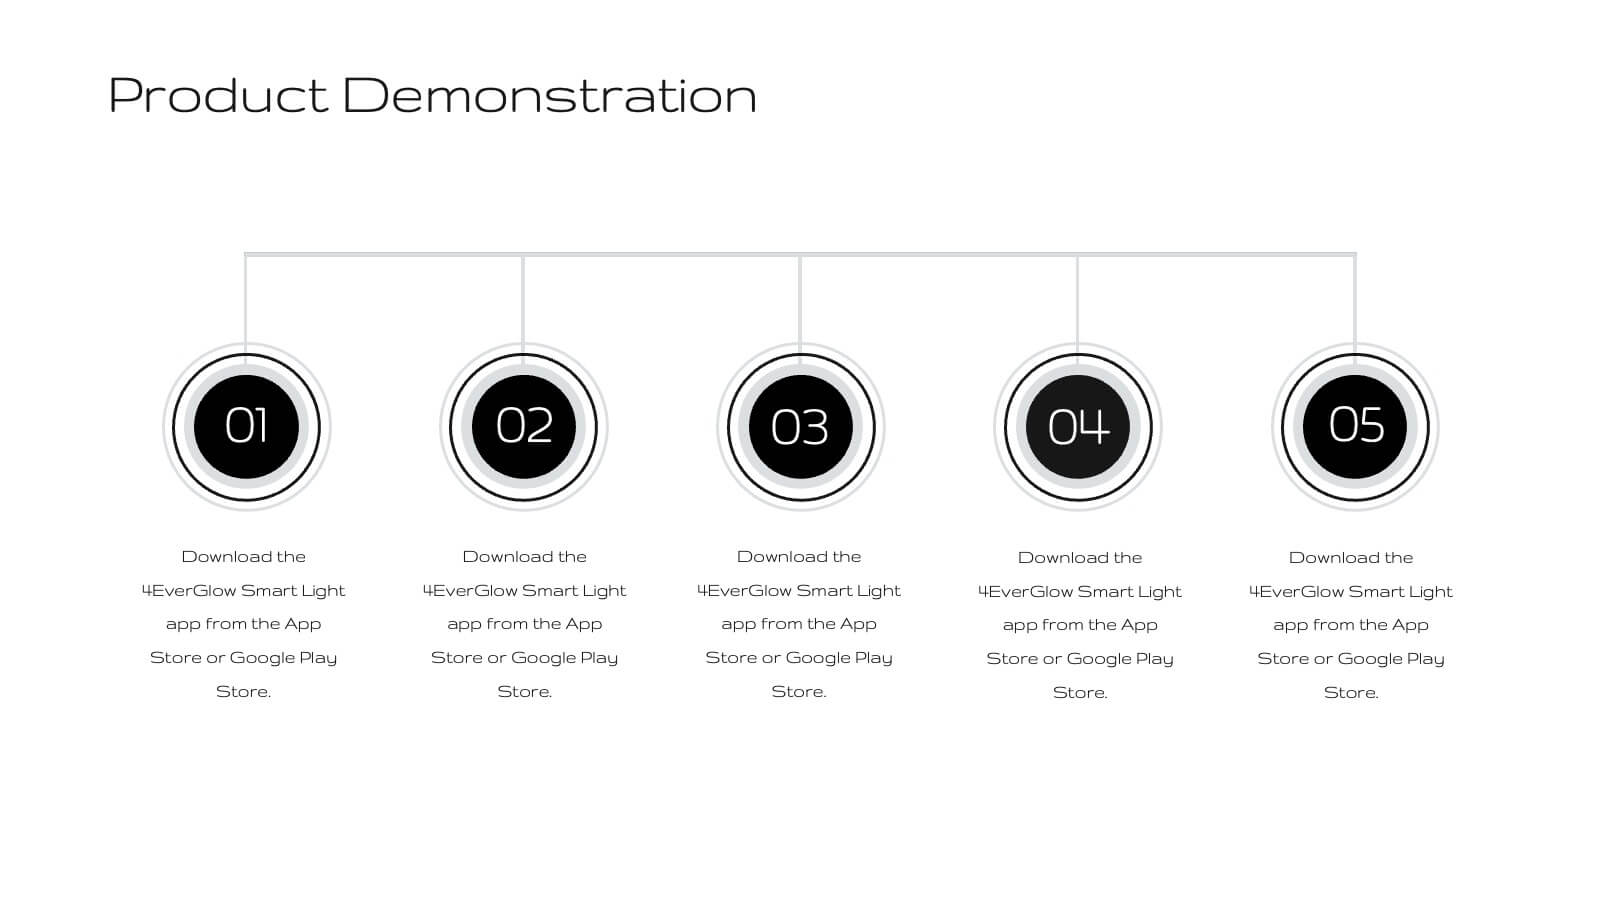
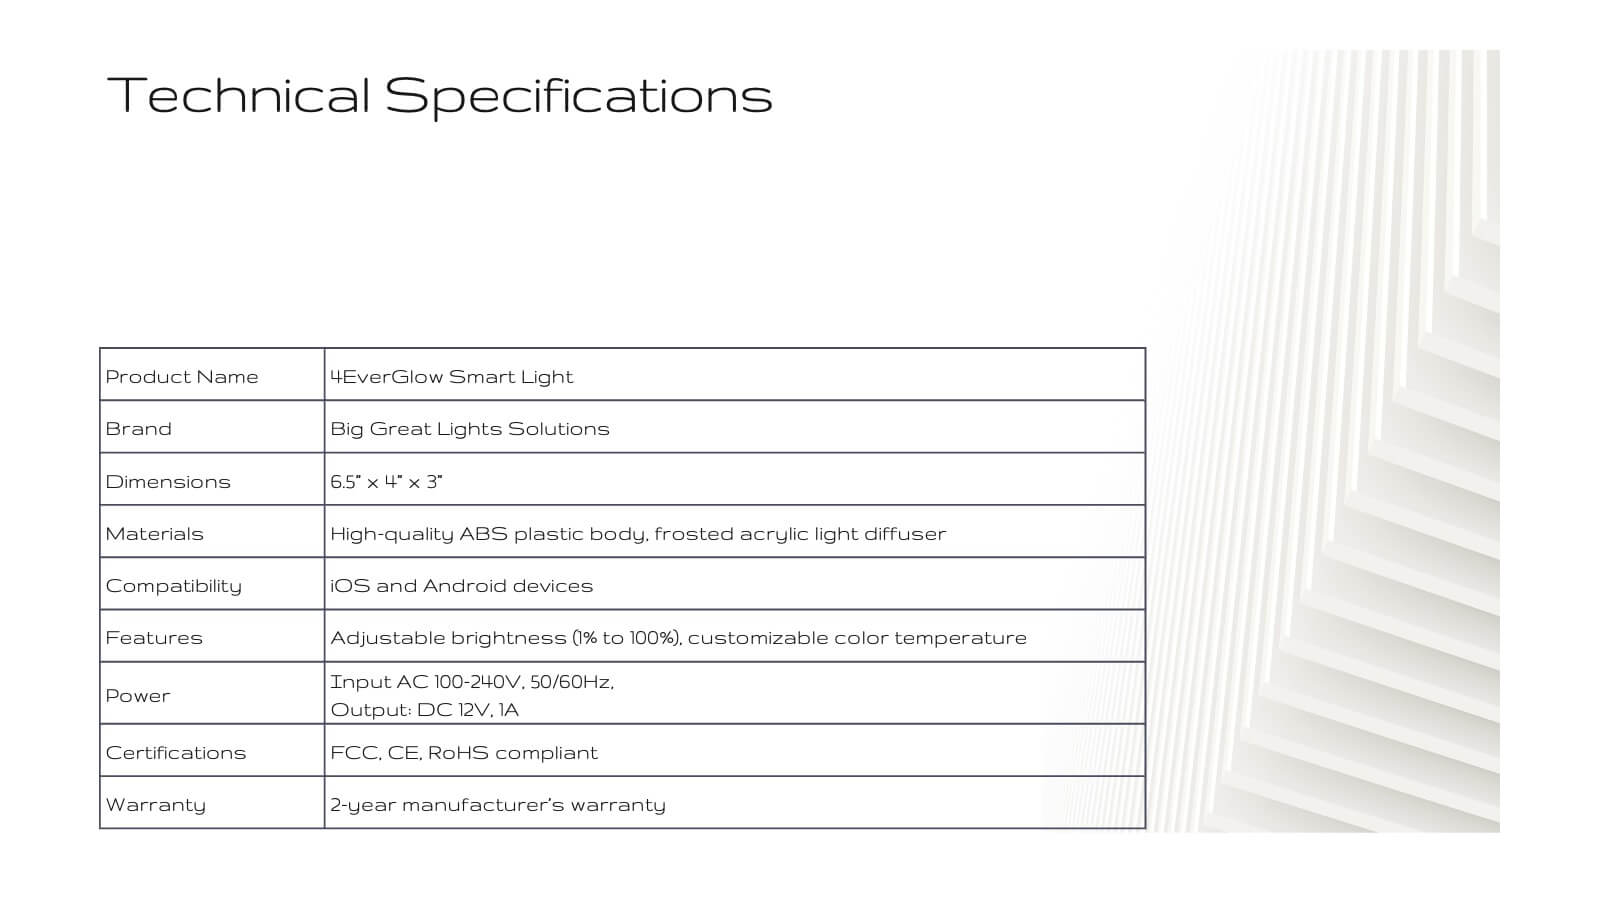
Unveil your product's potential with this elegant, minimalist presentation template. Perfect for detailing product development, features, and market strategies, it features a clean design that emphasizes clarity and professionalism. Highlight key aspects like customer pain points, competitive analysis, and pricing strategies to captivate your audience. Compatible with PowerPoint, Keynote, and Google Slides, it ensures seamless presentations on any platform.


5 slides
Suicide Prevention & Awareness Infographics
Suicide Awareness plays a vital role in addressing the global public health issue of suicide. These vertical infographics are powerful and informative designs that aim to raise awareness about suicide prevention, promote mental health, and provide essential information to help individuals recognize the signs and support those in need. With its thoughtful and sensitive design, the template communicates important statistics, facts, and resources. The template is fully customizable, allowing you to personalize the infographics with your own content, including local helpline numbers, support services, or specific awareness campaigns.


4 slides
Nutrition and Diet Plan Presentation
Present your wellness programs with clarity using this circular nutrition infographic. Ideal for showcasing food groups, dietary recommendations, or balanced meal plans, this layout uses segmented visuals and icons for better understanding. Perfect for nutritionists, wellness coaches, or healthcare professionals. Compatible with PowerPoint, Keynote, and Google Slides.


6 slides
Touchpoint-Based Customer Journey Map Presentation
Visualize each stage of the user experience with this Touchpoint-Based Customer Journey Map presentation. Perfect for tracking interactions across the customer lifecycle—from awareness to loyalty—this layout helps pinpoint strengths and gaps at every phase. Clean columns and color-coded touchpoints ensure quick analysis. Fully compatible with PowerPoint, Canva, and Google Slides.


5 slides
Insurance Risk Management Presentation
Make complex risk strategies easy to understand with this clean and professional presentation design. Perfect for explaining insurance coverage, threat assessment, or business protection plans, it blends clear visuals with modern design elements. Fully editable and compatible with PowerPoint, Keynote, and Google Slides for effortless customization and presentation.


5 slides
Decision Matrix Presentation
Make tough choices feel simple with this clear, color-coded layout designed to compare options side-by-side. This presentation helps you evaluate criteria, score alternatives, and present well-structured reasoning with confidence. Clean, intuitive, and fully editable. Compatible with PowerPoint, Keynote, and Google Slides.


8 slides
End-to-End Supply Chain Optimization
Enhance your supply chain efficiency with this dynamic circular diagram slide. Ideal for logistics experts, supply chain strategists, and consultants, this template visually captures the continuous flow of an 8-step supply chain cycle. Each step is customizable with editable icons and text in PowerPoint, Keynote, and Google Slides.


7 slides
Step Numbers Infographic
A numbers infographic is a visual representation of data, statistics, or numerical information presented in a clear, concise, and visually appealing manner. This infographic template aims to communicate complex numerical data or figures in a way that is easy to understand and interpret. Compatible with Powerpoint, Keynote, and Google Slides. Utilizes the charts, graphs, icons, and other graphical elements to represent numerical data. These infographic visuals make it easier for viewers to grasp the meaning behind the numbers. This template will allow you to focus on presenting key numerical insights.


3 slides
Automation and AI Strategy Framework Presentation
Take your ideas for a high-tech spin with this bold and modern layout! This template visually breaks down strategic frameworks for automation and AI by using a clean, segmented circular flow. Ideal for showcasing processes, data integration, or tech-driven initiatives. Fully compatible with PowerPoint, Keynote, and Google Slides for seamless editing.


5 slides
Human Resources Department Infographics
The Human Resources (HR) department is an integral part of an organization, responsible for managing and developing the organization's human capital. These informative infographics aim to provide a comprehensive overview of the functions, roles, and importance of the HR department in managing the organization's workforce. Whether used in HR conferences, employee orientations, or internal communications, this template helps convey crucial information in a visually appealing manner, enhancing understanding for the HR department's role in managing and developing the organization's most valuable asset - its people.


4 slides
Differentiation through Blue Ocean Framework Presentation
Make waves with this bold, eye-catching layout built to show what sets your strategy apart. This presentation template explores how to stand out in untapped markets using a simple comparison framework, perfect for teams shifting from competition to innovation. Easily editable and ready for PowerPoint, Keynote, and Google Slides.


6 slides
Buyer Behavior Trends Infographic
Unlock the secrets of consumer psychology with our Buyer Behavior Trends Infographic Template. This template offers a compelling visual exploration of modern consumer trends, designed to capture and convey the nuances of buyer behavior in today’s fast-paced market. Featuring a sleek, modern design, each slide is tailored to present data effectively, from spending habits and brand loyalty to digital consumption and decision-making processes. Use this template to illustrate the underlying factors that influence consumer choices and how these trends shape the future of marketing. Perfect for marketers, researchers, and business strategists, this template allows you to customize layouts, colors, and fonts to align with your brand or study focus. It's an invaluable tool for presentations, reports, and digital content, helping you to communicate complex data in an accessible and engaging way.


8 slides
Simplified Step-by-Step Process Plan Presentation
Break complex workflows into clear, manageable steps with the Simplified Step-by-Step Process Plan Presentation. Designed with a clean vertical timeline and alternating flag-style indicators, this template guides viewers through four distinct phases—ideal for process explanations, onboarding flows, or project milestones. Each step features a matching icon and space for concise descriptions to keep your message clear and structured. Fully editable in PowerPoint, Keynote, and Google Slides.


5 slides
Company Origin and Growth History Presentation
Showcase your company’s journey with the Company Origin and Growth History Presentation. This visual step diagram is ideal for illustrating key milestones, business expansion, or historical achievements. Perfect for pitch decks, annual reports, or investor updates. Fully editable in Canva, PowerPoint, Keynote, and Google Slides for seamless customization.


7 slides
Agenda and Sections TOC Presentation
Bring your audience in with a dynamic, story-driven overview that makes each section feel intentional and easy to follow. This presentation highlights key agenda points in a clean, structured layout, helping you introduce topics with clarity and flow. Fully compatible with PowerPoint, Keynote, and Google Slides.


4 slides
Simple and Effective Steps Presentation
Guide your audience through a seamless workflow with this "Simple and Effective Steps" template. Designed for clarity and impact, this layout breaks down processes into four distinct steps, making it ideal for project planning, decision-making, and strategy execution. Fully customizable and compatible with PowerPoint, Keynote, and Google Slides.