


Features
- 6 Unique slides
- Fully editable and easy to edit in Microsoft Powerpoint, Keynote and Google Slides
- 16:9 widescreen layout
- Clean and professional designs
- Export to JPG, PDF or send by email


Do you have any questions?
Recommend


10 slides
Simplified Workflow in Four Clear Steps Presentation
Guide your audience through structured execution with the Simplified Workflow in Four Clear Steps Presentation. This vertical step diagram visually organizes key stages for task progression, planning, or implementation workflows. Each block is labeled, color-coded, and easy to customize—making your message direct and engaging. Fully editable in PowerPoint, Keynote, Google Slides, and Canva.


6 slides
Big Data Technology Infographic
Big Data technology refers to the tools, techniques, and frameworks used to capture, store, process, analyze, and visualize large and complex datasets that are beyond the capabilities of traditional data processing systems. This infographic template is perfect for organizations that deal with massive volumes of data from various sources, including social media, sensors, machines, and more. This template enables businesses to gain valuable insights, make informed decisions, and create new opportunities. This infographic can be used for various industries, including e-commerce, healthcare, finance, manufacturing, and more.


5 slides
Task Management and Scheduling
Stay organized and efficient with this clear task management and scheduling layout. This presentation makes it easy to prioritize assignments, allocate time slots, and track progress using a visual clock-based design. Perfect for business operations, project coordination, workflow planning, and productivity meetings. Fully customizable and compatible with PowerPoint, Keynote, and Google Slides.


5 slides
4-Level Hierarchy Tree Presentation
Bring your ideas to life with a smooth, layered flow that feels modern and engaging from the very first glance. This presentation helps you break down complex structures into four clear levels, making information easy to follow and visually compelling. Perfect for explaining processes, roles, or systems with clarity. Fully compatible with PowerPoint, Keynote, and Google Slides.


4 slides
Scrum & Agile Sprint Presentation
Bring movement and clarity to your workflow with a dynamic loop-and-sprint visual that makes progress feel intuitive and easy to track. This presentation helps you outline iterations, refine tasks, and communicate team priorities with confidence. Fully editable and compatible with PowerPoint, Keynote, and Google Slides.


6 slides
Executive Leadership Training Presentation
Enhance professional development with this executive leadership training template, designed with a step-by-step staircase layout symbolizing career progression. Perfect for leadership programs, corporate training, and skill-building workshops, it visually organizes six key topics for clarity. Fully editable in Canva, PowerPoint, or Google Slides, making customization effortless for any organization’s needs.


5 slides
Professional Company Overview Slide Presentation
Showcase your business story with confidence using this sleek and structured layout designed for clarity and professionalism. Ideal for introducing teams, services, and company milestones, it helps you communicate key insights effectively. Fully customizable and compatible with PowerPoint, Keynote, and Google Slides for effortless presentation creation and editing.


7 slides
Fishbone Analysis Infographic Presentation
A fishbone Infographic is a technique used to brainstorm the cause of a problem. The unique design helps you understand how one thing can lead to another and is effective at helping you create a solution that reviews all aspects. Start this template off using the head of the fish as a prompt and webbing out from there, draw up to six main causal categories and then sub-categories. Use this infographic to organize your ideas and identify key factors, as well as decide how to prioritize them. This template is compatible and completely editable with Powerpoint, keynote and google slides.


8 slides
Effective Learning Techniques Presentation
Optimize learning strategies with the Effective Learning Techniques Presentation template. This dynamic and structured design helps illustrate key educational approaches, training methods, and cognitive learning strategies. Perfect for educators, trainers, and instructional designers, this fully editable template ensures clarity and engagement. Compatible with PowerPoint, Keynote, and Google Slides for seamless integration into your presentations.


7 slides
Competitive Advantage Through Value Chain
Make your value chain comparison stand out with this bold, visual slide that maps two sides head-to-head. Perfect for highlighting competitive advantages, strategic differences, and operational gaps. This template is clear, customizable, and ready to plug into PowerPoint, Keynote, or Google Slides.


6 slides
Veterinary Services Infographic
Veterinary services refer to medical and healthcare services provided to animals by trained and licensed professionals called veterinarians. This infographic template aims to educate pet owners and the general public about the importance of veterinary care for animals' health and well-being. This template serves as a valuable resource for pet owners, animal lovers, and anyone interested in understanding the significance of veterinary care in maintaining the well-being of our beloved animal companions. This infographic aims to promote responsible pet ownership and raise awareness about the importance of regular veterinary visits for pets' health and happiness.


4 slides
Side by Side Comparison Presentation
Enhance your presentations with our "Side by Side Comparison Presentation" template. Designed for clarity, this infographic facilitates effective comparison of key business insights across multiple categories using a side-by-side layout. Color-coded arrows distinctly mark each comparison point, ensuring easy navigation and comprehension. Ideal for strategic reviews, product comparisons, or competitive analyses, this template helps present complex data clearly and engagingly. Its structured format is perfect for professionals looking to articulate differences and similarities effectively. Fully compatible with PowerPoint, Keynote, and Google Slides, it's an indispensable tool for those needing to present comparative data succinctly and persuasively.


2 slides
Stylish Title Cover Presentation for Reports Presentation
Set the tone with a title slide that means business—without being boring. This stylish cover layout gives your report presentations a polished, modern look while keeping the focus clear and professional. Ideal for executive updates or client-facing decks, it’s fully editable and works perfectly in PowerPoint, Keynote, and Google Slides.


4 slides
Risk Assessment Heat Map
Visualize and evaluate risk levels with clarity using this impact-based heat map layout. Ideal for risk management reports, audits, and strategic planning, this template highlights potential threats across multiple categories and severity levels. Fully customizable in PowerPoint, Keynote, and Google Slides.


6 slides
Six Sigma Process Infographic
Dive into the world of process improvement with our six sigma process infographic. Crafted with a harmonious blend of blue, yellow, and white, this infographic elucidates the principles of Six Sigma methodology in an engaging manner. Ideal for business analysts, quality assurance teams, and corporate trainers, it delineates the DMAIC process in vivid detail. The design encapsulates the rigorous methodology of Six Sigma, providing clarity and fostering knowledge retention. This versatile template is a perfect fit for PowerPoint, Keynote, and Google Slides, making your presentations both captivating and insightful.


2 slides
Eye-Catching Title Cover Slide Presentation
Capture attention instantly with this bold, modern title cover slide. Featuring vibrant colors, oversized geometric shapes, and strong typography, this layout is ideal for setting the tone in creative, marketing, or business presentations. The design is fully editable and compatible with PowerPoint, Keynote, and Google Slides—making it easy to tailor to your brand and message.

22 slides
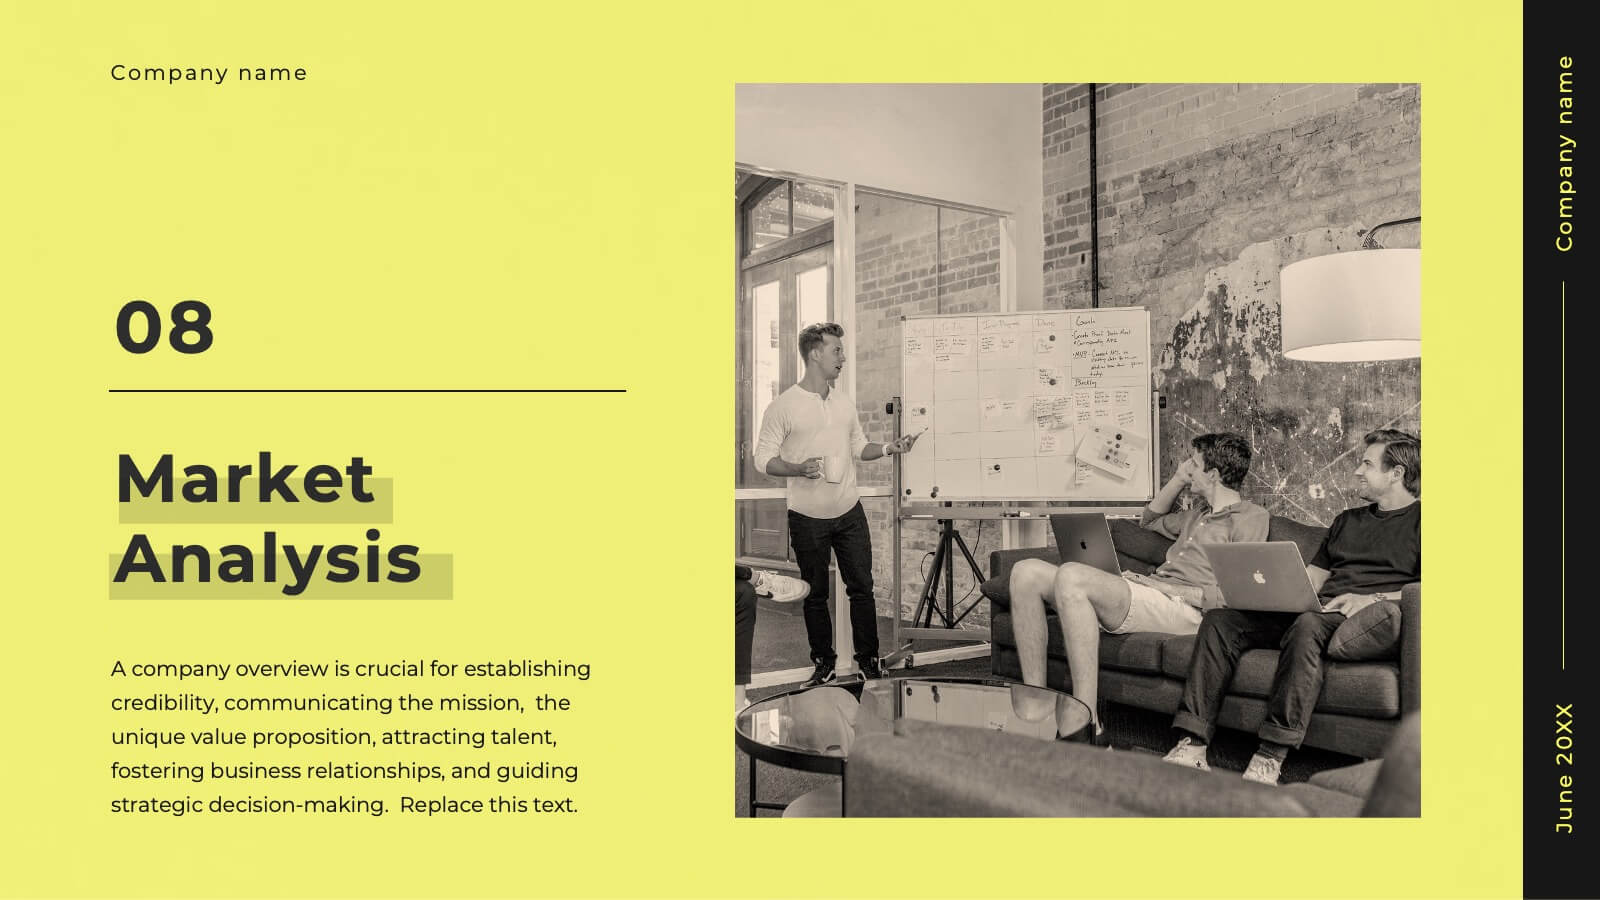
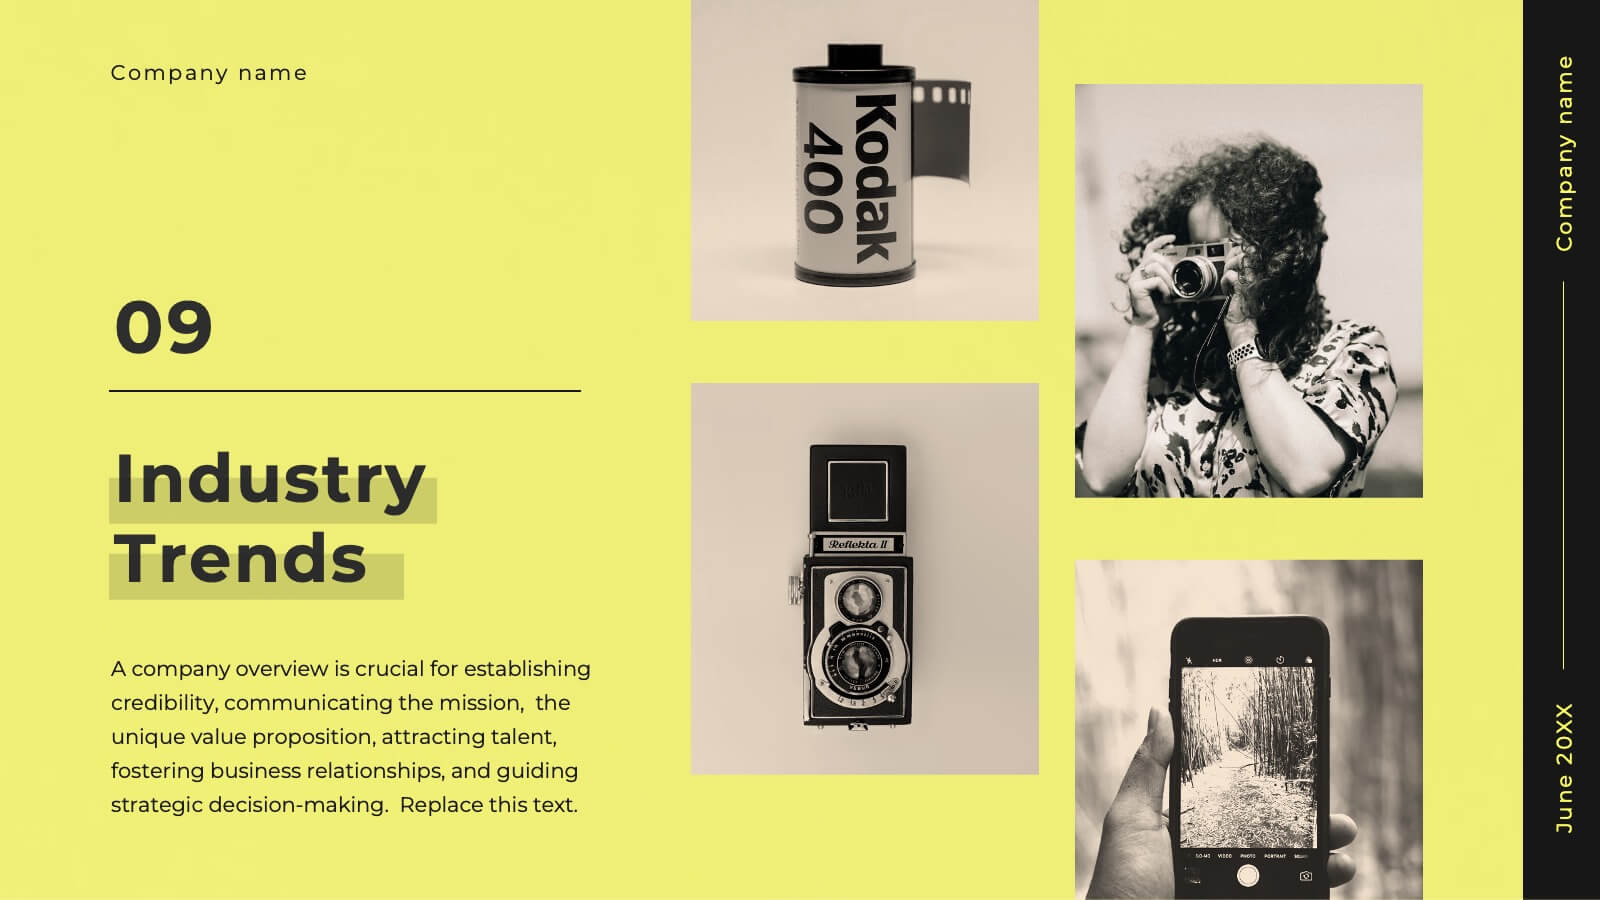
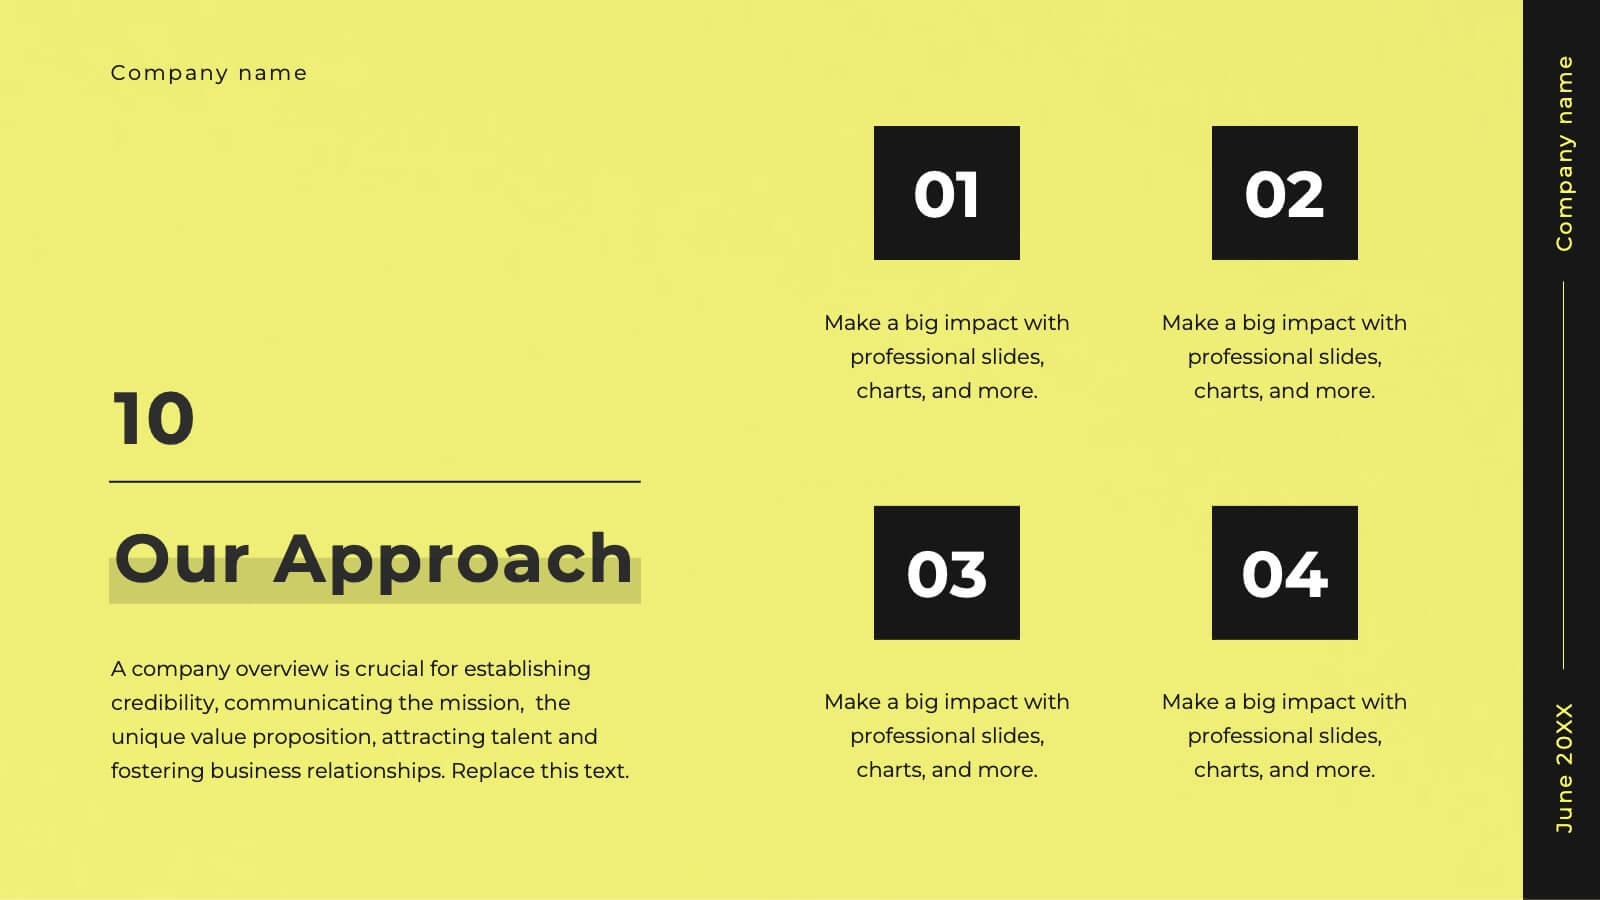
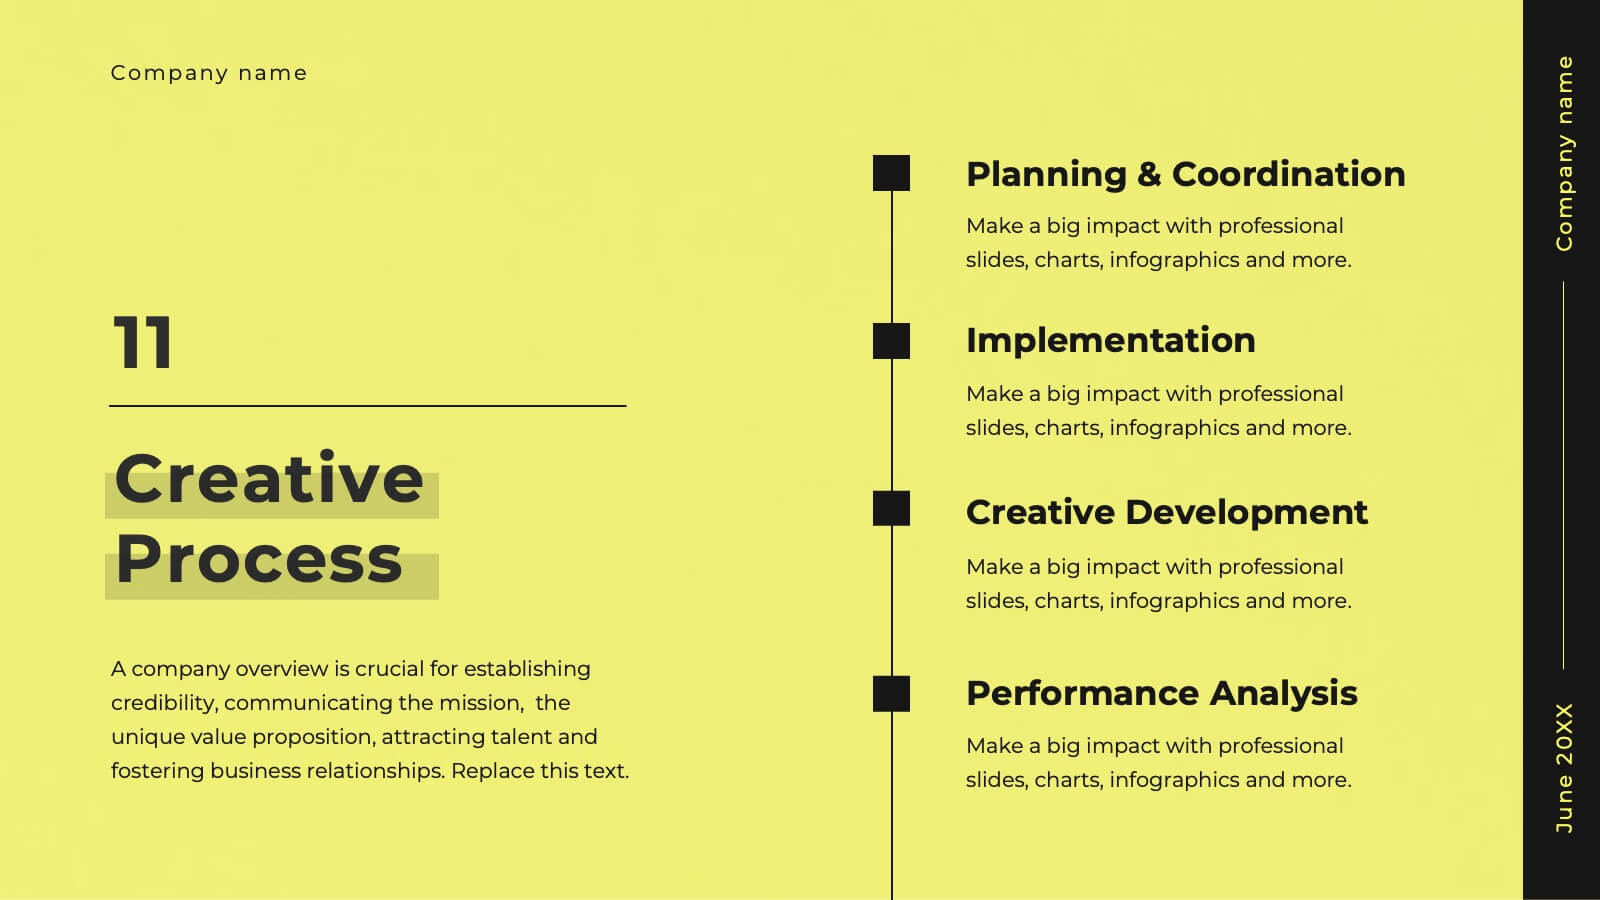
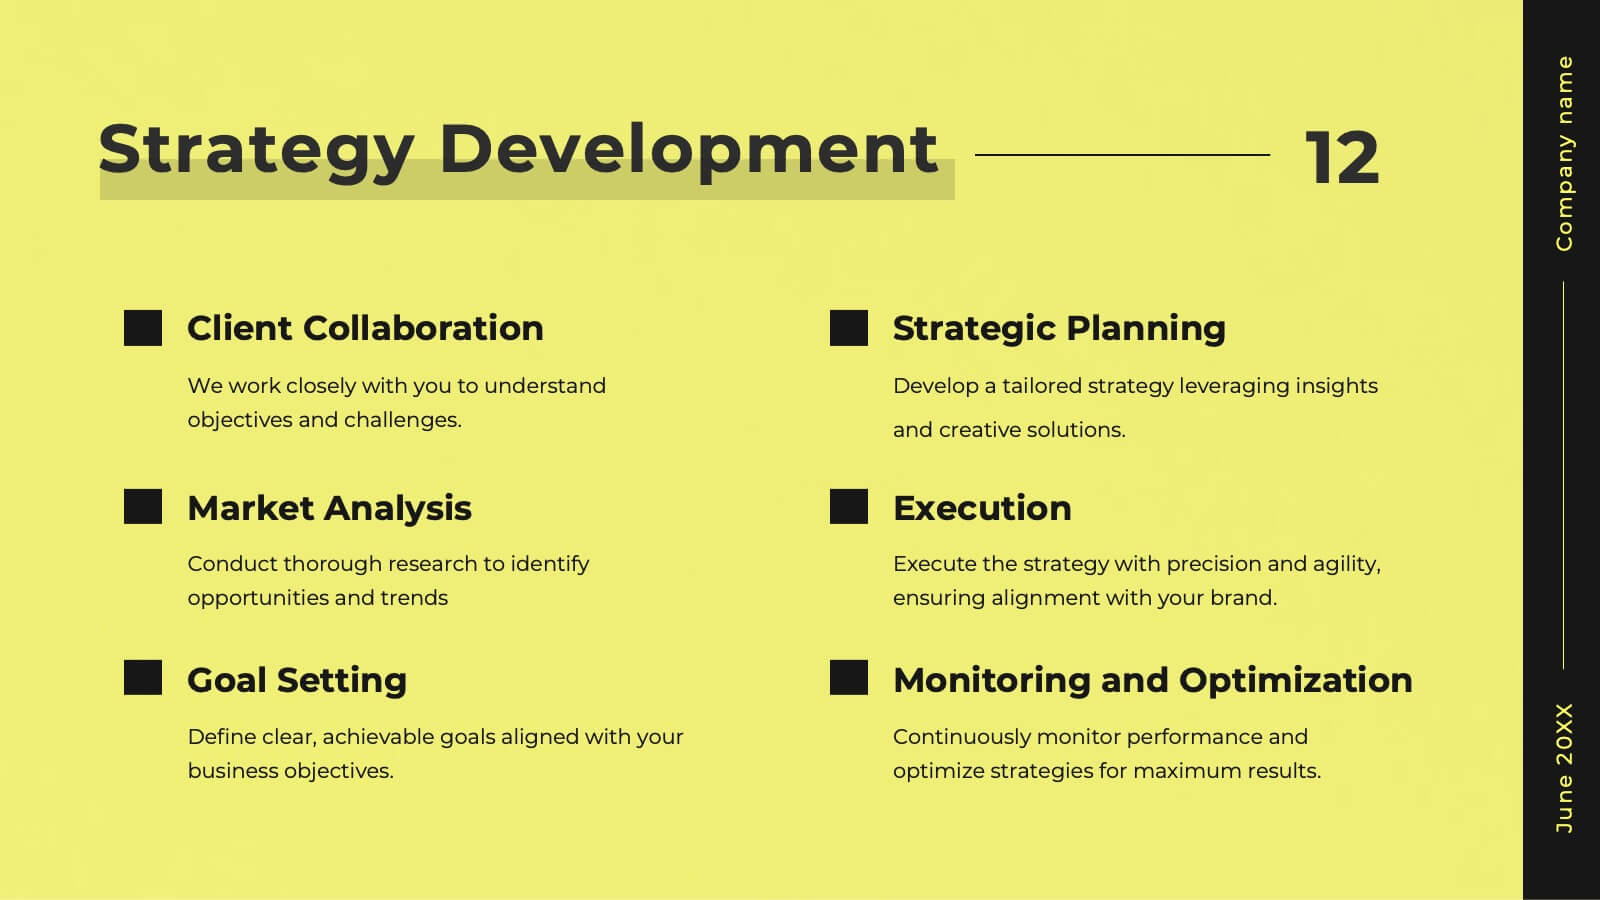
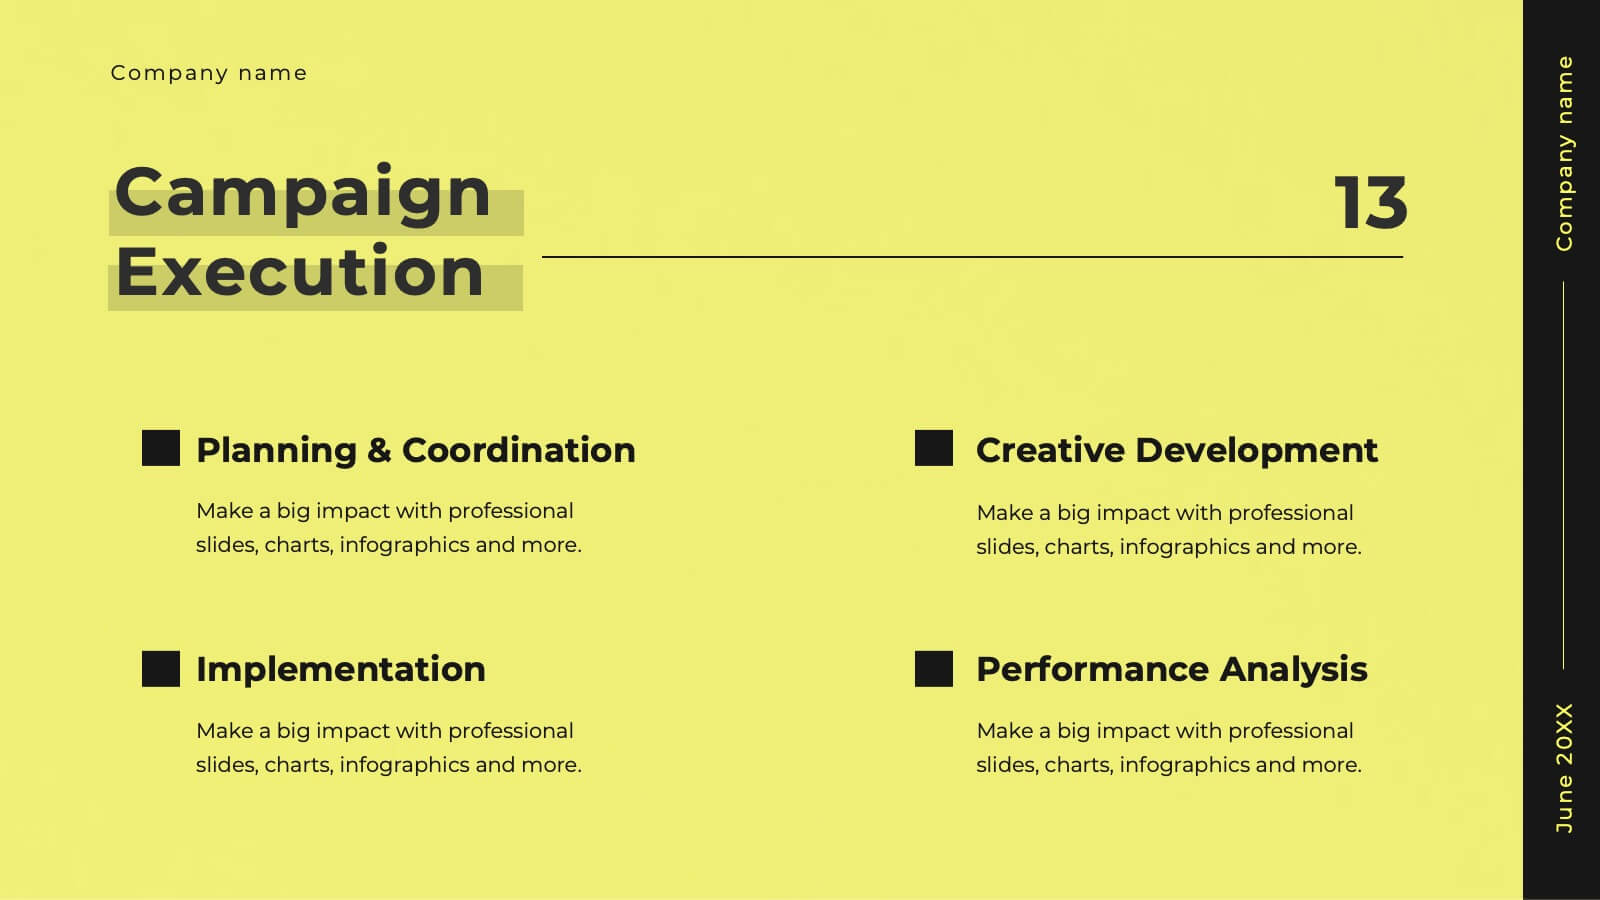
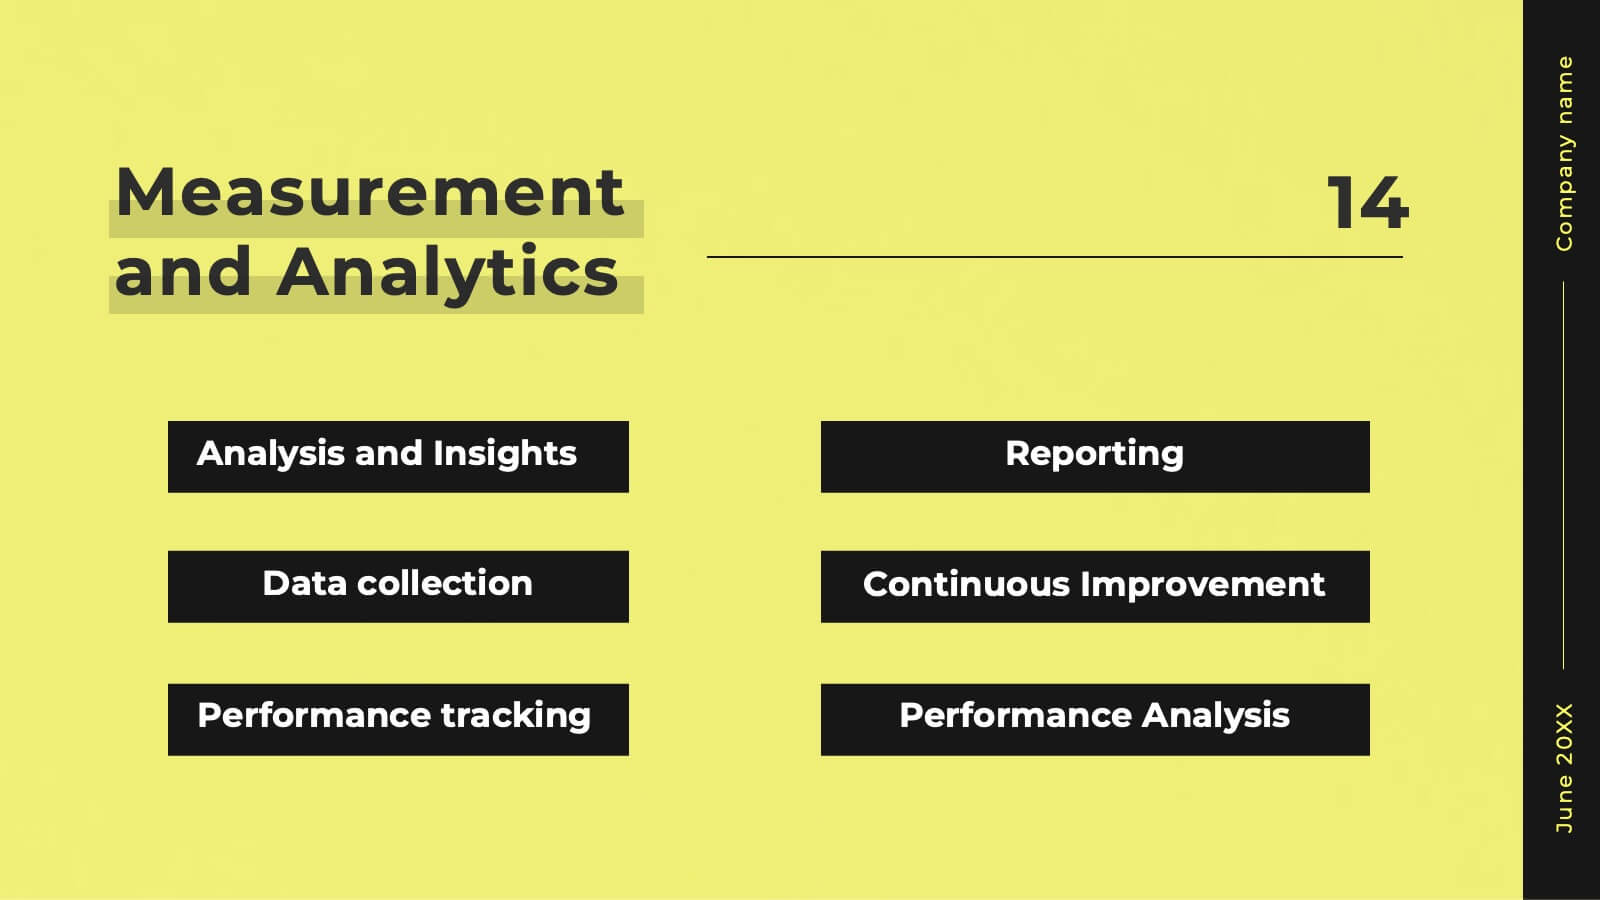
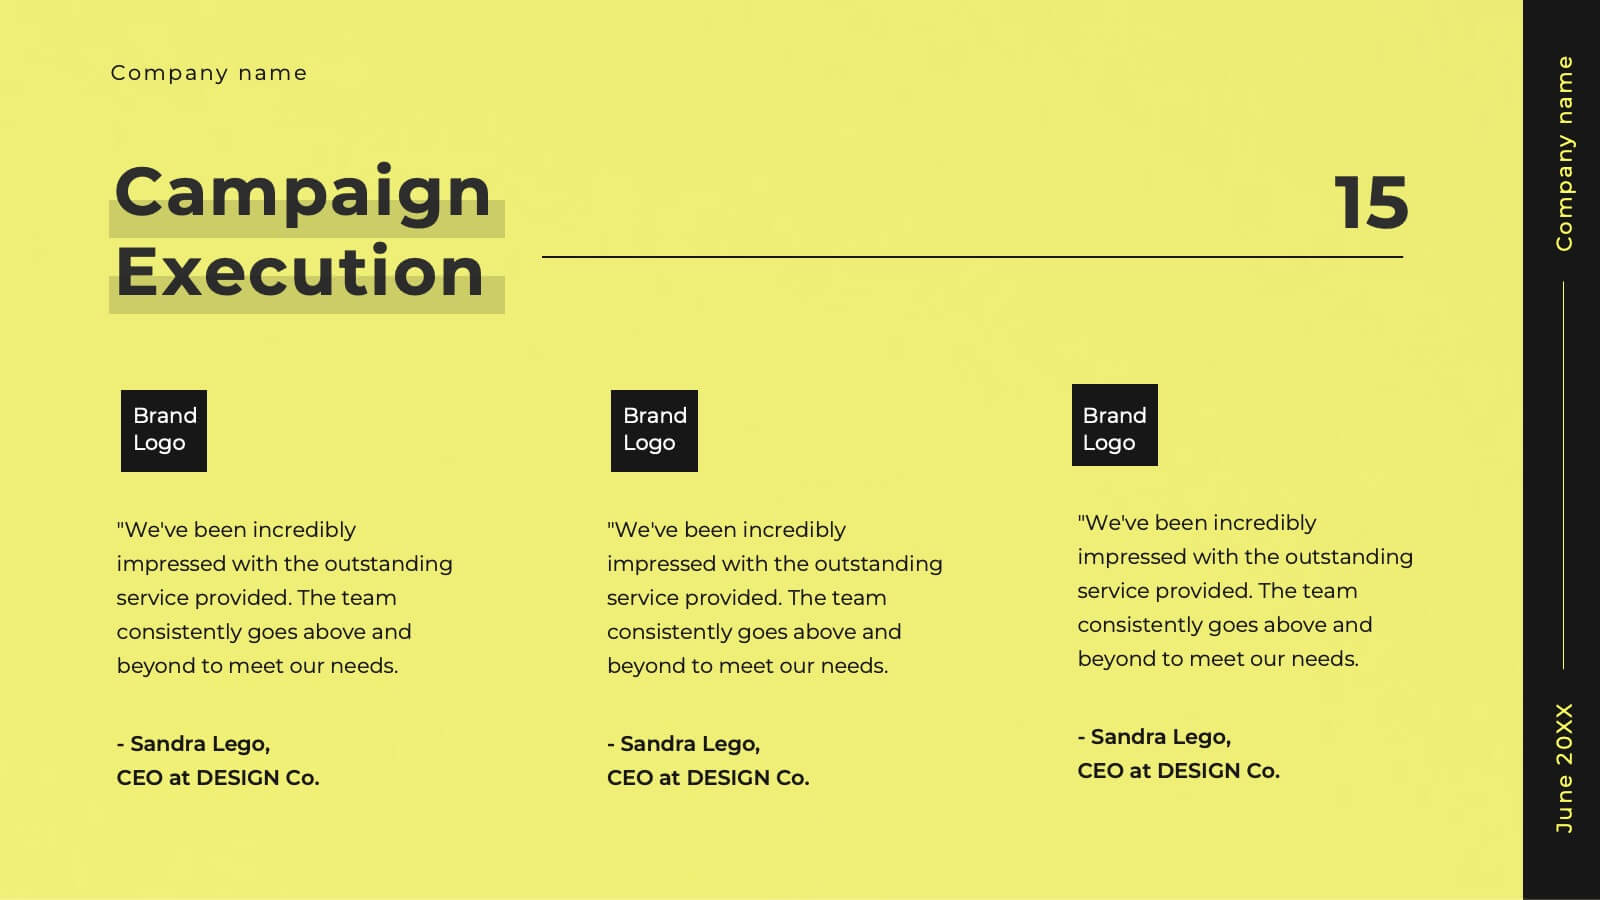
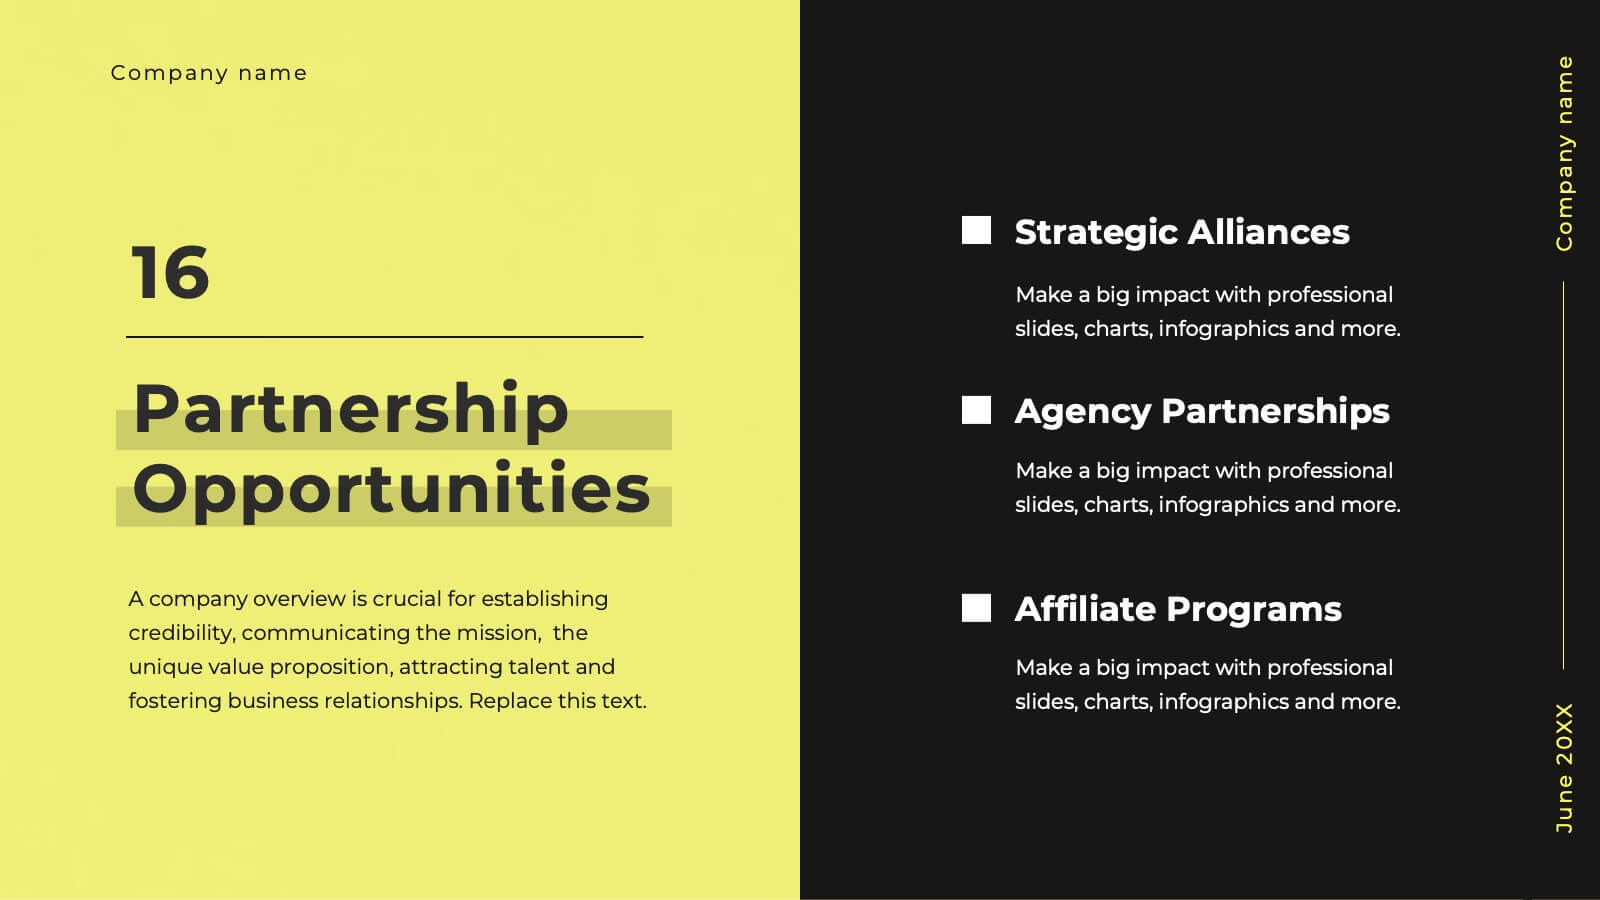
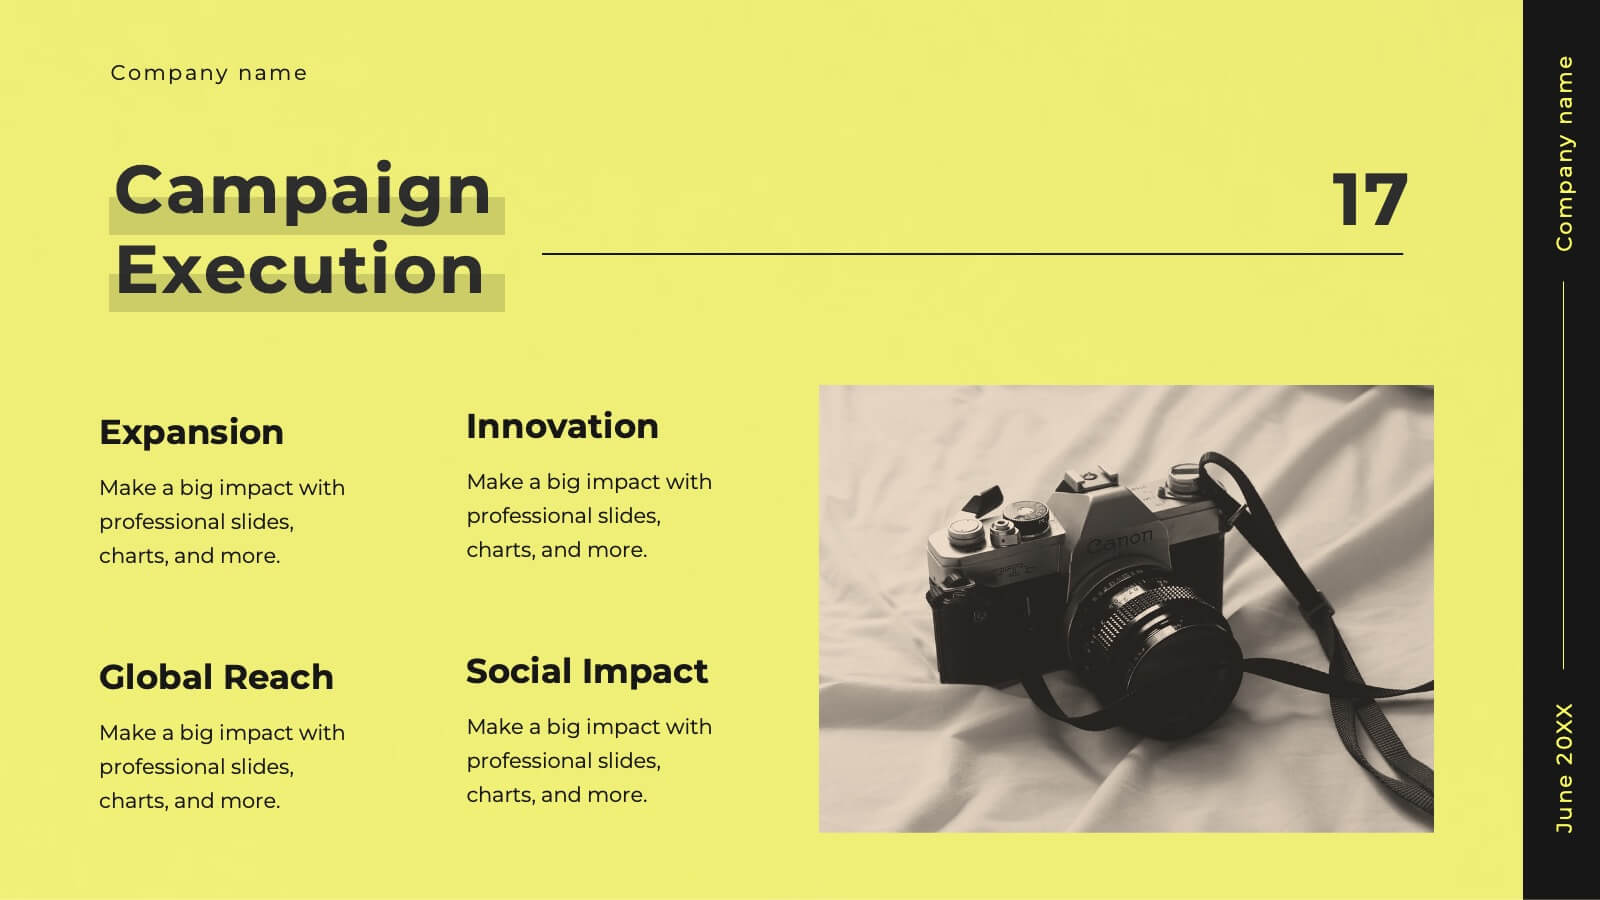
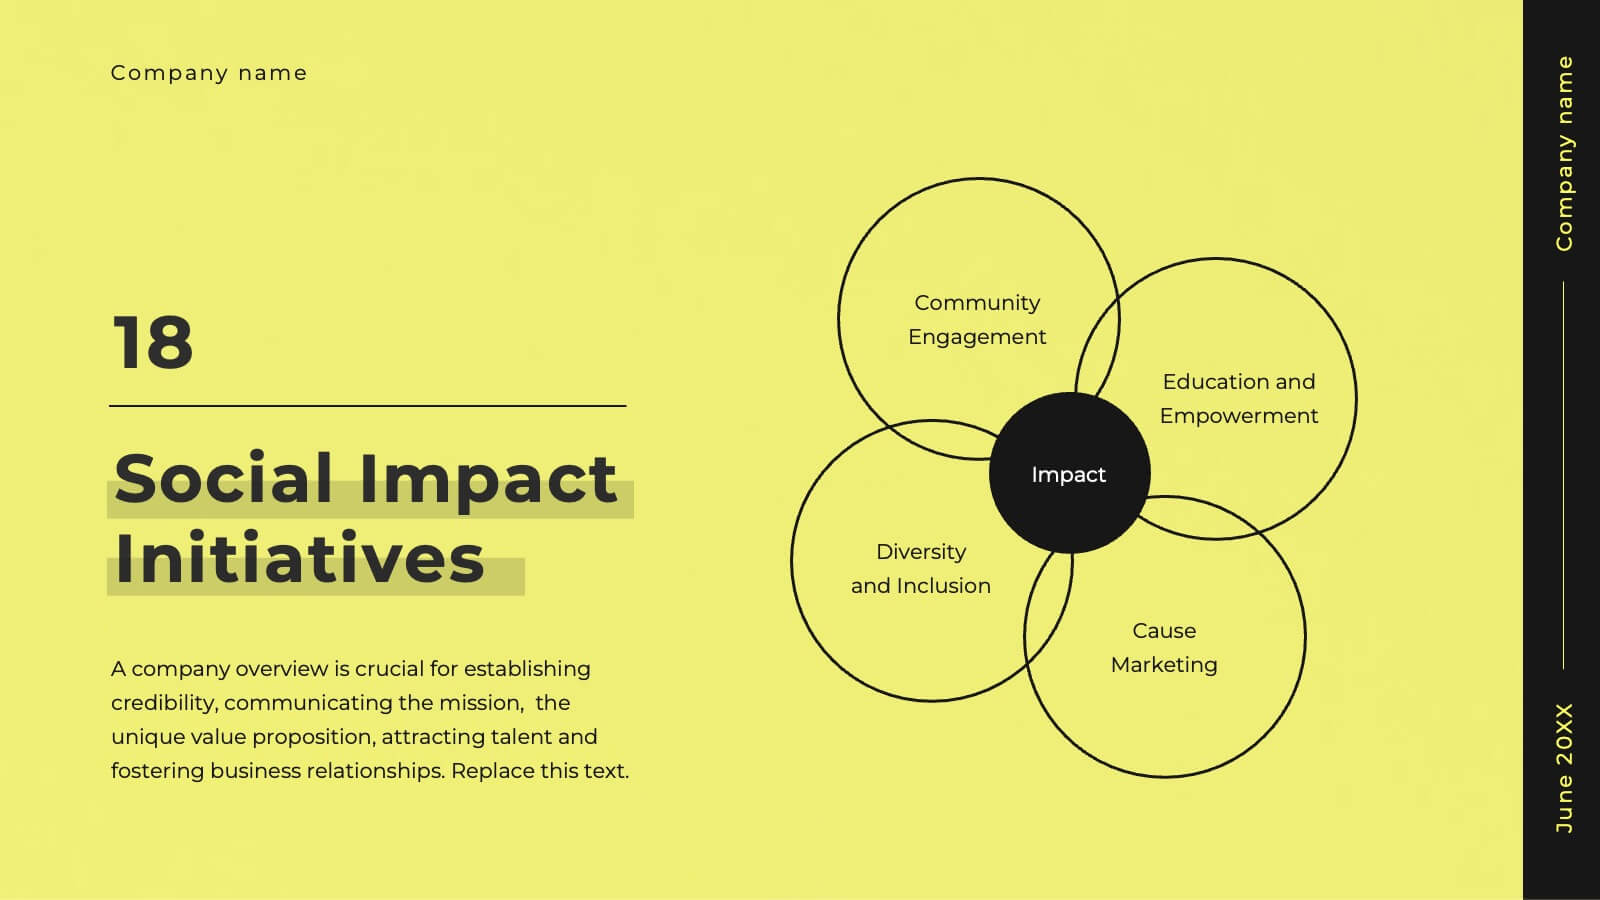
Glimmer Creative Agency Pitch Deck Presentation
Step up your game with this vibrant agency pitch deck template! Ideal for showcasing your services, client success stories, and strategic approach, it includes dynamic slides for market analysis and campaign execution. Engage potential clients with compelling visuals and well-organized content. Compatible with PowerPoint, Keynote, and Google Slides for a smooth presentation experience on any platform.