


Features
- 4 Unique slides
- Fully editable and easy to edit in Microsoft Powerpoint, Keynote and Google Slides
- 16:9 widescreen layout
- Clean and professional designs
- Export to JPG, PDF or send by email


Do you have any questions?
Recommend


4 slides
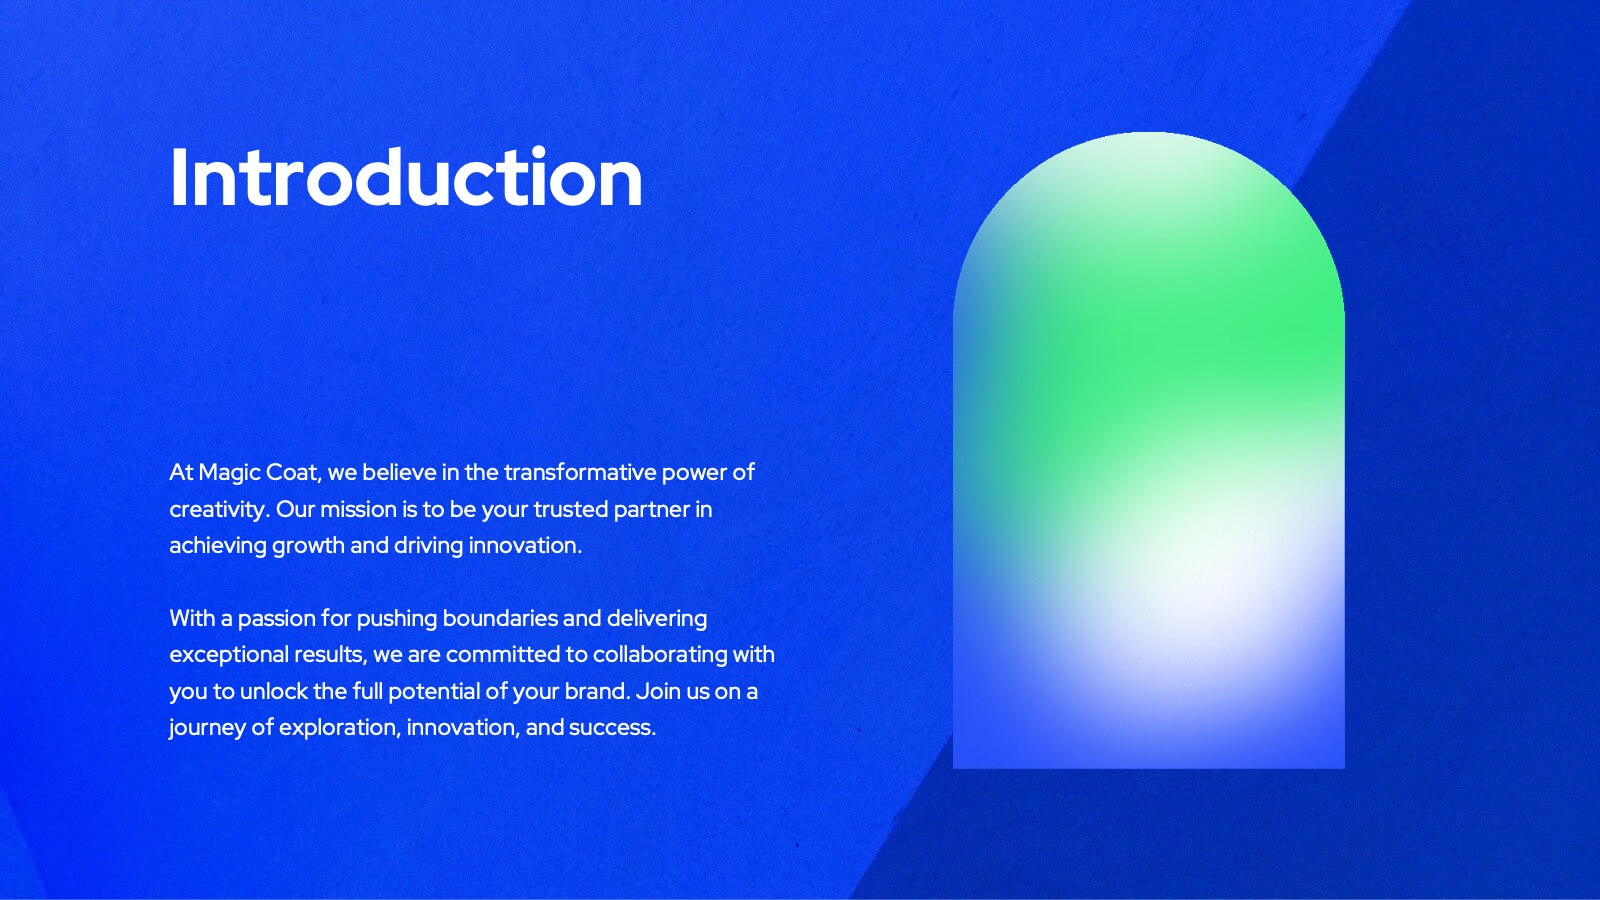
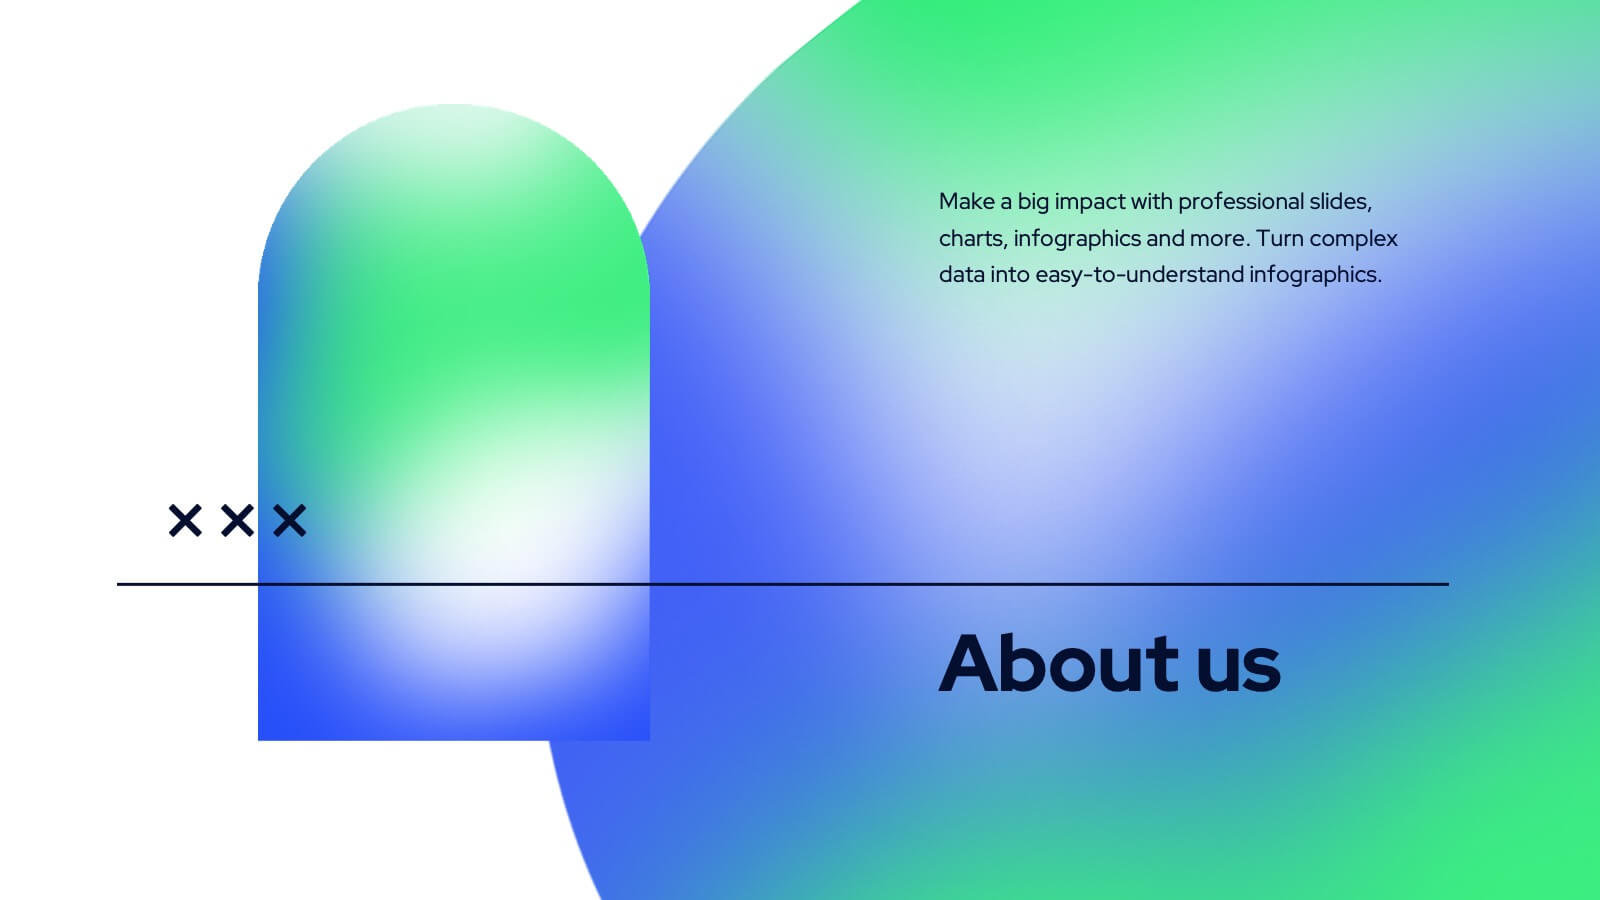
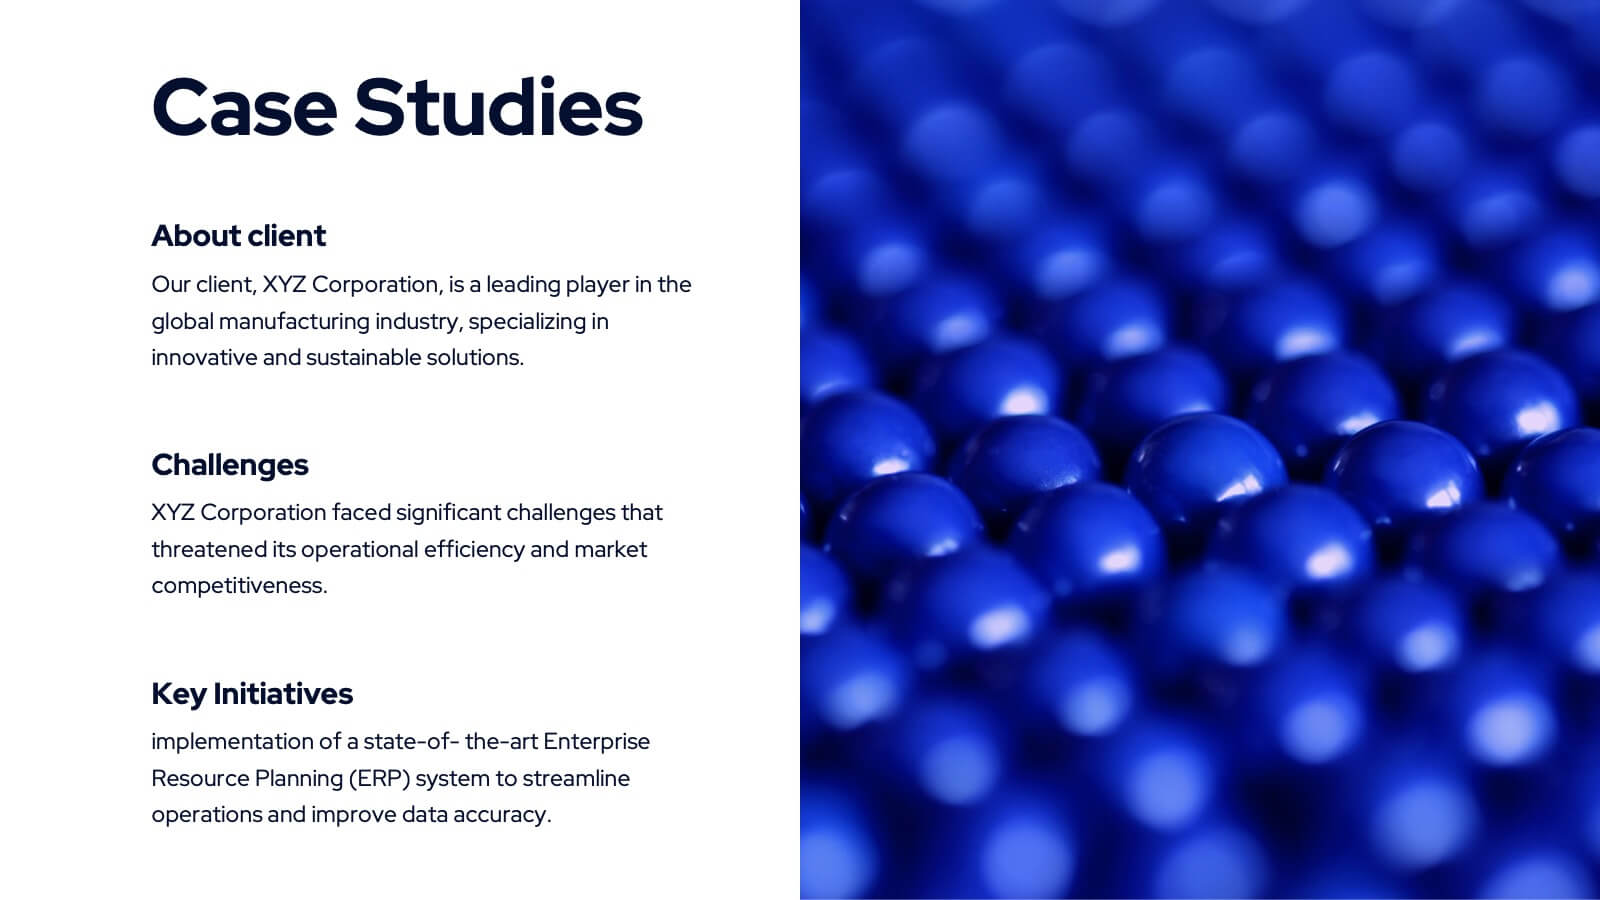
Creative Title Slide Templates Presentation
Make a bold first impression with the Creative Title Slide Templates Presentation. Featuring a sleek, split-layout design with glowing blue abstract waves, this template combines modern aesthetics with functional clarity. Circular icons on the side offer quick visual cues for business categories or departments. Ideal for keynote introductions or professional project kickoffs. Compatible with PowerPoint, Keynote, and Google Slides.


10 slides
5 Step Business Growth Presentation
The "5 Step Business Growth Presentation" template is designed to clearly depict progressive strategies in business development. Featuring a visually engaging staircase-style layout, this infographic effectively guides viewers through sequential stages, making it perfect for presentations that outline growth phases or strategic processes. Each step is color-coded and provides sufficient space to elaborate on key points, ensuring clarity and emphasis on important data. Ideal for use in business strategy meetings or any setting requiring a structured presentation of development stages, this template is versatile and compatible with various presentation platforms, enhancing the visual appeal and comprehension of your message.


4 slides
Neuroscience-Inspired Concept Mapping Presentation
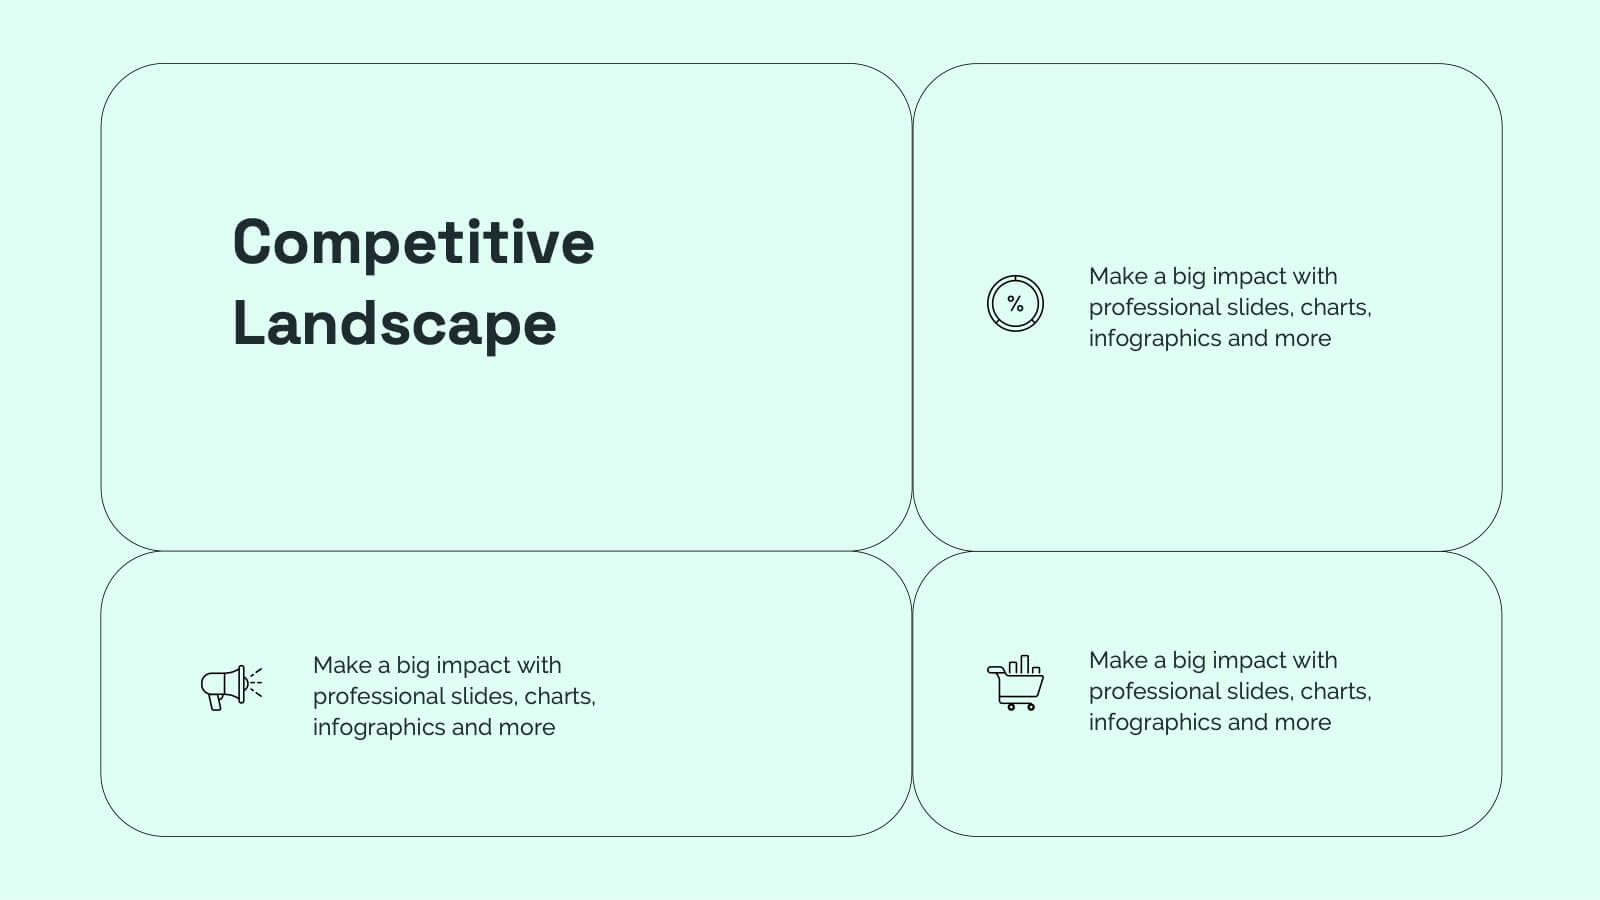
Visualize abstract ideas with clarity using the Neuroscience-Inspired Concept Mapping Presentation. Featuring a head silhouette and four labeled concept nodes, this layout is perfect for connecting ideas, frameworks, or steps in a thought process. Fully editable in PowerPoint, Canva, and Google Slides for seamless customization and presentation.


6 slides
Vision-to-Execution Roadmap
Turn bold ideas into actionable plans with the Vision-to-Execution Roadmap Presentation. This circular, multi-phase layout helps you illustrate how strategic goals evolve into tangible results across five connected stages. Ideal for pitching initiatives, mapping transformation phases, or guiding teams from concept to completion. Fully customizable in PowerPoint, Keynote, and Google Slides.


22 slides
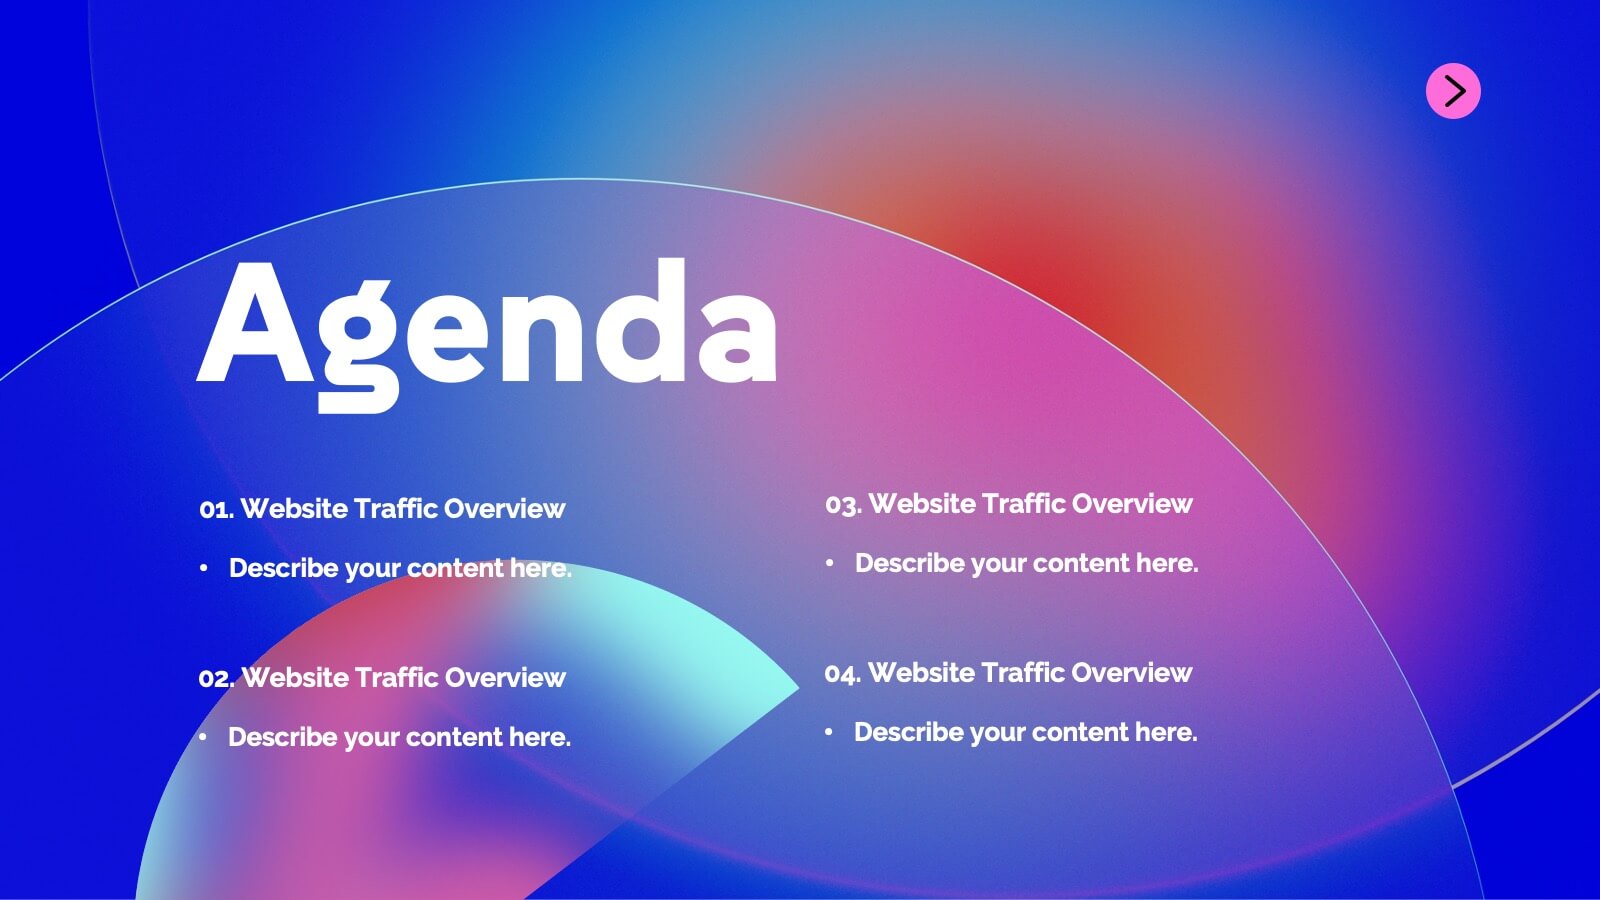
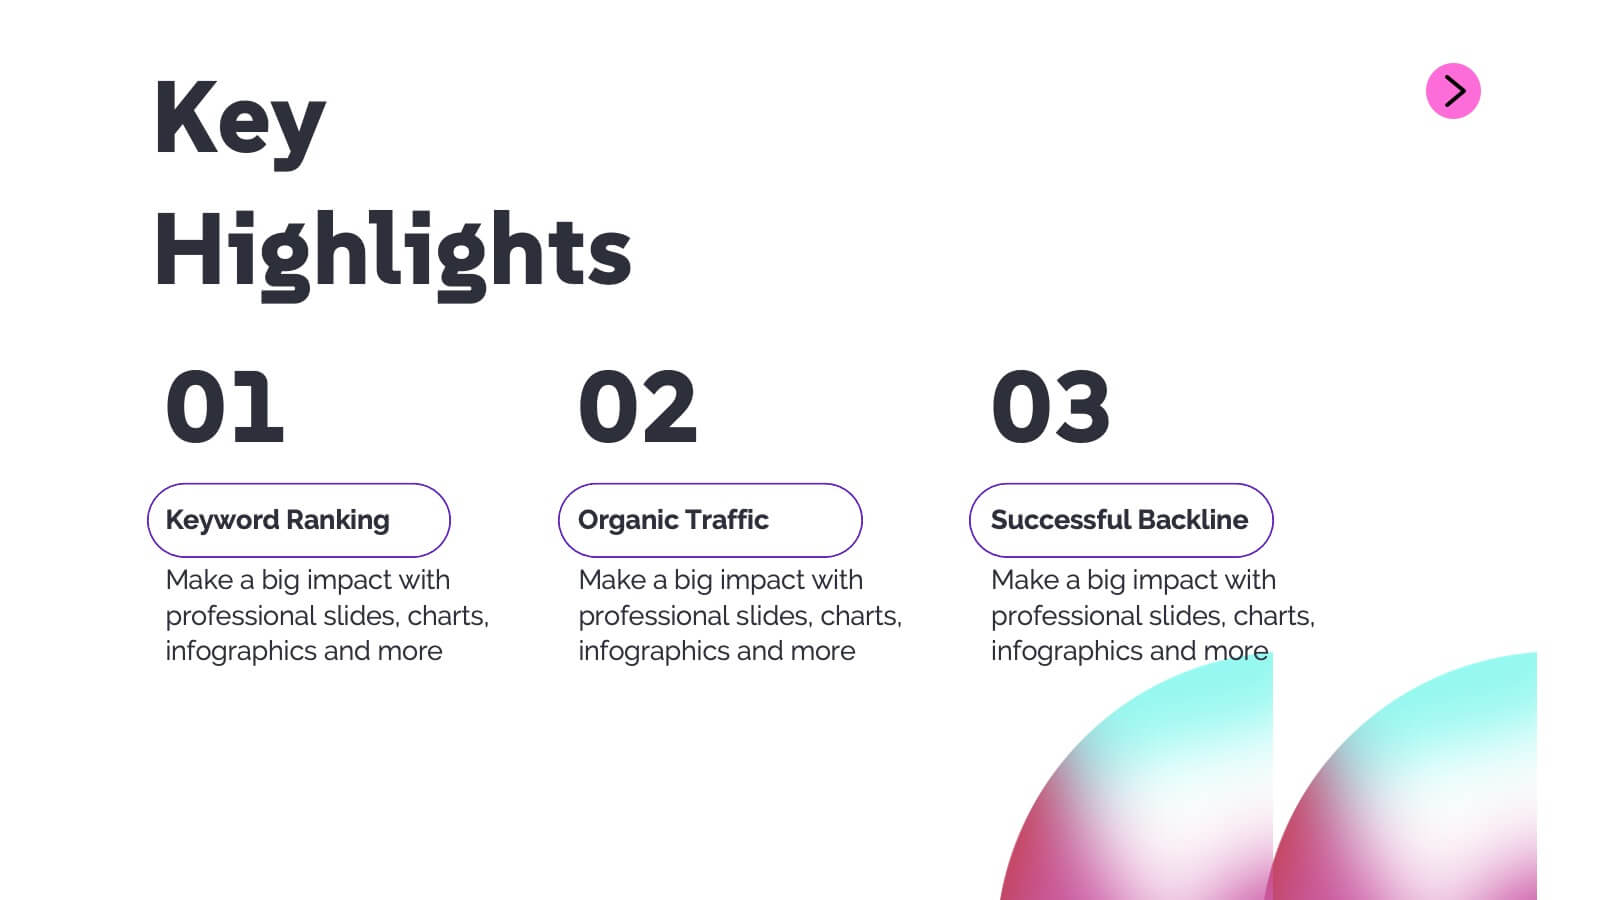
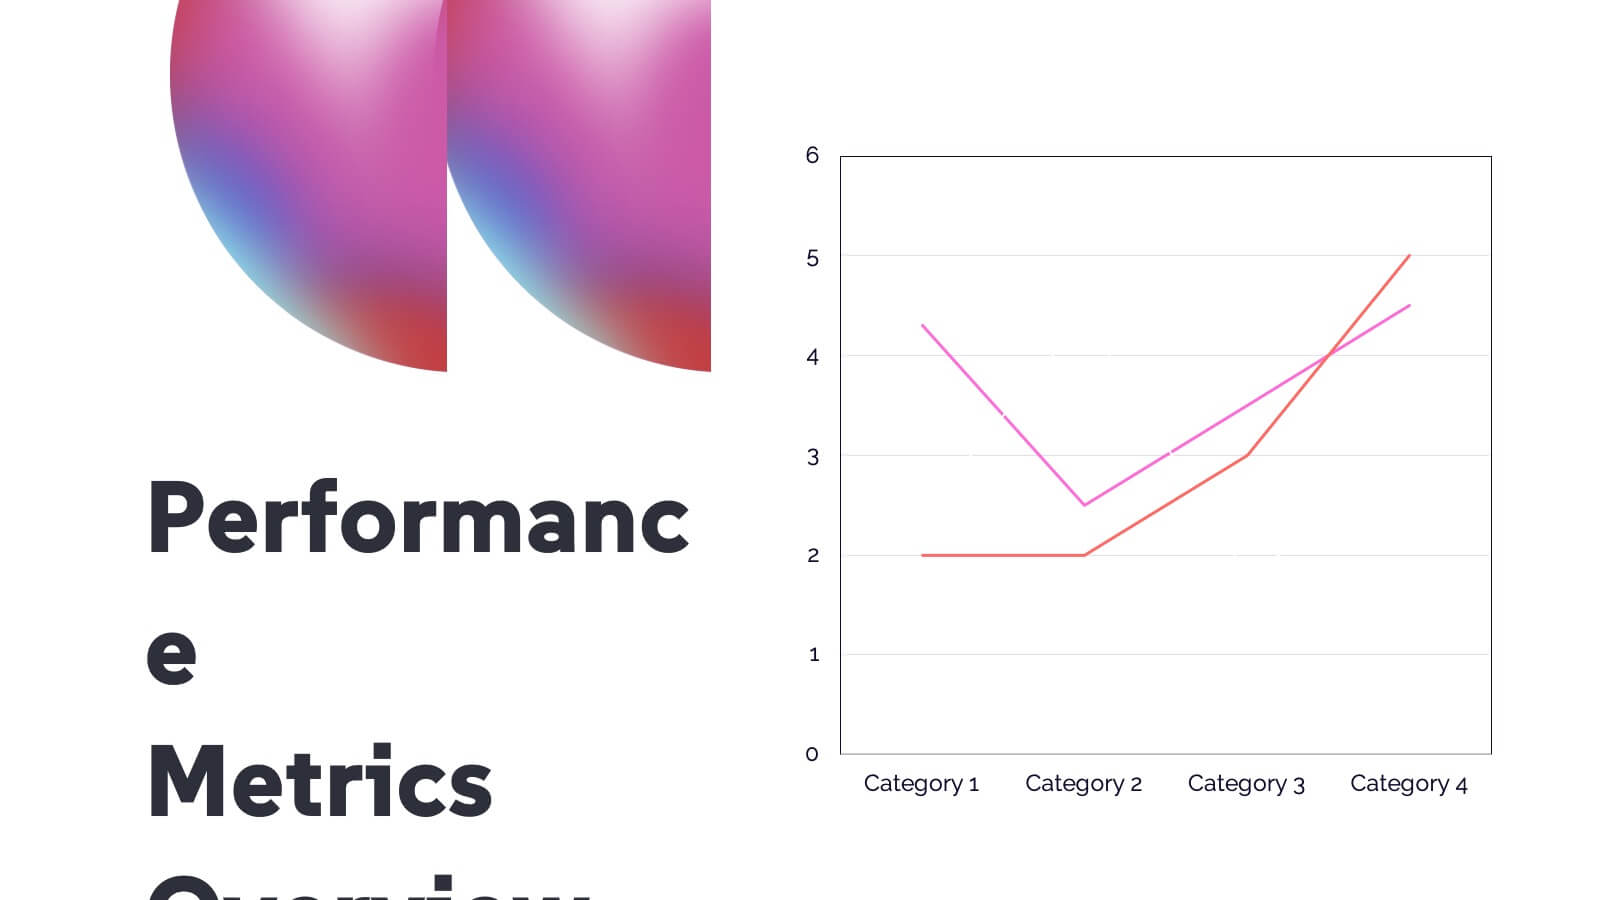
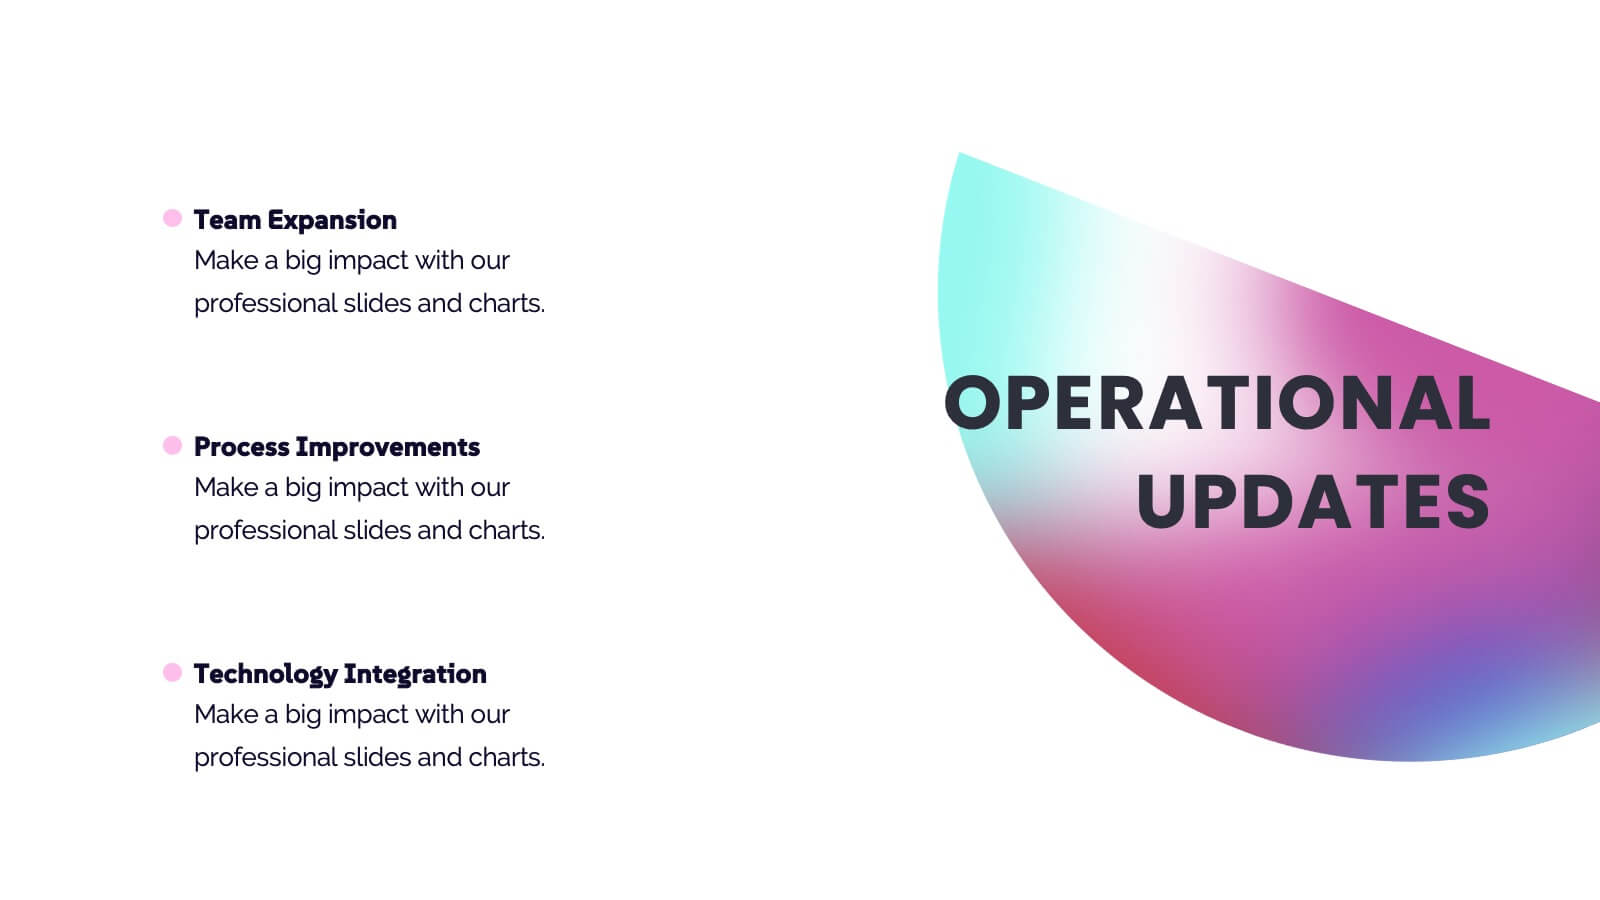
Sphinx Project Status Report Presentation
This modern project status report template is perfect for tracking progress and highlighting key achievements. It includes sections for performance metrics, financial summaries, challenges, and strategic initiatives. Keep stakeholders informed with clear, concise updates. Compatible with PowerPoint, Keynote, and Google Slides for easy customization and presentation.

23 slides
Nymph Startup Pitch Deck Presentation
This startup pitch deck template covers all the essentials for presenting a business. It includes slides for mission and vision, business model, market analysis, value proposition, and financial overview. Easily customizable for any startup industry, this modern design makes presenting your ideas a breeze. Compatible with PowerPoint, Keynote, and Google Slides.


8 slides
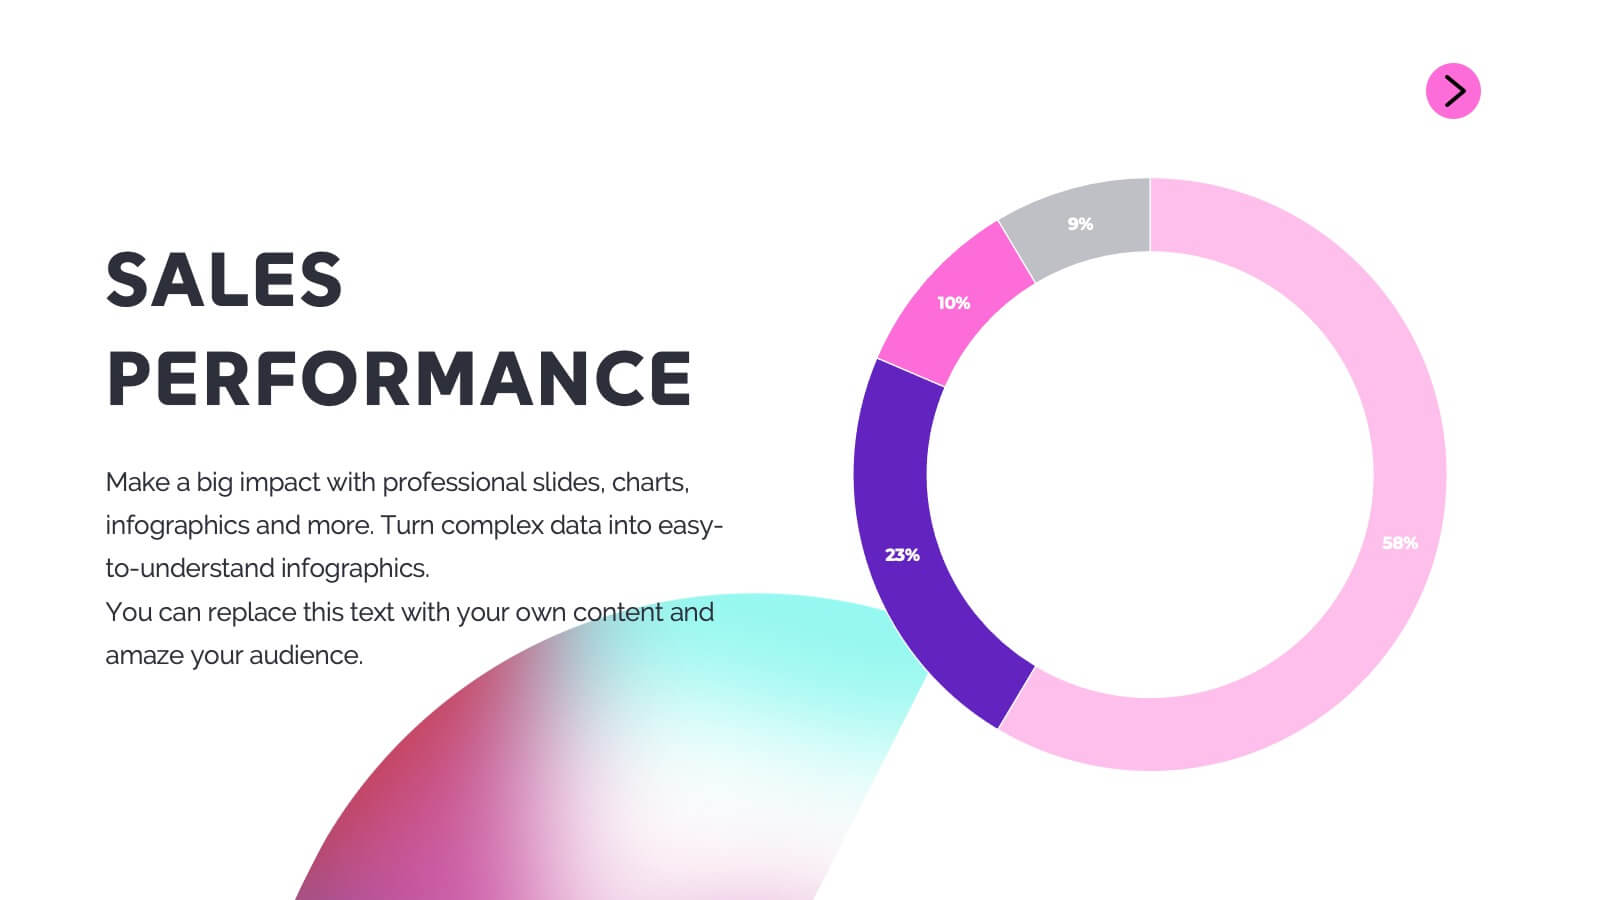
Data-Driven Market Segmentation
Visualize customer insights with clarity using the Data-Driven Market Segmentation Presentation. This dynamic circular infographic displays four key segments, each with percentage labels and curved connectors pointing to detailed descriptions. Ideal for marketing analysts, product strategists, or data-driven teams aiming to present behavioral, demographic, or purchasing trends. The sleek, radial layout makes comparisons intuitive and engaging. Fully editable in PowerPoint, Keynote, and Google Slides—customize colors, icons, and data points to match your brand and message.


7 slides
Technology Innovations Infographic
Technology innovations refer to significant and novel advancements, improvements, or creations in processes, products, services, or systems that introduce new features, functionalities, or approaches. Get ready to ignite the tech world with our technology infographic. This infographic will journey your audience into the cutting-edge world of technology. Prepare your viewers for a mind-blowing showcase of innovation and progress. Compatible with Powerpoint, Keynote, and Google Slides. Inspire action and invite readers to step boldly into a new era of technological innovations.


6 slides
Numbered Steps Diagram Presentation
Watch your workflow come to life as each step rises in a clean, structured path that makes progress easy to follow. This presentation guides audiences through sequential actions with clarity, helping simplify processes, plans, or instructions. Perfect for business, training, or project teams. Fully compatible with PowerPoint, Keynote, and Google Slides.


6 slides
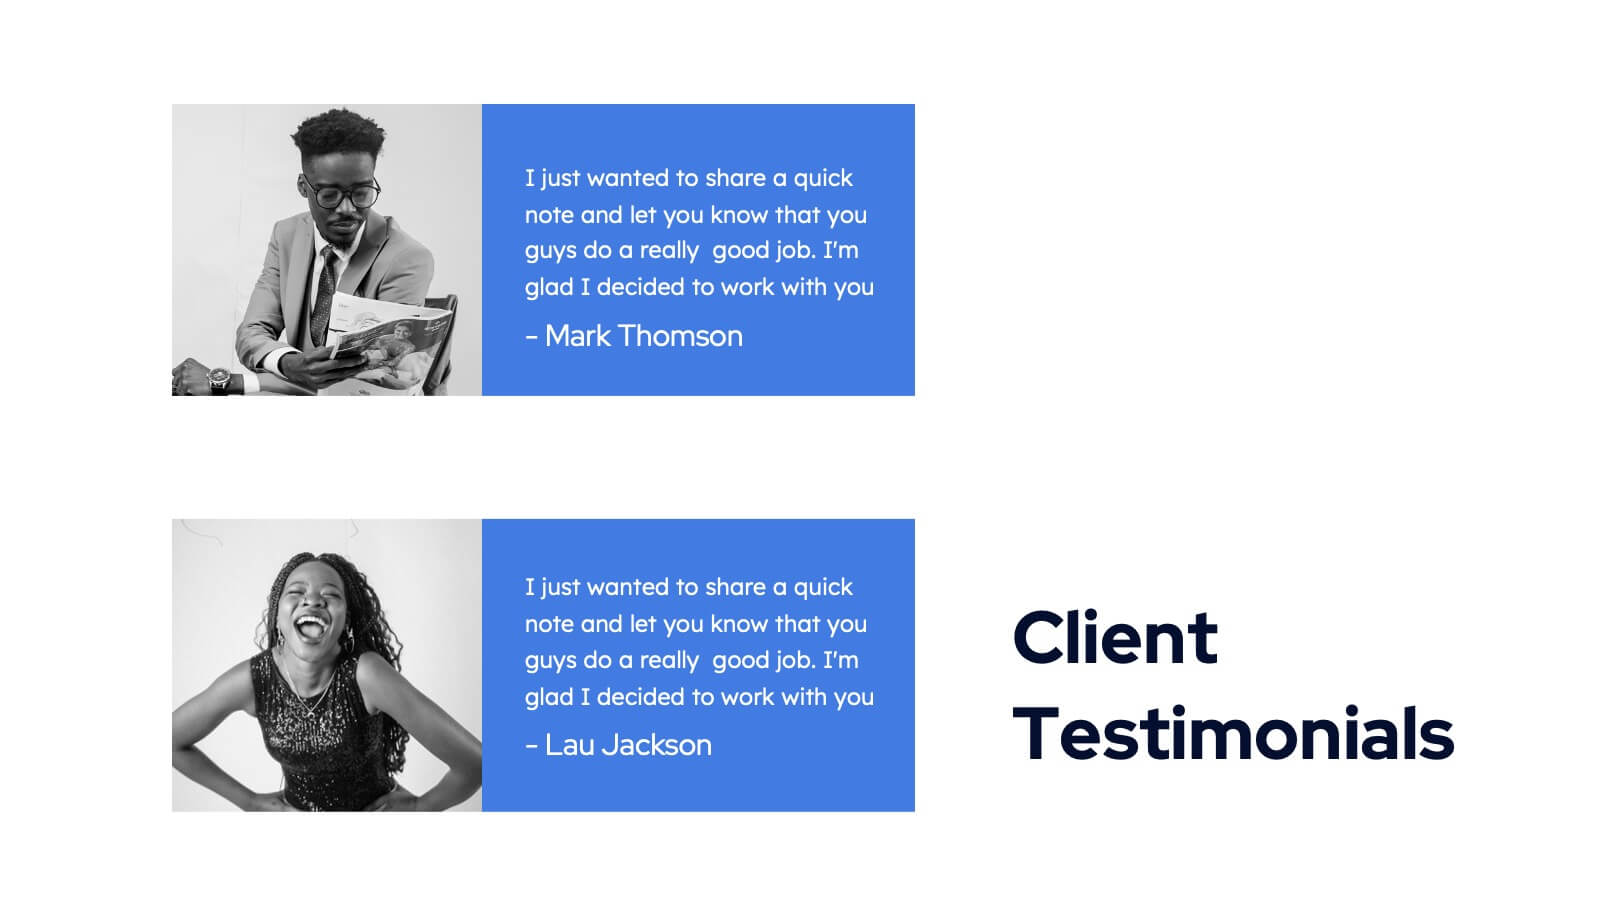
Ideal Buyer Persona Customer Profile Presentation
Define your perfect customer with the Ideal Buyer Persona Customer Profile Presentation. This clear and visually structured layout helps you map out key traits, behaviors, and needs of your target audience. Easy to edit in Canva, PowerPoint, or Google Slides—ideal for marketing teams, strategists, and business development presentations.

22 slides
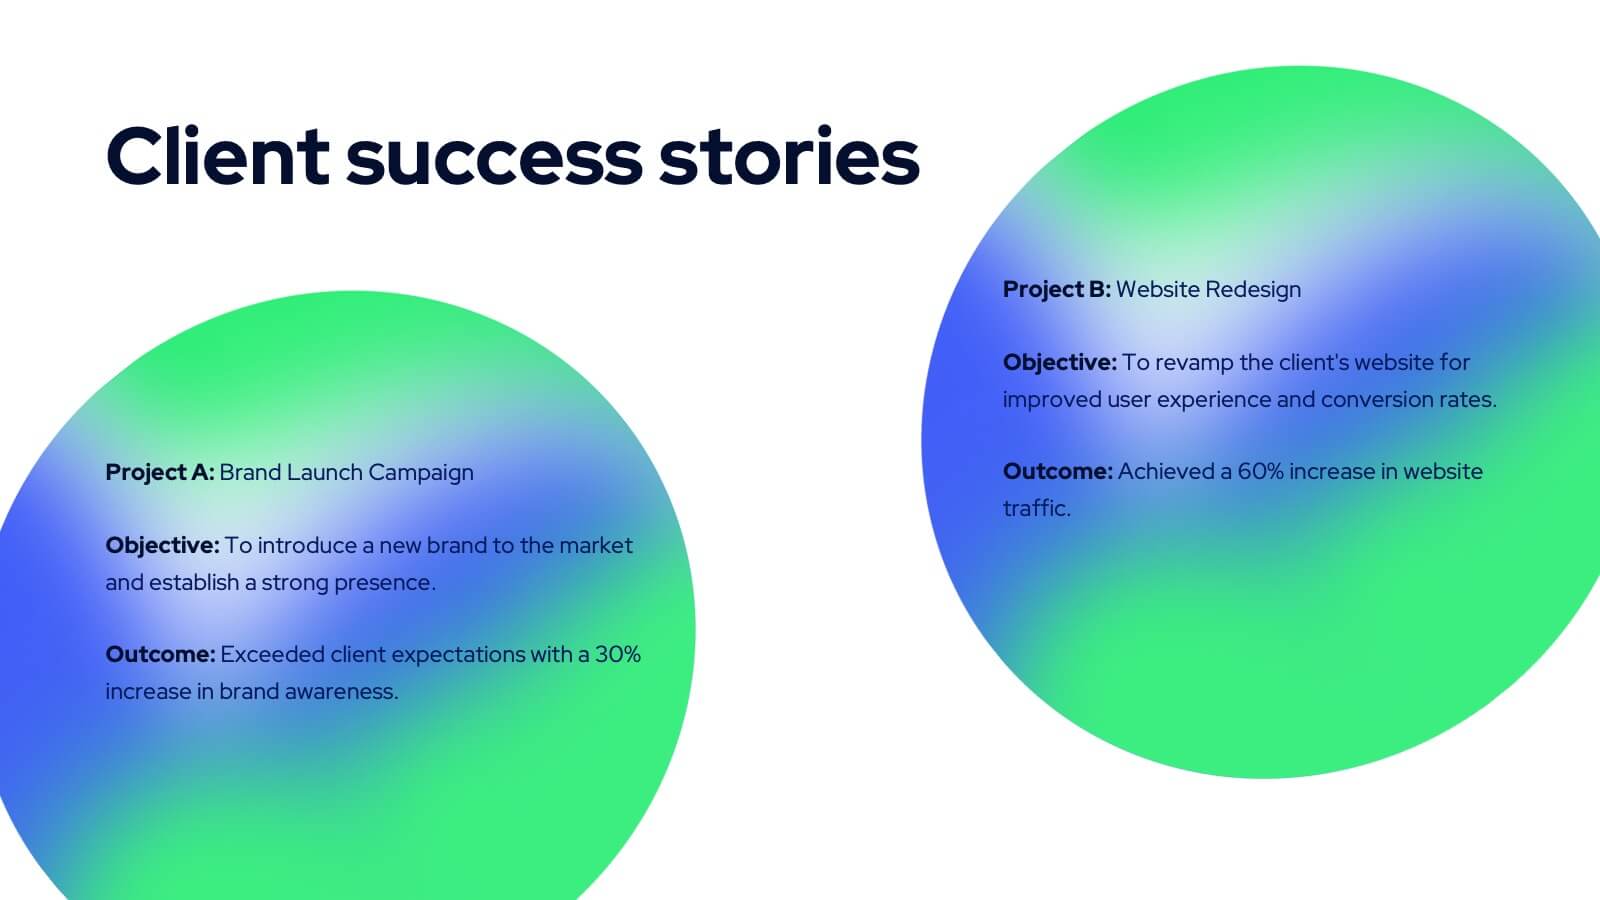
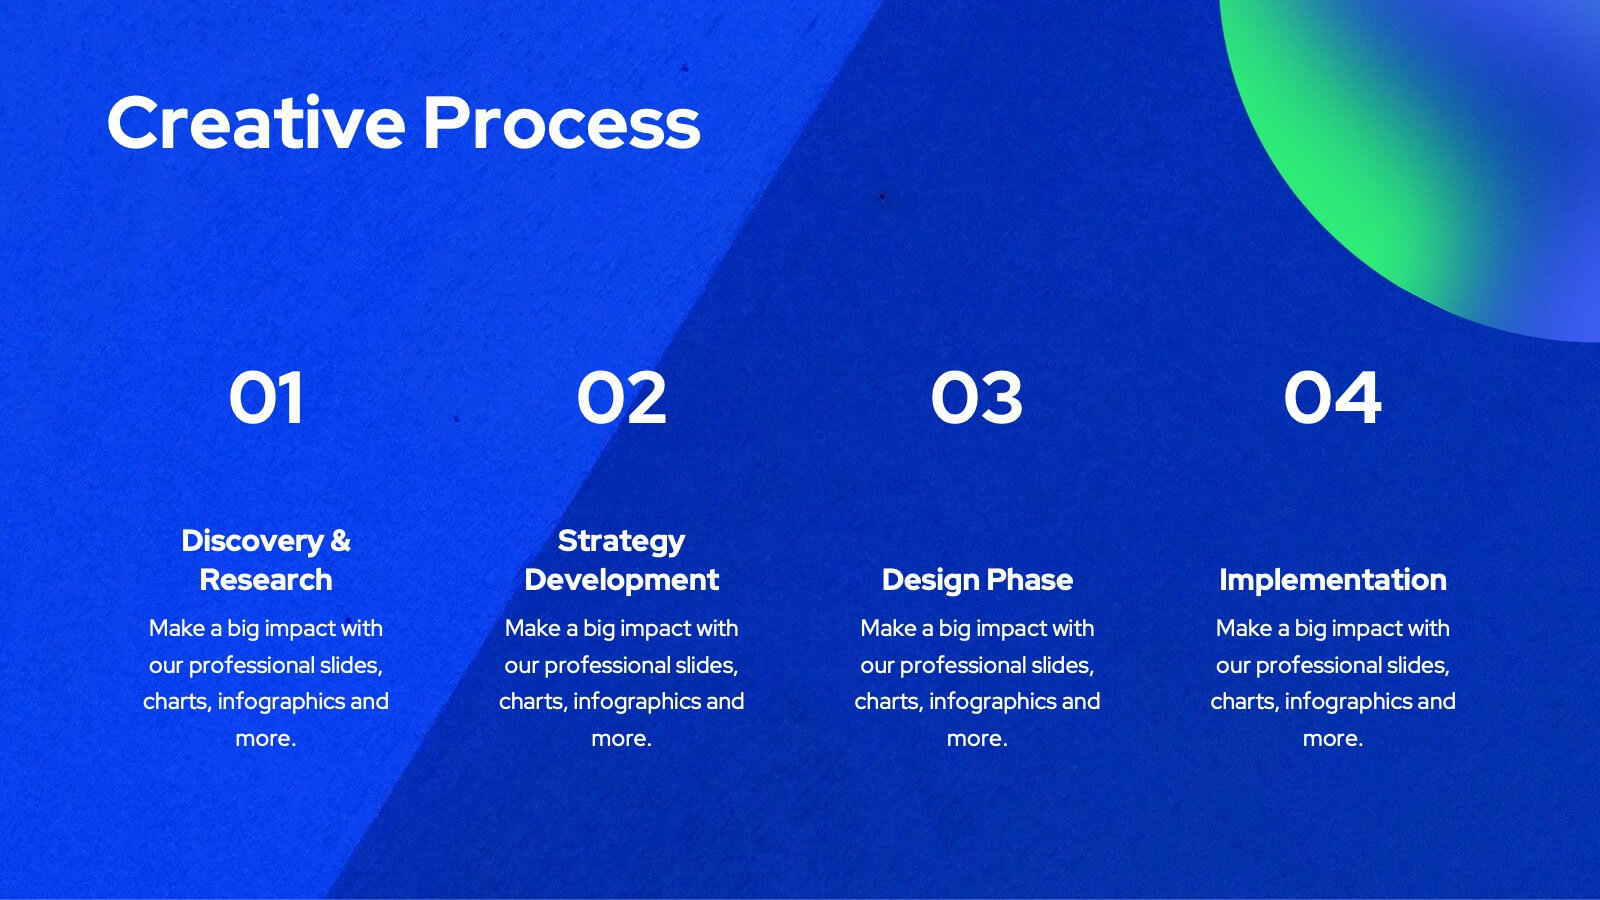
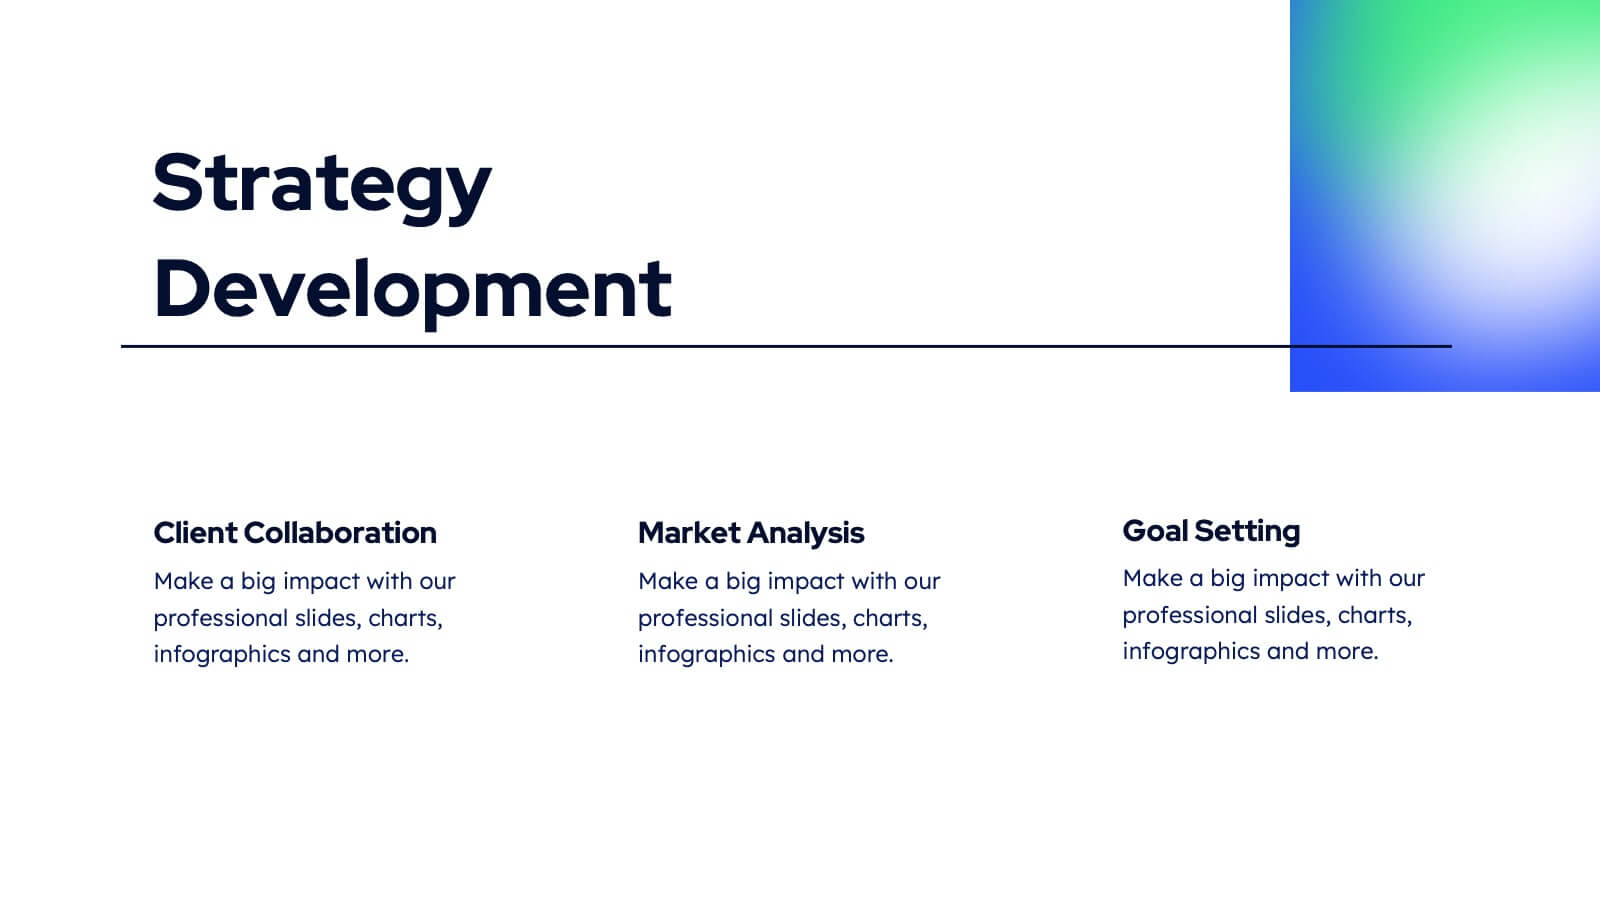
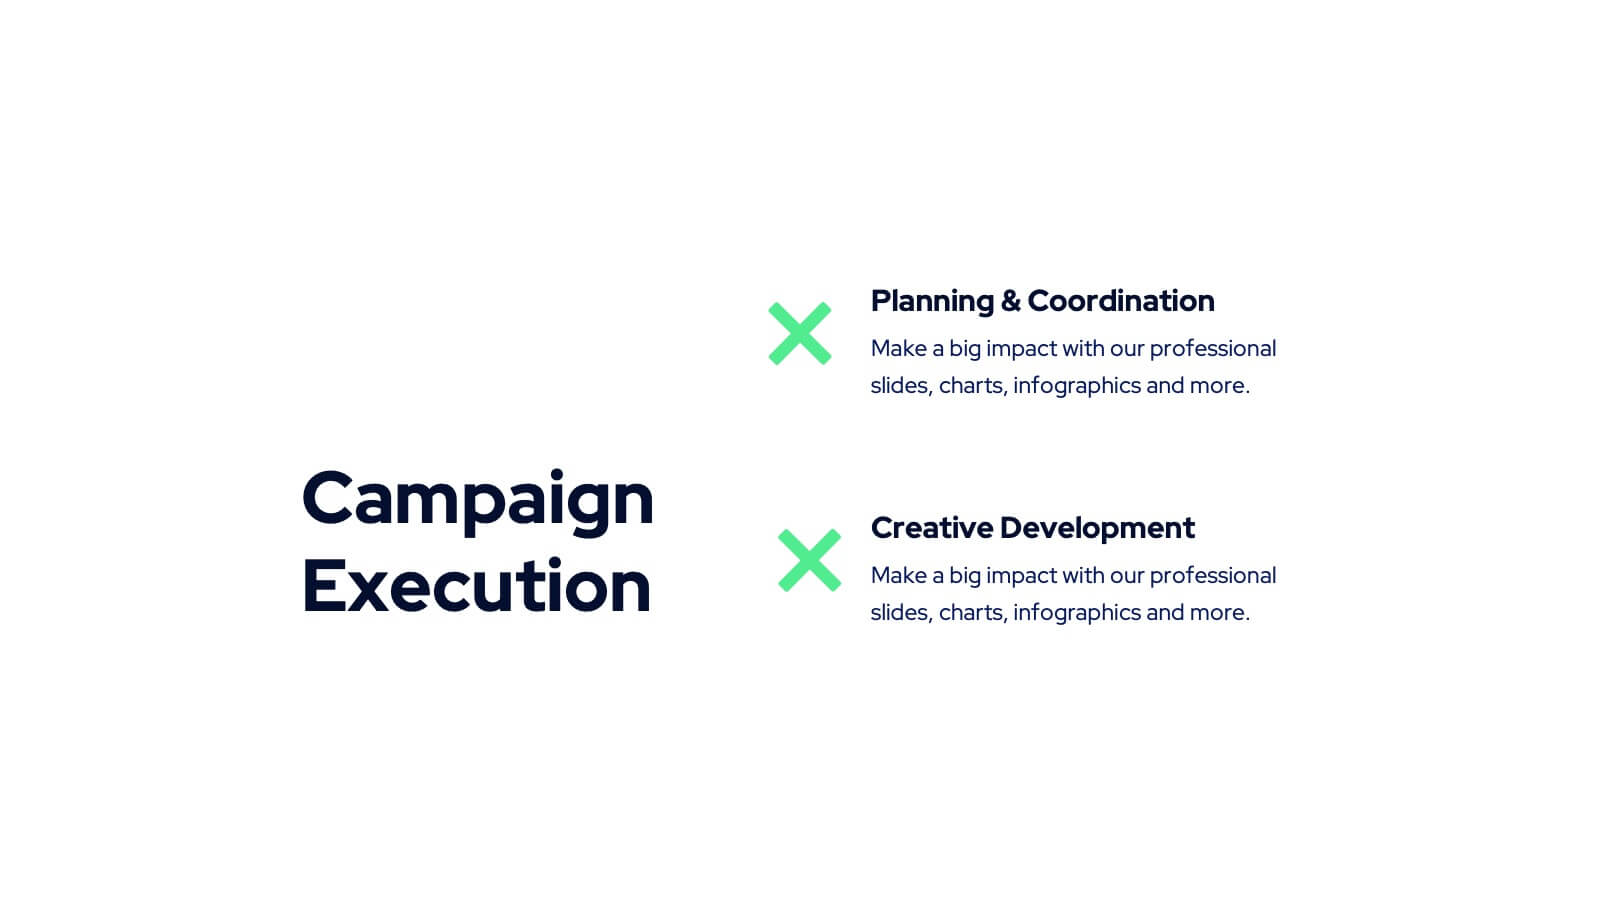
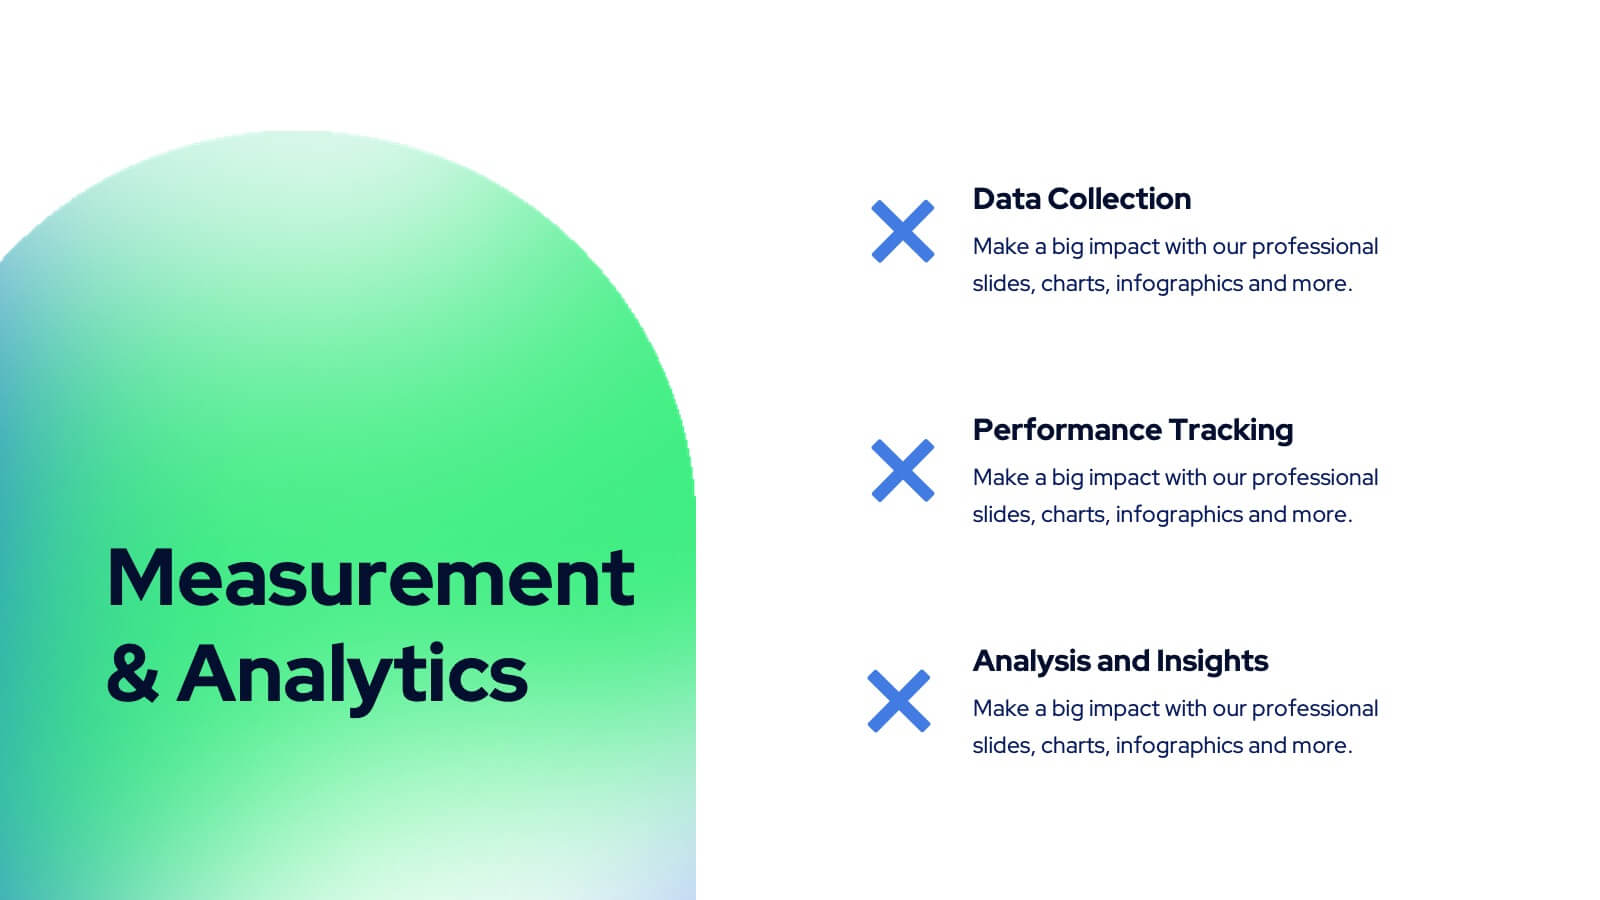
Tanzanite Full-Service Agency Project Plan Presentation
Showcase your agency's strengths with this bold and modern portfolio presentation template! From client success stories and case studies to market analysis and strategy development, this template highlights your expertise and approach. Perfect for agencies looking to present their services, creative processes, and partnerships. Compatible with PowerPoint, Keynote, and Google Slides, making it easy to impress any audience.


12 slides
Personal Portfolio Presentation
Our Personal Portfolio Presentation template is designed for professionals looking to make a strong impression with a sleek and engaging portfolio. This comprehensive template provides an excellent framework to showcase your personal brand, professional journey, and achievements. The opening slide, with your name boldly presented, acts as your introduction. It's followed by a 'Get to know me' section that offers a glimpse into your personality and work ethic. The 'Skills' slide is a visually impactful way to present your competencies, while the 'Experience' slide chronologically outlines your professional milestones. Featuring sections for detailed case studies, showcased projects, and educational background, this template helps you tell your story in a cohesive and captivating manner. The 'Recognitions' slide allows you to highlight awards and honors, adding credibility to your profile. Ending with a compelling 'Let's work together!' call-to-action, this template is adaptable to PowerPoint, Keynote, and Google Slides, perfect for anyone looking to stand out in their field.


5 slides
Watercolor Background Design Presentation
Add an artistic edge to your presentation with this Watercolor Background Design Template. Featuring soft, abstract paint splashes behind vibrant alphabet icons, it’s perfect for creative professionals, educators, or marketing teams looking to highlight four core ideas or comparisons. Fully editable in PowerPoint, Keynote, and Google Slides for a seamless customization experience.


6 slides
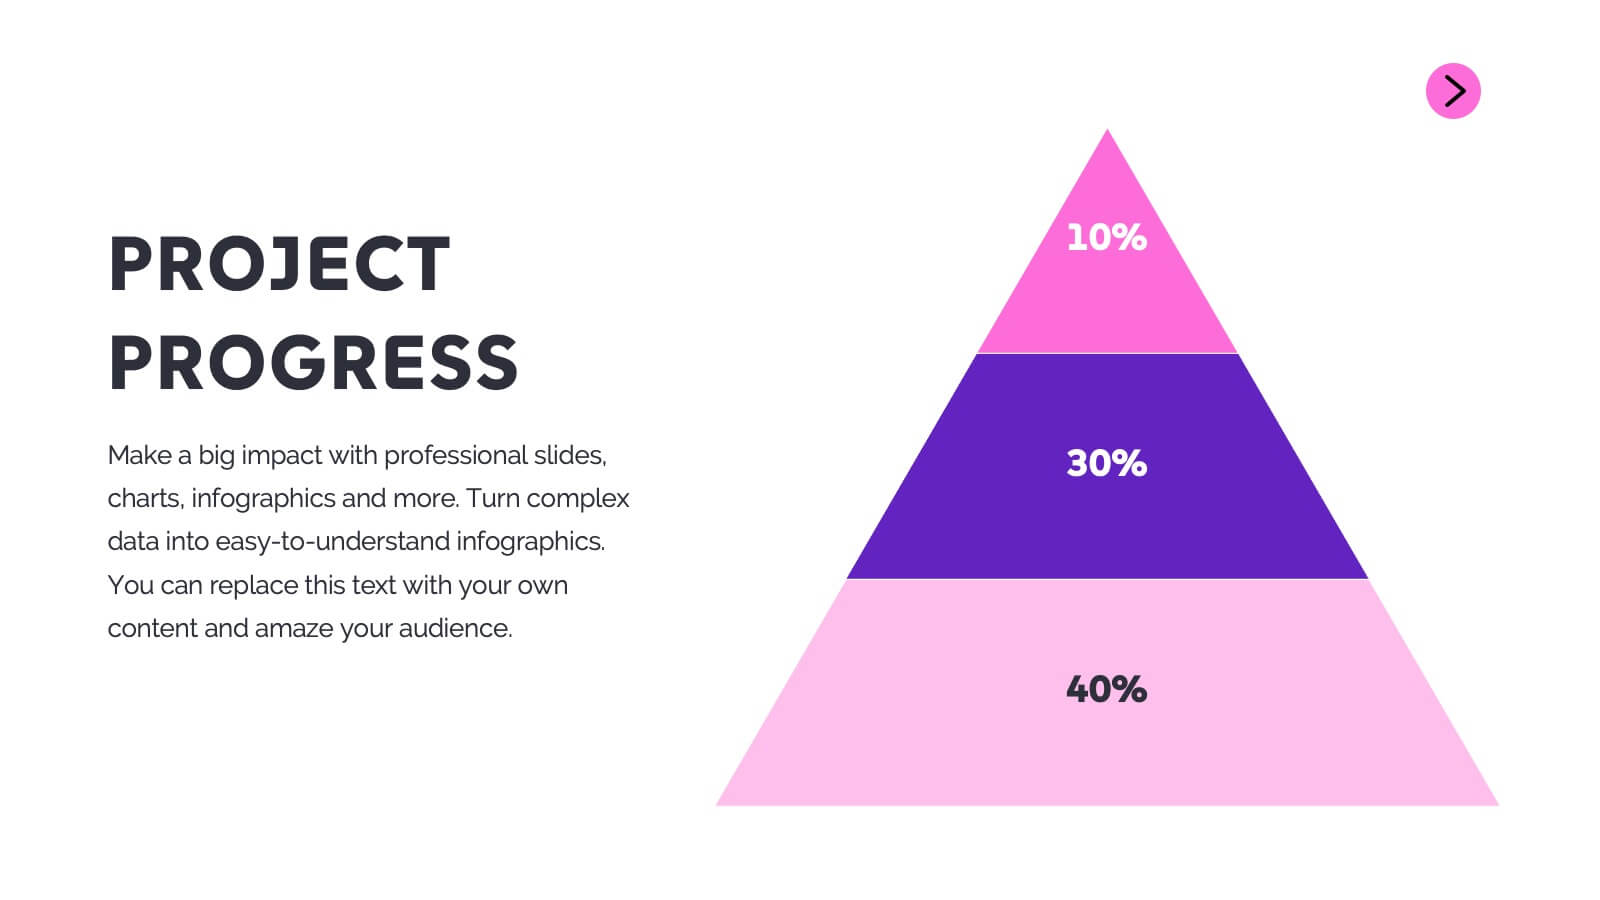
Economic Pyramid Infographic
Showcase economic structures with our Economic Pyramid Infographic, compatible with Powerpoint, Google Slides, and Keynote. This template is designed for economists, educators, and business professionals, providing a visual hierarchy of economic indicators or demographics. Each level of the pyramid represents a different segment, such as income brackets, consumer classes, or resource distribution. It's an ideal tool for presentations that require a clear depiction of economic stratification or market segmentation. Customizable and easy to understand, this infographic helps simplify complex economic data into digestible visual tiers for any audience.


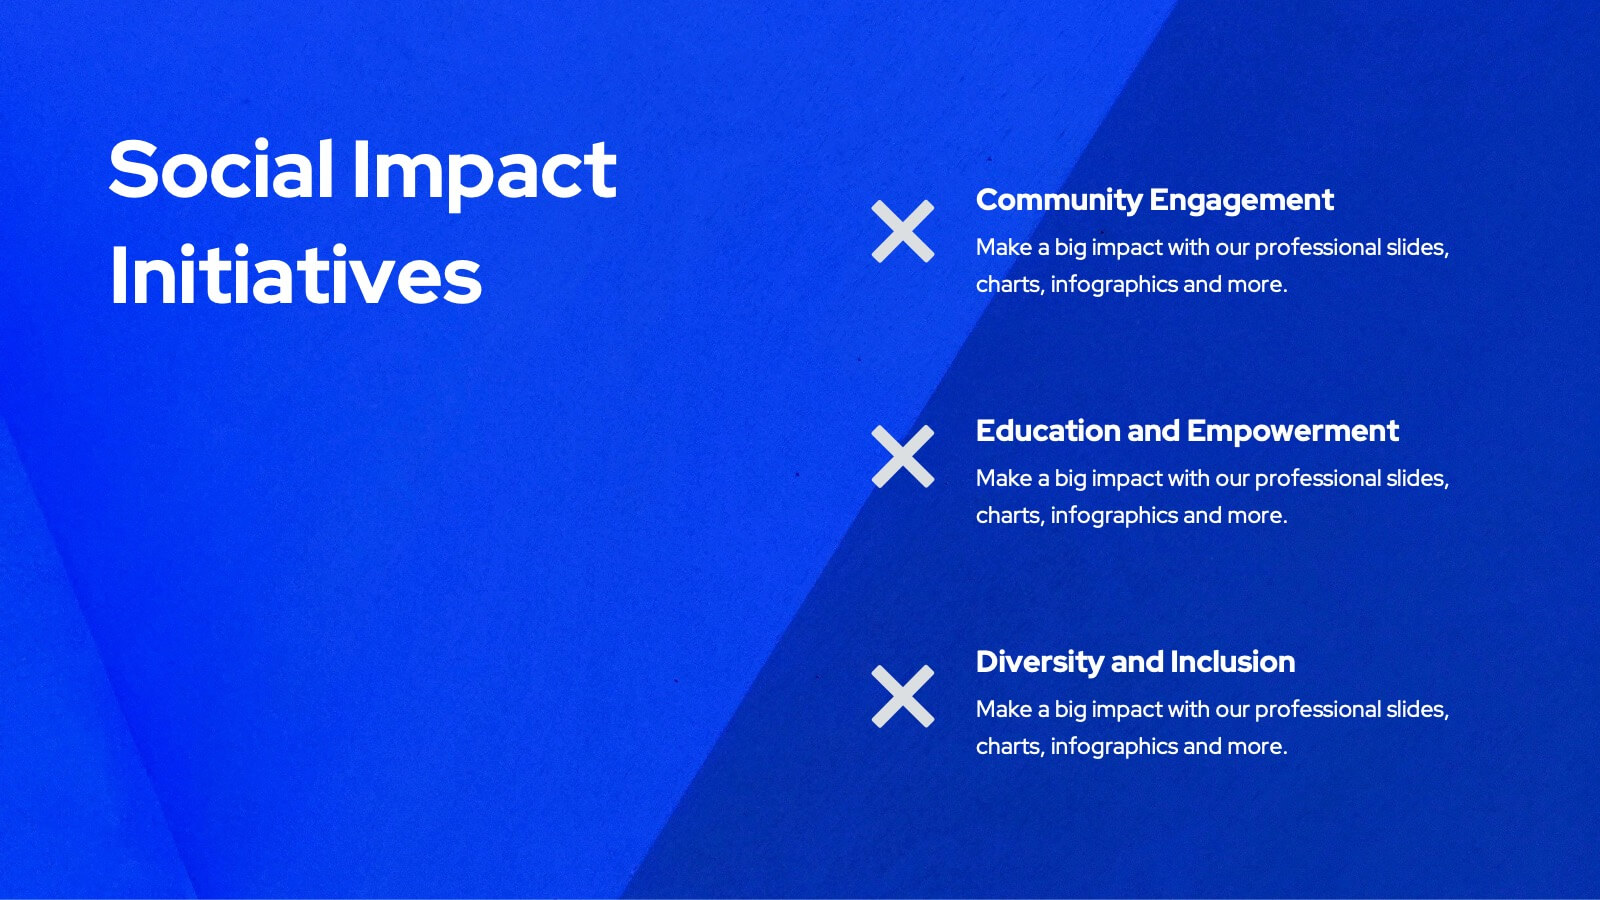
5 slides
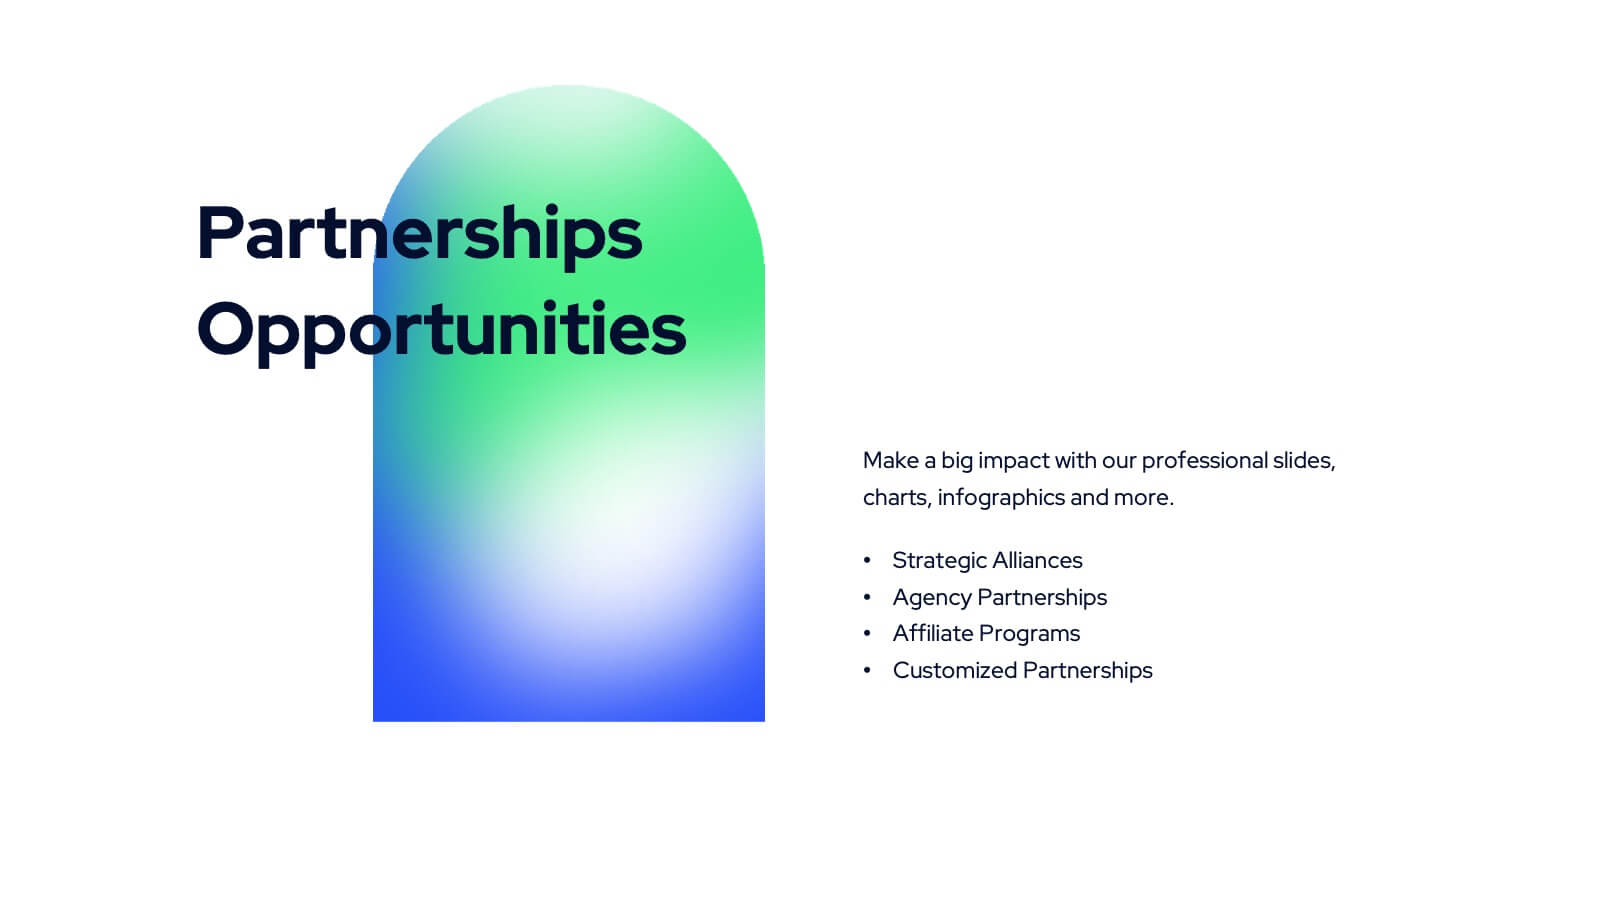
Building Strong Business Relationships
Create lasting partnerships with this structured business relationship infographic. Ideal for outlining trust-building strategies, collaboration frameworks, and stakeholder engagement plans. Fully editable in PowerPoint, Keynote, and Google Slides, making it simple to align the design with your company’s branding and professional goals.


6 slides
Sales Funnel Strategy Presentation
Clearly map your marketing efforts with this Sales Funnel Strategy Presentation. Featuring a bold, inverted funnel design with six customizable layers, this slide is perfect for illustrating your lead nurturing stages—from prospecting to conversion. Each segment includes editable titles and icons, making it ideal for PowerPoint, Keynote, or Google Slides. Great for sales teams, marketers, and strategists looking to drive results.


6 slides
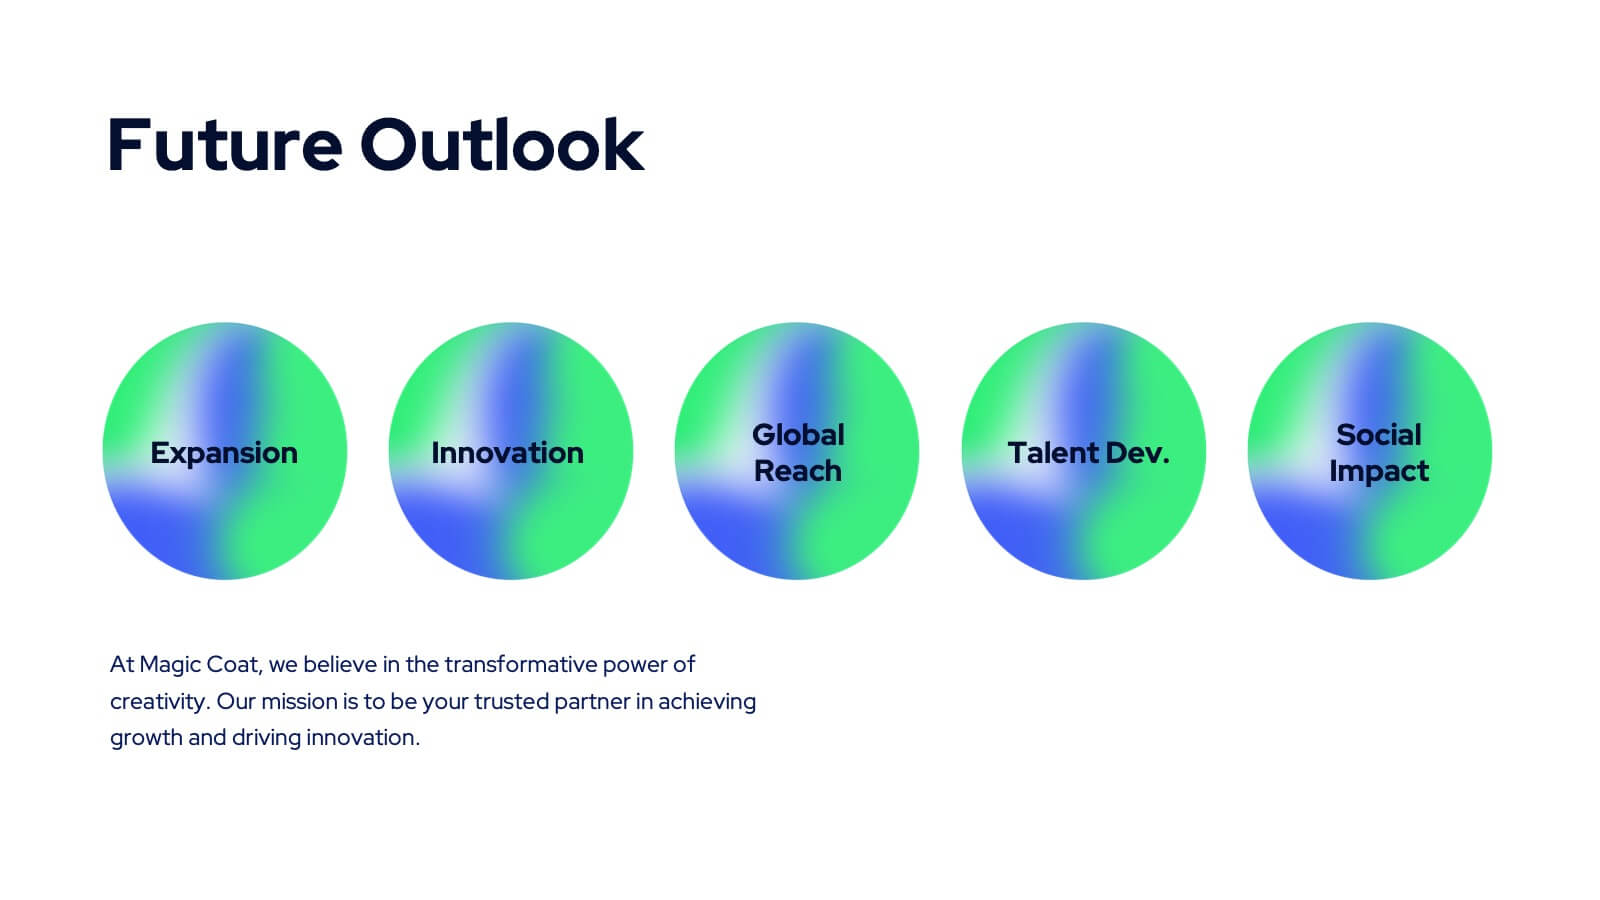
Goal Setting and Strategic Planning Presentation
Present objectives and action plans with the Goal Setting and Strategic Planning template. Featuring a modern segmented design, this layout is perfect for outlining priorities, initiatives, and milestones. Fully editable in Canva, PowerPoint, and Google Slides, allowing you to adapt colors, icons, and text to match your business vision.