


Features
- 6 Unique slides
- Fully editable and easy to edit in Microsoft Powerpoint, Keynote and Google Slides
- 16:9 widescreen layout
- Clean and professional designs
- Export to JPG, PDF or send by email


Do you have any questions?
Recommend


6 slides
Forecasting Budget Methods Infographics
Enhance your budget forecasting strategies with our Forecasting Budget Methods infographic template. This template is fully compatible with popular presentation software like PowerPoint, Keynote, and Google Slides, allowing you to easily customize it to meet your specific financial planning needs. The Forecasting Budget Methods infographic template provides a structured framework for illustrating various budgeting techniques, such as top-down, bottom-up, zero-based budgeting, and more. Whether you're a financial analyst, business owner, or involved in financial planning, this template offers a user-friendly platform to create informative presentations and educational materials. Improve your financial decision-making with this SEO-optimized Forecasting Budget Methods infographic template, thoughtfully designed for clarity and ease of use. Customize it to showcase the strengths and applications of different budgeting methods, helping you make informed financial forecasts and achieve your financial goals. Start crafting your personalized infographic today!


7 slides
Implementation Models and Frameworks Slide Presentation
Visualize your entire process clearly with the Implementation Models and Frameworks Slide Presentation. This sleek arrow-based timeline features six distinct stages, each with icons and text placeholders to highlight key milestones, actions, or phases. Ideal for showcasing workflows, strategic initiatives, or rollout plans, this slide ensures your audience follows the journey from start to finish. Fully editable in PowerPoint, Keynote, and Google Slides, it’s perfect for project managers, consultants, and team leads aiming for clarity and impact.


21 slides
Frostfire Agile Project Plan Presentation
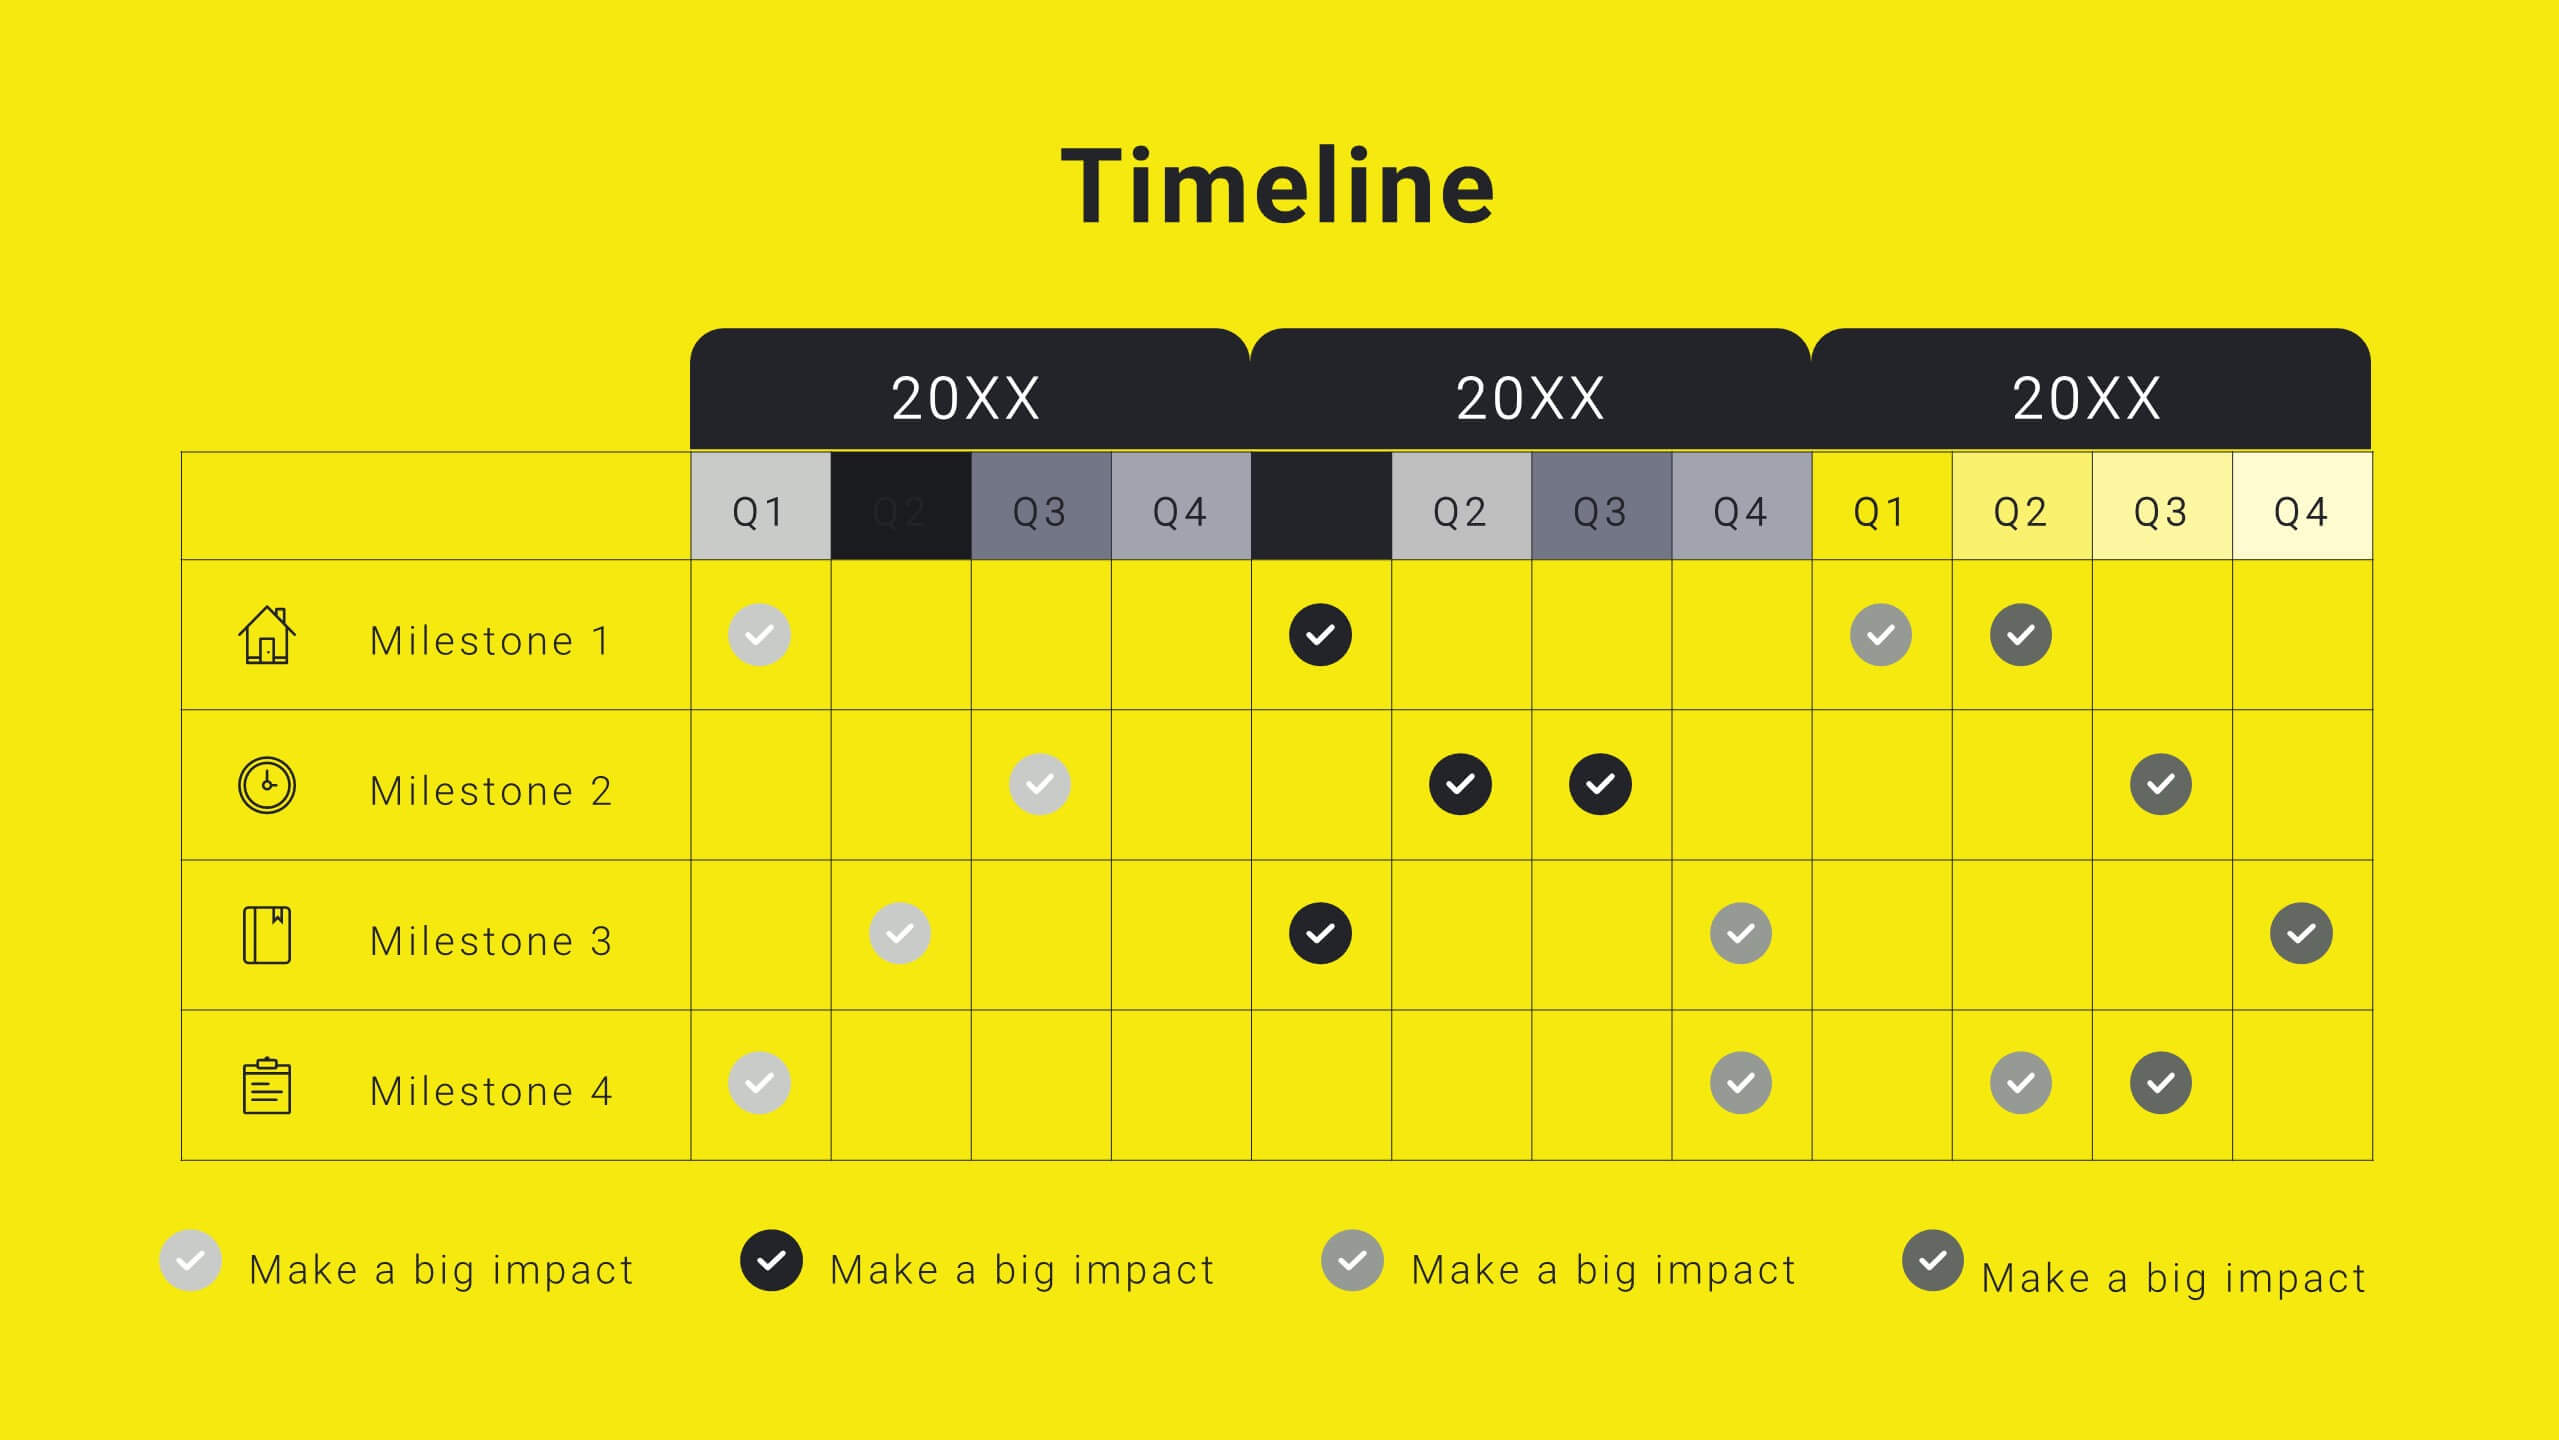
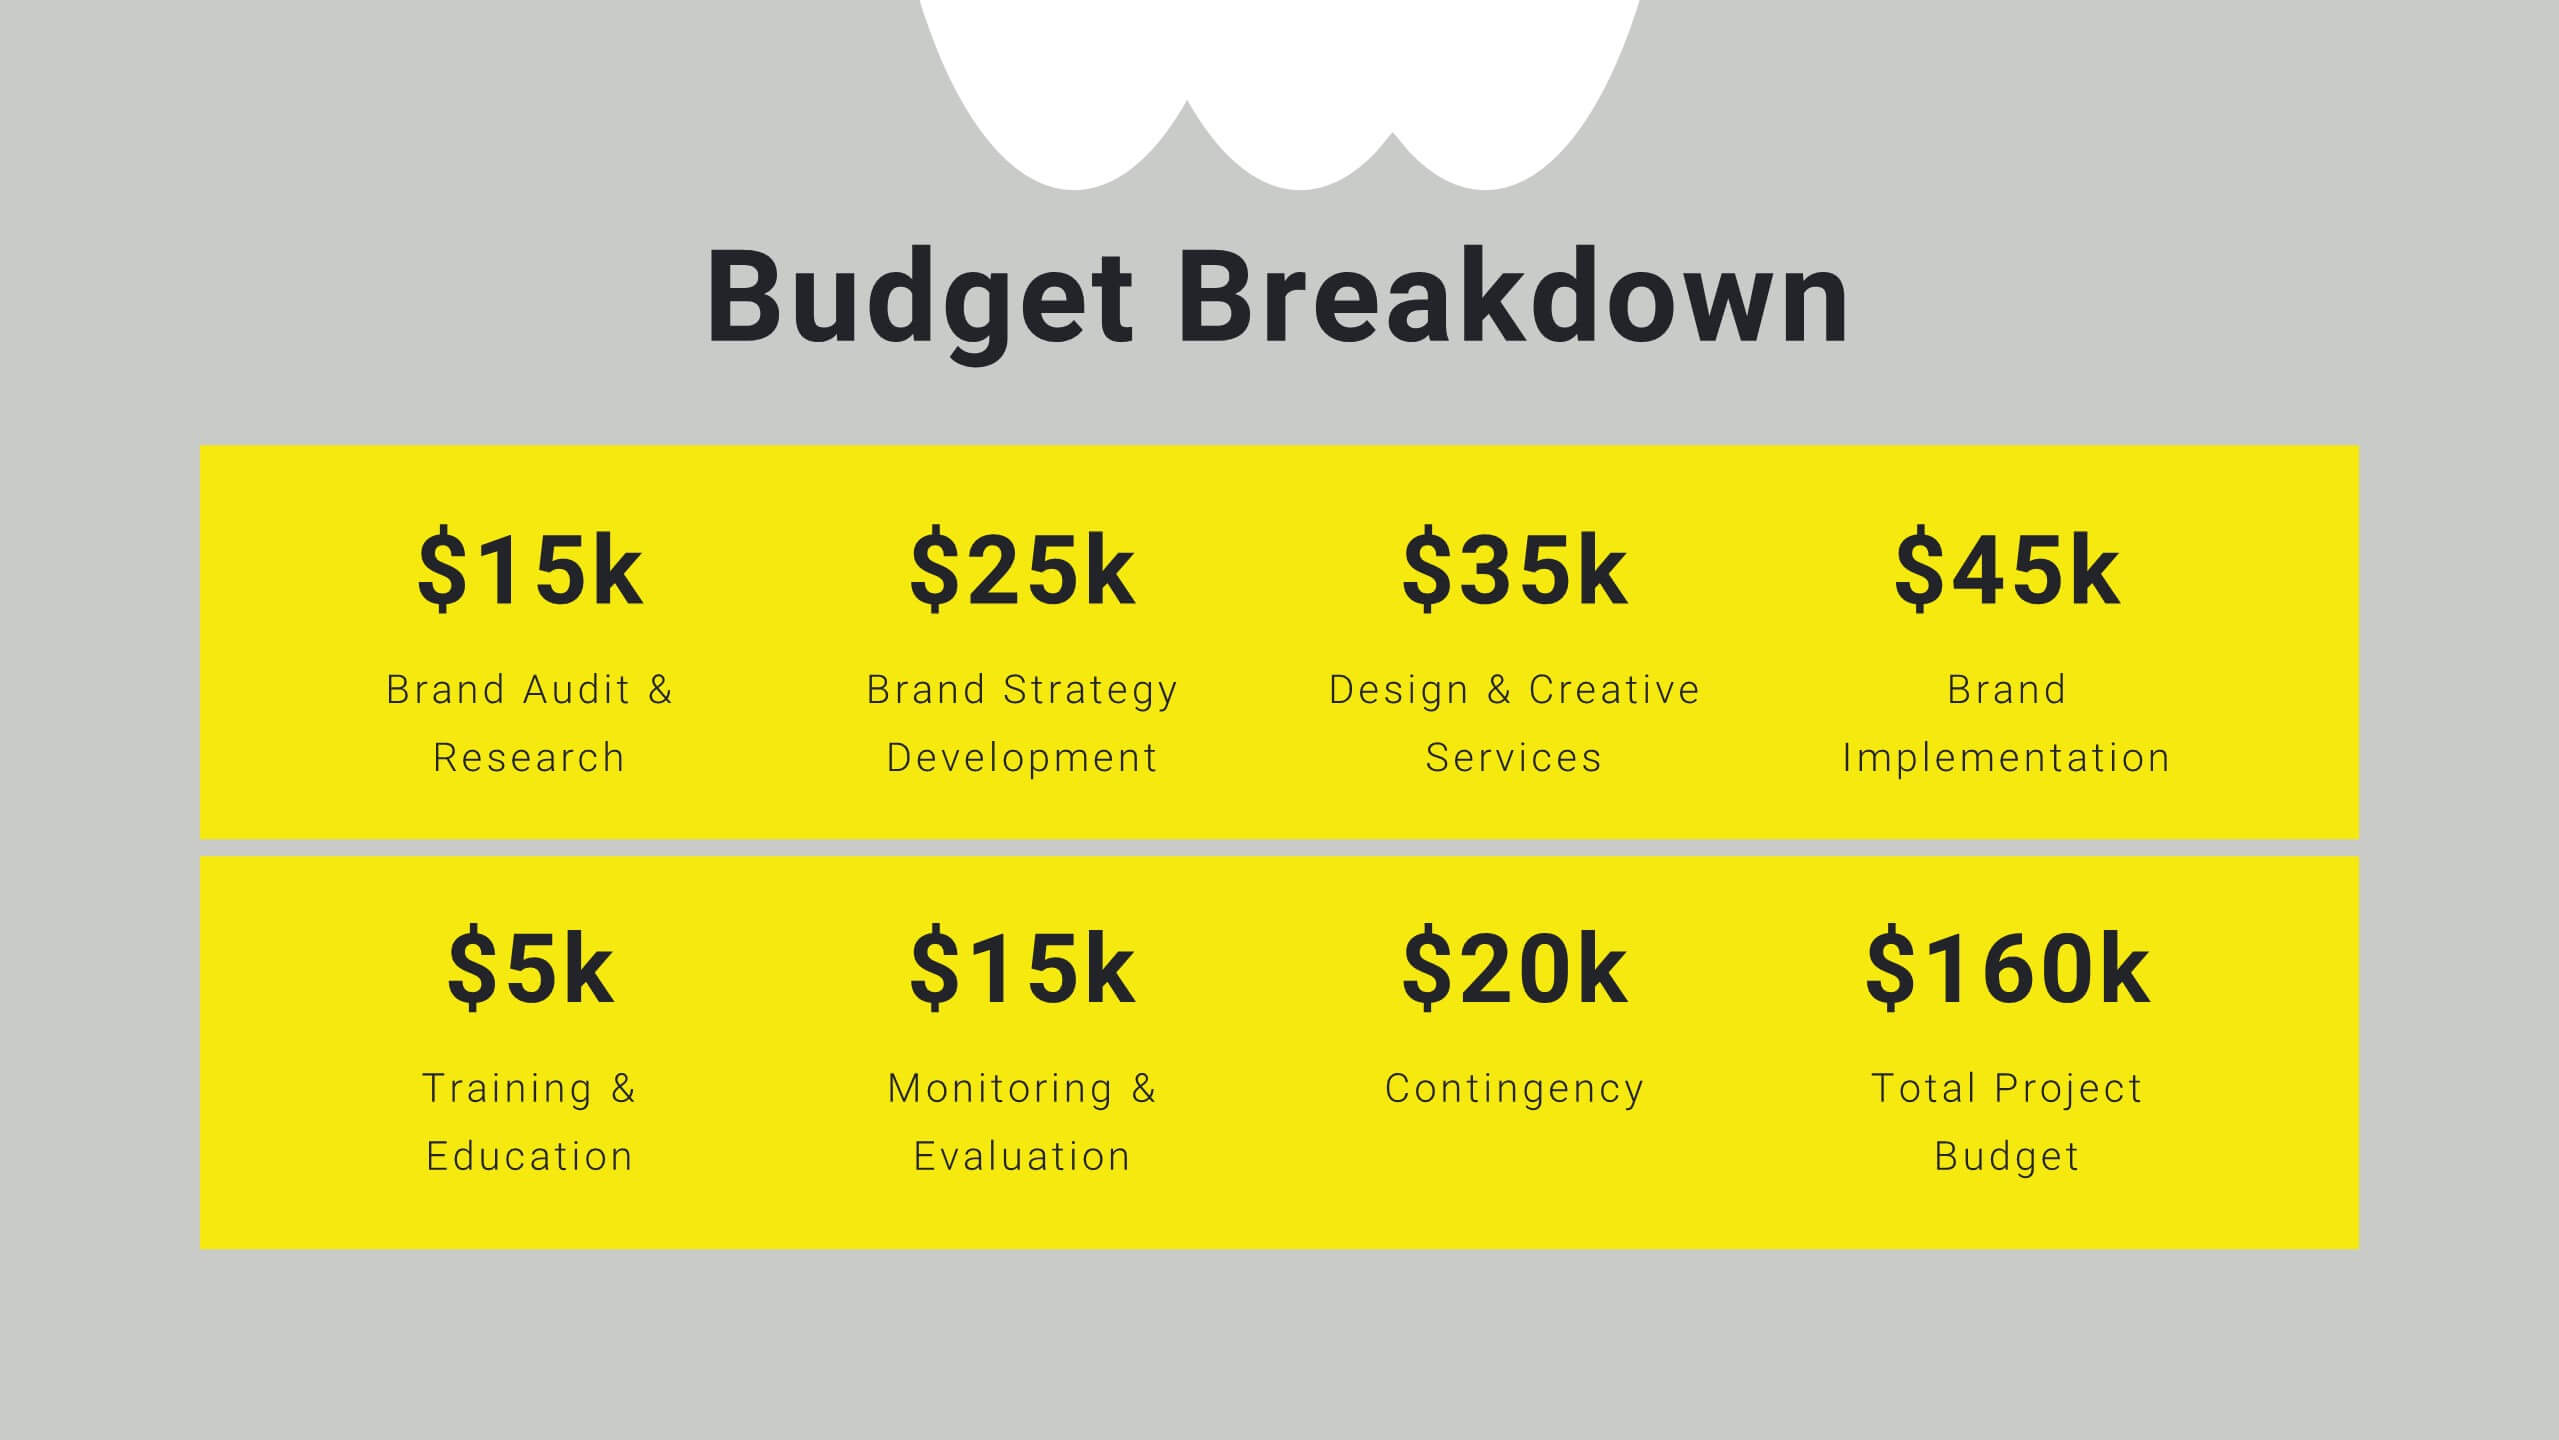
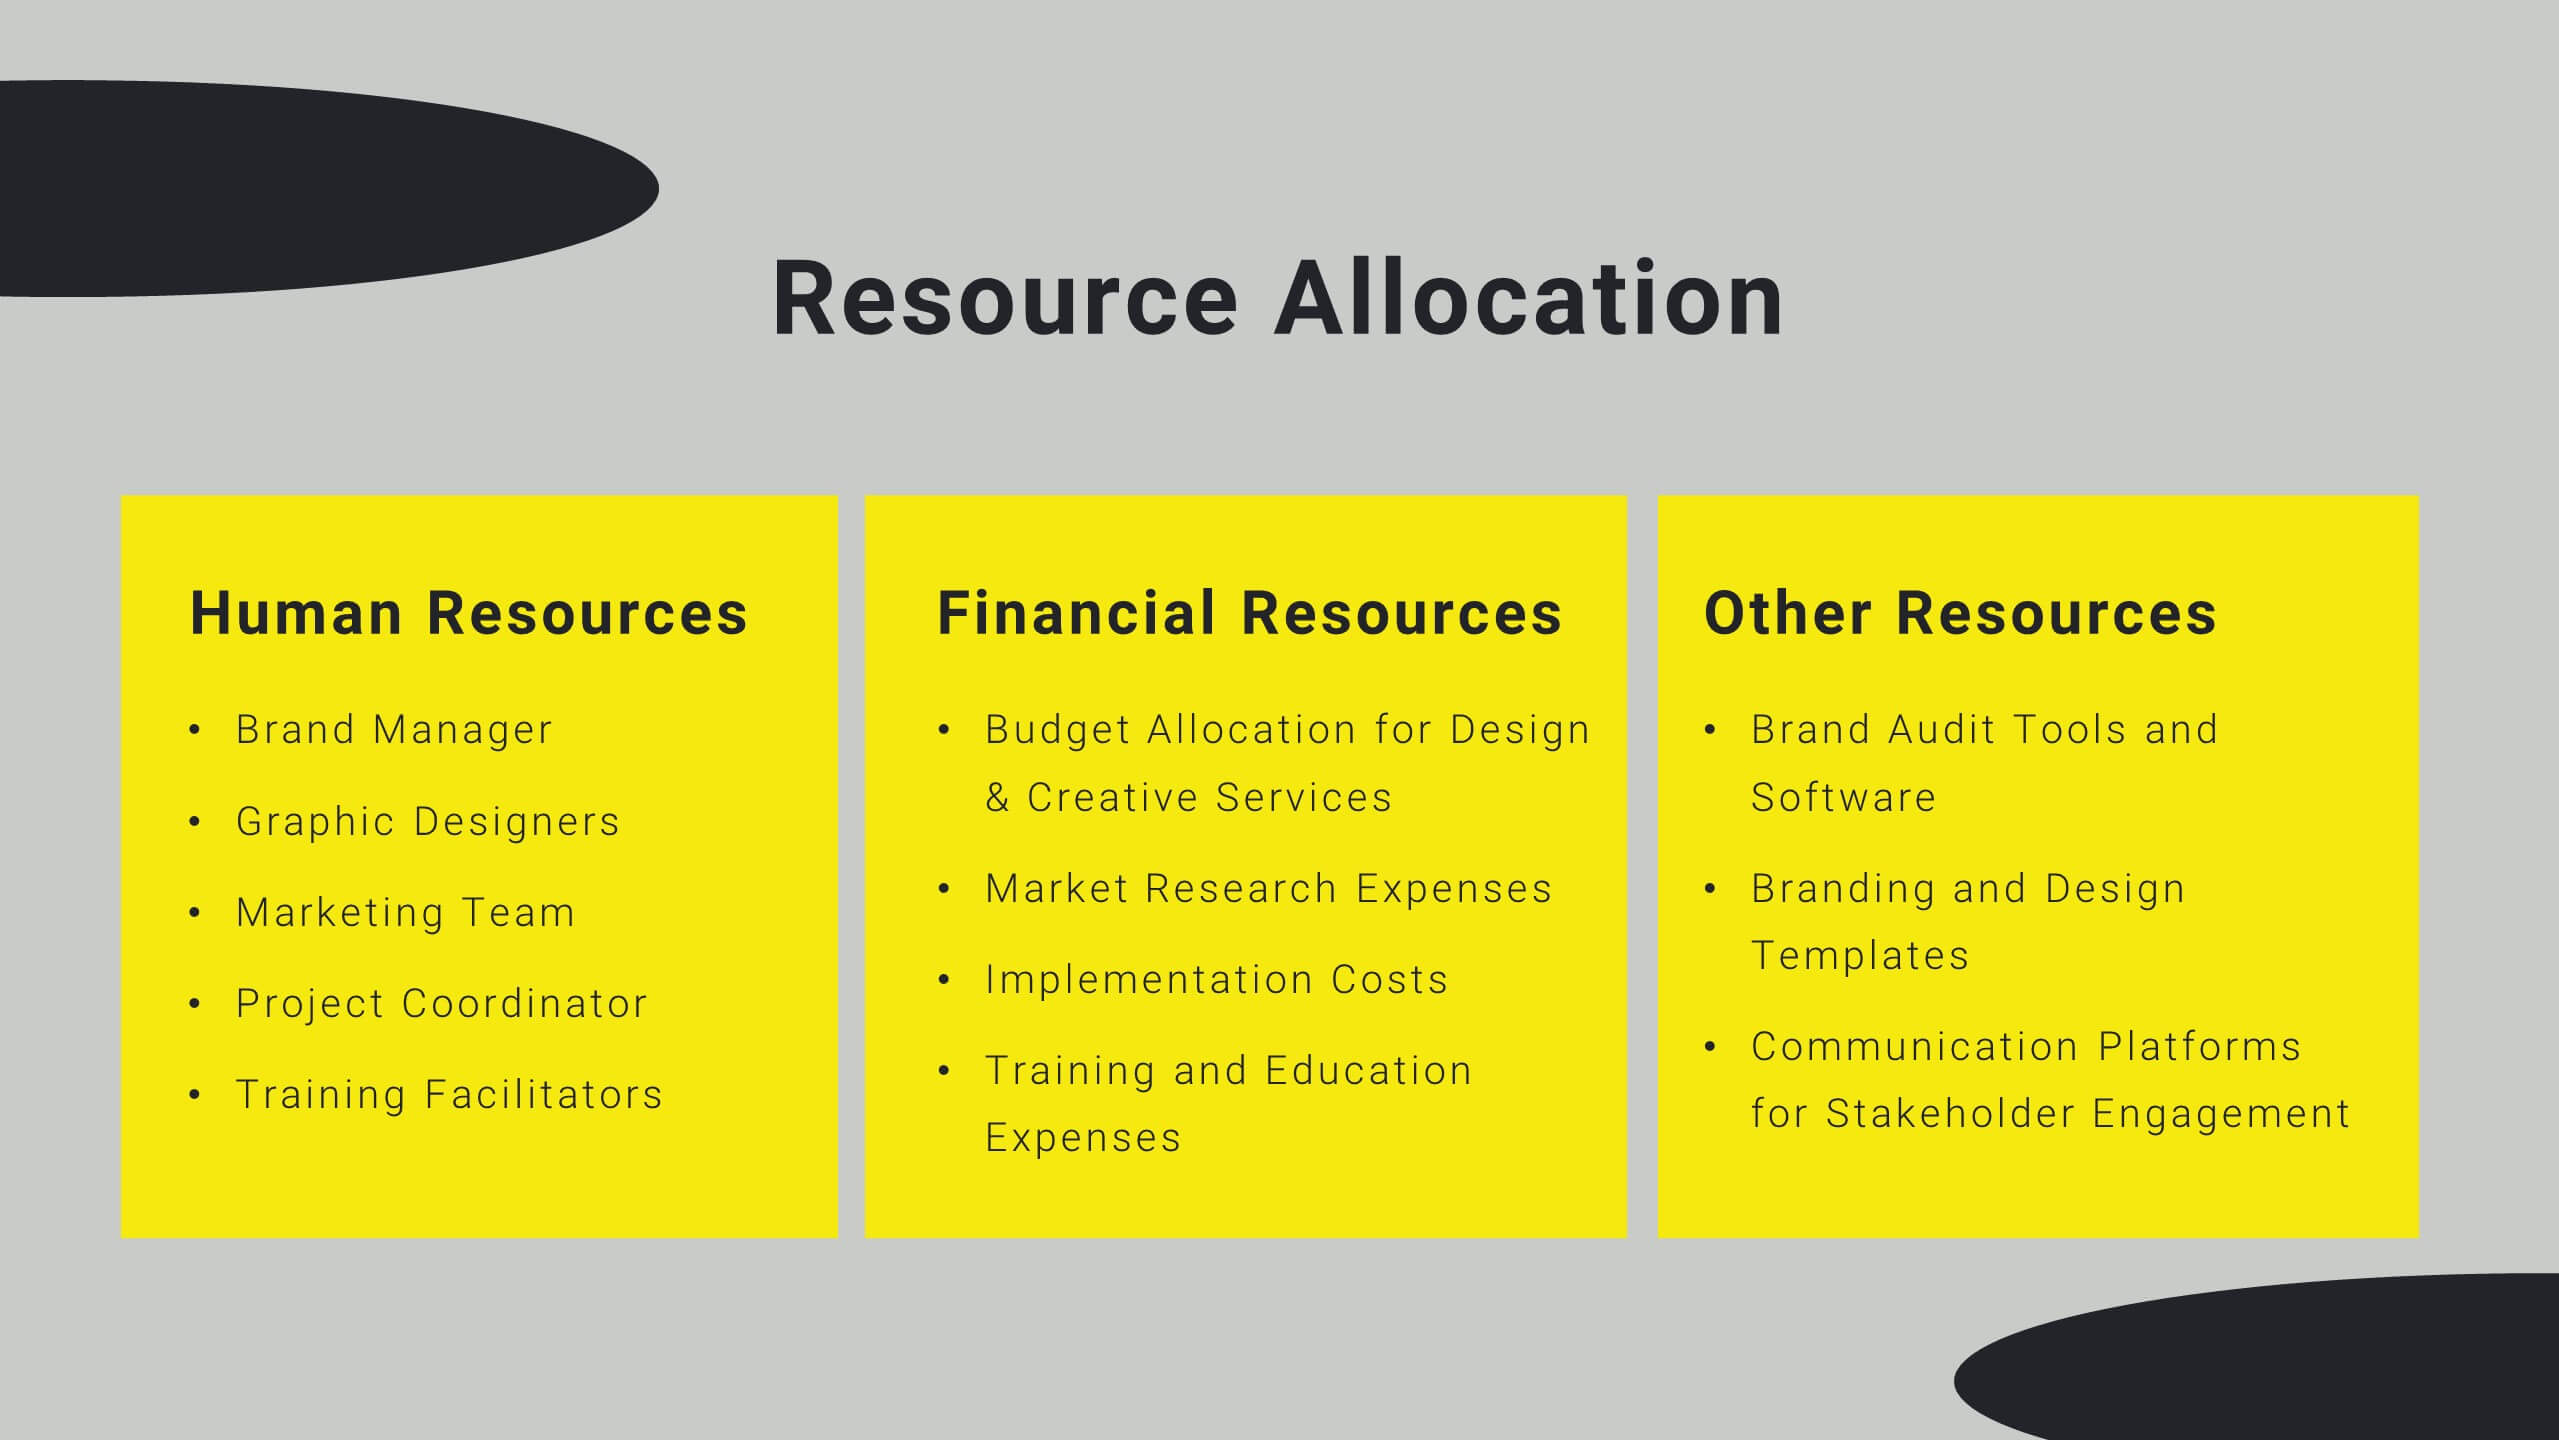
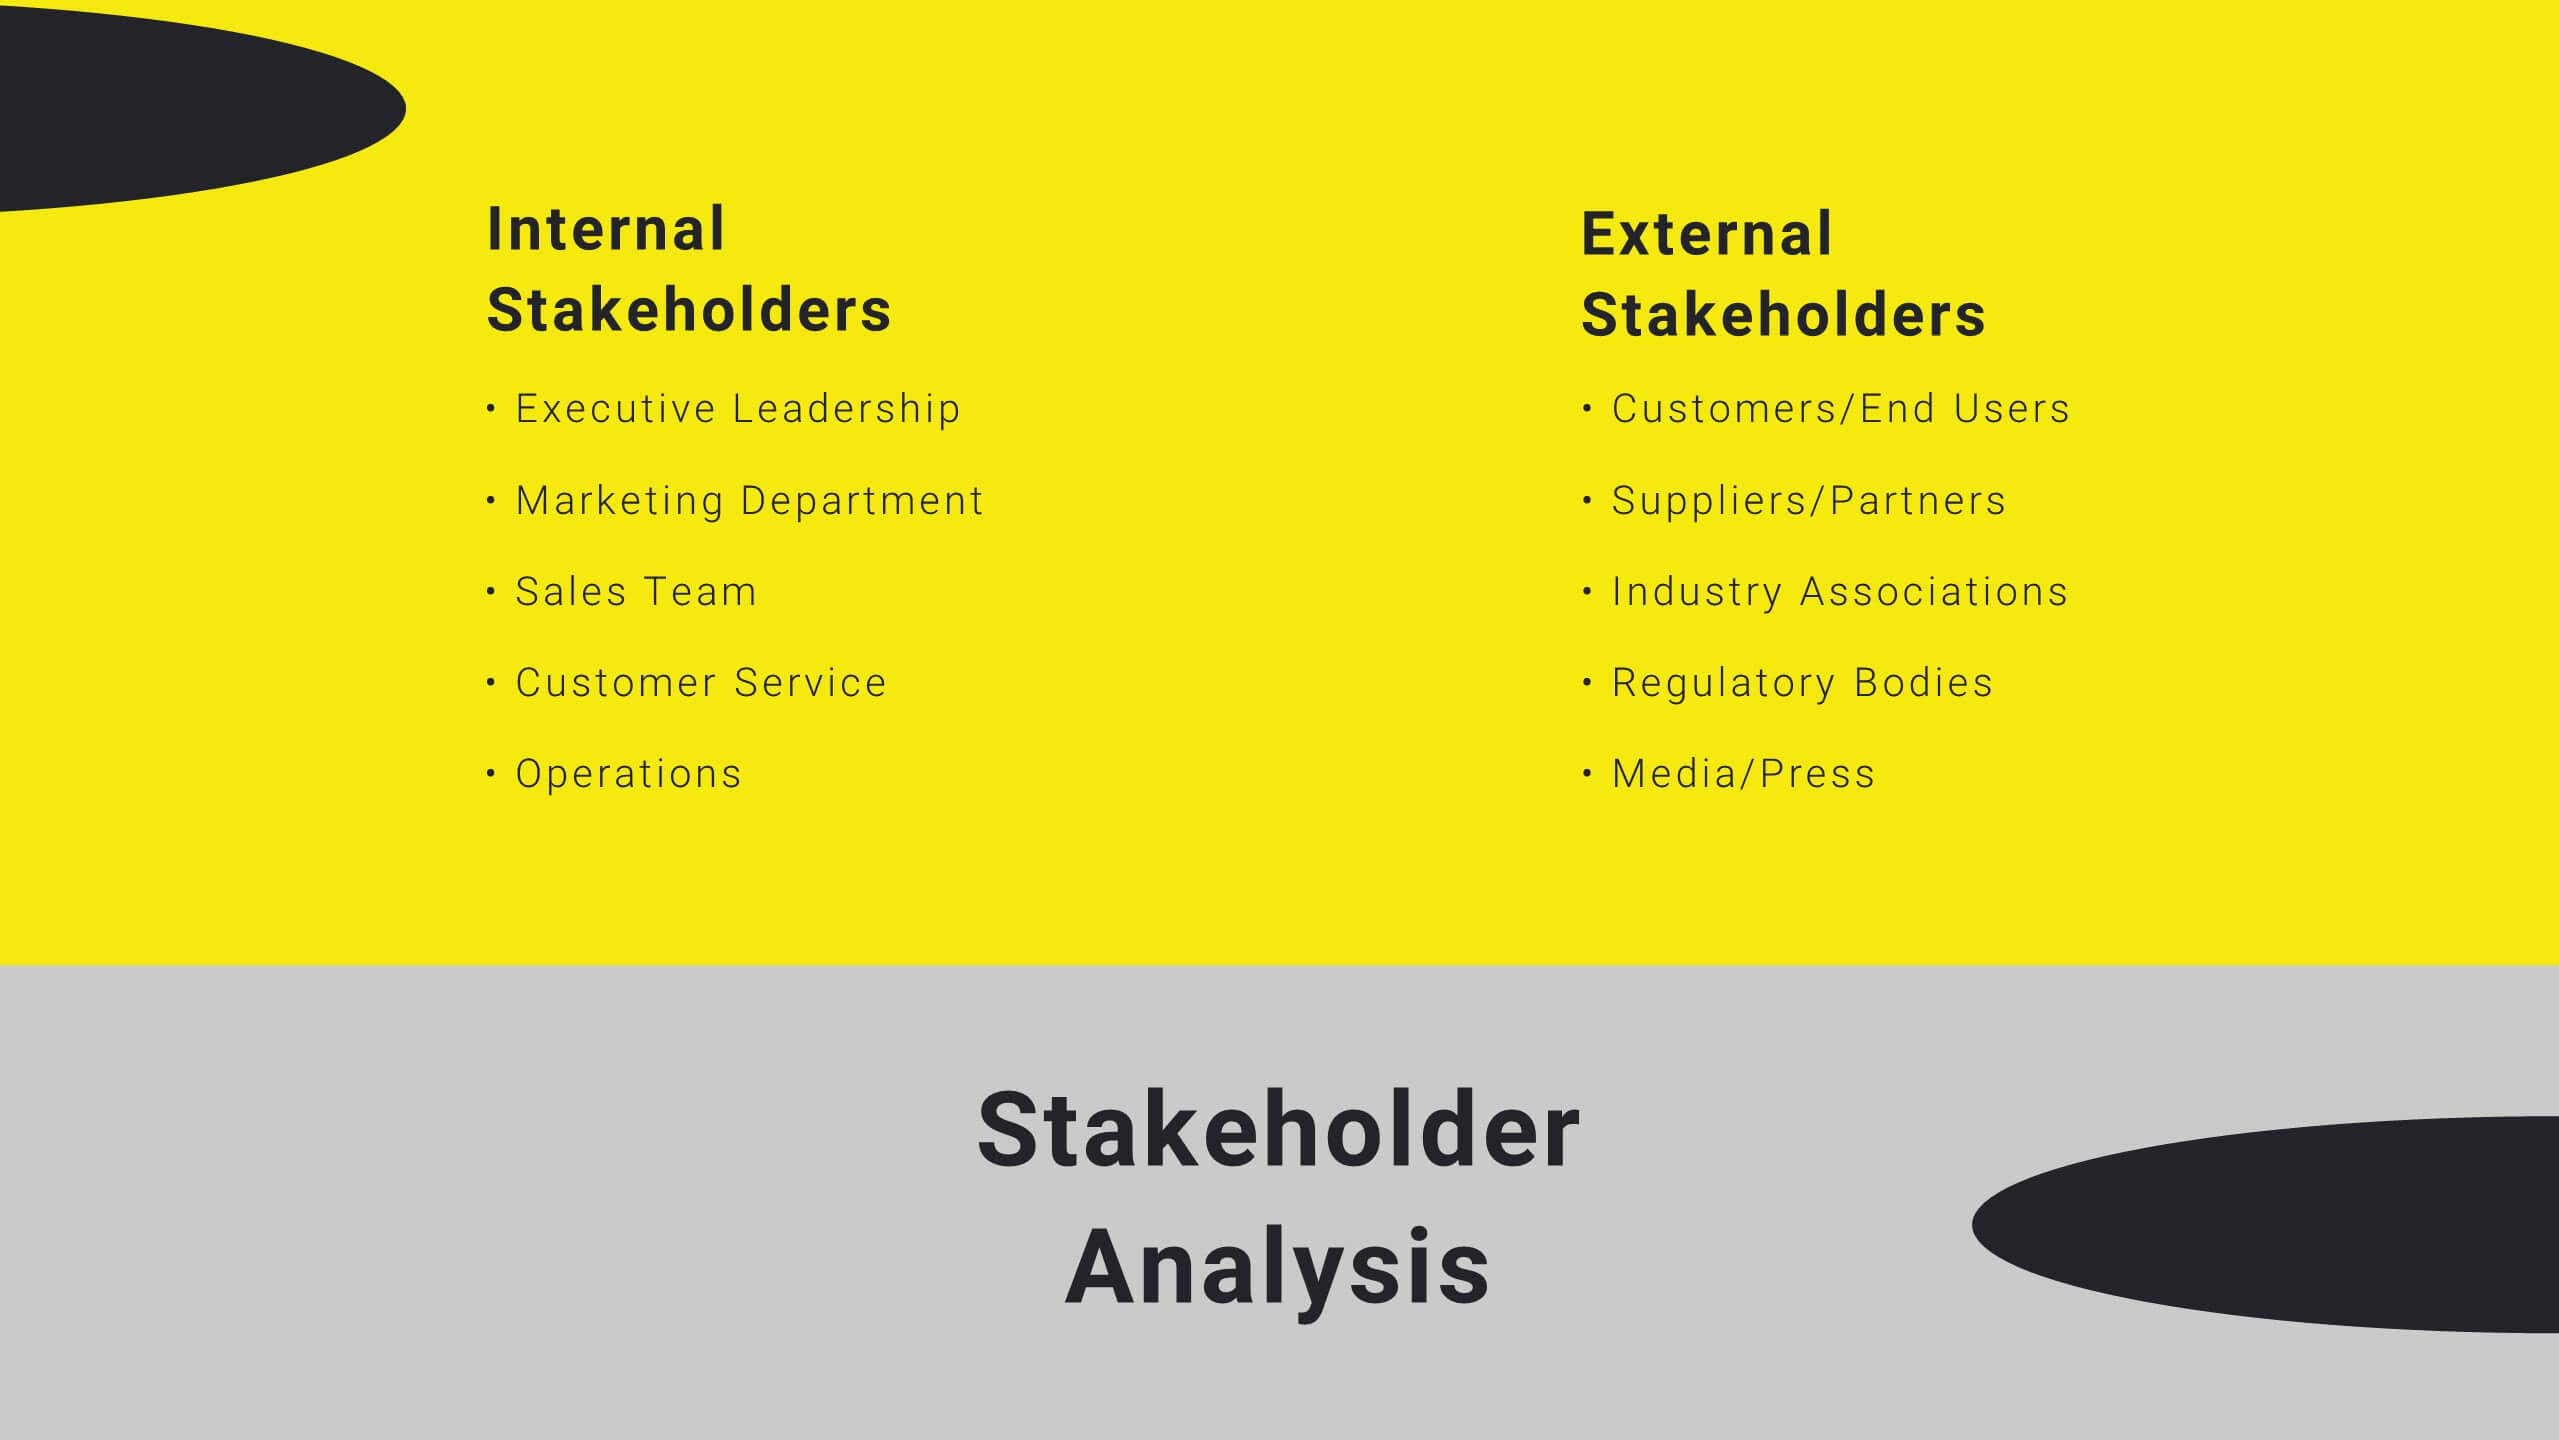
The Agile Project Plan Presentation Template features 21 cohesive slides including timelines, objectives, stakeholder analysis, and budget breakdowns. Its modern brown and lavender design ensures clarity and professionalism. Perfect for project managers and teams, it’s fully customizable and compatible with PowerPoint, Keynote, and Google Slides for seamless collaboration and presentations.


4 slides
Organizational Layered Structure Presentation
Visualize team dynamics and reporting lines with this clean and professional organizational layered structure template. Designed to help you present hierarchy, roles, and responsibilities across departments, this slide is perfect for HR, operations, or executive updates. Easily editable and fully compatible with PowerPoint, Keynote, and Google Slides.


7 slides
Asia Population Infographic Presentation
An Asia Map infographic is a visual representation of the Asian continent, highlighting its geographic features, population, culture, history, and other relevant information. Use this template as a graphic representation of Asia that combines text, data, and images in a visually appealing and informative way. This template can be used as a political or physical maps, regional map, thematic maps, or a combination of these. They may also include charts, graphs, illustrations, photographs, or other visual elements to convey information effectively. This template is completely customizable.


5 slides
Workforce Structure and Unity Overview Presentation
Present your team's hierarchy and alignment clearly with the Workforce Structure and Unity Overview Presentation. This slide layout is ideal for illustrating reporting relationships, department groupings, or organizational tiers in a clean and visual format. Great for onboarding, team updates, or internal planning meetings. Fully editable in PowerPoint, Keynote, Canva, and Google Slides.


6 slides
Sales Team Infographic
The series presented showcases various slide templates tailored for enhancing sales team strategies and communication. Each slide is crafted to assist sales professionals in detailing team structures, sales goals, performance metrics, and strategic initiatives effectively. Utilizing vibrant color blocks and streamlined design elements, these templates make complex sales data approachable and engaging, facilitating clear and impactful presentations. The collection is designed with adaptability in mind, incorporating elements that can be easily customized to fit different team needs and company branding. These include comparative layouts for benchmarking, timeline formats for showcasing sales cycles, and diagrammatic representations for visualizing sales processes and results. Perfect for internal meetings, sales training sessions, and stakeholder presentations, these templates serve as essential tools for sales leaders to convey their team’s progress, celebrate wins, and strategize for future sales endeavors.


26 slides
Workouts for Every Body Part Presentation
Achieve total-body fitness with this dynamic presentation on targeted workouts for every muscle group. Covering effective exercises, proper form, strength training techniques, and workout plans, this template helps simplify fitness routines for all levels. Fully customizable and compatible with PowerPoint, Keynote, and Google Slides for a seamless and engaging presentation experience.


6 slides
Construction Project Management Infographic
Construction project management is the process of planning, organizing, and overseeing construction projects from inception to completion. This infographic template is designed to showcase the essential elements and processes involved in managing a construction project. It is a concise and easy-to-understand visual representation of key aspects that play a vital role in successful project execution. This provides an overview of the project's key elements, progress, and success factors. This visually appealing infographic helps in effective communication, decision-making, and project monitoring throughout the construction process.


21 slides
Sable Detailed Project Execution Plan Presentation
Master your project planning with this comprehensive execution plan template! Perfect for detailing project overviews, objectives, and timelines, it includes slides for budget breakdowns, resource allocation, and risk management. Ensure every detail is covered with structured content and clear visuals. Compatible with PowerPoint, Keynote, and Google Slides for seamless presentations on any platform.


5 slides
Long-Term Strategy Slide Presentation
Ignite big ideas with a bold, forward-moving layout that makes long-range goals feel inspiring and achievable. This presentation helps you outline future plans, key milestones, and strategic priorities with clarity and visual impact. Easy to edit and fully compatible with PowerPoint, Keynote, and Google Slides.


8 slides
RACI Matrix Role Assignment Presentation
The "RACI Matrix Role Assignment" presentation template is designed to clarify role responsibilities in project management contexts. Each slide presents a clear visual breakdown of who is responsible, accountable, consulted, and informed (RACI) for each task within a project. This approach helps in preventing overlap and ensuring all team members are clear about their roles and responsibilities, promoting more effective communication and project management.


6 slides
Legal Compliance and Business Law Presentation
The Legal Compliance and Business Law template elegantly demystifies the complexity of legal compliance, showcasing essential aspects like regulations, law, legal systems, rules, standards, and requirements in an interconnected format. Ideal for presentations that require clear and concise delivery of compliance strategies. This template is compatible with PowerPoint, Keynote, and Google Slides.


15 slides
Business Proposal Infographic
A business proposal is a formal document that outlines a specific business endeavor, project, or venture, and presents a persuasive argument for why the proposed approach or solution is viable and advantageous. This infographic template is a tool for the business world to communicate business ideas, pitch a product or service, secure funding or partnerships, or enter into a business agreement. Fully customizable and compatible with Powerpoint, Keynote, and Google Slides. Showcase your unique value proposition and unveil how it fuels your journey to success. Energize your business propositions and set the stage for success!


7 slides
Business Process in Step-by-Step Presentation
Streamline operations with the Business Process in Step-by-Step presentation. This structured template breaks down complex workflows into clear, actionable steps, enhancing clarity and decision-making. Perfect for project planning, strategy execution, and workflow optimization. Fully customizable in PowerPoint, Keynote, and Google Slides for seamless presentation delivery.


20 slides
Mythion Business Idea Pitch Deck Presentation
Communicate your business vision with clarity and impact using this comprehensive pitch deck presentation template. Perfect for entrepreneurs, startups, and innovators, this template is designed to help you effectively present your idea to investors, stakeholders, or partners. Cover every essential aspect of your business journey with slides dedicated to the problem statement, solutions, market overview, and target audience. Showcase your business model, revenue projections, and unique selling proposition with visually appealing layouts. Highlight your marketing strategy, growth projections, and funding requirements to build a strong, persuasive case. Fully customizable and compatible with PowerPoint, Google Slides, and Keynote, this template allows you to tailor each slide to suit your business identity and goals. Whether you're pitching a new idea or seeking investment, this template ensures you present with professionalism and confidence.


5 slides
Scientific Process and Research Framework Presentation
Present each stage of your scientific research with clarity using this linear flow diagram. Ideal for breaking down experiments, protocols, or academic processes into structured phases. Features labeled sections, icons, and directional arrows to guide your audience. Fully editable in PowerPoint, Keynote, and Google Slides to match your content needs.