Digital Education and E-Learning Trends Presentation
PowerPoint Template and Google Slides Theme
Features
- 6 Unique slides
- Fully editable and easy to edit in Microsoft Powerpoint, Keynote and Google Slides
- 16:9 widescreen layout
- Clean and professional designs
- Export to JPG, PDF or send by email
- Remove from favorites
Powerpoint Template
1 MB
Google Slides Template
External link
Keynote Template
2 MB
Recommend
- Remove from favorites
Powerpoint Template
1 MB
Google Slides Template
External link
Keynote Template
1 MB
7 slides
Pricing Comparison Table Infographic
Dive into the strategic world of pricing with our intricately designed pricing table infographic. Imbued with the trustworthiness of blue, the crisp clarity of white, the optimism of yellow, and the urgency of red, our template visualizes pricing strategies in an engaging manner. Furnished with detailed infographics, distinct icons, and adaptable image placeholders, it translates complex pricing data into an easy-to-grasp format. Seamlessly crafted for Powerpoint, Keynote, or Google Slides. A vital asset for business analysts, marketers, sales professionals, or any brand strategizing its pricing model. Engage your audience; let every slide be a value proposition.
- Remove from favorites
Powerpoint Template
1 MB
Google Slides Template
External link
Keynote Template
1 MB
7 slides
Hierarchy Infographic Presentation Template
This Hierarchy infographic template presents information in a hierarchical format and makes it easy to see the most important pieces of information without having to read through all of your content. Use this template as a starting point to create an effective hierarchy chart by copying and pasting the template into PowerPoint. It features an assortment of color schemes and styles that can be customized. Our hierarchy infographic template will help you build an amazing presentation. This isn't just an ordinary Infographic template, it features a design that will stand out in the crowd!
- Remove from favorites
Powerpoint Template
7 MB
Google Slides Template
External link
Keynote Template
7 MB
26 slides
Celebrating Veterans on Memorial Day Presentation
Craft a heartfelt tribute with this presentation template, designed to honor the service and dedication of those who have served. The thoughtful mix of imagery, including symbolic ribbons and the nation’s flag, conveys a deep respect and appreciation. The color scheme, redolent of valor and patriotism, sets the stage for a narrative of remembrance and gratitude. Ideal for sharing stories of courage, commemorating milestones, and educating about the significance of service, the slides offer a blend of solemnity and celebration. Infographics and timelines provide context to historical events and individual journeys, while portraits and personal accounts bring a human touch to the presentation. This template is well-suited for community events, educational settings, or any forum where paying homage to heroes is the centerpiece. Fully compatible with PowerPoint, Keynote, and Google Slides, it's an essential tool for crafting a presentation that’s as meaningful as the day it commemorates.
- Remove from favorites
Powerpoint Template
1 MB
Google Slides Template
External link
Keynote Template
2 MB
7 slides
Editable Gantt Timeline Presentation
Stay on top of your project deadlines with this Editable Gantt Timeline Presentation. Designed with a clean monthly layout and six task rows, it makes scheduling and tracking progress simple. Customize task names, durations, and icons easily. Perfect for PowerPoint, Keynote, or Google Slides for professional project planning.
- Remove from favorites
Powerpoint Template
1 MB
Google Slides Template
External link
Keynote Template
2 MB
8 slides
Yearly Calendar Planning Presentation
The "Yearly Calendar Planning" presentation template is designed to help visualize task progress over a 12-month period. Each row represents a specific task, labeled as Task 01 through Task 04, with each month represented by a square. The color coding—orange for "Done", gray for "In Progress", red for "Revision", and yellow for "Hold On"—provides a clear visual status of each task's progress. This template is ideal for project managers and team leads who need to track and report on the status of multiple tasks over the course of a year, ensuring a comprehensive view of project timelines and milestones.
- Remove from favorites
Powerpoint Template
8 MB
Google Slides Template
External link
Keynote Template
7 MB
26 slides
Exploring America's War Memorials Presentation
Take a respectful journey through history with this compelling presentation template, crafted to guide viewers through poignant landmarks of valor and sacrifice. The color scheme, grounded in red, white, and blue, echoes the solemn pride of a nation's storied past. Each slide thoughtfully combines striking imagery with educational content, from powerful photographs of monuments to timelines that map out their historical significance. Designed for engagement, the template's diverse layouts support a variety of narratives—personal stories of heroes, the architectural grandeur of memorials, or the quiet power of hallowed grounds. It's a tool that serves educators, historians, and advocates, facilitating a deep dive into the stories behind each site. Adaptable for use in PowerPoint, Keynote, and Google Slides, it's an ideal medium for those eager to honor and explore these testaments to bravery, ensuring each presentation is as memorable as the memorials it celebrates.
- Remove from favorites
Powerpoint Template
6 MB
Google Slides Template
External link
Keynote Template
5 MB
26 slides
Speech Therapy for Adults Presentation
Enhance communication with our Speech Therapy for Adults presentation template, a versatile tool for PowerPoint, Keynote, and Google Slides. This template is expertly designed for speech therapists, healthcare professionals, and educators working with adults to improve their speech and communication skills. The thoughtful layout and calming color scheme provide a supportive atmosphere for learning and development. The slides are crafted to facilitate the presentation of strategies, exercises, and progress in speech therapy sessions. From introducing the therapy team to detailed process infographics, this template supports a wide range of content. Use the mind map infographic to explain the connections between speech and cognition, and the comparison slides to show therapy techniques and their effectiveness. Our Speech Therapy for Adults template is more than a presentation; it's a pathway to clearer communication. Download it now to empower your clients and guide them towards successful expression, one slide at a time.
- Remove from favorites
Powerpoint Template
4 MB
Google Slides Template
External link
Keynote Template
5 MB
6 slides
Creative Interior Design Portfolio Showcase Presentation
Showcase your creativity with the Creative Design Portfolio Showcase presentation. This template is perfect for graphic designers, architects, and creative professionals looking to display their work in a visually compelling format. Featuring modern layouts, high-quality image placeholders, and structured text sections, it allows for easy customization to highlight key insights. Fully compatible with PowerPoint, Keynote, and Google Slides.
- Remove from favorites
Powerpoint Template
4 MB
Google Slides Template
External link
Keynote Template
5 MB
26 slides
Diabetes Medical Research Presentation
Diabetes is a chronic condition that occurs when the body either doesn't produce enough insulin or cannot effectively use the insulin it produces. This template is designed to effectively communicate your medical research findings, raise awareness about diabetes, and contribute to advancements in diabetes care and management. Compatible with Powerpoint, Keynote, and Google Slides, this template offers you a versatile platform to present your research effectively. It features a colorful design with customizable photo layouts, charts, and infographics to help present your information in a visually appealing manner.
- Remove from favorites
Powerpoint Template
7 MB
Google Slides Template
External link
Keynote Template
8 MB
26 slides
History of Internet Neon Presentation
The history of the internet is marked by continuous innovation and evolution, and it has become an integral part of modern life. With our neon presentation template, let's embark on a thrilling journey from the inception of the world wide web to the interconnected digital universe we live in today. Fully customizable and compatible in Powerpoint, Keynote, and Google Slides. The lively and energetic neon colors represent the dynamism of the internet. With a blend of vivid visuals and informative content, this brings the fascinating tale of the internet to life. Take your audience through the ages of the web, showcasing its evolution.
- Remove from favorites
Powerpoint Template
3 MB
Google Slides Template
External link
Keynote Template
4 MB
2 slides
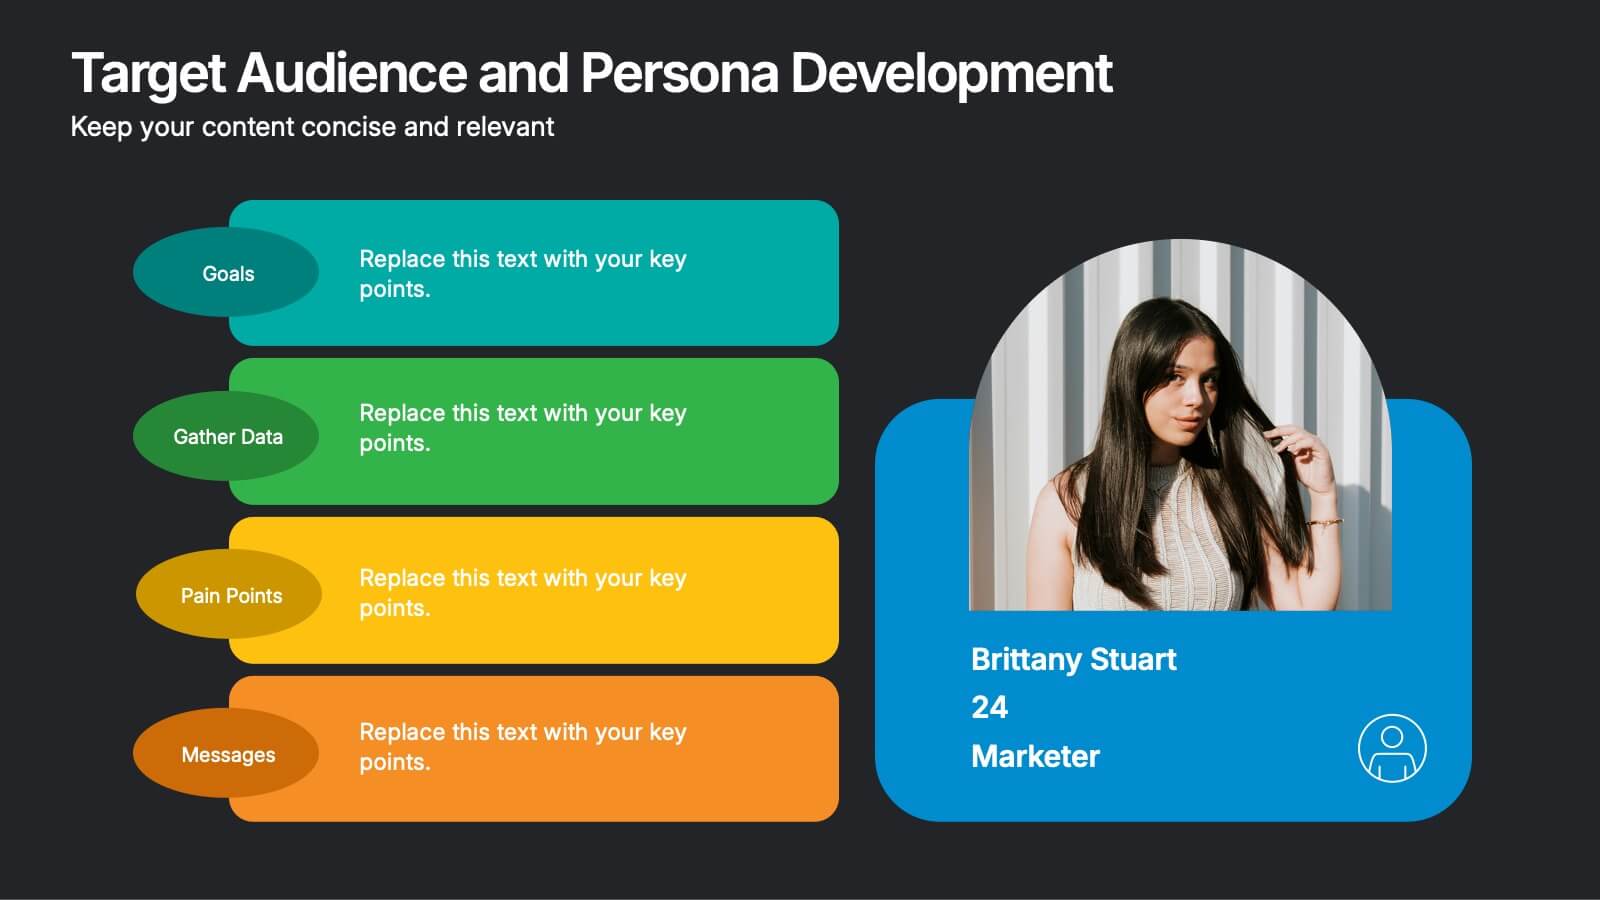
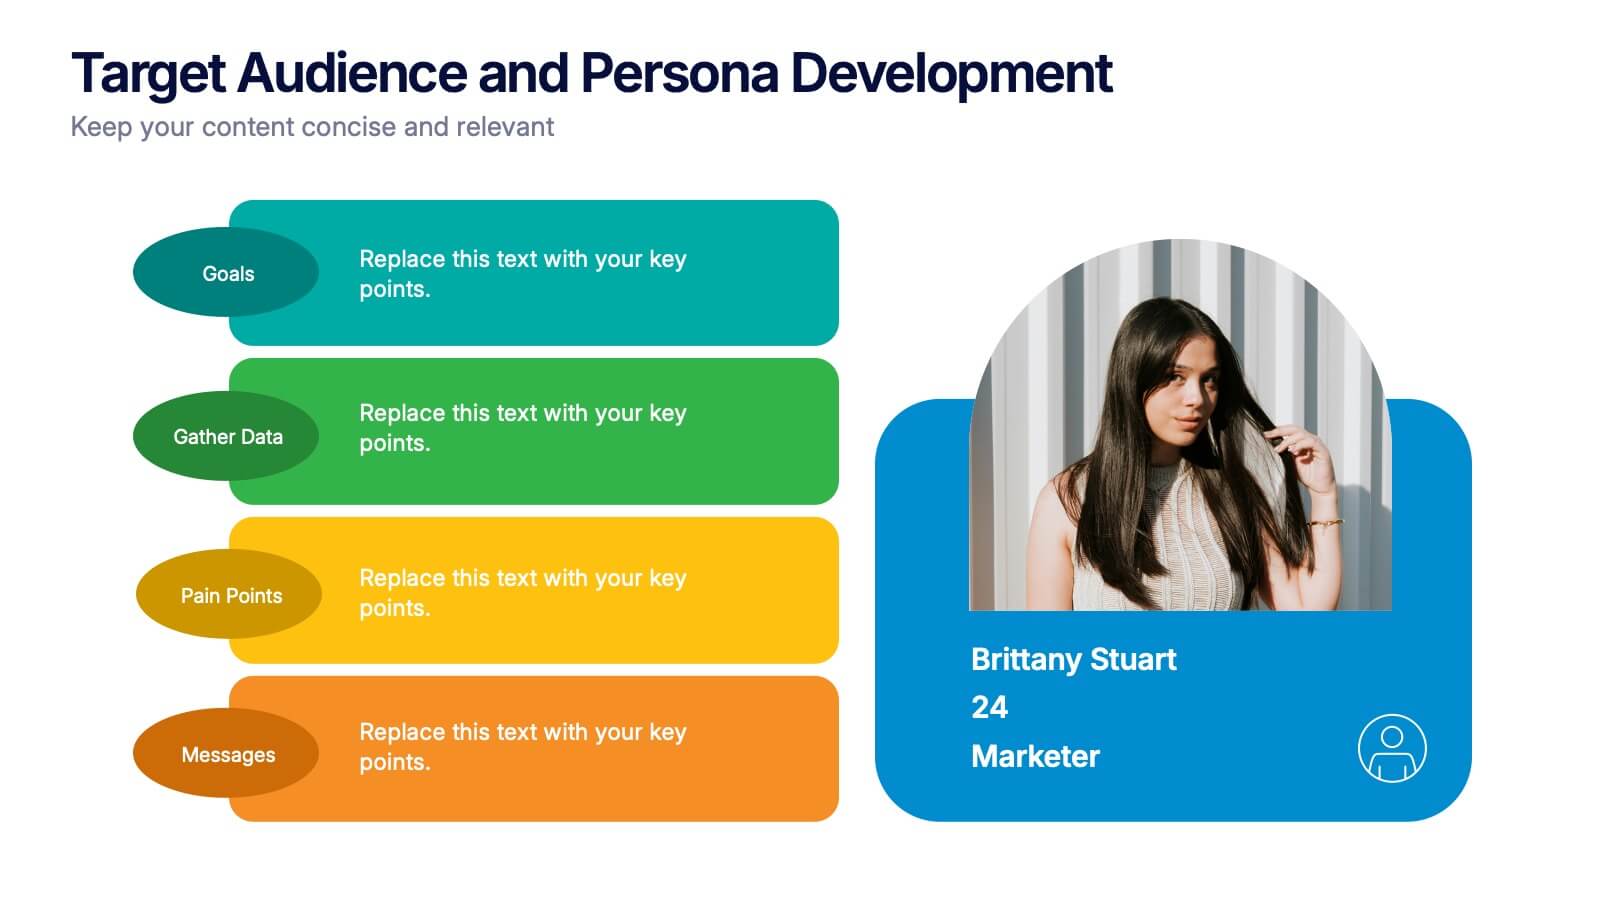
Target Audience and Persona Development Presentation
Bring your audience straight into the heart of your ideal customer with a vibrant, story-focused slide that highlights goals, motivations, data insights, and key pain points. This presentation makes it easy to communicate who you’re targeting and why it matters. Fully compatible with PowerPoint, Keynote, and Google Slides.
- Remove from favorites
Powerpoint Template
4 MB
Google Slides Template
External link
Keynote Template
2 MB
5 slides
Market Growth Strategies in North America Map Presentation
Unveil regional growth opportunities with the Market Growth Strategies in North America Map template, which provides a strategic layout for presenting business growth metrics across various regions.This template includes data-driven graphs to visualize performance and strategy deployment effectively. It's designed to aid professionals in making informed decisions and is compatible with PowerPoint, Keynote, and Google Slides.
- Remove from favorites
Powerpoint Template
1 MB
Google Slides Template
External link
Keynote Template
2 MB
10 slides
Innovation in Science Presentation
Showcase cutting-edge ideas with this Innovation in Science Presentation Template. Featuring a sleek lightbulb graphic with colorful horizontal bars, it's ideal for outlining research stages, technological breakthroughs, or futuristic concepts. Great for scientists, educators, and innovation teams. Easily customizable in PowerPoint, Keynote, and Google Slides.
- Remove from favorites
Powerpoint Template
1 MB
Google Slides Template
External link
Keynote Template
1 MB
5 slides
Social Media Marketing Infographics
Social Media Marketing is an essential component of any modern marketing strategy. These vertical infographics can be used to provide valuable insights into the most effective social media platforms, the latest trends in social media marketing, and tips and strategies for optimizing social media campaigns. These are an excellent way to communicate complex information in an easy-to-digest format and can be used for marketing and educational purposes. Use these infographics to Include data on user demographics, engagement rates, platform-specific best practices, and industry benchmarks.
- Remove from favorites
Powerpoint Template
1 MB
Google Slides Template
External link
Keynote Template
1 MB
6 slides
Creative Solutions for Business Challenges Presentation
Present your strategy with impact using the Creative Solutions for Business Challenges Presentation. Featuring a dynamic cloud and gear diagram, this layout helps illustrate interconnected solutions and innovative thinking. Ideal for brainstorming, strategic planning, and team problem-solving discussions. Fully editable in PowerPoint, Keynote, and Google Slides.
- Remove from favorites
Powerpoint Template
1 MB
Google Slides Template
External link
Keynote Template
1 MB
4 slides
Team Member Compensation and Benefits
Showcase employee rewards, perks, and compensation structures with this sleek, progressive flow design. Perfect for HR presentations, onboarding materials, or internal updates. Easily customizable in PowerPoint, Keynote, and Google Slides to match your branding needs.
- Remove from favorites
Powerpoint Template
1 MB
Google Slides Template
External link
Keynote Template
1 MB
5 slides
RAPID Decision-Making Model
Take the guesswork out of group decisions with this bold and clear template. It’s designed around the RAPID framework—Recommend, Agree, Perform, Input, Decide—to help teams define roles and make faster, more accountable choices. Perfect for leadership, strategy, and project planning sessions. Fully compatible with PowerPoint, Keynote, and Google Slides.


