


Features
- 4 Unique slides
- Fully editable and easy to edit in Microsoft Powerpoint, Keynote and Google Slides
- 16:9 widescreen layout
- Clean and professional designs
- Export to JPG, PDF or send by email


Do you have any questions?
Recommend


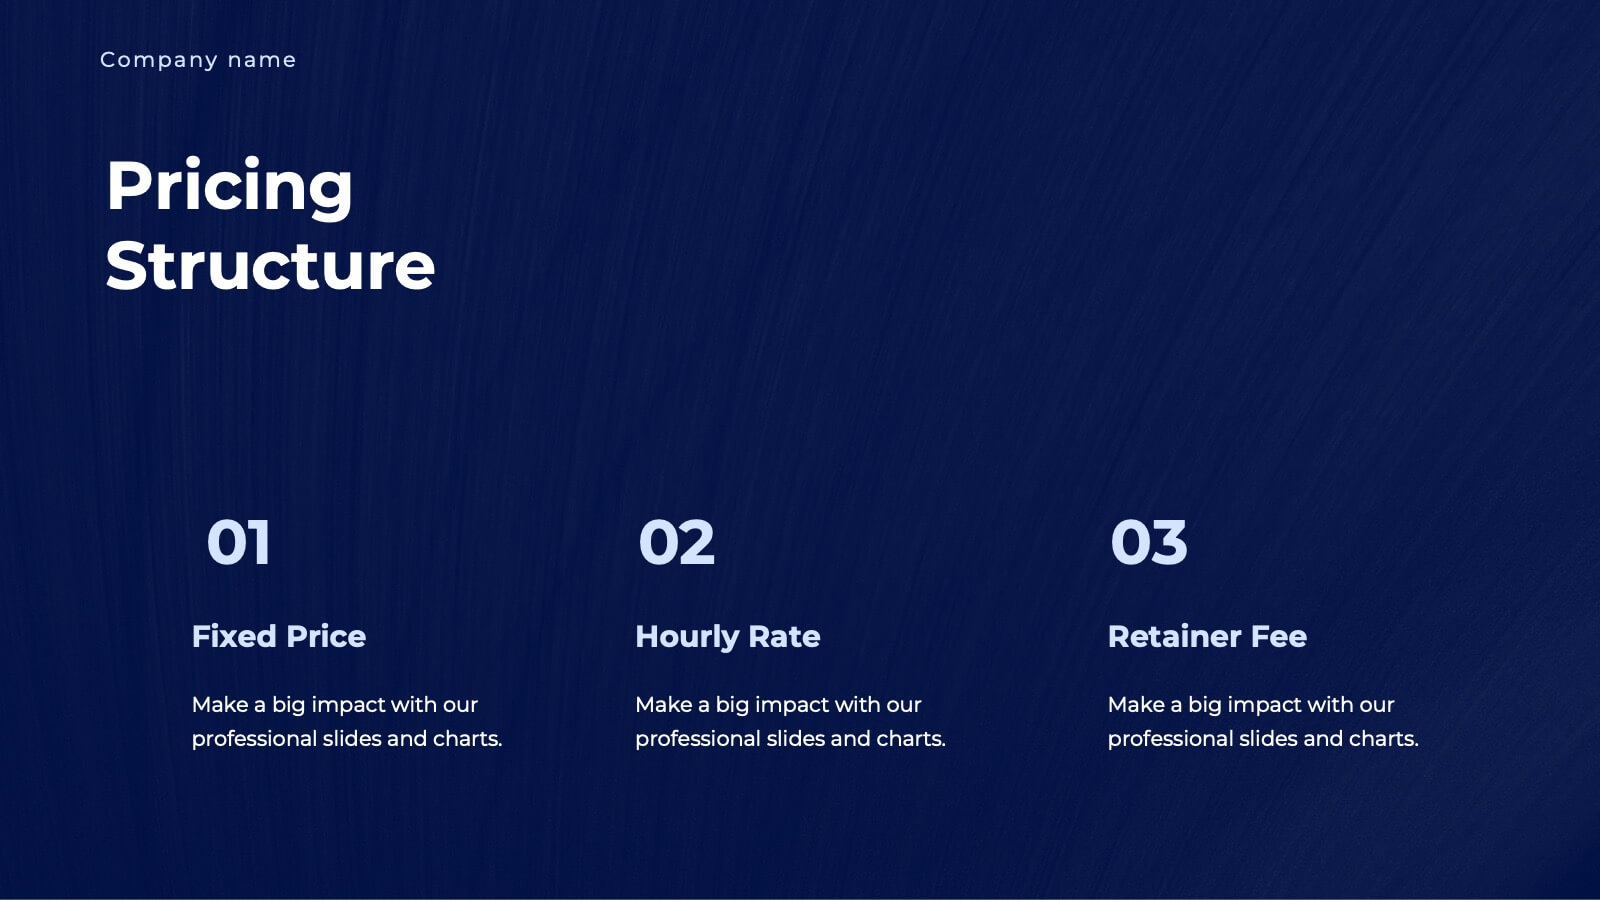
5 slides
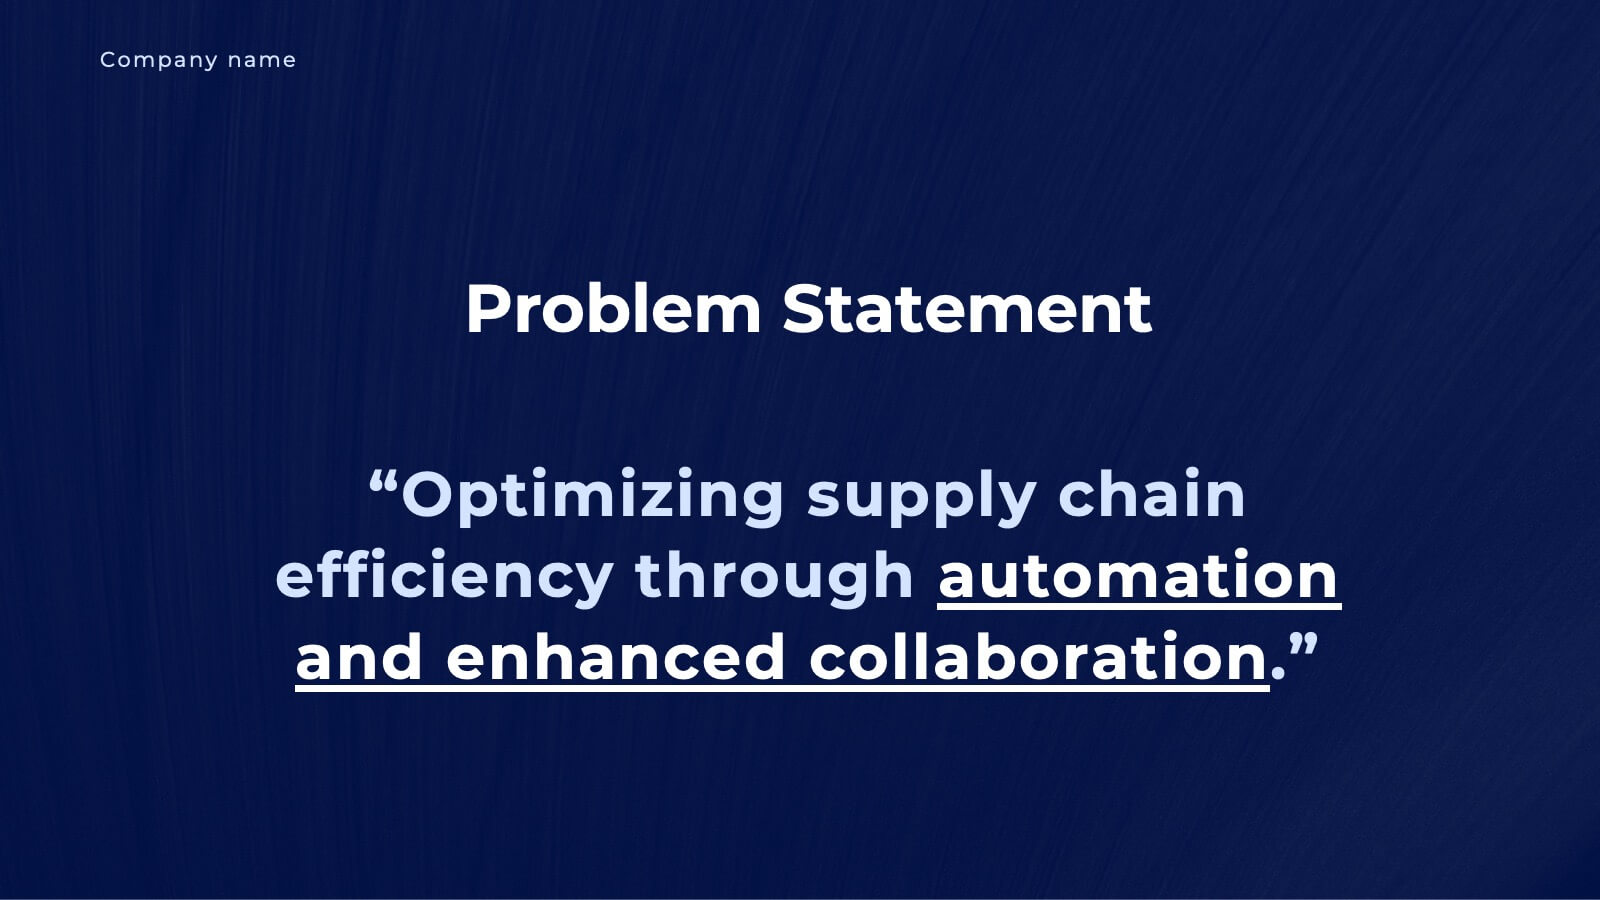
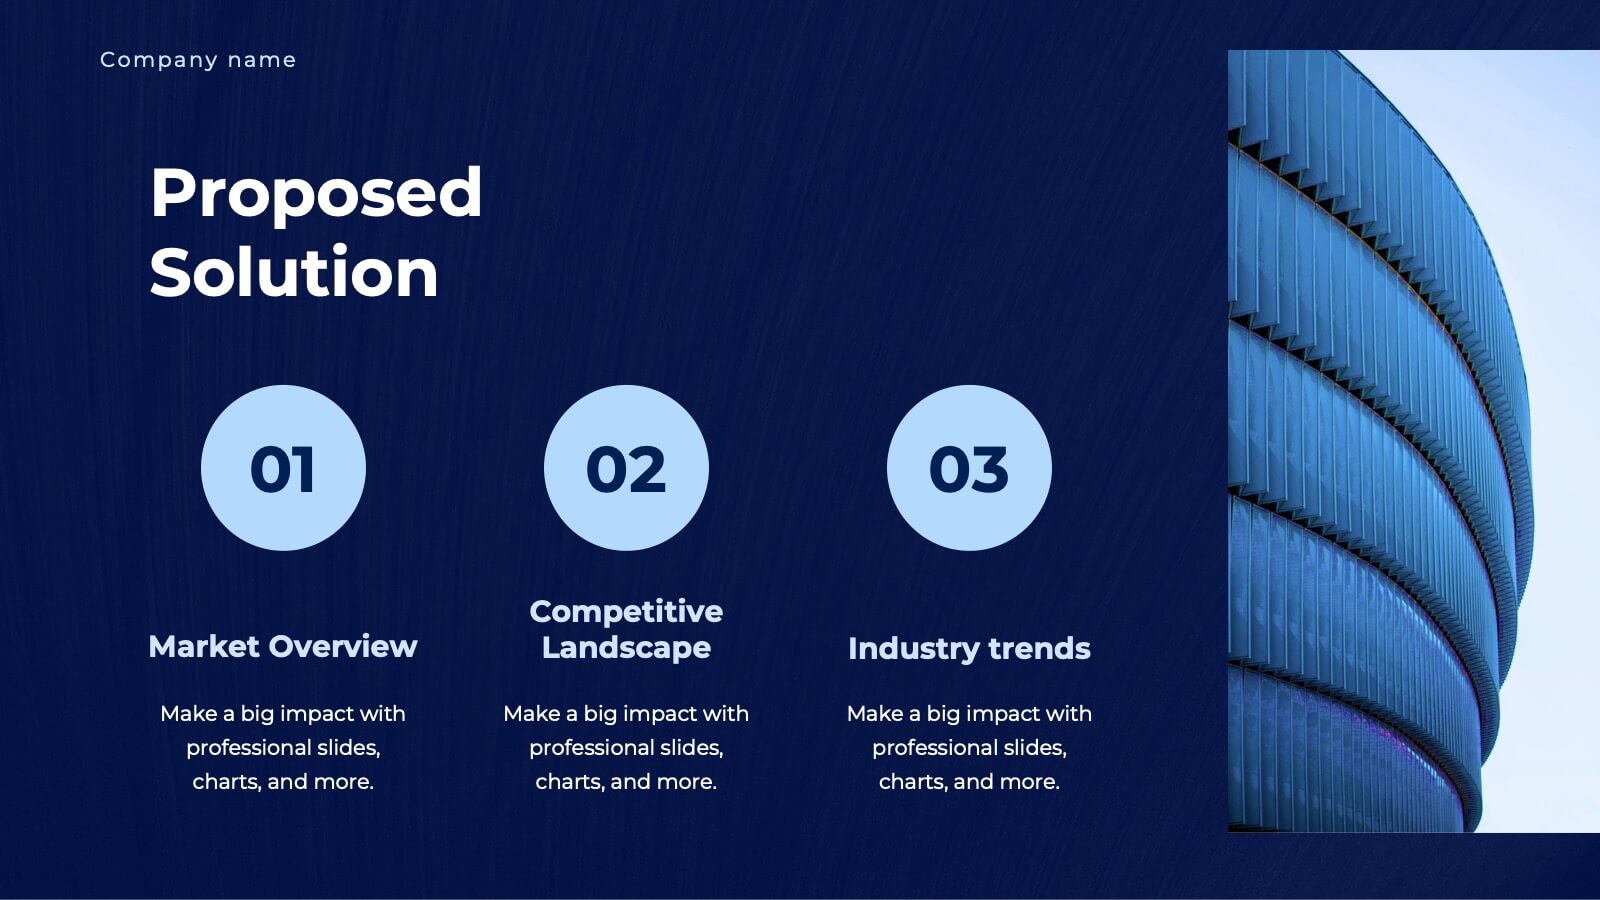
Five-Step Process Improvement Presentation
Streamline operations with the Five-Step Process Improvement presentation. This template visually maps out key phases of business optimization, using a structured timeline to highlight each step's purpose and impact. Perfect for project managers, consultants, and corporate strategists, this design helps teams track progress and refine workflows effectively. Fully editable and compatible with PowerPoint, Keynote, and Google Slides for effortless customization.


5 slides
Leadership Styles Overview Presentation
Explore what makes great leaders stand out with this engaging and visually balanced presentation design. Perfect for outlining different management approaches, personality-driven leadership models, or team dynamics, it helps audiences grasp key insights with clarity. Fully editable and compatible with PowerPoint, Keynote, and Google Slides for effortless customization.


6 slides
Empathy to Prototype Framework Presentation
Transform ideas into real-world solutions with a clear, step-by-step framework that connects creativity with action. This presentation helps you visualize each stage of innovation—from understanding users to testing prototypes—in a professional, engaging way. Fully compatible with PowerPoint, Keynote, and Google Slides for effortless customization and presentation.


7 slides
Brain Infographic Presentation Template
Brain infographics can be used to communicate your business ideas in a unique way. The images provide a visual explanation of the project breakdown and how every step is important for a successful project execution. This brain infographic template is the perfect visual to show off your critical thinking skills, with a clear focus on planning and execution. Use this infographics template to illustrate the planning of your project, its control and monitoring, as well as its targets and execution. This template is a fun way to shed light on how our brains react to visuals in content.


19 slides
Kinetic Sales Forecast Presentation
Forecast your sales with style using this vibrant template! Perfect for detailing company overview, sales process, team, and strategy. Includes sections for case studies, pricing, and future opportunities. Ideal for sales teams to impress stakeholders. Compatible with PowerPoint, Keynote, and Google Slides.


5 slides
Advances in Technology Infographics
Advances in Technology have transformed the world in a number of ways and have had a significant impact on society. These Infographic templates are dynamic and visually appealing tools for showcasing the latest advancements in technology across various fields. Whether you're discussing breakthroughs in electric cars, robotics, biotechnology, or any other cutting-edge technology, this template has you covered. With its modern and sleek design, this template captures the essence of technological innovation. It features a range of customizable design elements enabling you to present data-driven information in a visually engaging way.

20 slides
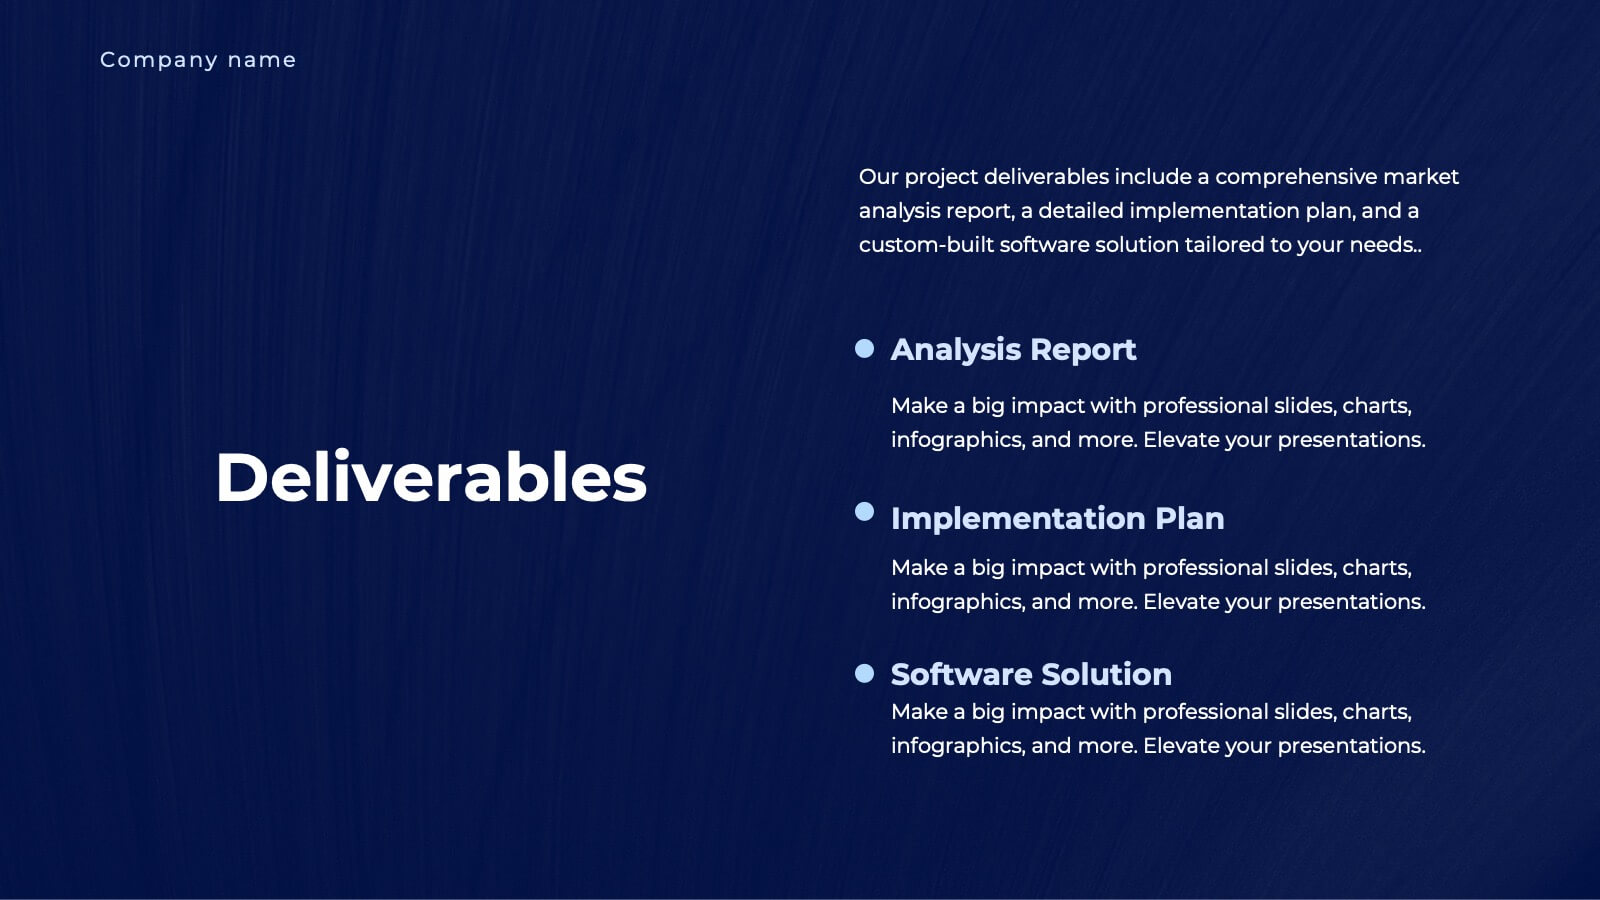
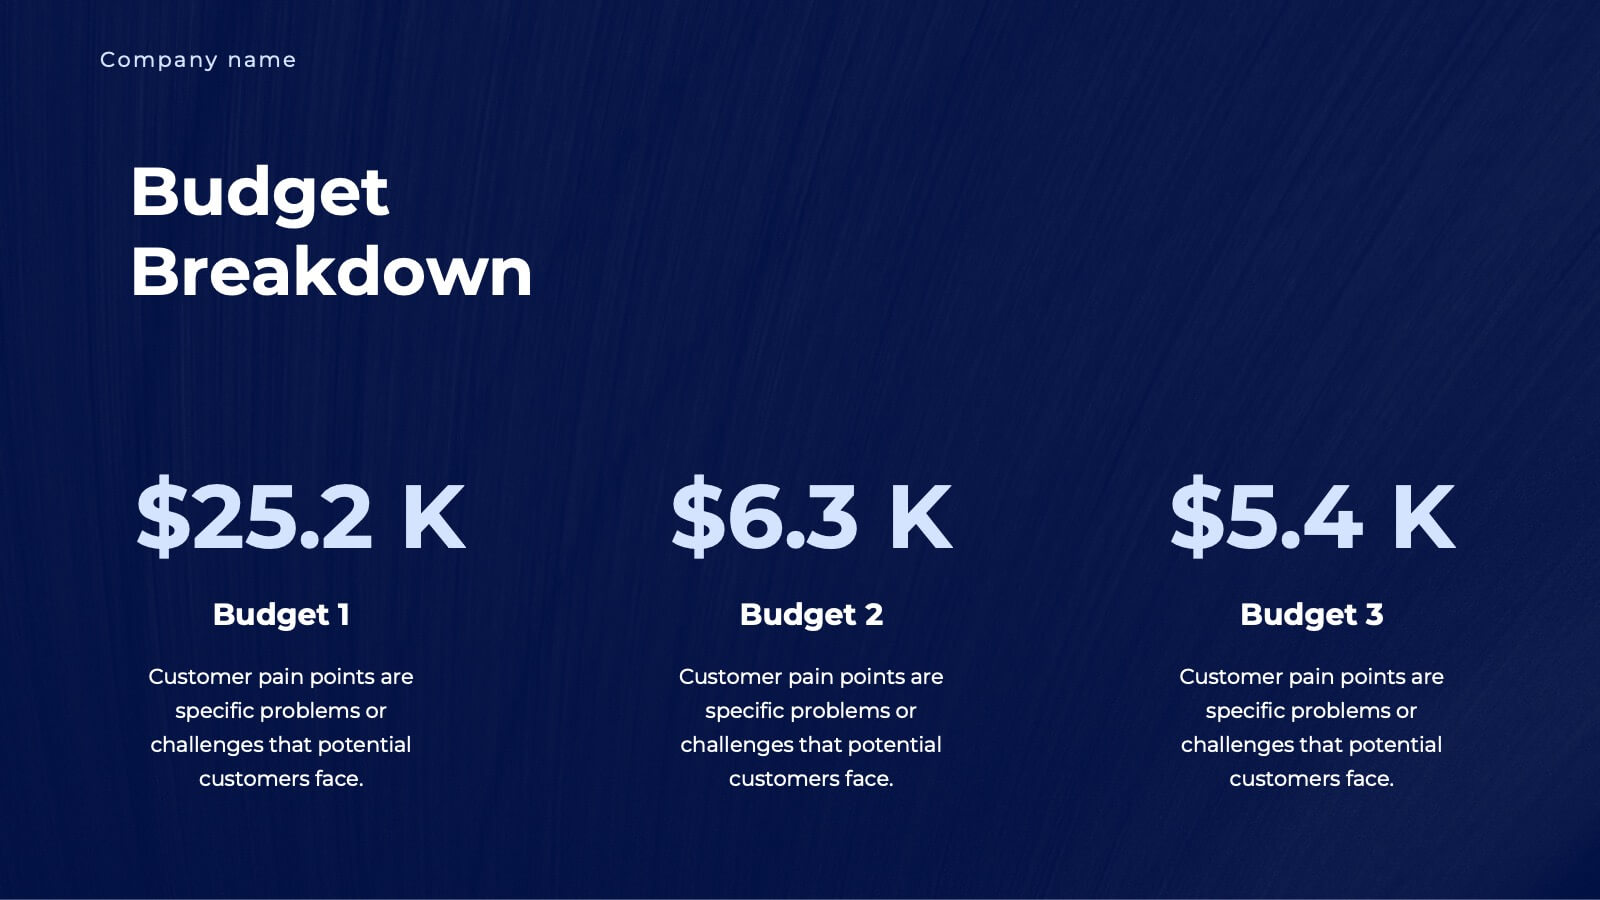
Unity Business Proposal Presentation
Take your business proposals to the next level with this elegant and comprehensive template! Perfect for presenting company overviews, project summaries, and detailed solutions. Ideal for business professionals looking to impress clients and stakeholders. Compatible with PowerPoint, Keynote, and Google Slides, this template ensures your proposals are impactful and professional.


21 slides
Sable Design Portfolio Presentation
Elevate your creative portfolio with the Sable Design Portfolio Presentation template! This stylish and professional template is perfect for showcasing your design projects, whether you’re a graphic designer, UI/UX expert, or creative professional. Start with a captivating introduction, and lead your audience through a journey of your design process, from concept development to final execution. Highlight your unique approach with dedicated slides for your color palette, typography choices, and moodboards. The template also includes sections for prototyping, feedback, and iterations, ensuring your design evolution is clearly communicated. The clean and modern layout not only keeps your presentation visually appealing but also makes your work the star of the show. Customizable and easy to use, this template is compatible with PowerPoint, Keynote, and Google Slides, allowing you to impress your clients, employers, or peers with a polished and cohesive presentation of your best work.


22 slides
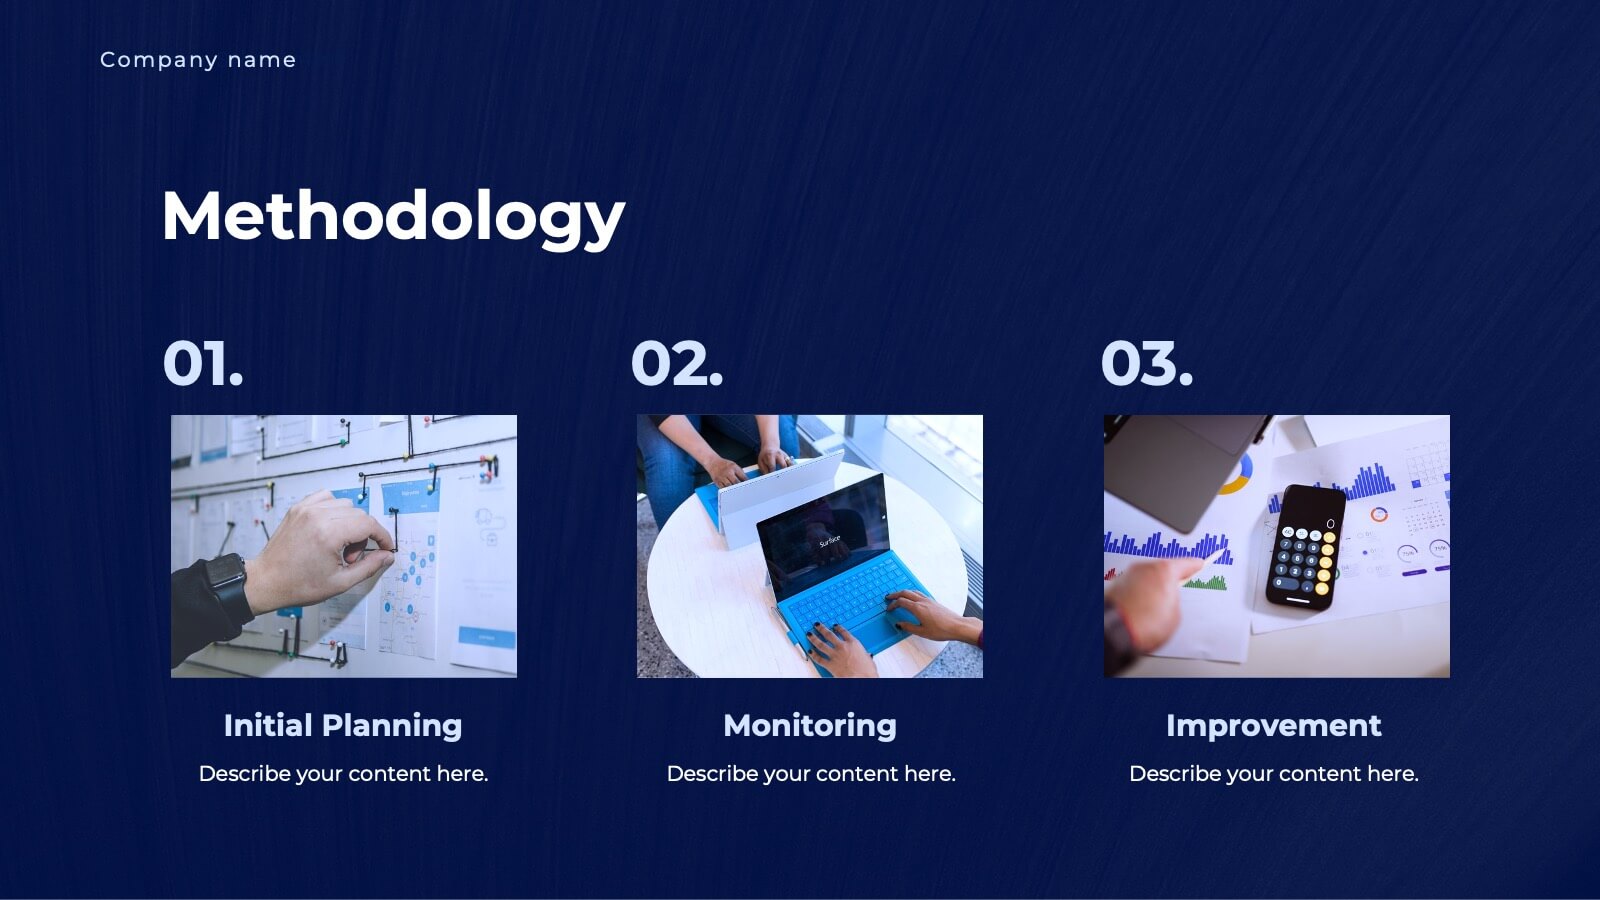
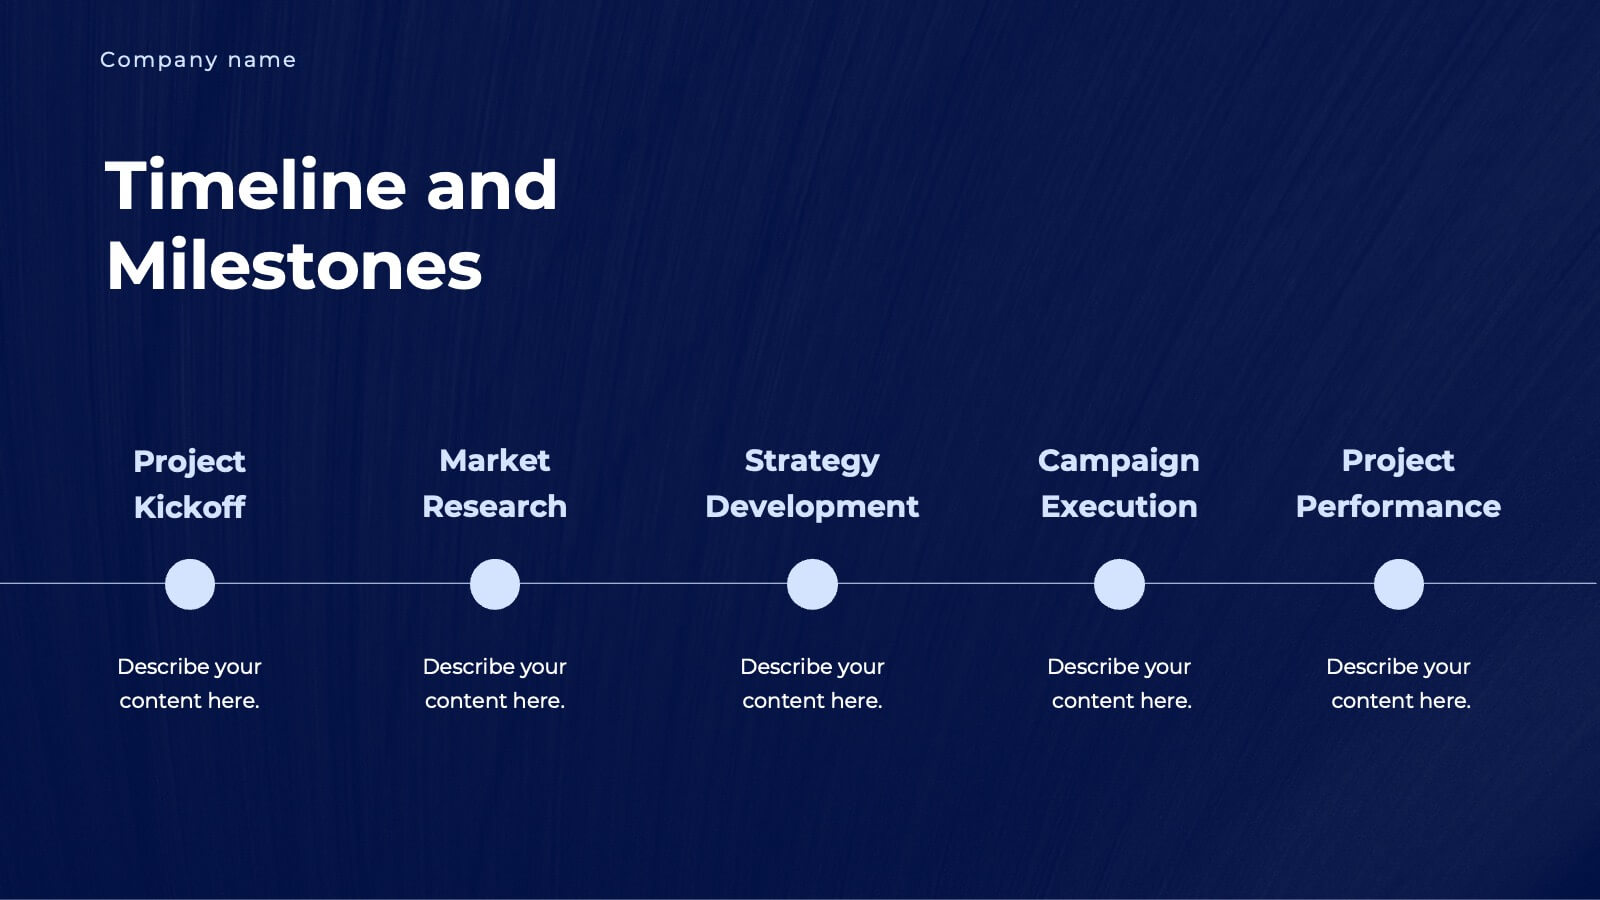
Starlit Agency Portfolio Presentation
The Starlit Agency Portfolio template is a sophisticated way to highlight your agency's expertise, achievements, and creative vision! Perfect for presenting to potential clients or partners, this template starts with a polished introduction and an "About Us" section that clearly defines your agency's mission and vision. Showcase your team's skills and services in an organized manner, making it easy for clients to understand what you offer. With slides dedicated to client success stories, case studies, and market analysis, you can build trust by displaying your proven track record. Highlight industry trends and your agency's approach to creative processes to demonstrate your strategic thinking. The template also includes sections for strategy development, campaign execution, and measurement analytics, ensuring you cover all aspects of your services. Close with client testimonials, partnership opportunities, and a future outlook, leaving your audience impressed. This template is fully compatible with PowerPoint, Keynote, and Google Slides, making it versatile and easy to use for any presentation.


4 slides
Data Visualization Pie Chart
Make your insights pop with this engaging Pie Chart slide. Perfect for reporting KPIs or comparing segmented data, the radial design blends clear visuals with editable text sections. Ideal for marketing, analytics, or strategy meetings. Fully customizable in PowerPoint, Keynote, and Google Slides.


6 slides
Constructive Review and Feedback Loop
Illustrate continuous improvement with the Constructive Review and Feedback Loop Presentation. This dynamic slide showcases a circular double-loop format, perfect for highlighting stages in review cycles, team input, and process refinement. Fully editable in PowerPoint, Keynote, and Google Slides for seamless integration into your workflow.


5 slides
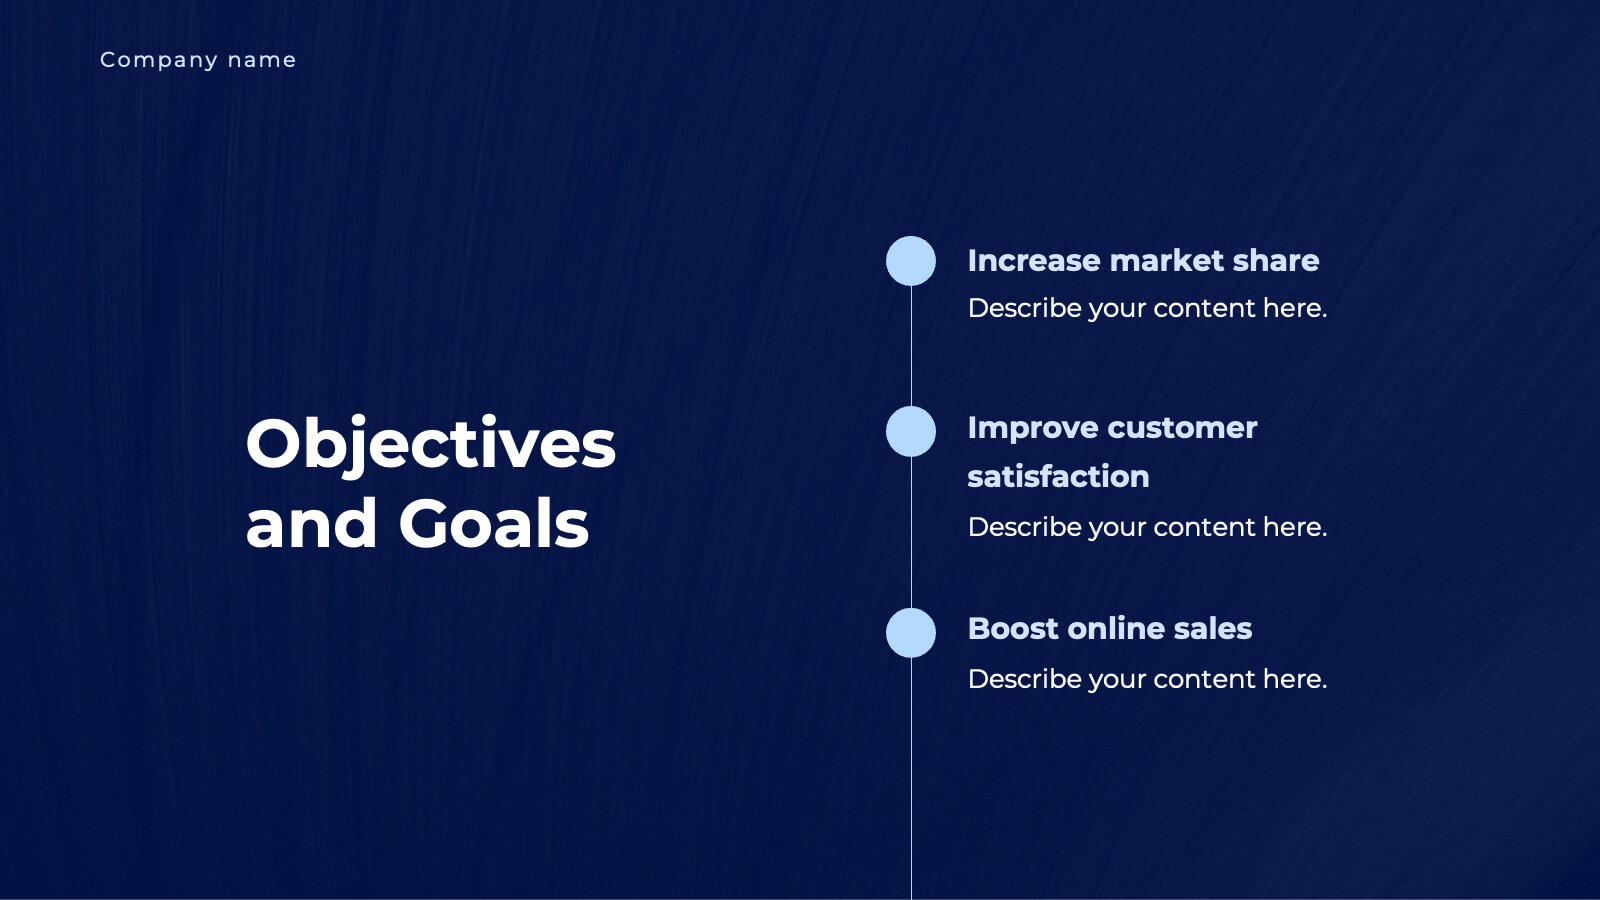
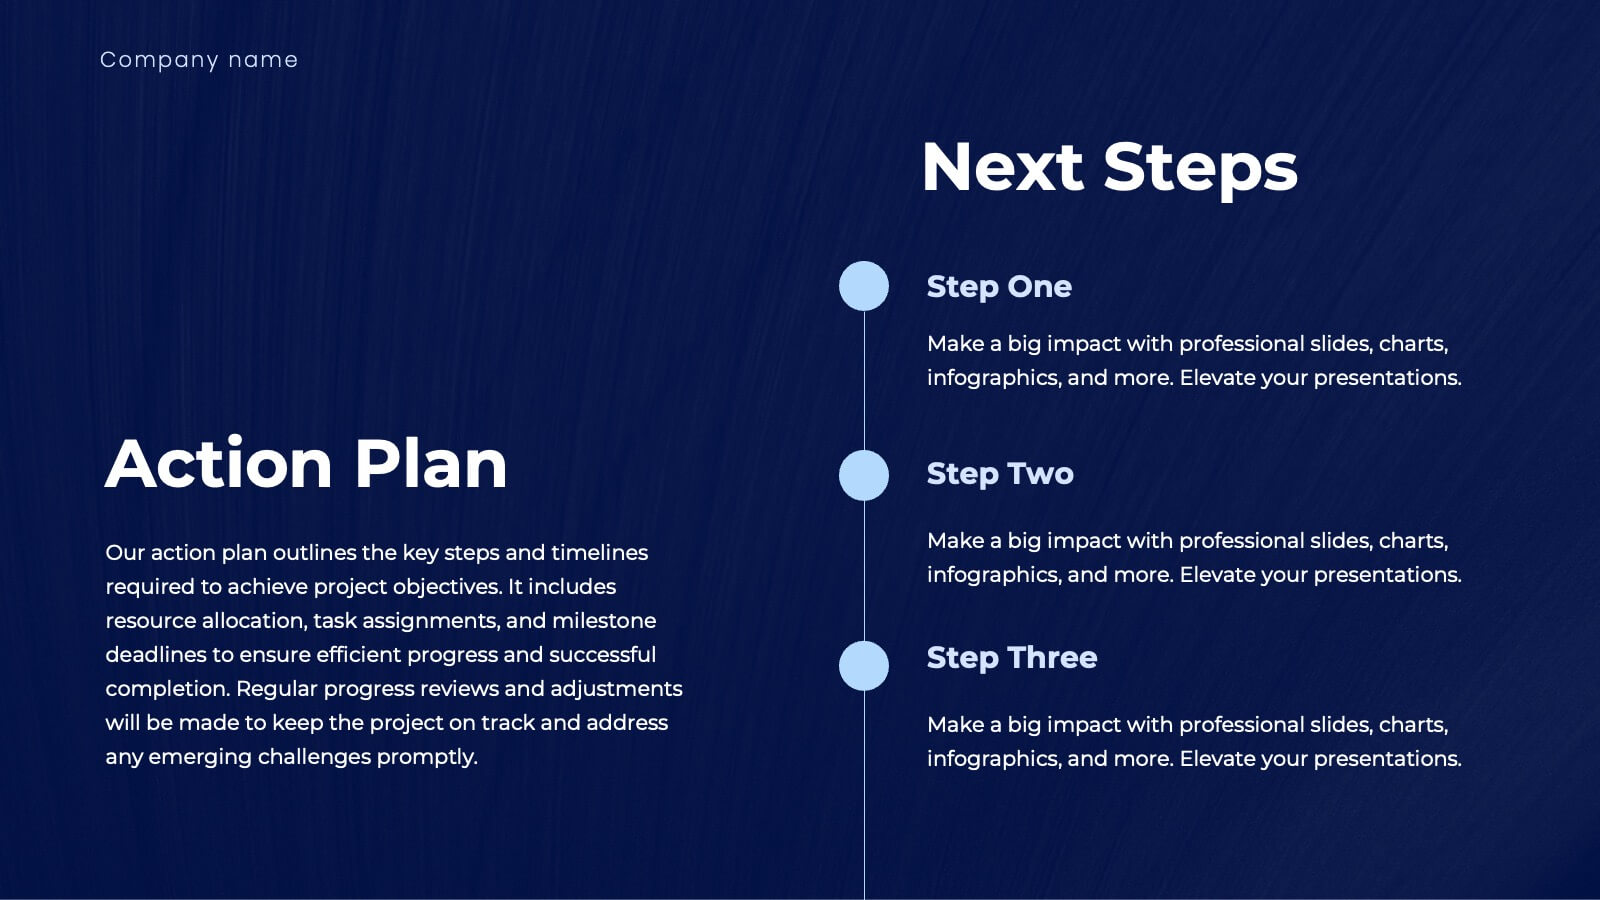
Strategic Objectives and Goals Presentation
Bring your strategy to life with a clear, forward-moving layout that makes every milestone feel achievable. This presentation guides audiences through key objectives, breakthrough goals, and measurable progress, helping teams stay aligned and inspired. Fully editable and easy to adapt, it works seamlessly with PowerPoint, Keynote, and Google Slides.


6 slides
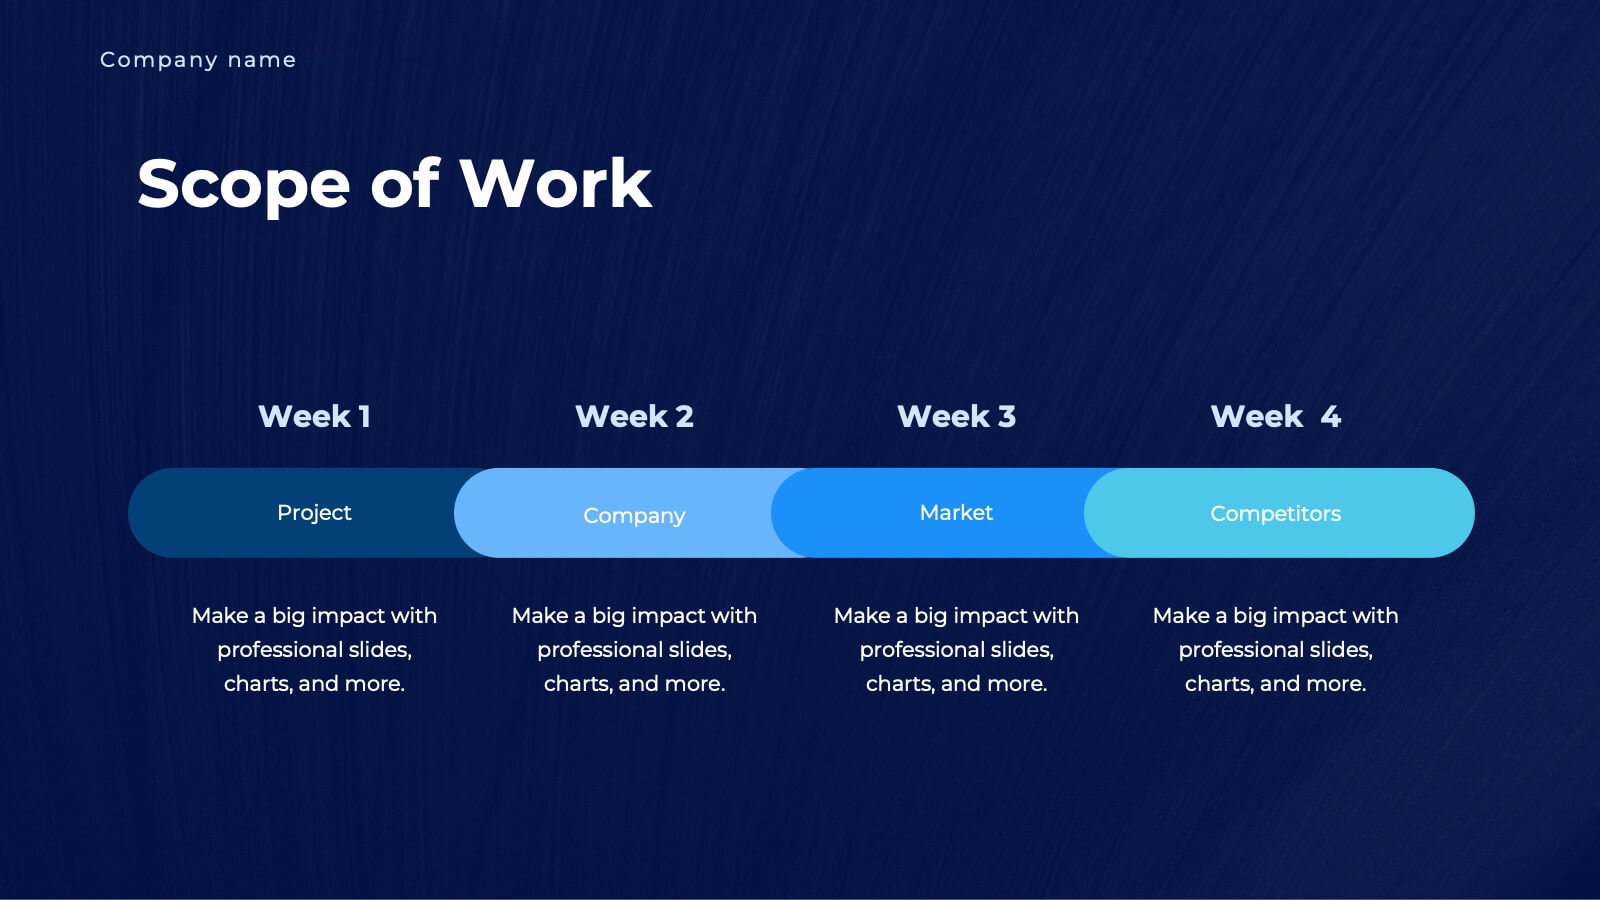
Scope Planning Template for Project Teams Presentation
Turn teamwork into strategy with a clear, circular layout that maps every phase of your project plan. This modern presentation helps teams define objectives, assign roles, and visualize scope effortlessly. Easy to edit and fully compatible with PowerPoint, Keynote, and Google Slides for seamless collaboration and customization.


5 slides
Hydrological Cycle Explained Presentation
Break down complex water systems with ease using the Hydrological Cycle Explained Presentation. This clean and modern slide illustrates each phase of the cycle—from precipitation to collection—with intuitive icons and a pipeline layout. Ideal for educational, environmental, or sustainability content. Fully editable in Canva, PowerPoint, Keynote, and Google Slides.


4 slides
Professional Business Company Profile Presentation
Present your business with confidence using the Professional Business Company Profile Presentation. Featuring clean design, geometric elements, and photo placeholders, this template is ideal for showcasing your company’s identity, values, and services. Fully customizable in PowerPoint, Google Slides, and Canva for seamless branding and presentation updates.


20 slides
Egeria Artist Portfolio Presentation
Showcase your artistry with this vibrant portfolio template, featuring sections for project displays, creative process, awards, and testimonials. Perfect for artists seeking a polished presentation of their work. Customizable and suitable for PowerPoint, Keynote, and Google Slides, this template highlights your unique style and professional journey.


5 slides
SWOT Analysis Infographics
SWOT analysis is a strategic planning tool used to assess the strengths, weaknesses, opportunities, and threats of an individual, organization, or project. These infographics are powerful visual tools that allow you to present comprehensive SWOT analysis in a clear and impactful way. Whether preparing a business presentation, strategic planning session, or educational material, this template provides a visually engaging format to showcase the key aspects of a SWOT analysis. The customizable features of the template allow you to tailor it to your specific industry ensuring that your SWOT analysis is presented in a concise, and impactful manner.