


Features
- 6 Unique slides
- Fully editable and easy to edit in Microsoft Powerpoint, Keynote and Google Slides
- 16:9 widescreen layout
- Clean and professional designs
- Export to JPG, PDF or send by email


Do you have any questions?
Recommend


22 slides
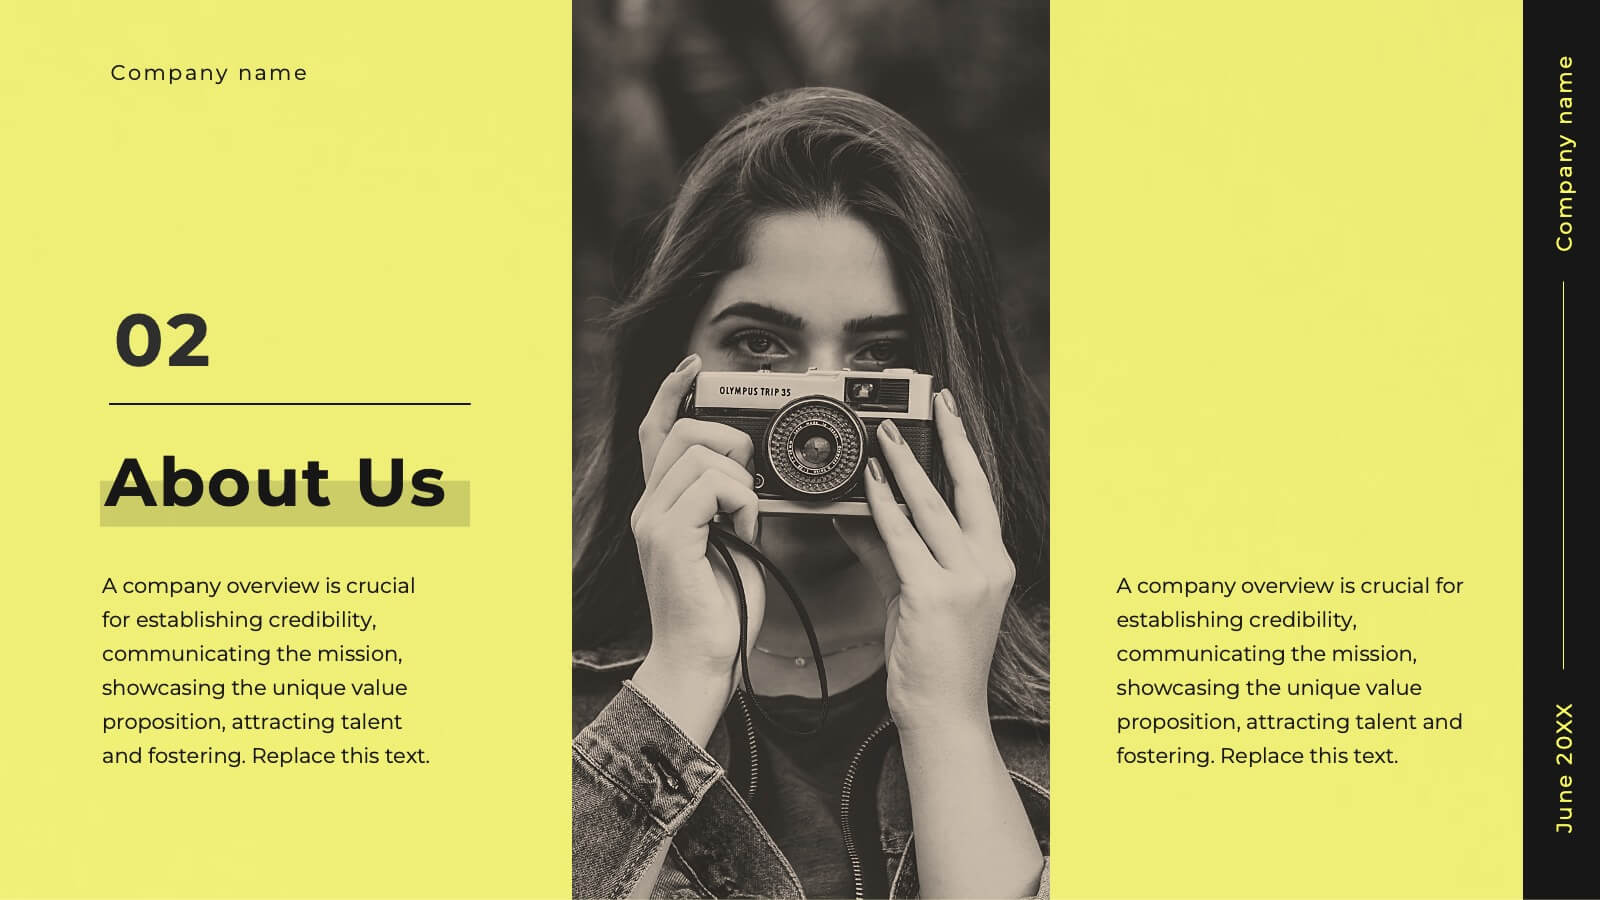
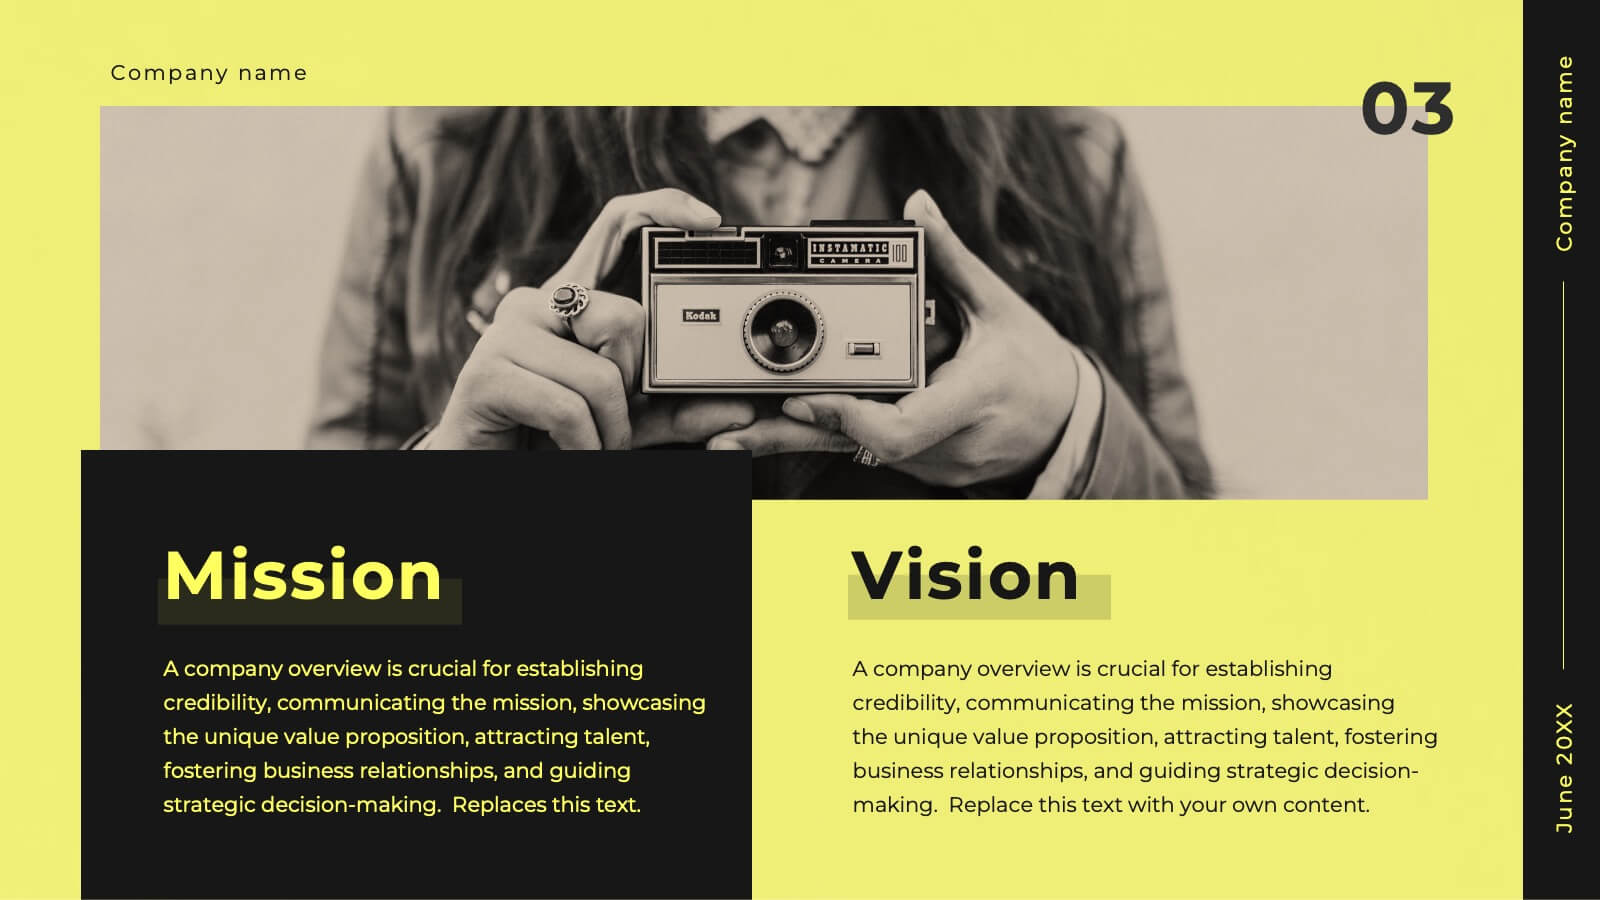
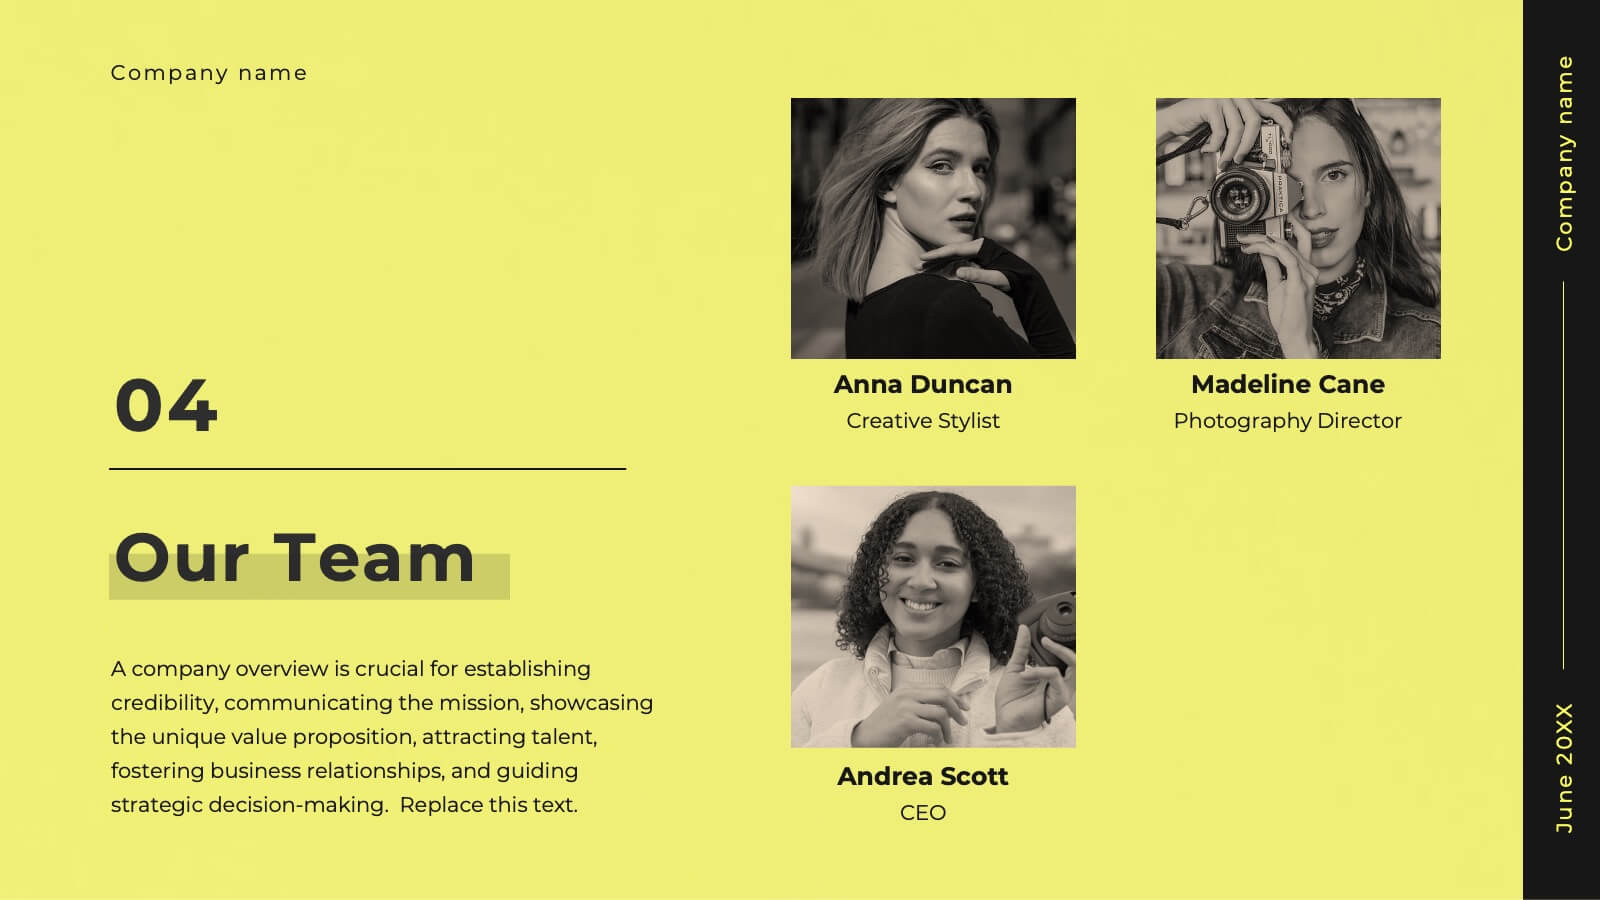
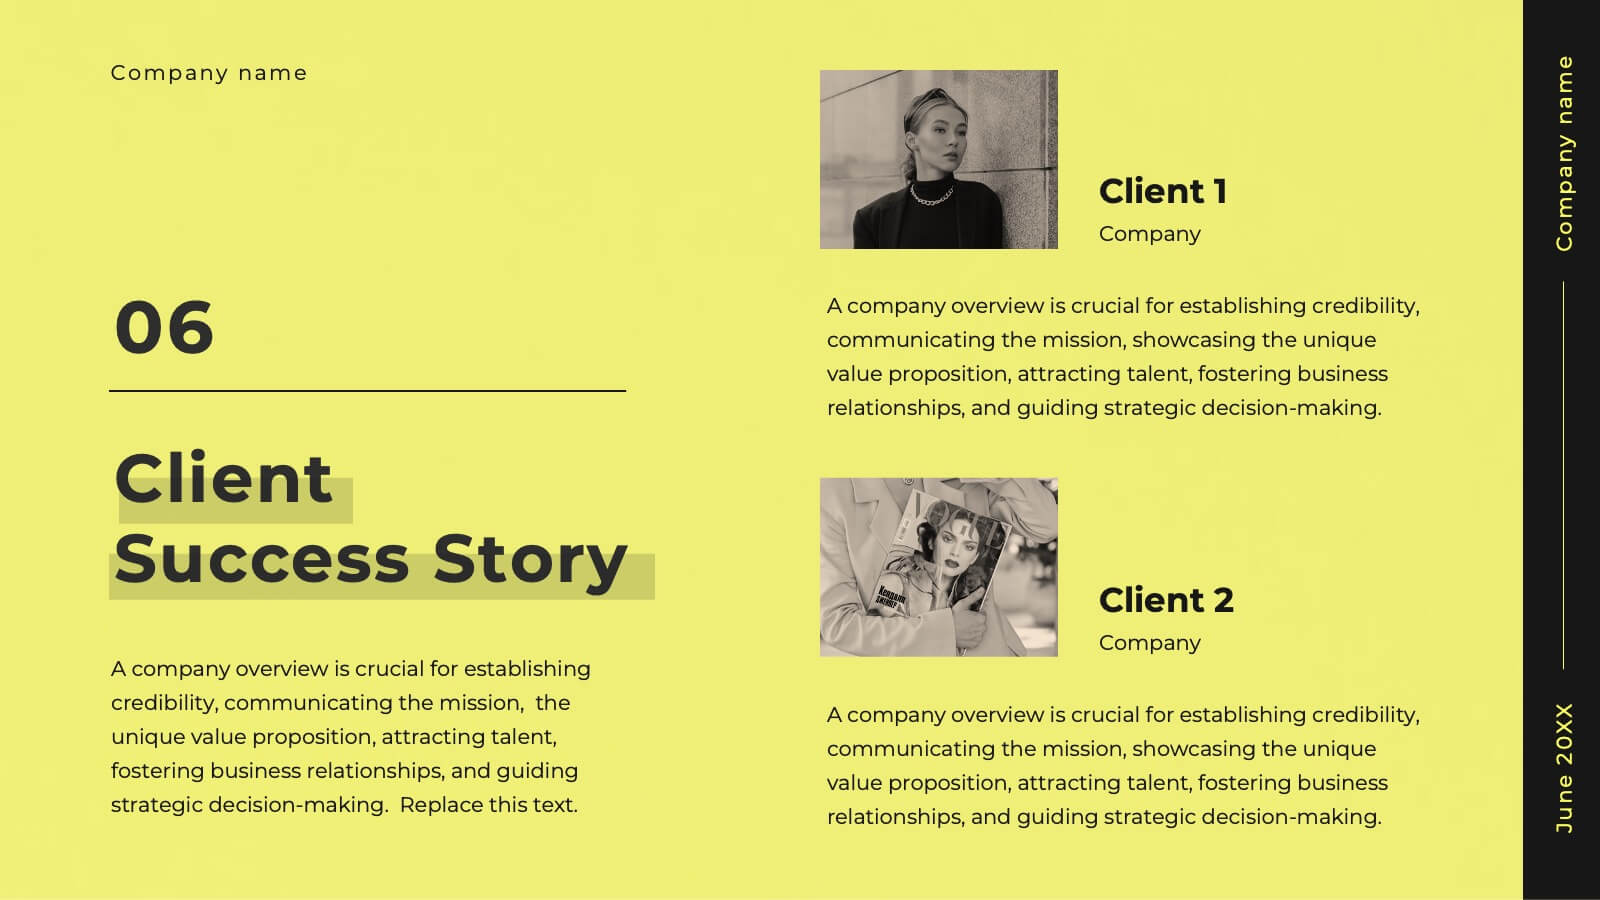
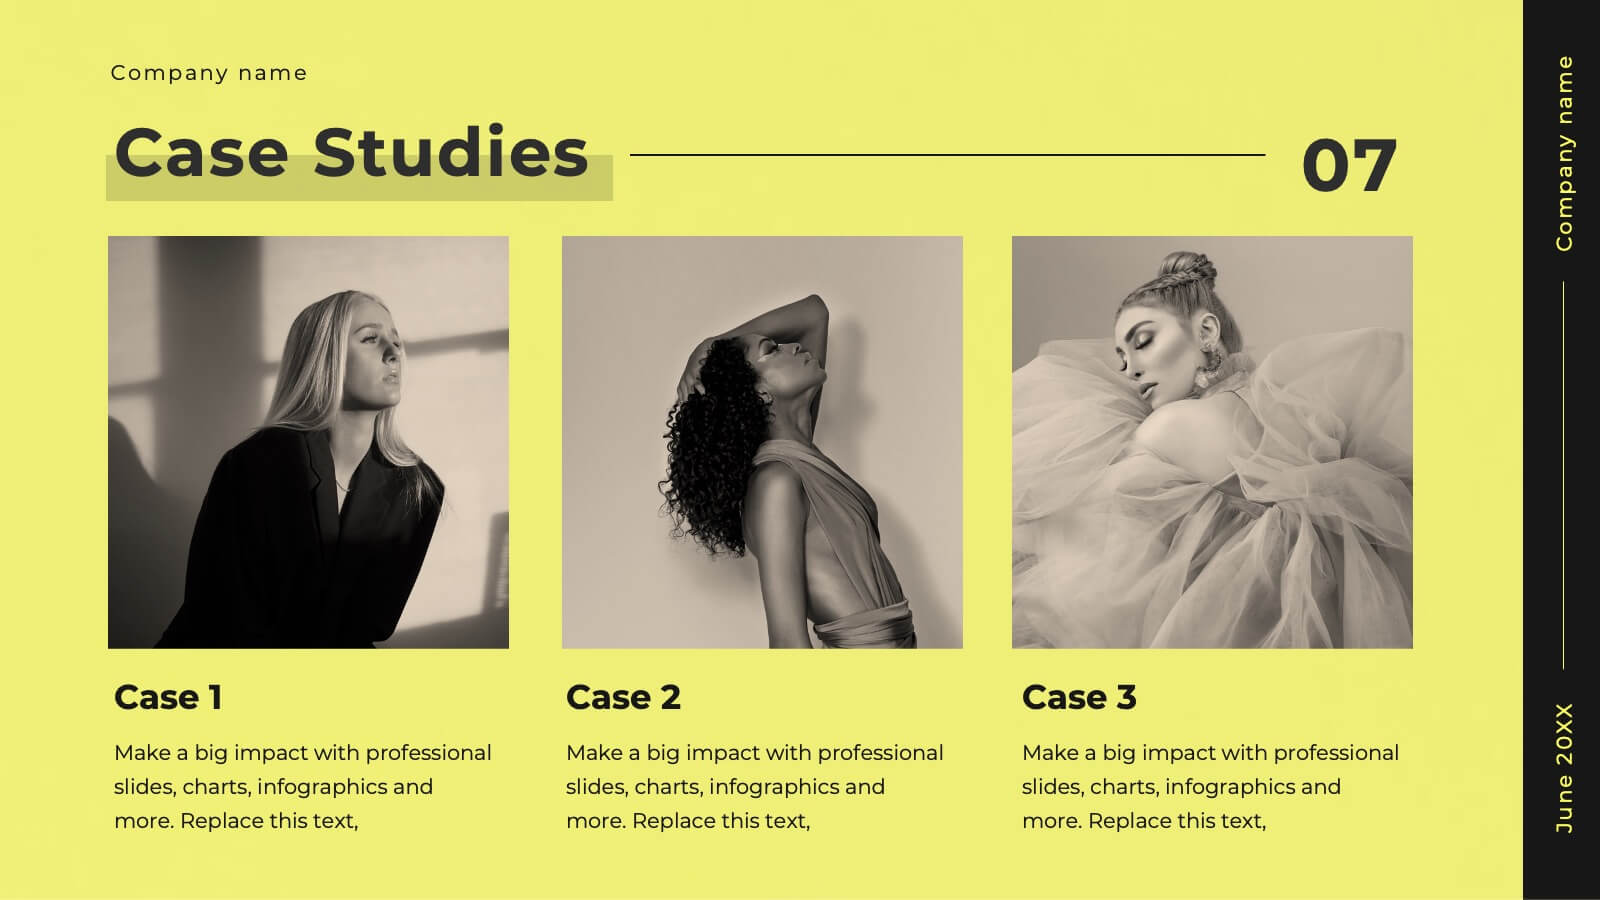
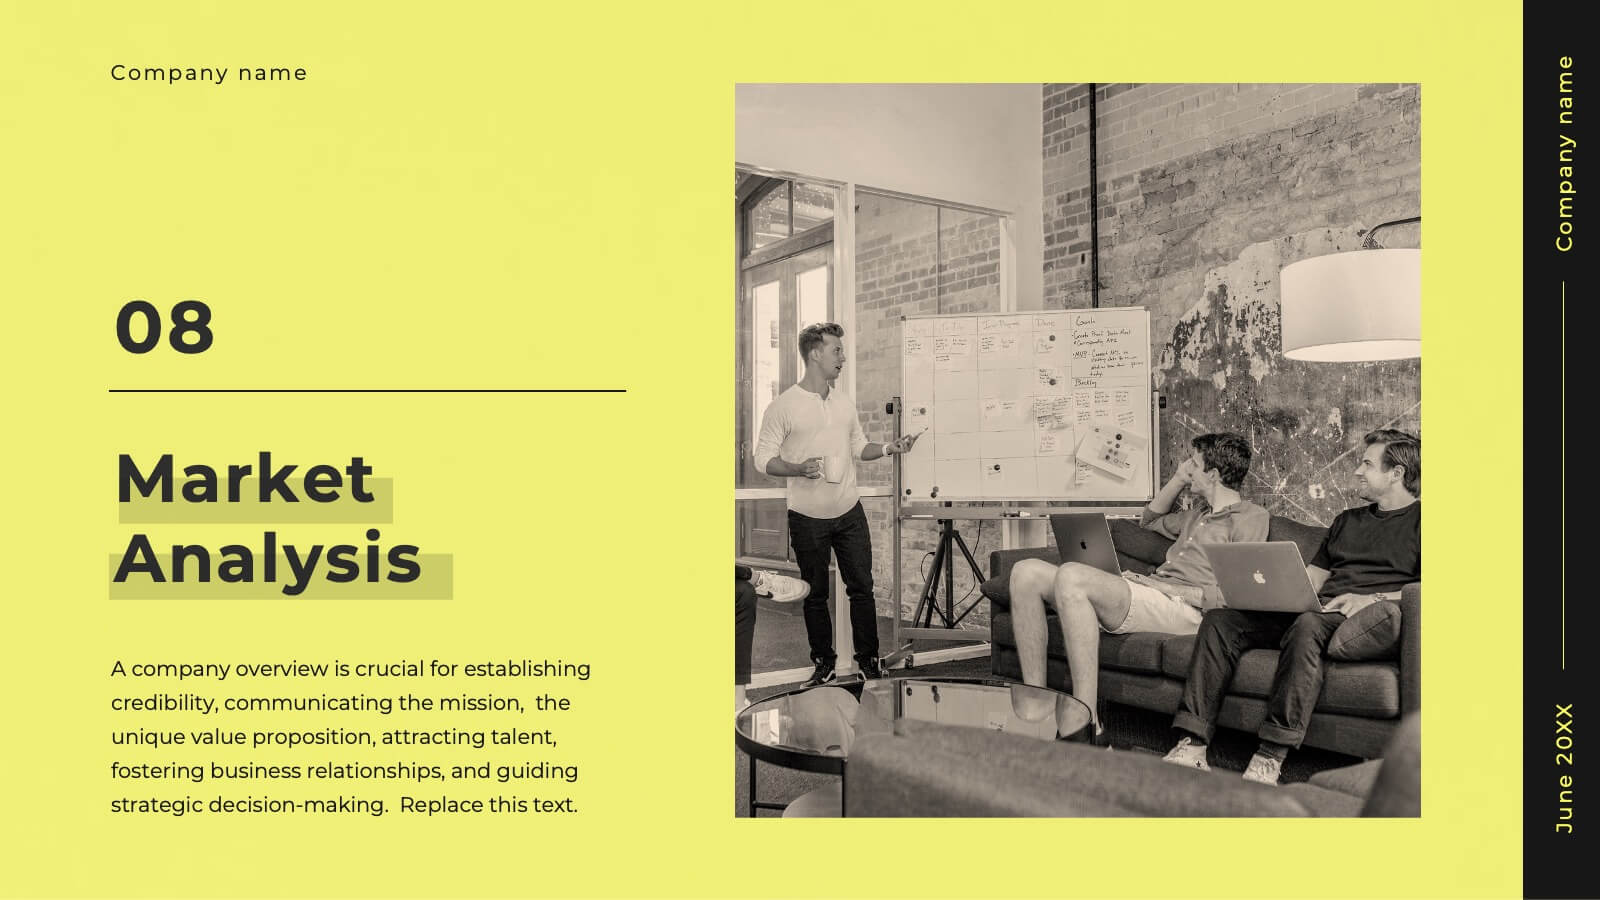
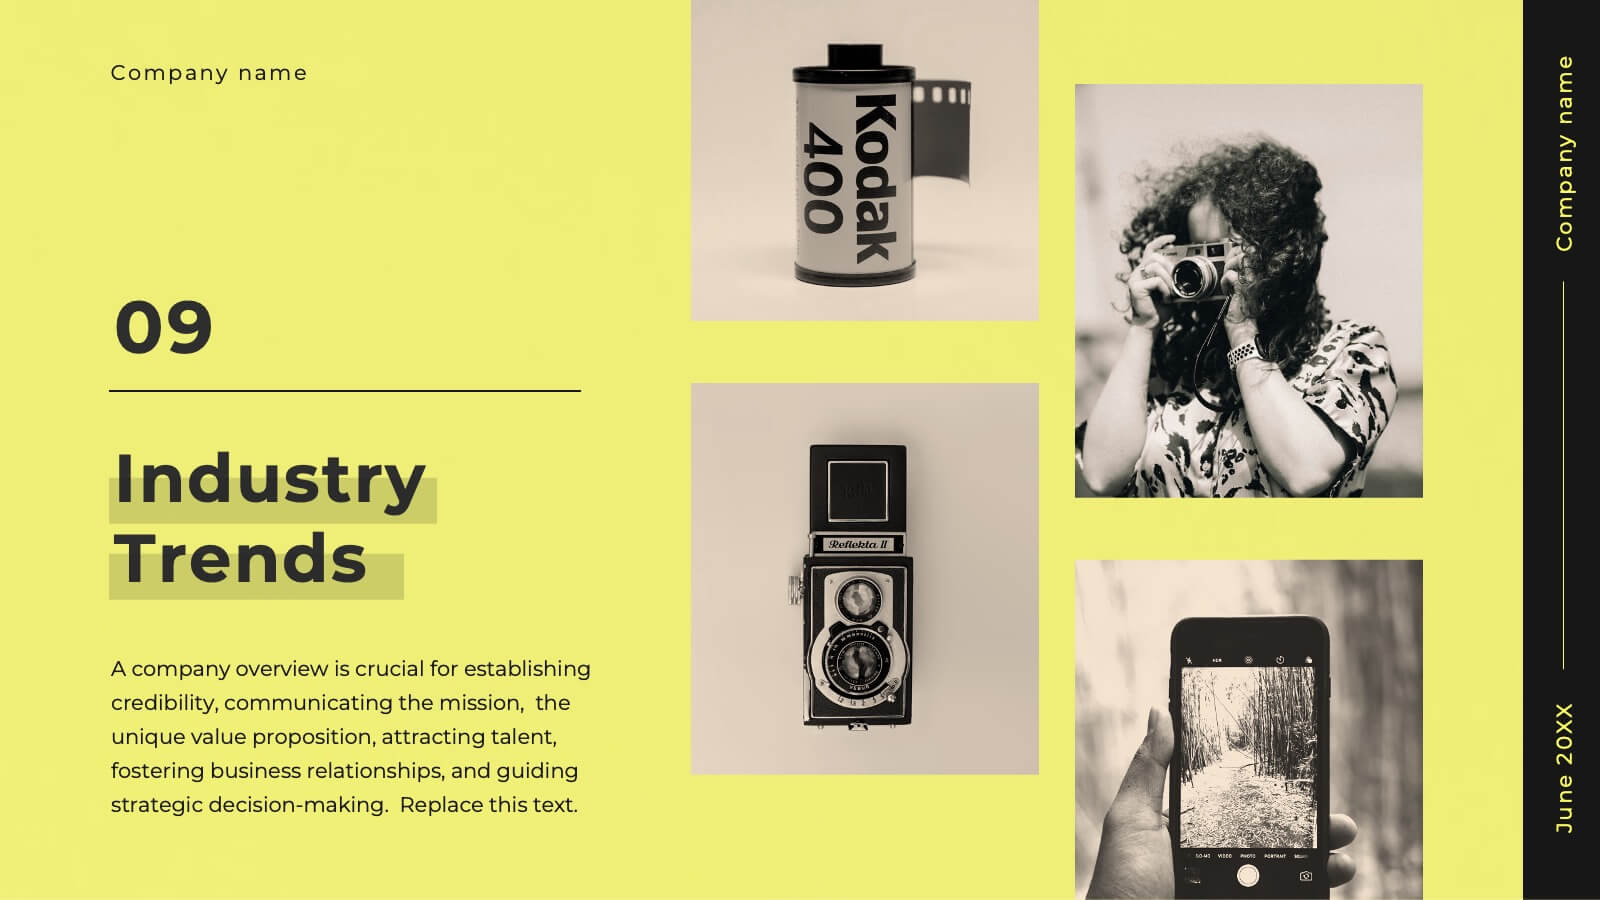
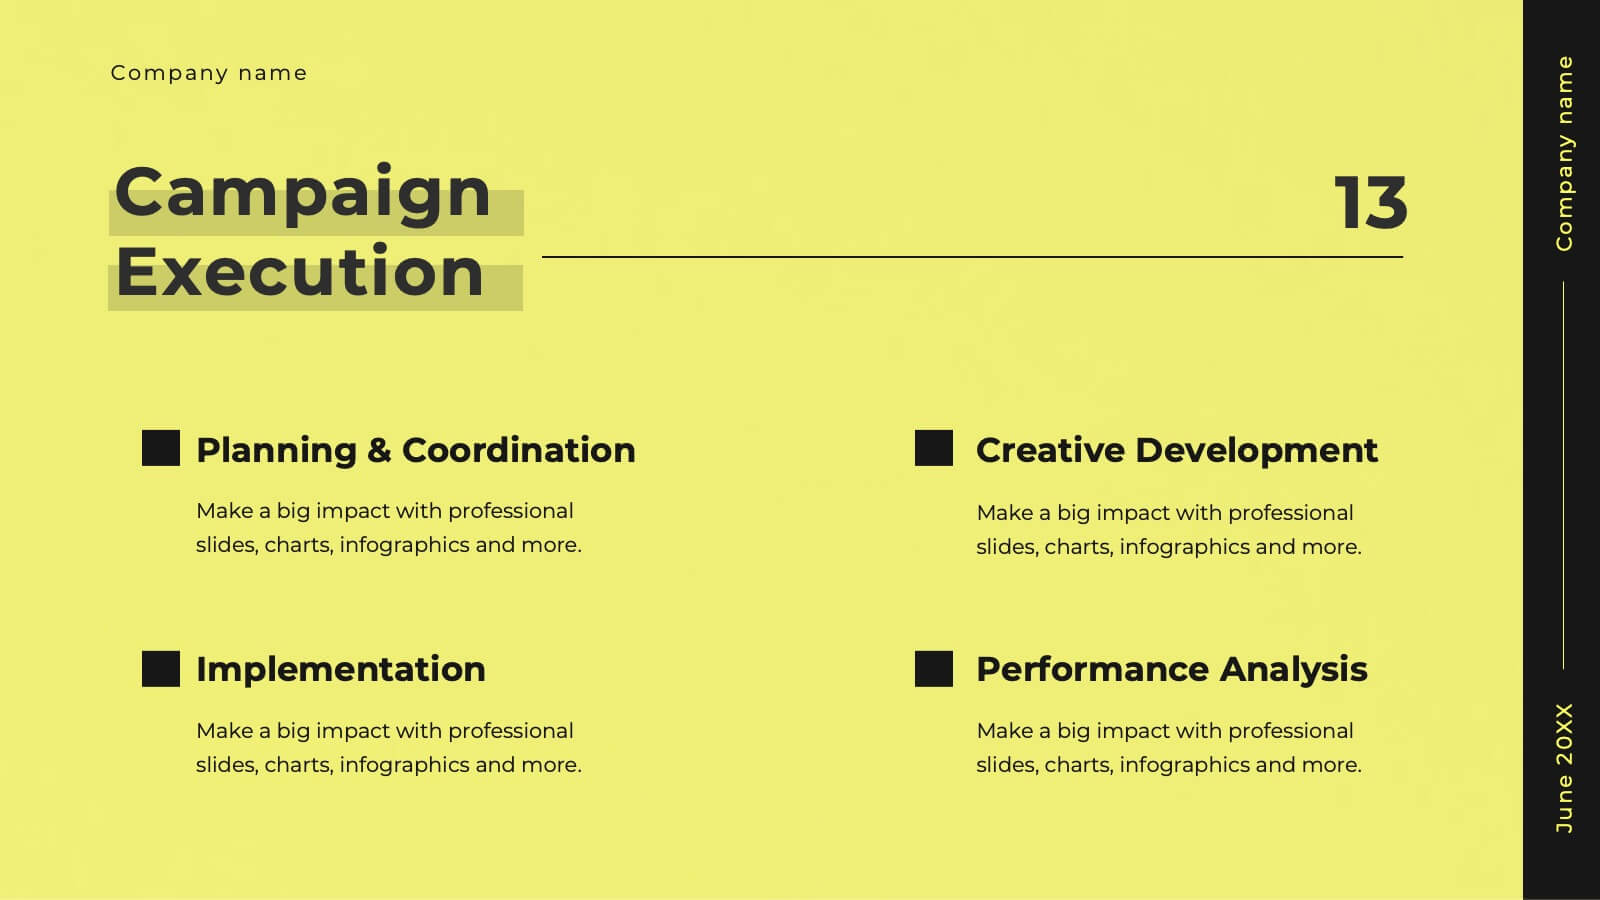
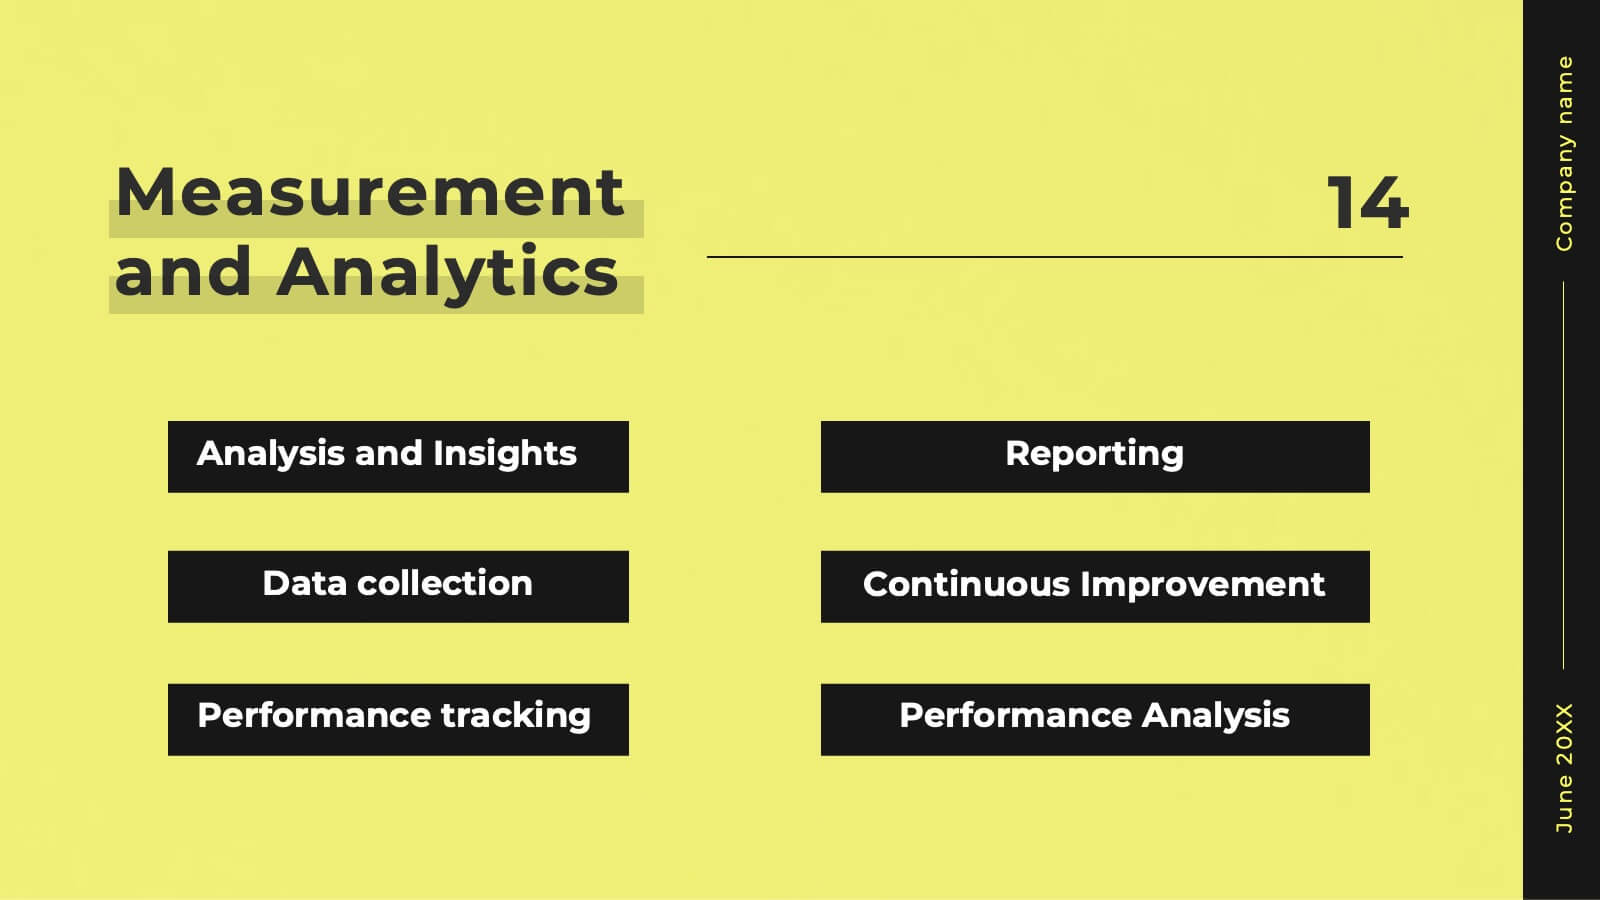
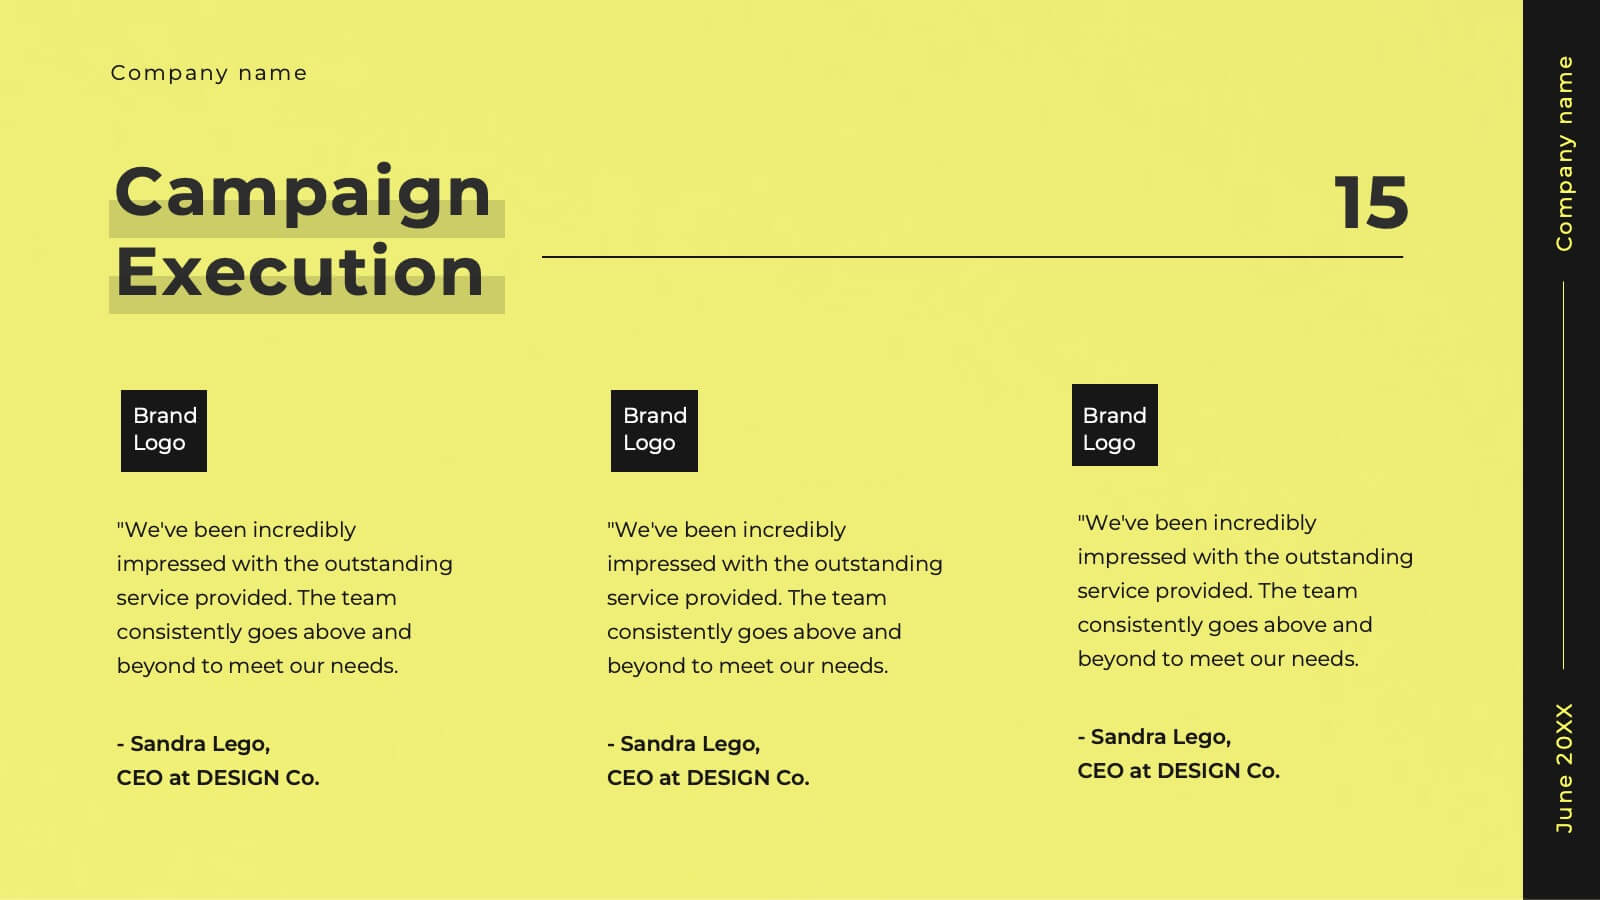
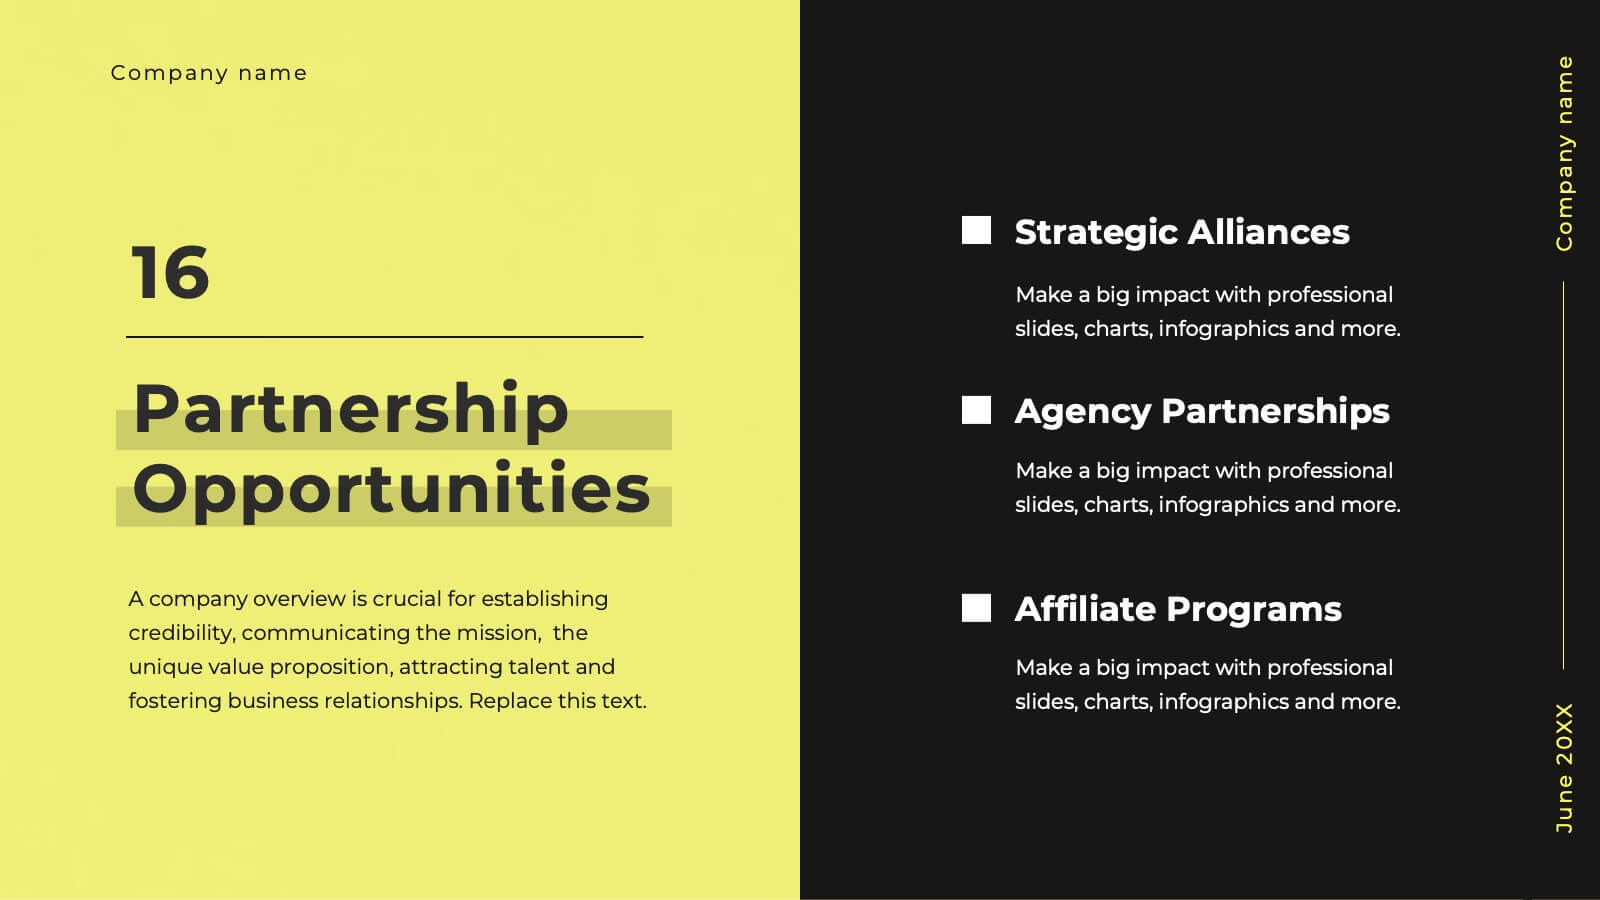
Glimmer Creative Agency Pitch Deck Presentation
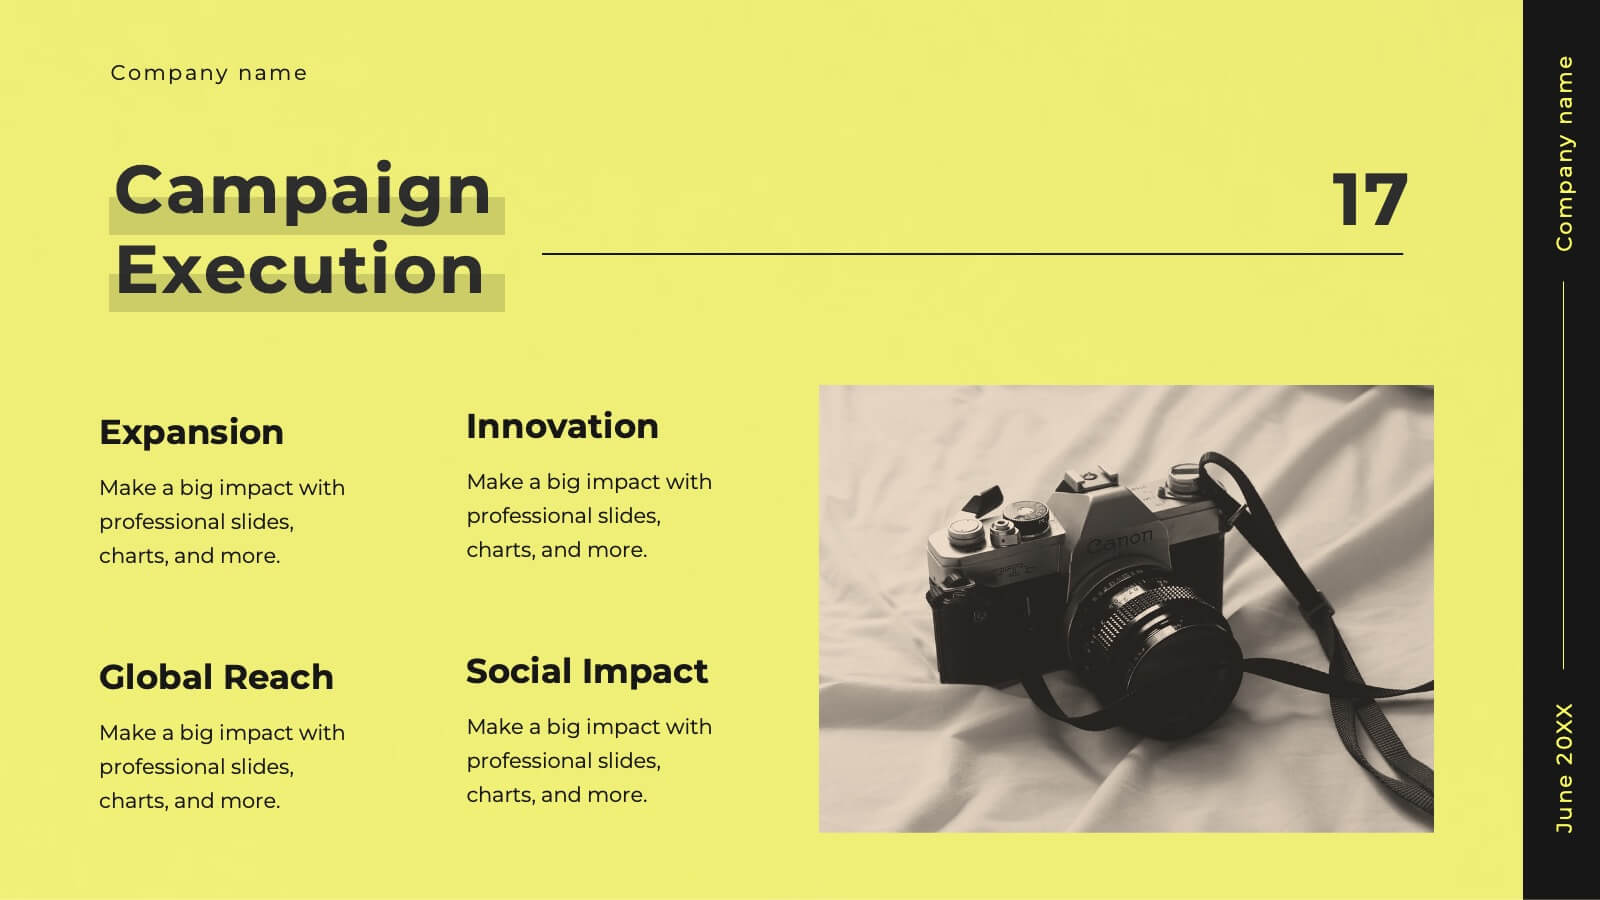
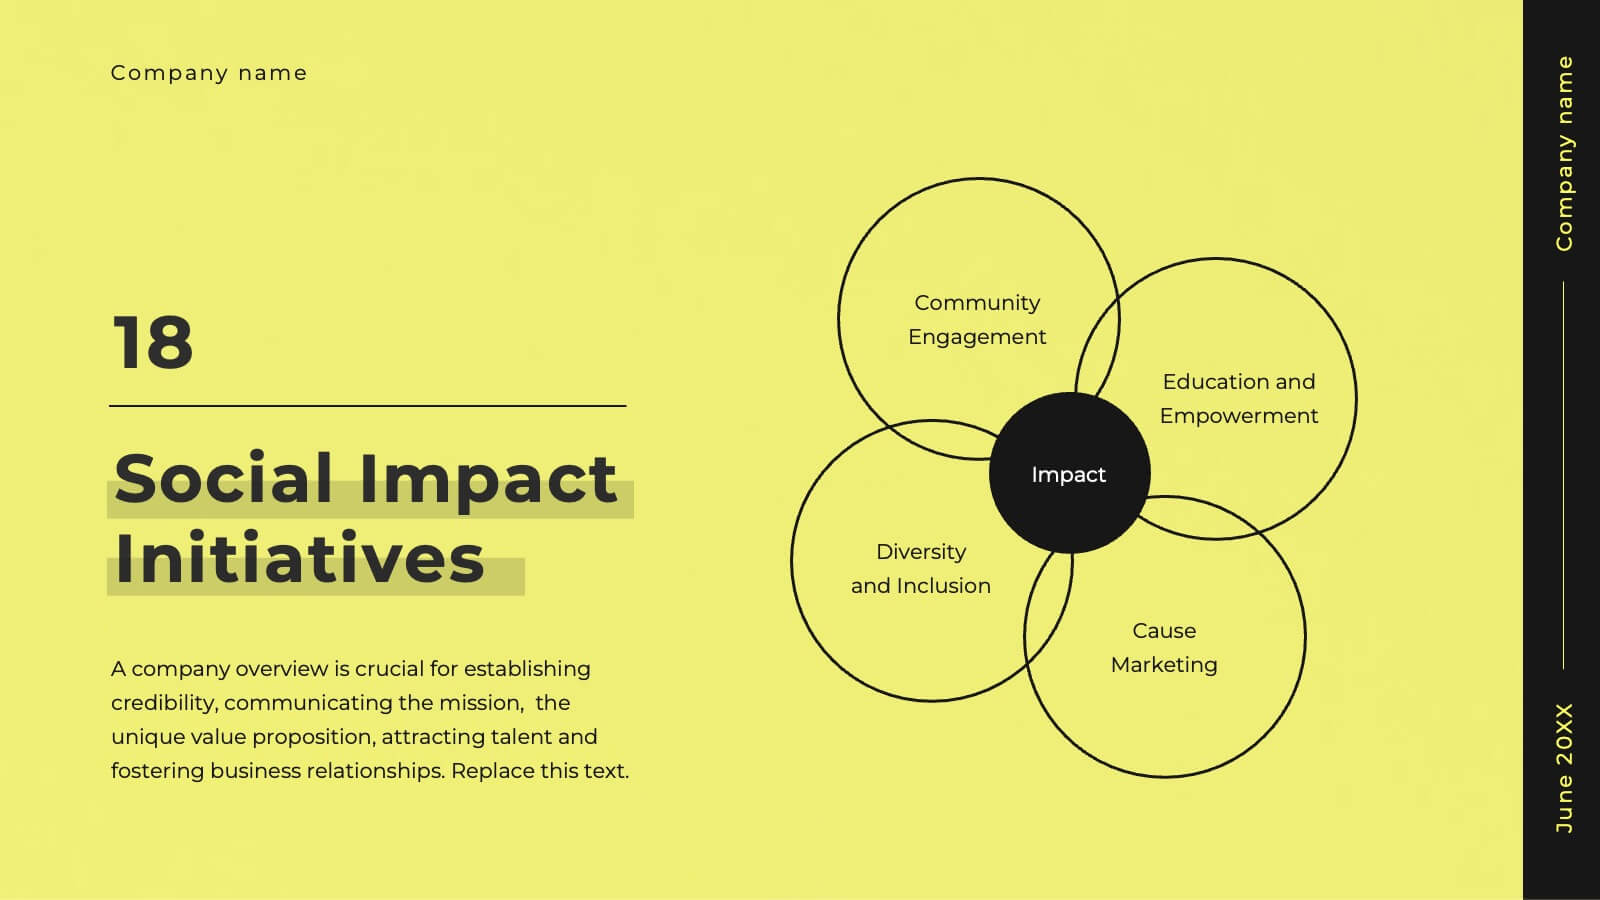
Step up your game with this vibrant agency pitch deck template! Ideal for showcasing your services, client success stories, and strategic approach, it includes dynamic slides for market analysis and campaign execution. Engage potential clients with compelling visuals and well-organized content. Compatible with PowerPoint, Keynote, and Google Slides for a smooth presentation experience on any platform.


7 slides
Iceberg Model Infographic Presentation
Iceberg diagrams are versatile, multi-purpose infographics that can be used to show all the factors that will affect your company. It is a great way to visualize information and organize it into one place. With this template, you’ll have the perfect way to analyze your vision and drive growth. The iceberg is used to divide and give detailed information that can be valuable in planning your strategy. Analyze, evaluate and provide data on a specific product or service. This eye-catching template is compatible with PowerPoint, Keynote and Google Slides and includes customizable photo layouts.


7 slides
Healthcare Strategy Plan Presentation
Bring your strategy to life with a clean, modern slide that turns complex healthcare planning into a clear, visual roadmap. This presentation outlines key initiatives, supports data-driven decision-making, and keeps stakeholders aligned with an easy-to-follow layout. Fully compatible with PowerPoint, Keynote, and Google Slides for seamless professional use across any workflow.


5 slides
Beer Drinking Infographics
The art of beer encompasses the brewing process, the craftsmanship of creating unique flavors and styles, and the enjoyment of this ancient beverage. These infographics are perfect for showcasing key facts, statistics, and interesting information related to the world of beer. This template is ideal for breweries, beer enthusiasts, bartenders, or anyone interested in sharing knowledge about different beer types, brewing processes, or beer culture. The template offers a variety of slide layouts to cover different aspects of beer drinking. The template provides sections for discussing different beer styles, brewing processes, and beer tasting.


5 slides
SaaS Pricing Model
Present your pricing plans with confidence using this clear and structured SaaS pricing model template. Perfect for showcasing tiered options like Free, Basic, Medium, and Premium, this design makes feature comparisons easy for your audience to grasp. Fully compatible with PowerPoint, Keynote, and Google Slides for effortless editing and presentation.


5 slides
Cyber Security Risk Management Presentation
Effectively visualize your digital defense strategy with this cyber security-themed presentation layout. Featuring a sleek laptop illustration and circular infographic design, this template helps you outline five critical areas of risk management with matching icons and editable text sections. Ideal for IT teams, consultants, or training sessions. Fully customizable and compatible with PowerPoint, Keynote, and Google Slides.


5 slides
Team Collaboration Goals Presentation
Bring your teamwork vision to life with a clean, engaging layout that makes every goal feel clear and achievable. This presentation helps you outline priorities, align roles, and highlight shared milestones in a visually balanced format. Perfect for project kickoffs or planning sessions. Fully compatible with PowerPoint, Keynote, and Google Slides.


7 slides
Veterinary Clinic Infographic Presentation
Veterinarians play a vital role in the health and wellbeing of animals, serving as their trusted doctors. Our comprehensive veterinary clinic infographic template features a diverse array of appealing illustrations that are completely customizable to meet your specific needs. Whether you are a student or a seasoned vet, we've got the perfect infographics for you to showcase all your crucial details in style! Our amazing template is the ultimate solution to help you present your services with crystal-clear clarity. You can create a visually appealing representation of all the awesome offerings at your clinic, including virtual appointments for your furry pals. So, what are you waiting for? Let's make your information shine like never before!


6 slides
Top Benefits Breakdown Presentation
Showcase your strongest advantages with a clean, structured layout that highlights each benefit clearly and effectively. This modern design is perfect for presenting key selling points, service features, or strategic highlights in a professional way. Fully customizable and compatible with PowerPoint, Keynote, and Google Slides for seamless editing and presentation.


8 slides
Customer Feedback and Review
Highlight real user opinions with this Customer Feedback and Review presentation. Designed to showcase testimonials, star ratings, and satisfaction percentages, each slide offers a clean, card-style layout perfect for product reviews, client testimonials, or user surveys. Fully customizable in PowerPoint, Keynote, and Google Slides.


22 slides
Jade Graphic Design Project Plan Presentation
Unleash creativity with this vibrant Graphic Design Project template! Perfect for showcasing your design process, prototypes, and assets, it keeps the audience captivated with clean visuals and a fresh, modern look. Whether you're outlining color palettes or final designs, every slide exudes style. Ideal for PowerPoint, Keynote, and Google Slides!


5 slides
Optimized Process Flow Diagram Presentation
Streamline workflows with the Optimized Process Flow Diagram. This professional template visualizes key business processes for efficient decision-making and execution. Designed for project managers, analysts, and strategists, it ensures a clear, structured overview of sequential steps. Fully editable and compatible with PowerPoint, Keynote, and Google Slides.


21 slides
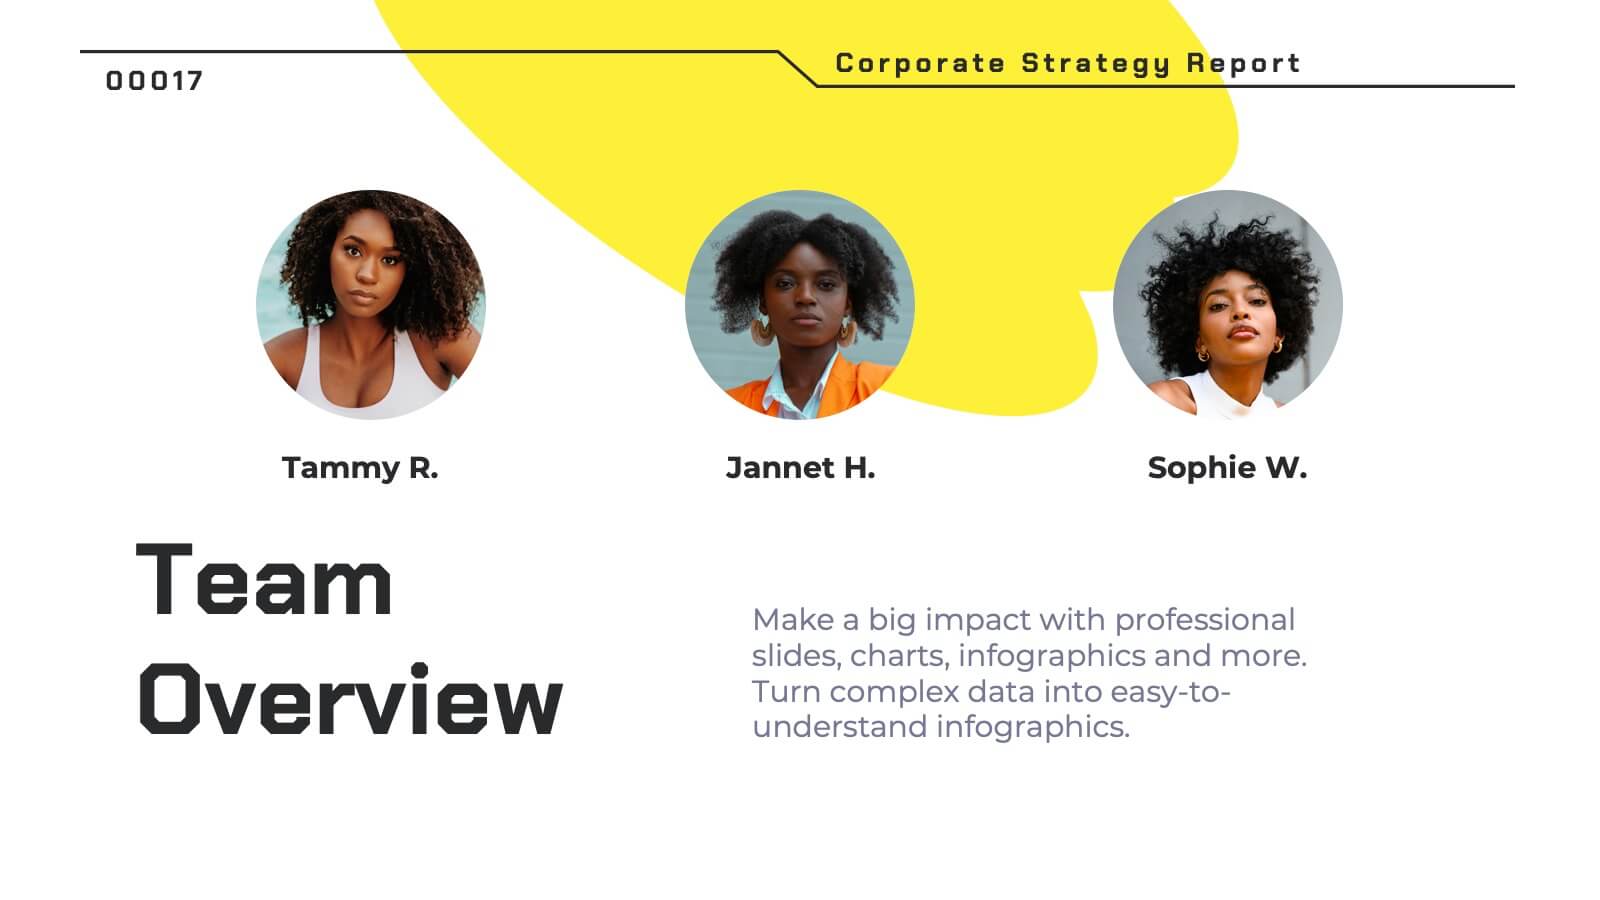
Pyronova Corporate Strategy Report Presentation
This professional corporate strategy template includes slides for market opportunity, SWOT analysis, objectives, marketing plan, revenue model, and competitive analysis. Designed for impactful presentations, it highlights financial performance, investment opportunities, and operational plans. Fully customizable in PowerPoint, Keynote, and Google Slides to suit diverse business needs.


6 slides
Marketing Customer Profile Infographics
Our Marketing Customer Profile infographic is a strategic tool crafted for use in Powerpoint, Keynote, and Google Slides. It is ideal for marketers, sales teams, and business strategists looking to present a comprehensive view of customer demographics, preferences, and behaviors. This infographic is designed to segment and illustrate various aspects of customer profiles, helping to paint a detailed picture of target markets. It includes elements such as age range, gender distribution, income levels, purchasing habits, and preferred communication channels, among others. The layout is structured to guide the audience through the data in a logical sequence, ensuring a thorough understanding of the customer base. Incorporating this infographic into your marketing presentations will empower your team to tailor strategies that resonate with your audience, backed by data-driven insights. Whether you’re crafting personalized marketing campaigns, developing new products, or exploring new market opportunities, this infographic will serve as an essential visual aid to support your objectives. Use it to bring clarity and focus to discussions about your customer profiles and market segmentation strategies.


10 slides
4-Quadrant Responsibility Chart Presentation
Bring your message to life with a slide that feels bold, modern, and instantly engaging. This presentation helps you outline four key responsibilities or categories in a clean quadrant layout, making complex information easy to follow and visually compelling. It’s perfect for strategy, workflow, or team-based insights. Fully compatible with PowerPoint, Keynote, and Google Slides.


6 slides
Customer Targeting Strategy Overview Presentation
Present your customer approach clearly with this Customer Targeting Strategy Overview presentation. Featuring a central persona with speech bubble-style segments, this layout is perfect for showcasing targeting methods, segmentation insights, or buyer personas. Ideal for marketers and strategists. Fully editable in Canva, PowerPoint, and Google Slides for easy customization.


23 slides
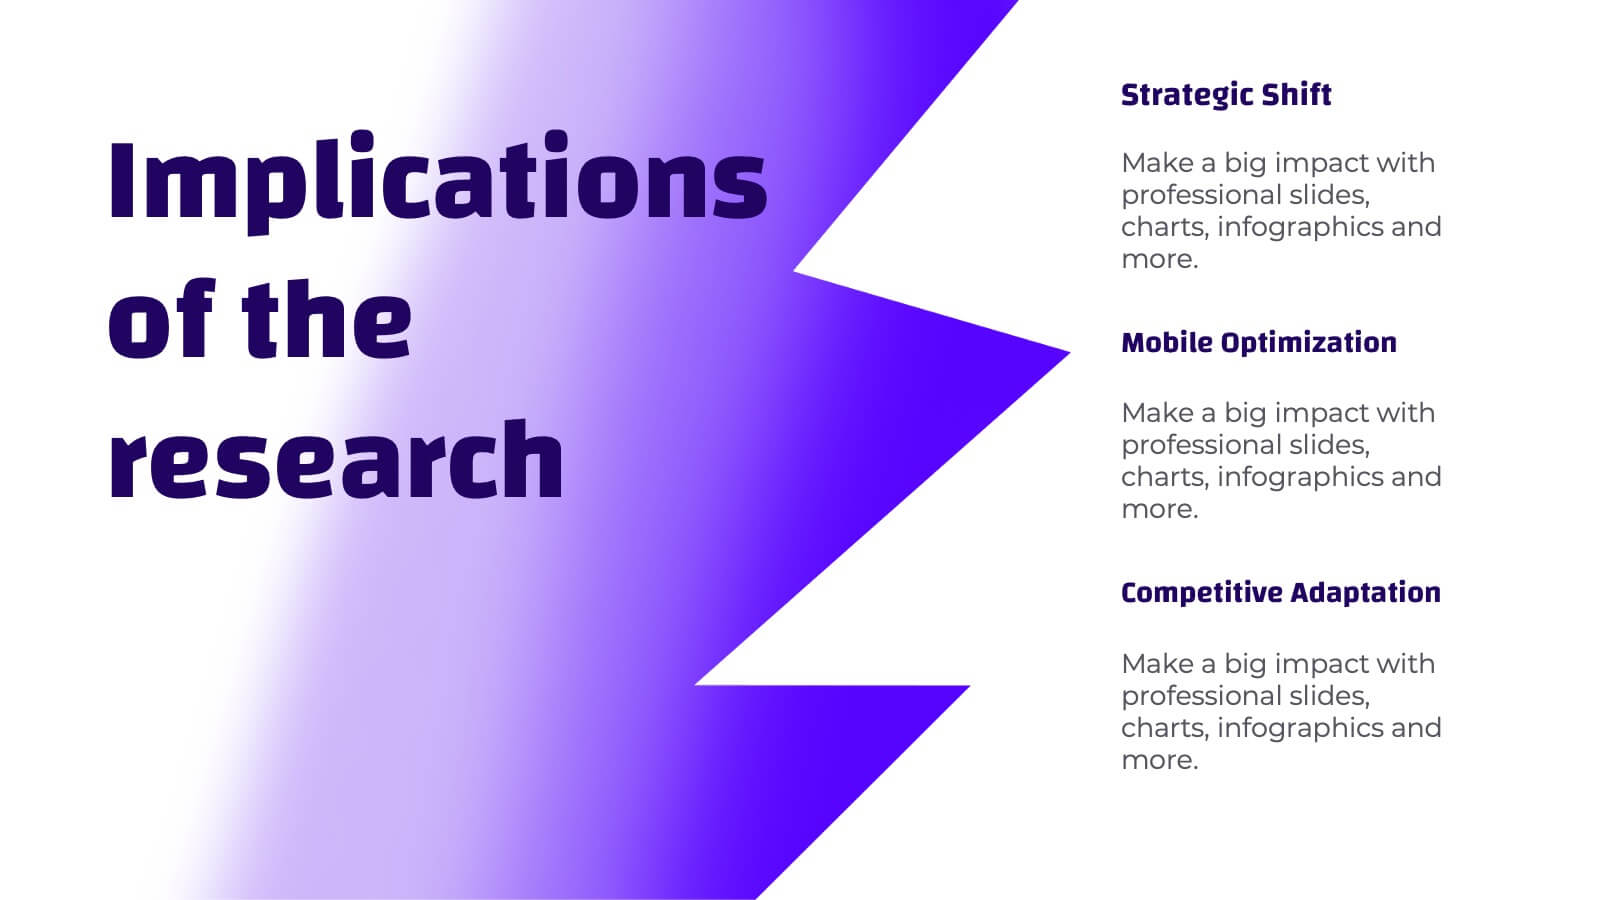
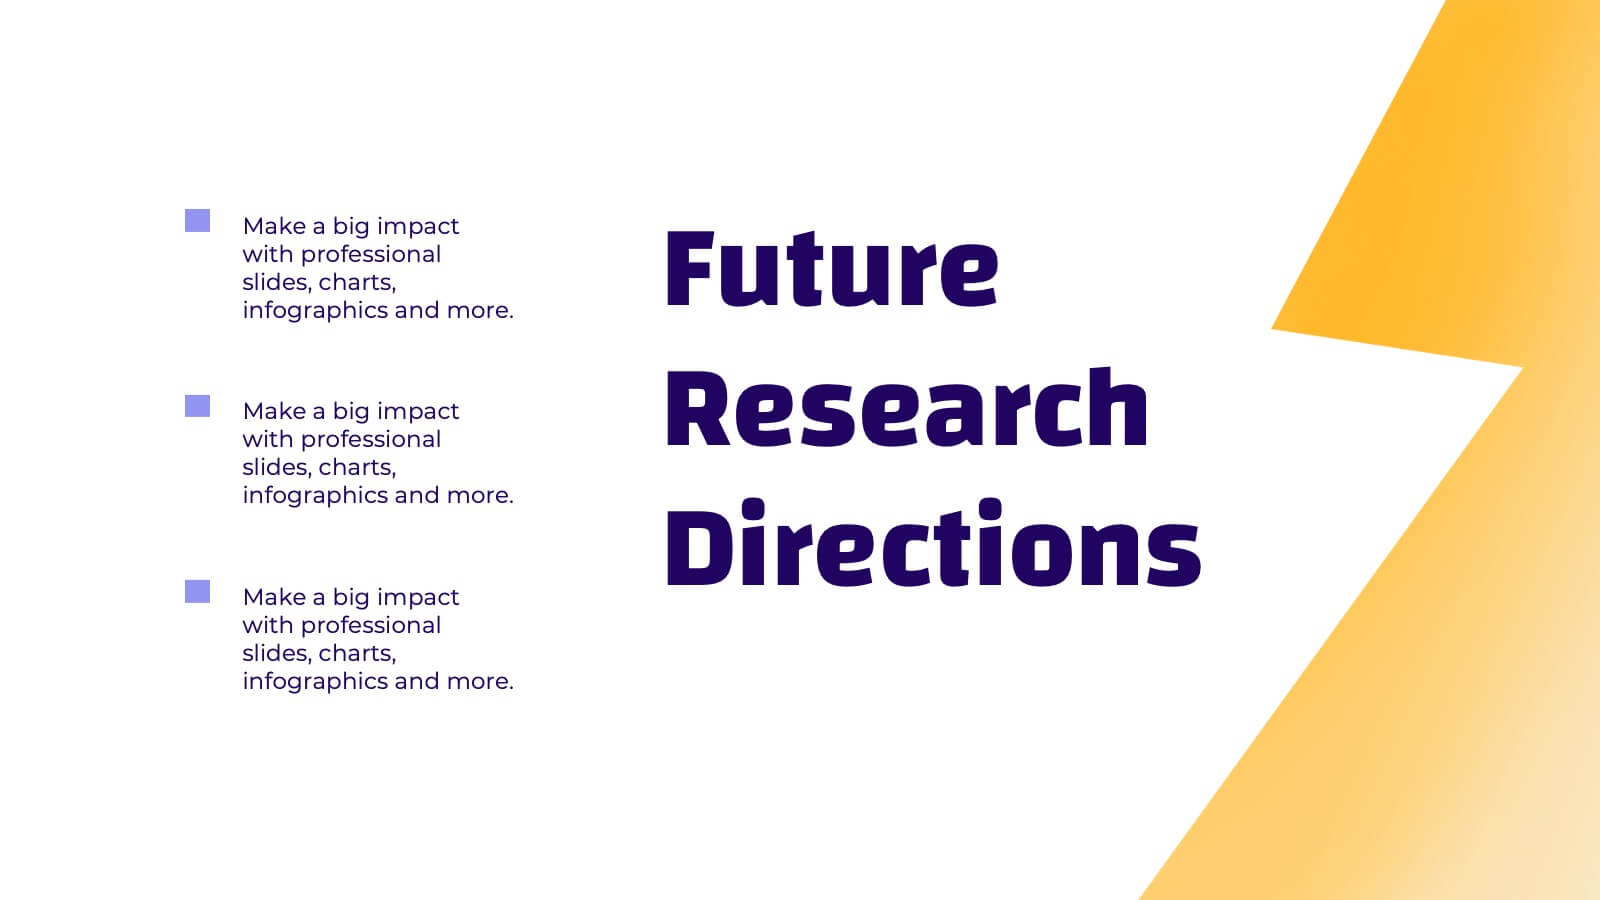
Naiad Qualitative Research Findings Presentation
Dive into your data with this refreshing, Naiad-inspired presentation template, perfect for sharing qualitative research findings! Designed to showcase insights, trends, and key conclusions with clarity, this visually appealing layout ensures your research captivates and informs. Make your data flow effortlessly. Compatible with PowerPoint, Keynote, and Google Slides for easy customization.