


Features
- 4 Unique slides
- Fully editable and easy to edit in Microsoft Powerpoint, Keynote and Google Slides
- 16:9 widescreen layout
- Clean and professional designs
- Export to JPG, PDF or send by email


Do you have any questions?
Recommend


26 slides
Coffee Shop Warm Company Profile Presentation
Coffee shops have become an important part of modern culture, especially in urban areas, and they come in various styles and themes. This presentation template is designed to bring the essence of your coffee haven to life. From the first sip to the last drop, let this presentation showcase the soul-warming experience your coffee shop provides. Fully customizable and compatible with Powerpoint, Keynote, and Google Slides. Utilize warm colors like browns, oranges, and yellows to evoke a cozy, comforting atmosphere. The template integrates coffee cup icons, latte art, and coffee bean graphics for a coffee-centric theme.


3 slides
Market Size and Scaling Insights Presentation
Understand your market potential with the Market Size and Scaling Insights Diagram. This visually engaging template helps you analyze market segments, growth trends, and scaling opportunities with clarity. Ideal for business strategists, analysts, and investors, this slide ensures a concise and professional presentation of key market data. Fully customizable and compatible with PowerPoint, Keynote, and Google Slides.


5 slides
Numerical Highlights in Strategy Presentation
Present key strategic milestones using this visually engaging curved-number layout. Designed to emphasize four sequential points, it's perfect for showcasing steps, achievements, or data-driven highlights. The bold numbering and layered hills guide the viewer naturally. Fully editable in Canva—ideal for business plans, growth summaries, or performance strategy visuals.


7 slides
Trading Cryptocurrency Infographic
The world of cryptocurrency is ever-evolving, and keeping track of trading insights is crucial. The trading cryptocurrency infographic offers a dynamic visualization of this digital currency realm. Using a vivid palette of white, red, and blue, it deciphers complex trading data into comprehensible visuals. Ideal for traders, financial analysts, and those new to the crypto market, this infographic serves as an essential guide to navigate the digital finance landscape. Its compatibility with PowerPoint, Keynote, and Google Slides ensures that presenting your trading insights has never been easier or more stylish.


6 slides
Financial Forecasting and Numerical Analysis Presentation
Visualize your financial insights with clarity using this clean and modern bar chart template. Designed for presenting financial projections, budget analysis, and performance metrics, this slide breaks down six key categories for easy comparison. Ideal for financial reviews, business updates, or investment pitches. Fully editable in PowerPoint, Keynote, and Google Slides.


7 slides
Marketing Calendar Schedule Organizer
Stay on top of every post, caption, and campaign with this simple and stylish visual planner—built to make your content calendar finally feel manageable. Designed to help marketers organize platforms, posting times, and links all in one place, it’s your go-to tool for streamlined weekly planning. Fully compatible with PowerPoint, Keynote, and Google Slides.


7 slides
Industrial Safety Infographic
Industrial safety, also known as occupational safety, pertains to the management of processes and conditions within industrial settings to ensure the safety, health, and well-being of workers and the general public. This impactful infographic template encapsulates the essentials for fostering a secure and hazard-free industrial environment. Compatible with Powerpoint, Keynote, and Google Slides. The customizable set of icons represents emergency response actions, underlining the need for rapid and efficient responses in critical situations. Build a foundation of safety that fosters a secure and thriving work environment.


5 slides
Solution Building with Puzzle Framework Presentation
Present integrated strategies with the Solution Building with Puzzle Framework Presentation. This visually compelling layout uses a four-piece puzzle cross to represent interconnected ideas or components—perfect for mapping out project phases, strategic solutions, or department contributions. Fully customizable in Canva, PowerPoint, or Google Slides for easy content editing.


10 slides
Customer Demographic Breakdown Presentation
Give your insights a bold, modern look with a clear visual layout that turns customer data into an easy-to-follow story. This presentation helps you explain key demographic patterns, highlight audience behavior, and support smarter decisions with clean, structured visuals. Fully editable and compatible with PowerPoint, Keynote, and Google Slides.


4 slides
Science Lab Results and Data Analysis Presentation
Visualize lab data with clarity using this science-themed infographic. Featuring test tubes in a rack, it’s ideal for presenting experimental results, sample comparisons, or analysis summaries. Each tube aligns with icons and key points for easy interpretation. Fully customizable in PowerPoint, Keynote, and Google Slides to match your findings.


6 slides
Agile Delivery Framework for Projects Presentation
Visualize agile project phases with this spiral delivery framework slide. Ideal for project managers and scrum teams to outline each step in a continuous delivery process. Features six clearly labeled stages, icons, and bold colors. Fully editable in PowerPoint, Keynote, and Google Slides for clear, structured agile workflow presentations.


7 slides
Agile Methodology Strategy Infographic
Master the dynamics of Agile with our agile methodology infographic. Set against a crisp white foundation, the design cascades with the professionalism of blue, the urgency of red, the innovation of orange, and the growth of green. Equipped with methodical infographics, pertinent icons, and versatile image placeholders, this template provides a comprehensive depiction of the Agile process, from sprint planning to retrospectives. Tailored impeccably for Powerpoint, Keynote, or Google Slides. A must-have for project managers, scrum masters, product owners, or any Agile enthusiasts aiming to educate, implement, or iterate the Agile way.


5 slides
Training Needs Through Skills Gap Analysis Presentation
Clearly identify training gaps and skill development priorities with the Training Needs Through Skills Gap Analysis Presentation. This structured layout helps HR teams and managers map out competency levels, prioritize development, and align learning paths with business goals. Fully editable in PowerPoint, Keynote, Canva, and Google Slides.


6 slides
Geometric Shape Design Slides
Present your process or flow clearly using the Geometric Shape Design Slides Presentation. This layout uses connected circular icons to visually represent sequential steps, ideal for workflows, timelines, or strategic roadmaps. Each stage is color-coded and paired with editable titles and descriptions for clarity. Fully customizable in PowerPoint, Keynote, and Google Slides.


20 slides
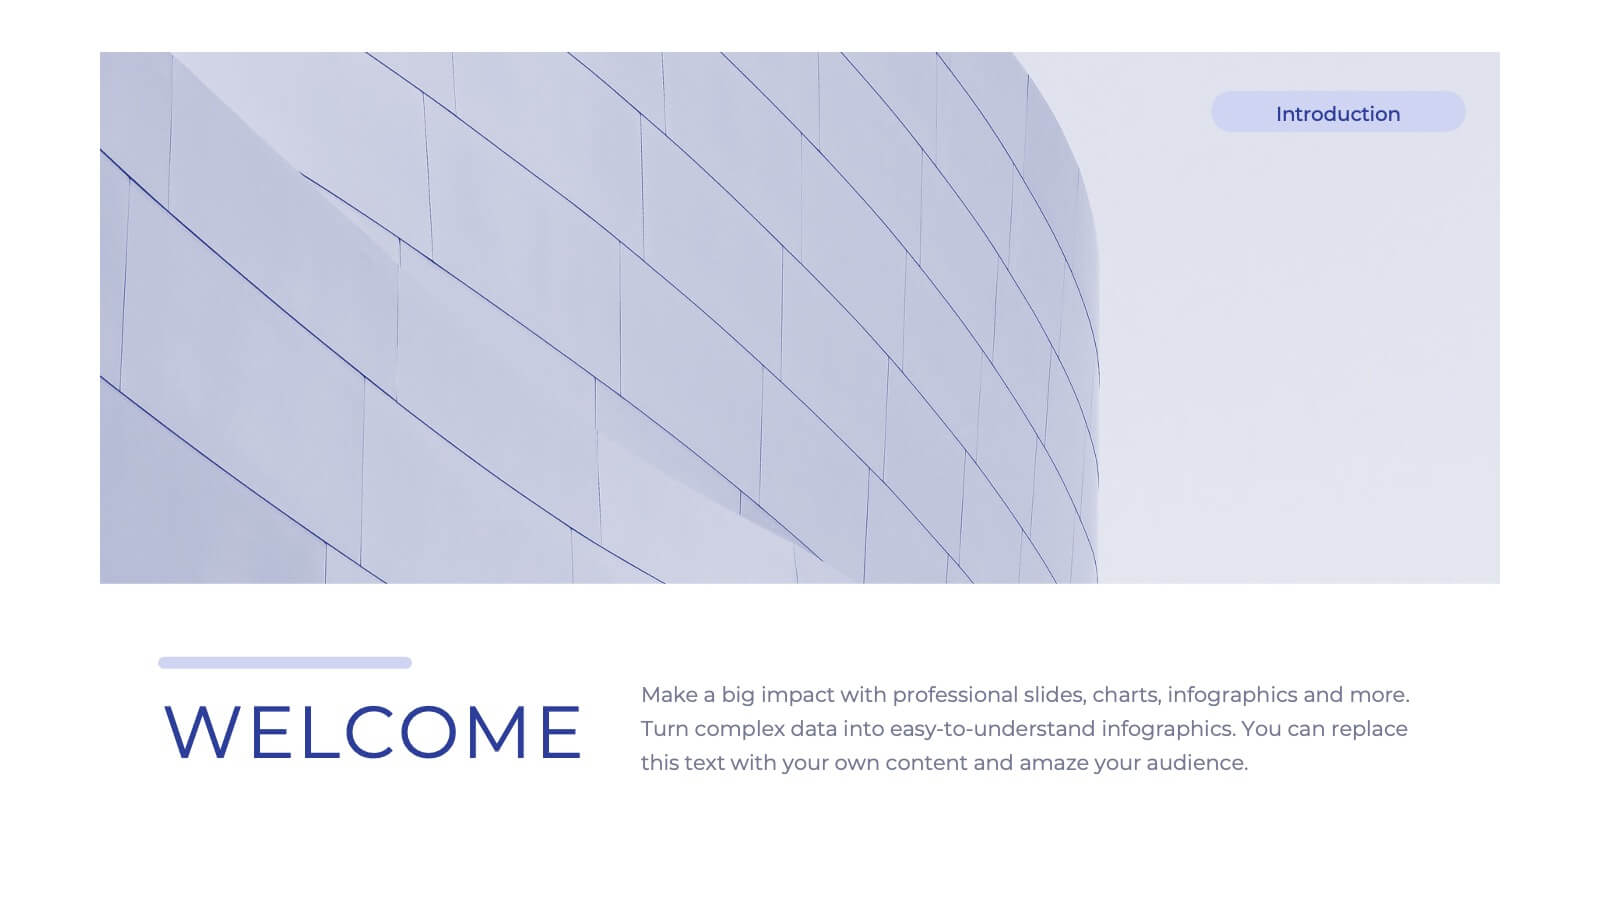
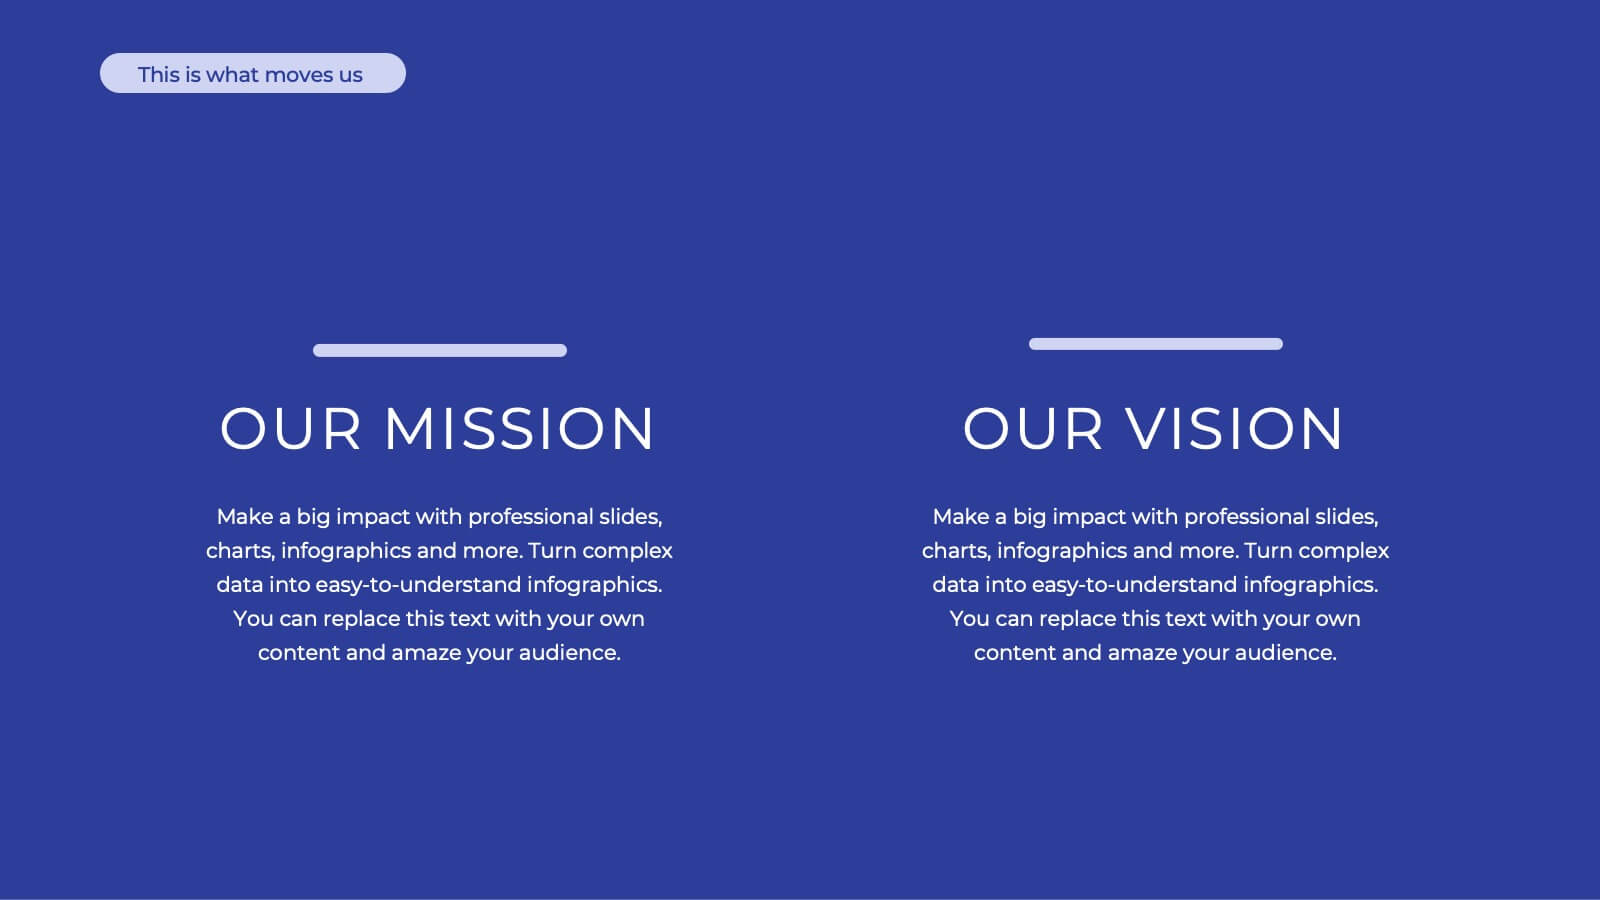
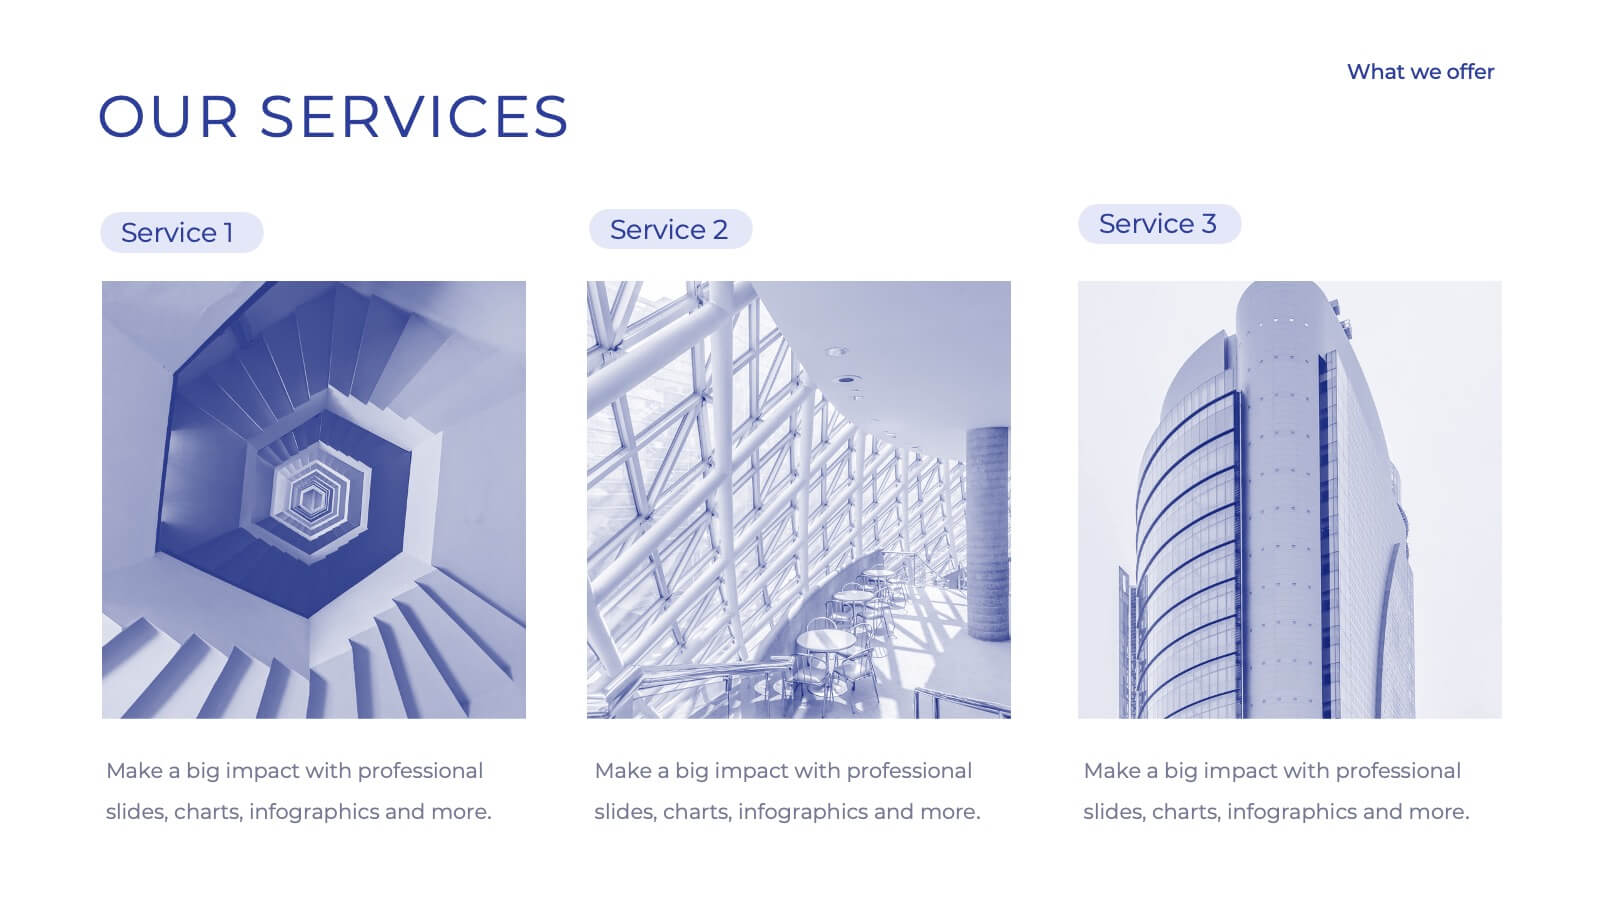
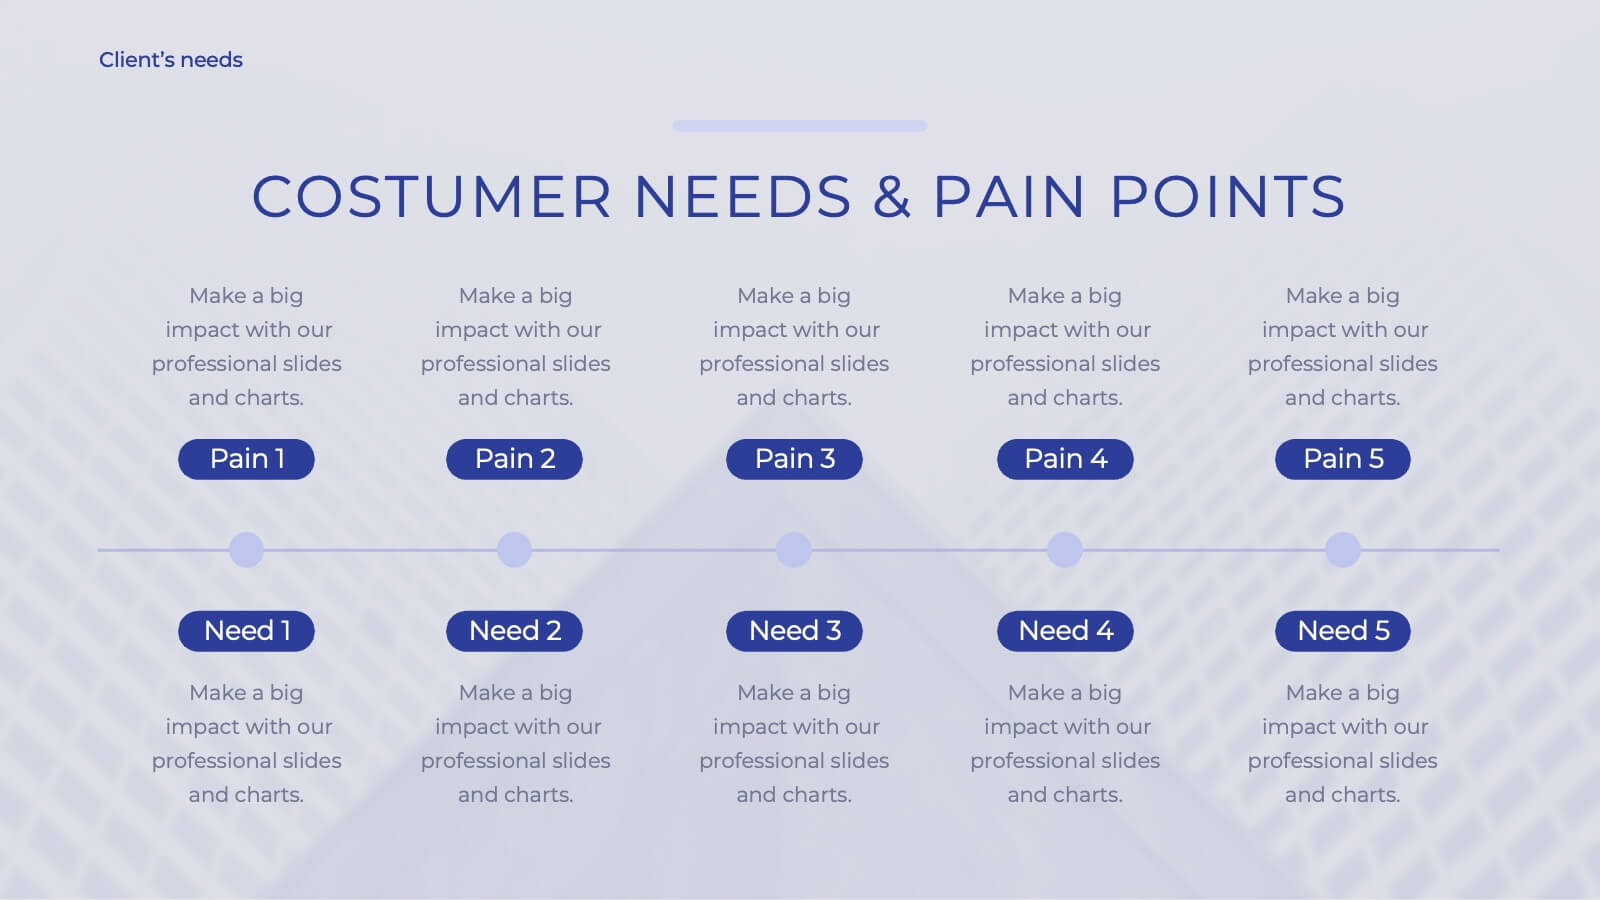
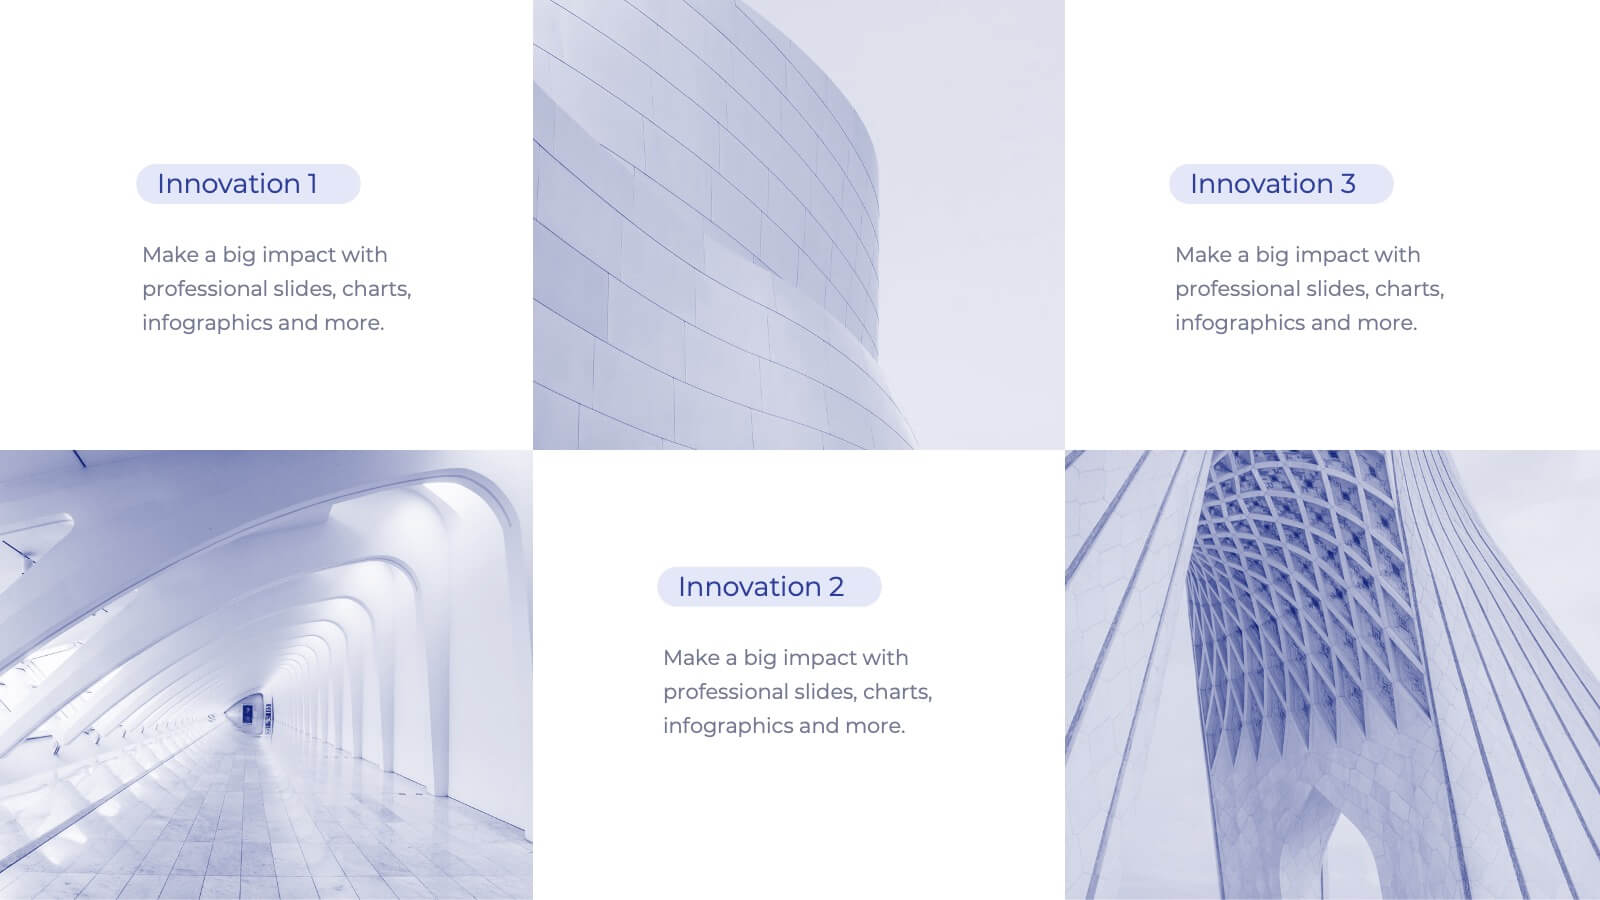
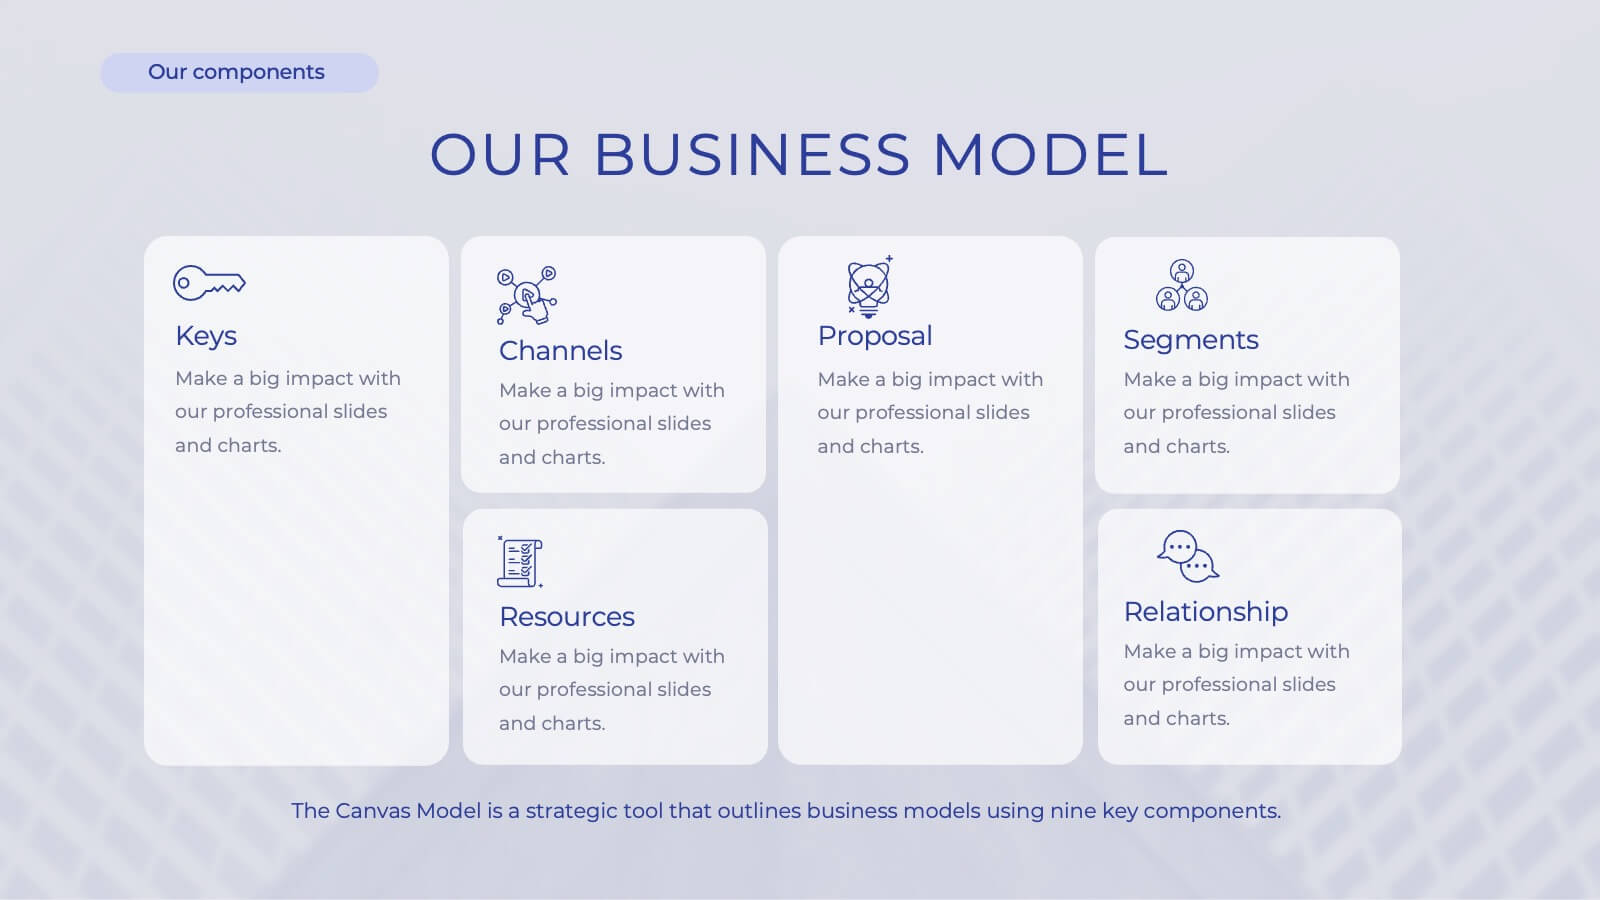
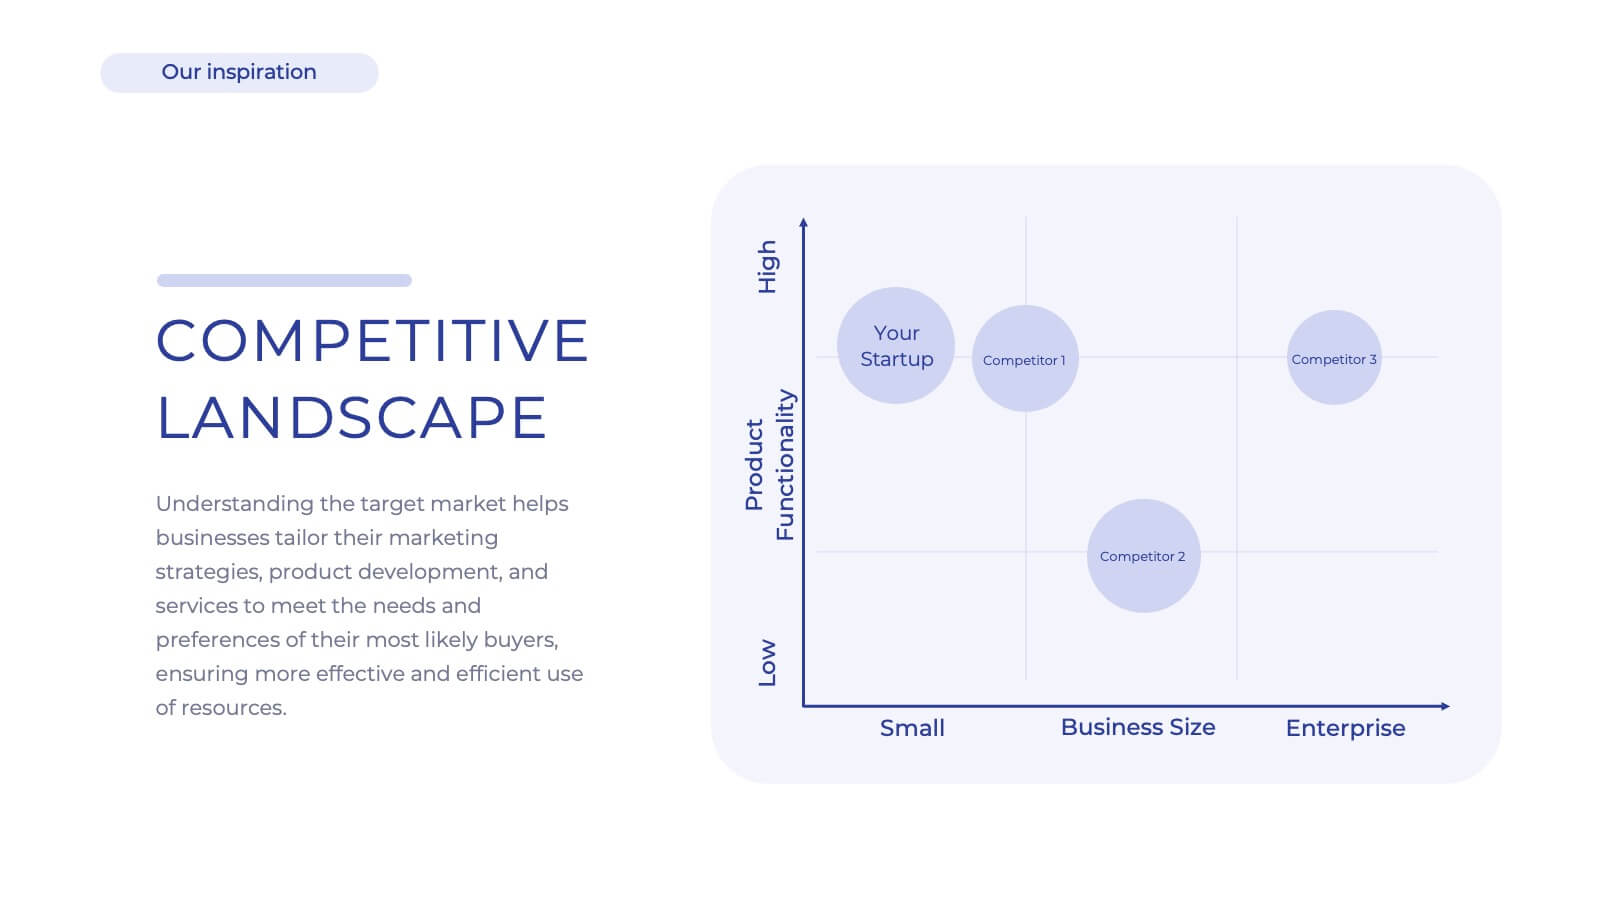
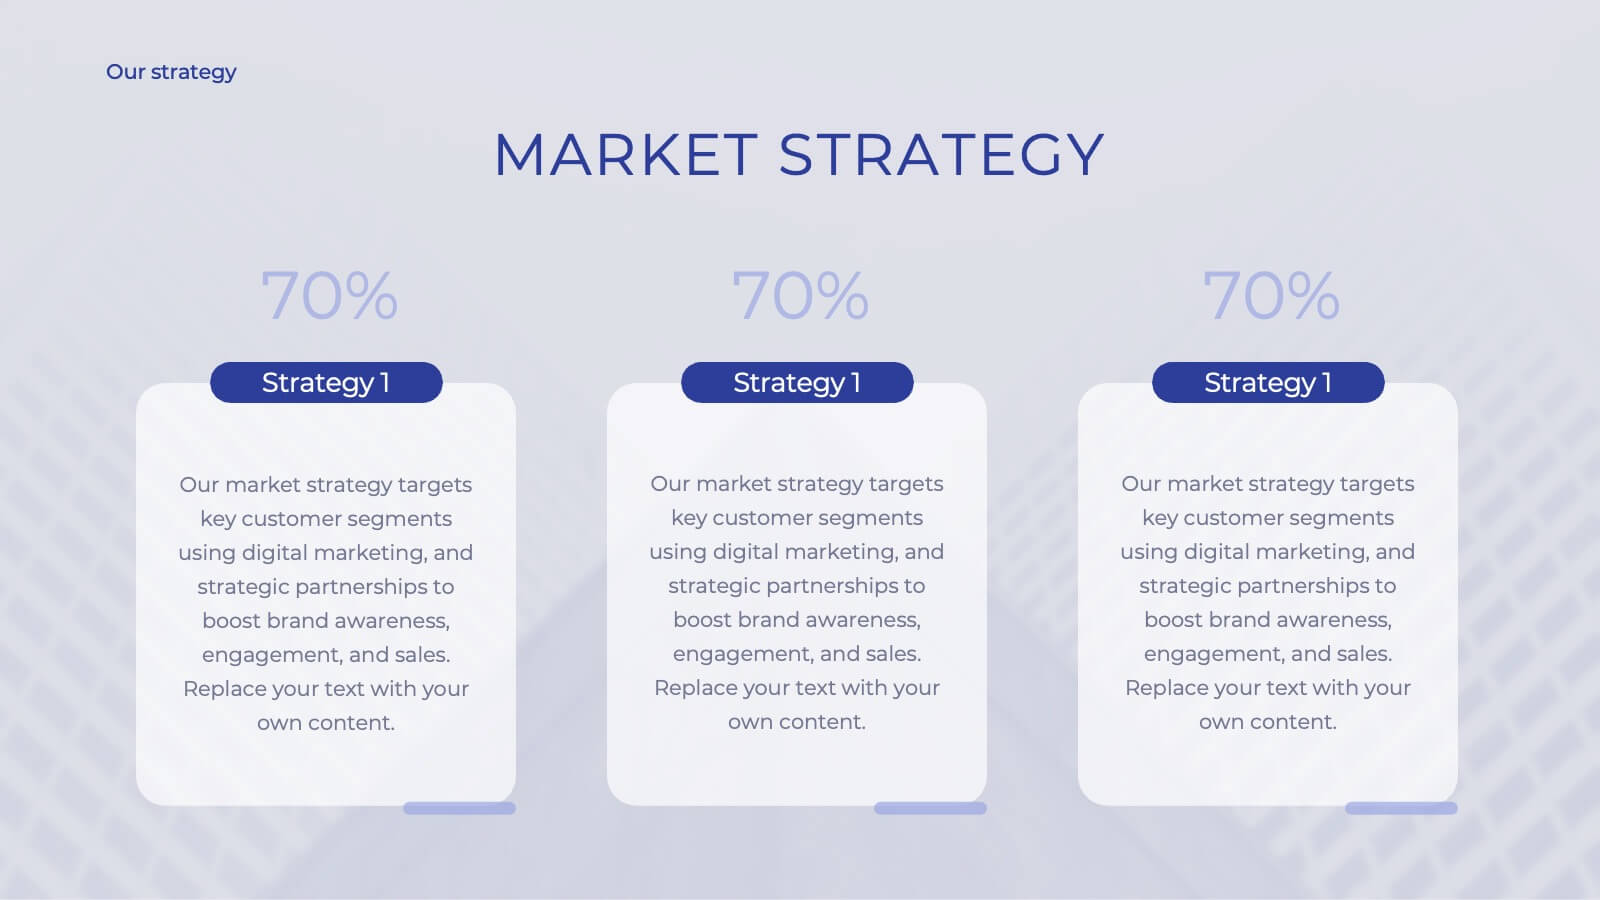
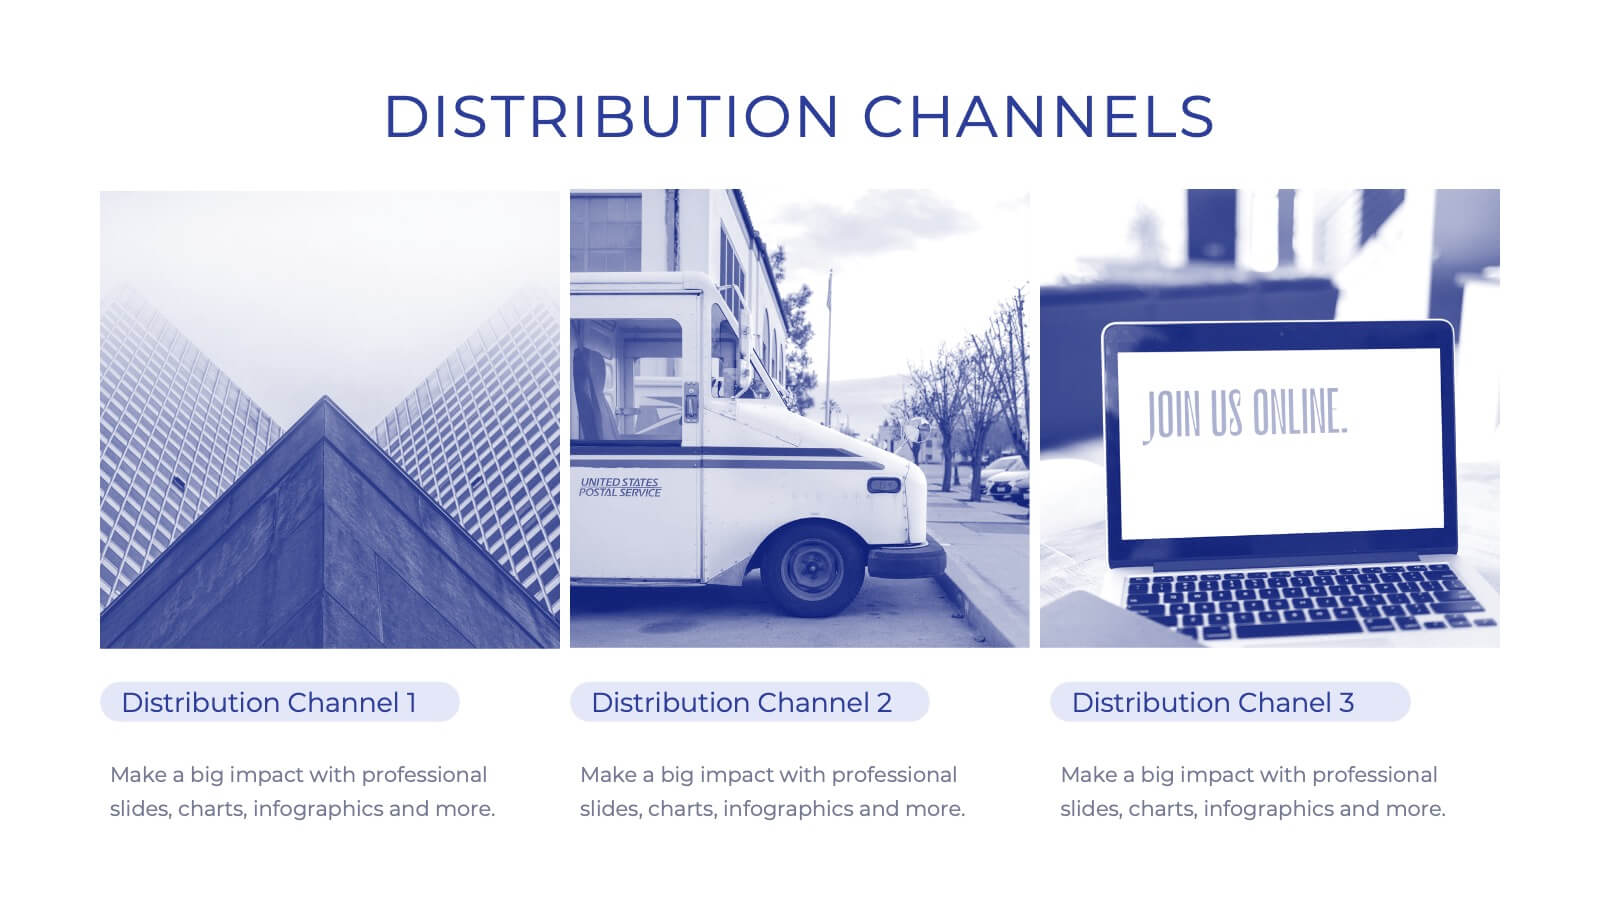
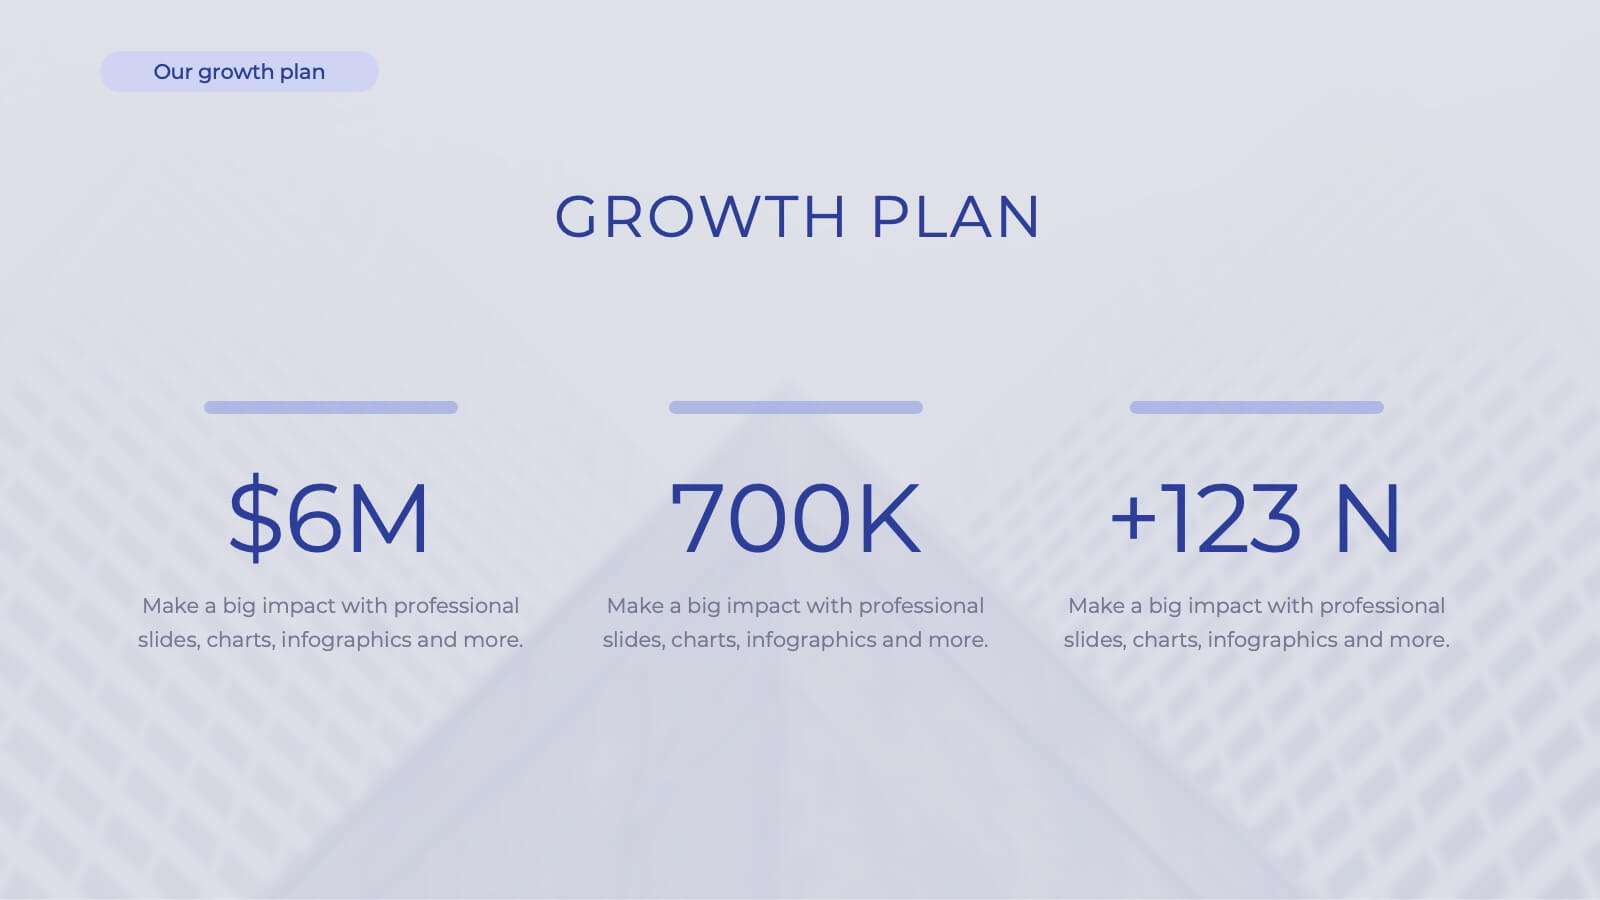
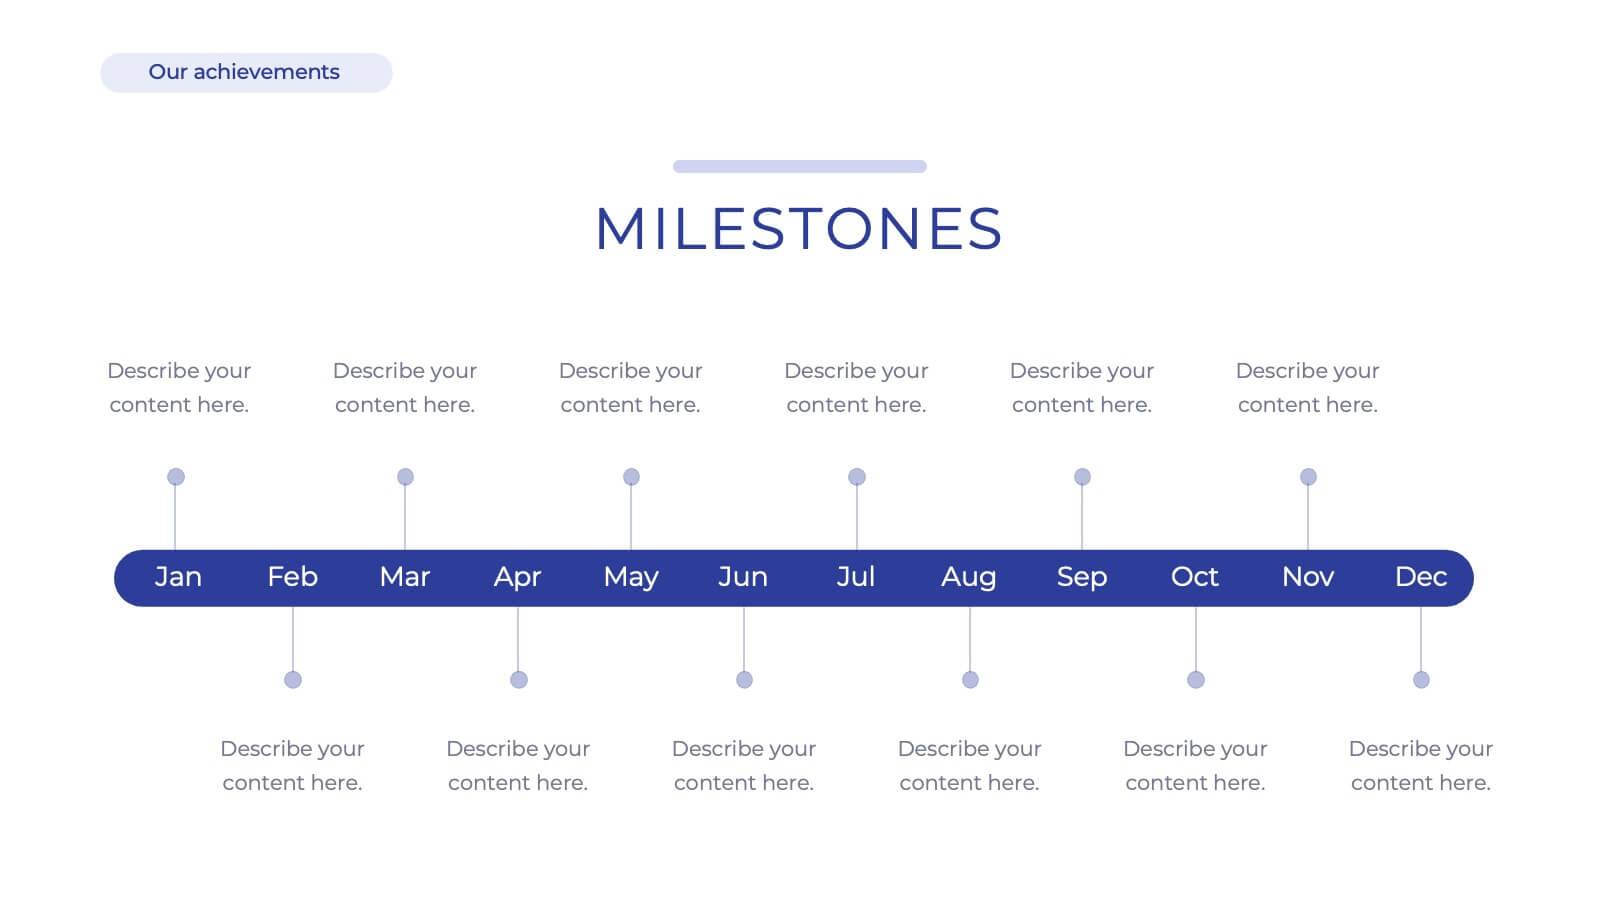
Iconic Startup Business Plan Presentation
Introducing our comprehensive corporate business plan template! Perfect for showcasing your company’s mission, vision, and services. Highlight your market strategy, competitive landscape, and growth plan in a professional design. Ideal for executives and entrepreneurs. Compatible with PowerPoint, Keynote, and Google Slides.


4 slides
Team OKRs Alignment Slide Presentation
Bring clarity and collaboration to your team’s goals with a clean, connected layout that visualizes how objectives lead to measurable results. Perfect for aligning departments, tracking progress, or sharing performance updates, this presentation turns strategy into action. Fully compatible with PowerPoint, Keynote, and Google Slides for easy customization.


8 slides
Medical Case Study Presentation
Elevate your medical presentations with our "Medical Case Study Presentation" template. This infographic is expertly designed to outline medical case studies or healthcare data, showcasing a central image flanked by related statistics and information. Each segment is linked to a visually distinct icon, representing different health metrics or case points, making it easier to digest complex medical information. This template is perfect for medical professionals, educators, and healthcare analysts, providing a structured way to present findings, research, or patient data effectively. Compatible with PowerPoint, Keynote, and Google Slides, it ensures your medical data is communicated clearly and professionally.