


Features
- 5 Unique slides
- Fully editable and easy to edit in Microsoft Powerpoint, Keynote and Google Slides
- 16:9 widescreen layout
- Clean and professional designs
- Export to JPG, PDF or send by email


Do you have any questions?
Recommend
22 slides
Palladium Qualitative Research Findings Presentation
Present your qualitative research findings effectively with this sleek, professional template. It includes sections for objectives, data analysis, key findings, and recommendations. Ideal for organizing research insights clearly, it's customizable and compatible with PowerPoint, Keynote, and Google Slides, ensuring smooth collaboration and impactful presentations for your audience.


3 slides
Governance and Compliance Framework Presentation
Strengthen your organization's structure with our Governance and Compliance Framework template. This visually compelling template is crafted to effectively communicate the integration of governance, compliance, and risk management. It is ideal for demonstrating how these elements collaborate to uphold regulatory standards and manage business risks. Fully compatible with PowerPoint, Keynote, and Google Slides, it's an essential tool for any corporate governance presentation aimed at promoting effective, compliant business practices.


4 slides
Workplace Safety Guidelines Presentation
Create a safer, smarter workspace with this clean and visual presentation design. Ideal for communicating safety standards, compliance rules, and hazard prevention tips, it helps teams stay informed and engaged. Fully customizable and compatible with PowerPoint, Keynote, and Google Slides for easy editing and professional delivery.


6 slides
Six Sigma Process Infographic
Dive into the world of process improvement with our six sigma process infographic. Crafted with a harmonious blend of blue, yellow, and white, this infographic elucidates the principles of Six Sigma methodology in an engaging manner. Ideal for business analysts, quality assurance teams, and corporate trainers, it delineates the DMAIC process in vivid detail. The design encapsulates the rigorous methodology of Six Sigma, providing clarity and fostering knowledge retention. This versatile template is a perfect fit for PowerPoint, Keynote, and Google Slides, making your presentations both captivating and insightful.


23 slides
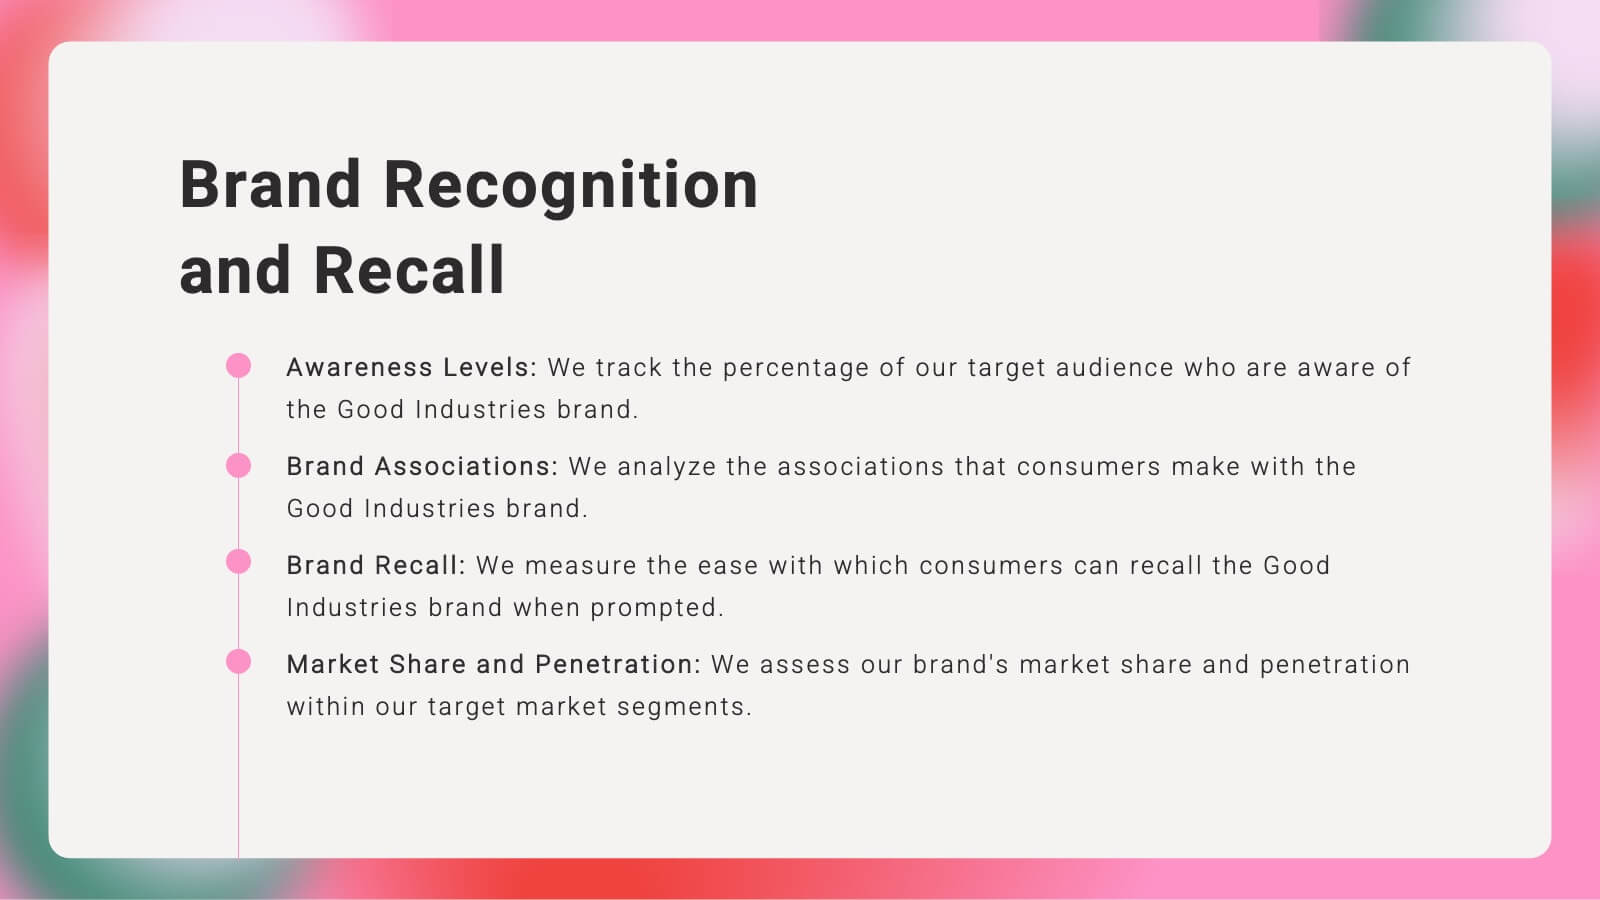
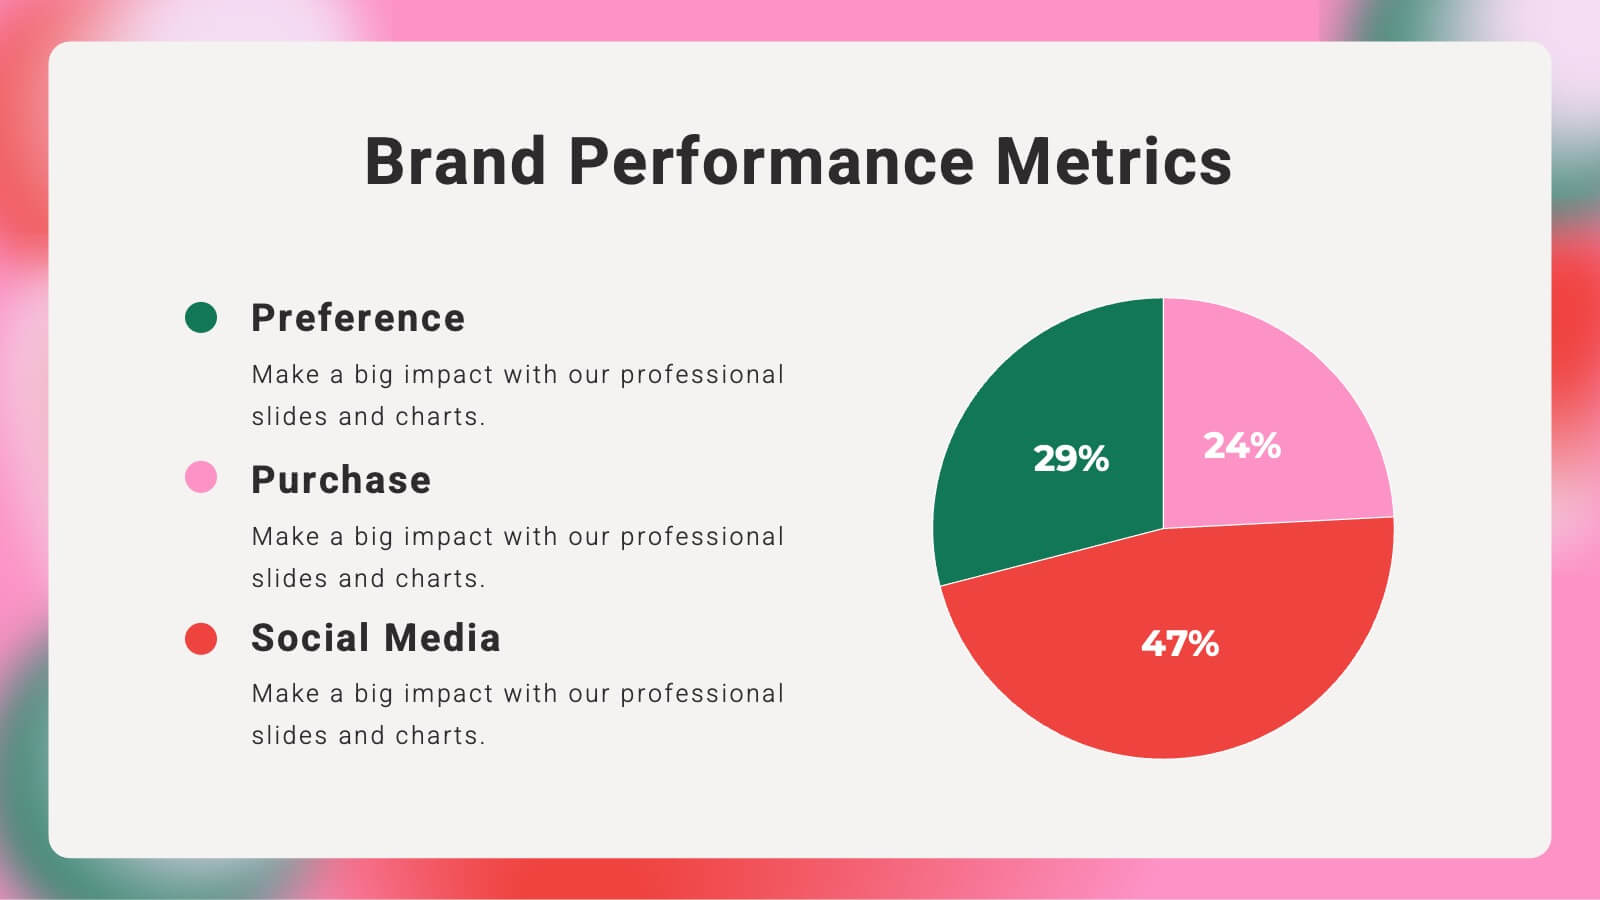
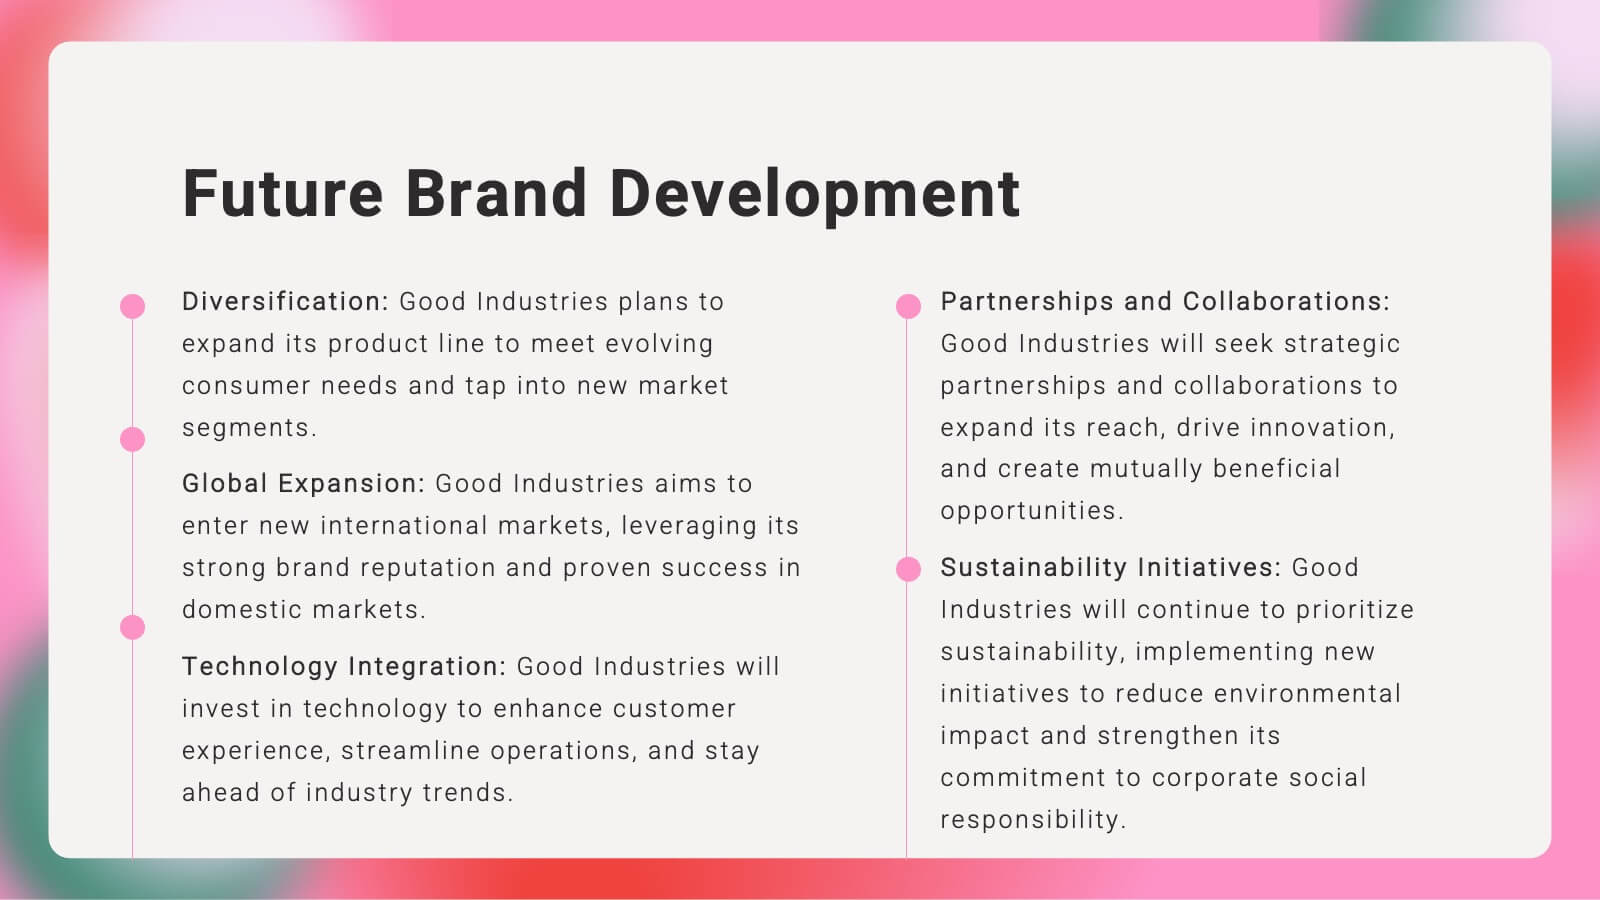
Kaleidoscope Brand Strategy Report Presentation
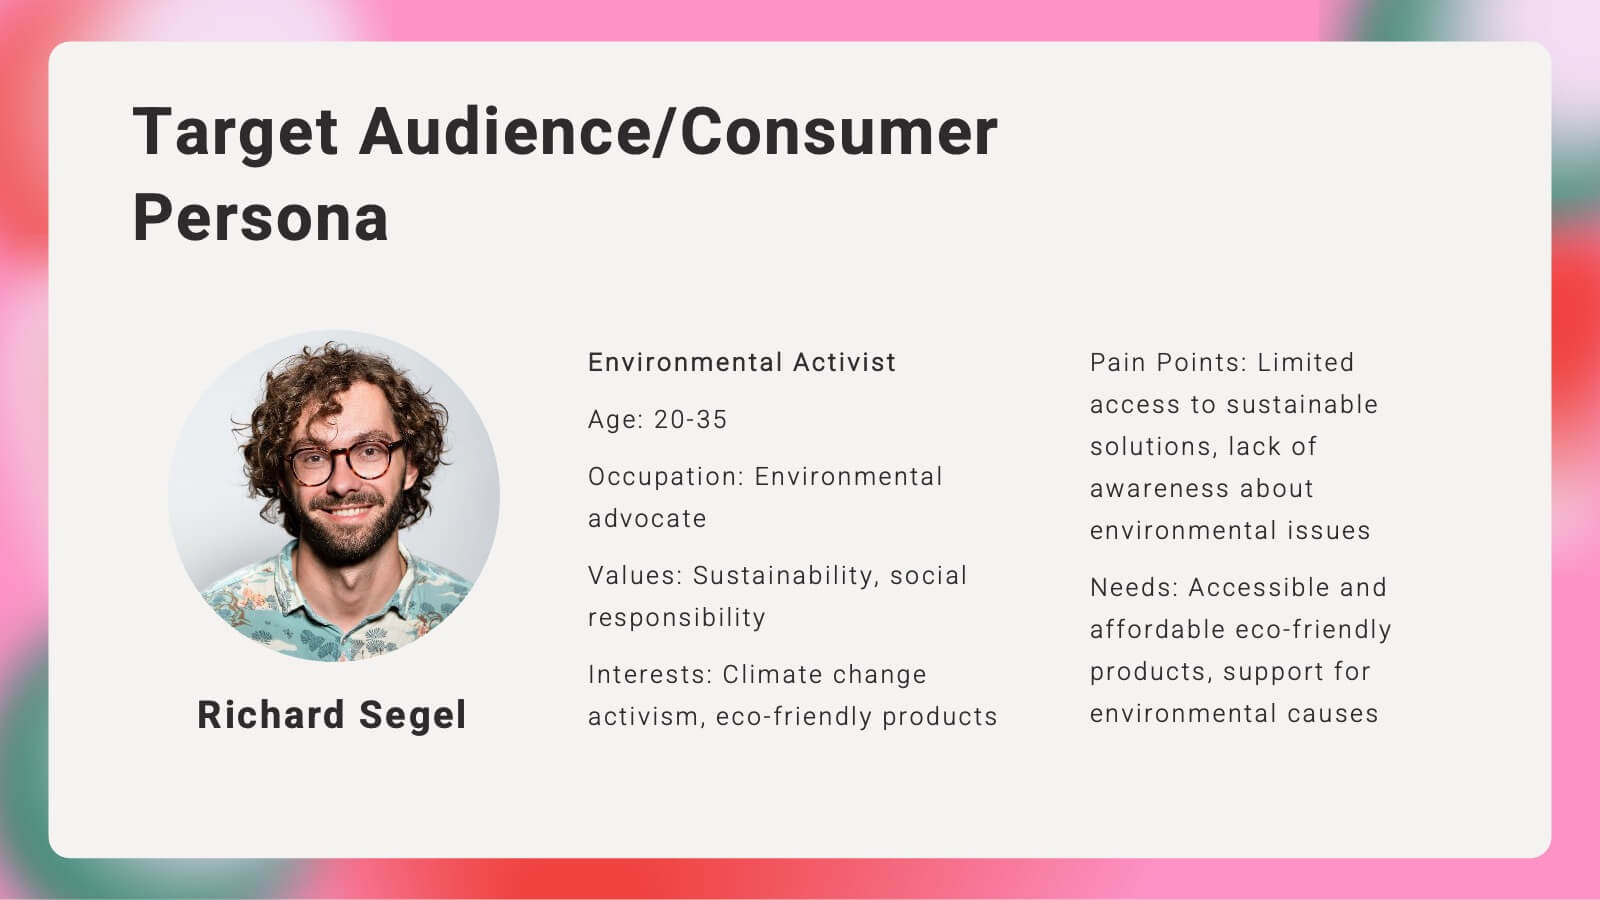
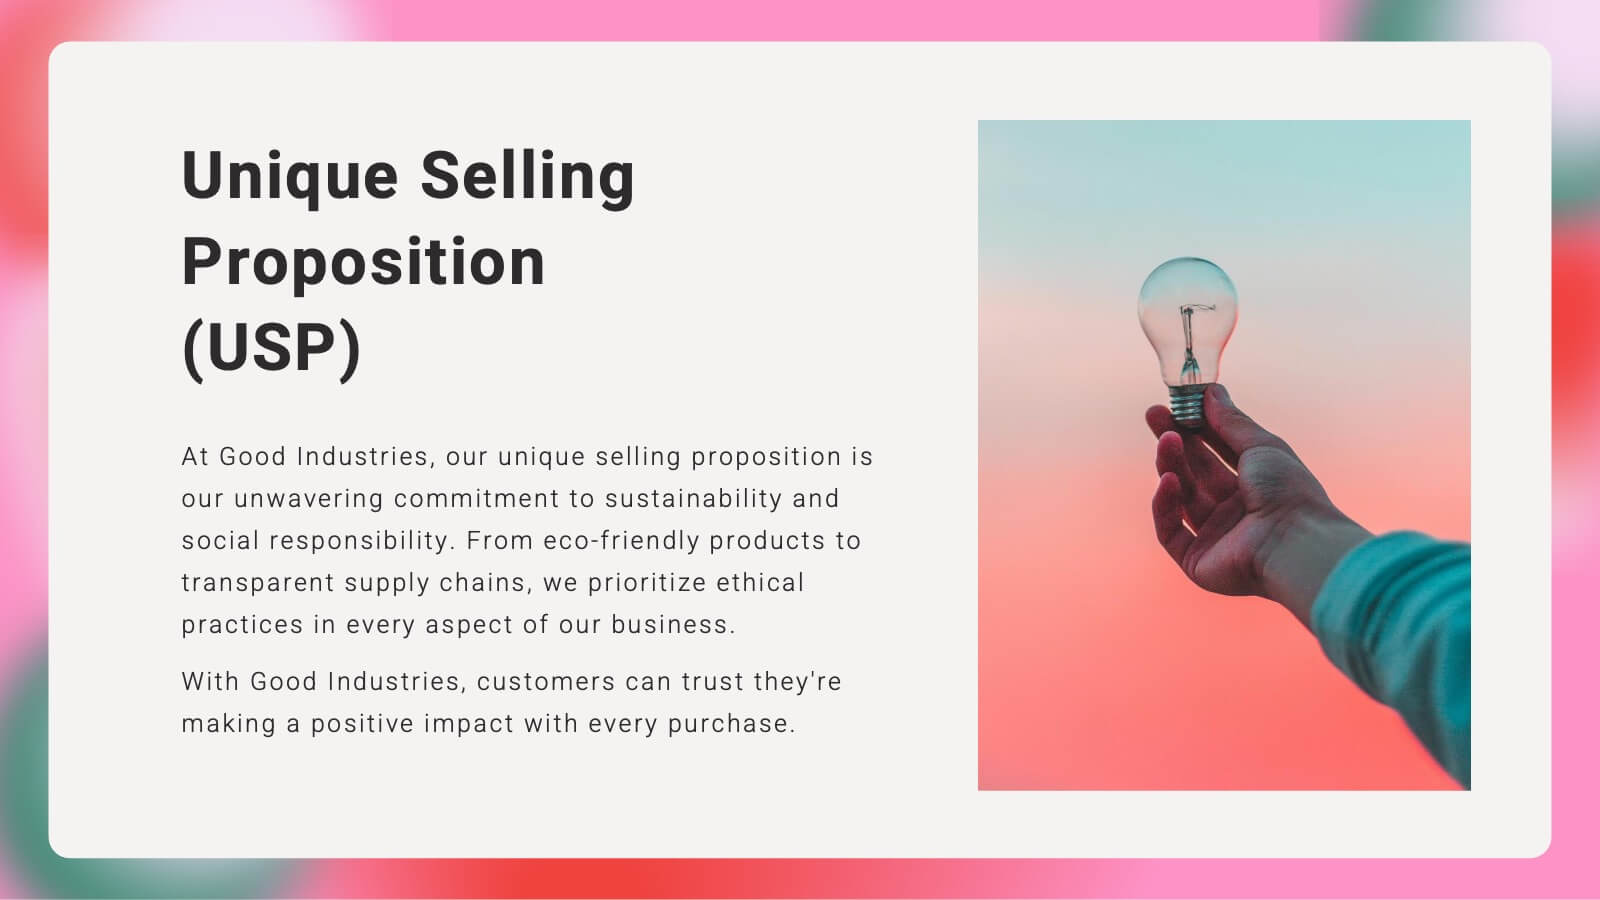
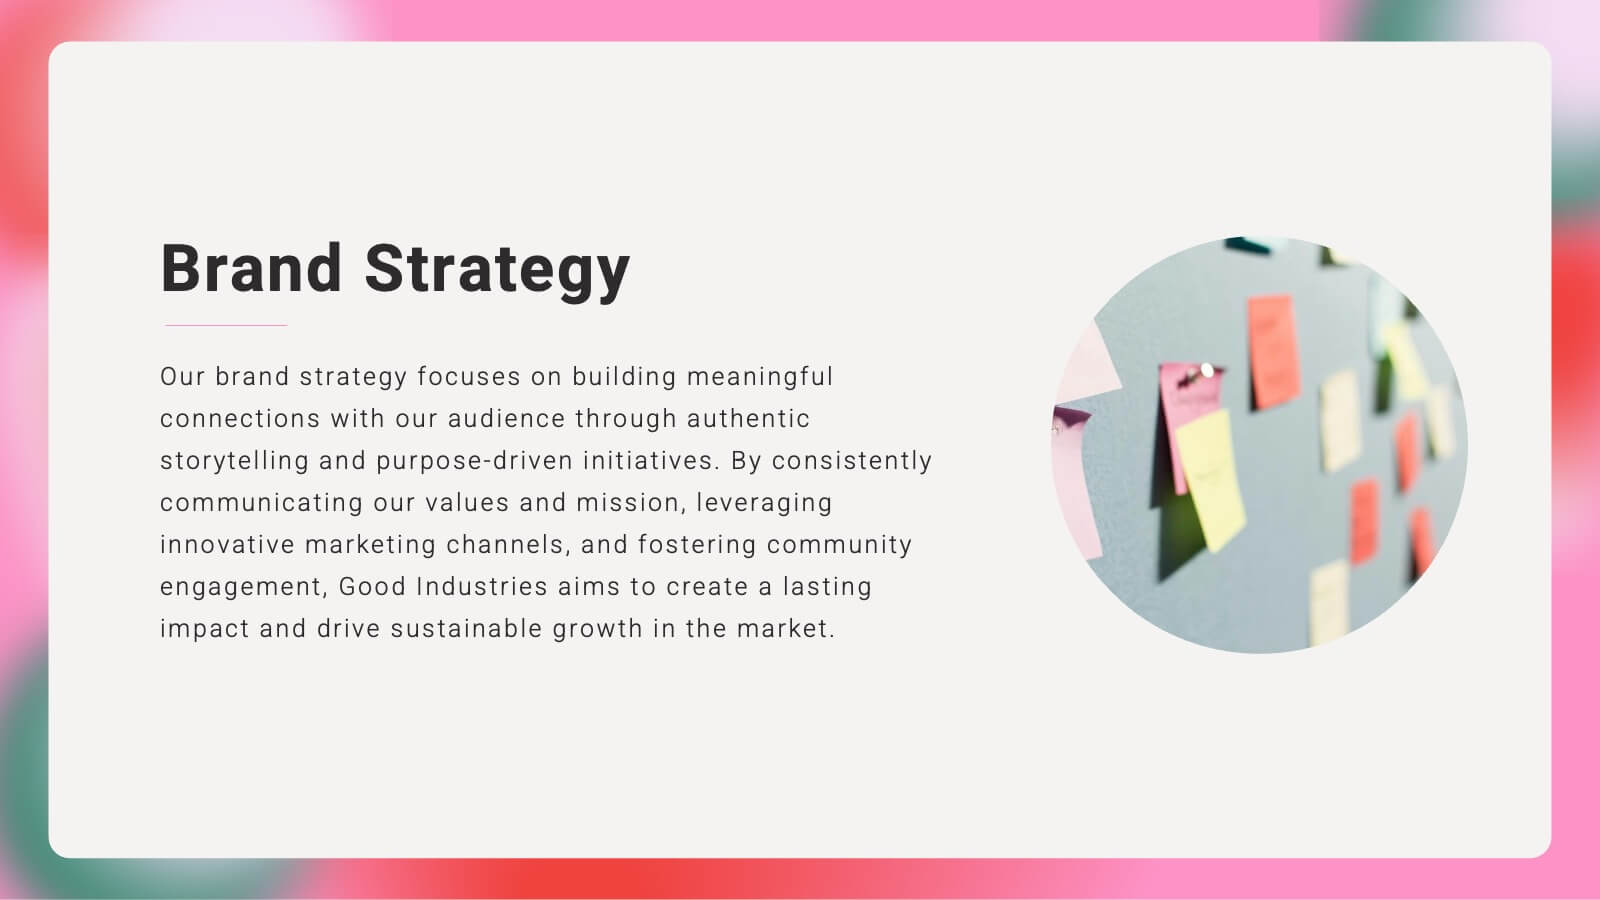
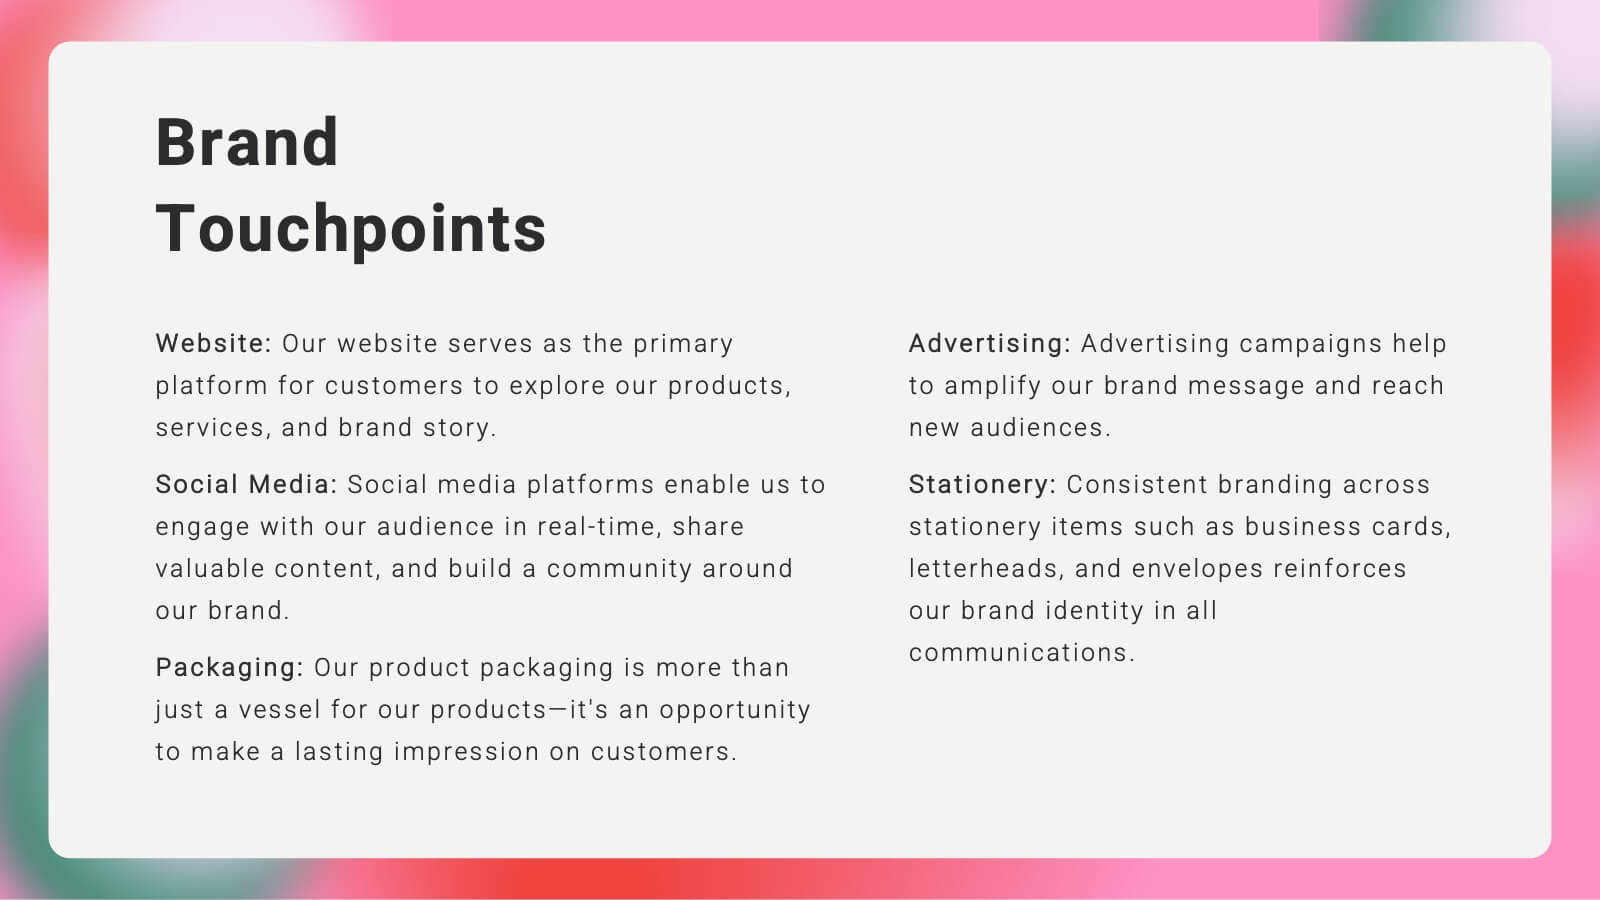
Craft a compelling narrative for your brand with this vibrant brand strategy presentation template. Designed to cover every facet of brand development, from vision and mission to market analysis and consumer personas, this template is an essential tool for businesses looking to establish a strong brand identity. It incorporates visually engaging slides that outline brand voice, values, and touchpoints, facilitating a thorough understanding of strategic branding. Compatible with platforms like PowerPoint, Google Slides, and Keynote, it is accessible across various devices, making it perfect for collaborative planning and presentations.


21 slides
Eldritch Product Roadmap Presentation
The Product Roadmap Presentation Template features 21 modern slides, including product overviews, features, pain points, technical specs, and marketing strategies. Its sleek gray-yellow design ensures professionalism. Perfect for startups or businesses, it’s fully customizable and compatible with PowerPoint, Keynote, and Google Slides, ideal for impactful product-focused presentations.


5 slides
Real-Life Case Study Analysis Presentation
Turn data and insights into compelling stories that capture real business impact. This clean, professional layout is perfect for analyzing real-world examples, comparing strategies, and presenting key takeaways. Easy to customize and visually balanced, it’s fully compatible with PowerPoint, Keynote, and Google Slides for seamless use across platforms.


5 slides
Iceberg Model Infographics
Introducing our Iceberg Model Infographic, this is a visual representation of the Iceberg Model which is a metaphor for understanding a problem or issue. It is based on the idea that just like an iceberg, only a small portion of the problem or issue is visible on the surface, while the majority of it lies beneath. In this vertical infographic use the top visible part of the iceberg to represent the things that are easily observed, and the larger hidden part of the iceberg can be the underlying causes or factors that are not easily visible. This is designed to help people understand the complexity of a problem and encourage them to look beyond the surface level.


4 slides
Classroom Learning Presentation
Break down learning objectives or teaching concepts with this Classroom Learning Presentation. Featuring a visual of a presenter pointing to a board, the layout includes three content areas labeled A, B, and C—perfect for organizing lesson points or training steps. Ideal for educators, trainers, and instructional designers. Fully customizable and compatible with PowerPoint, Keynote, and Google Slides.

20 slides
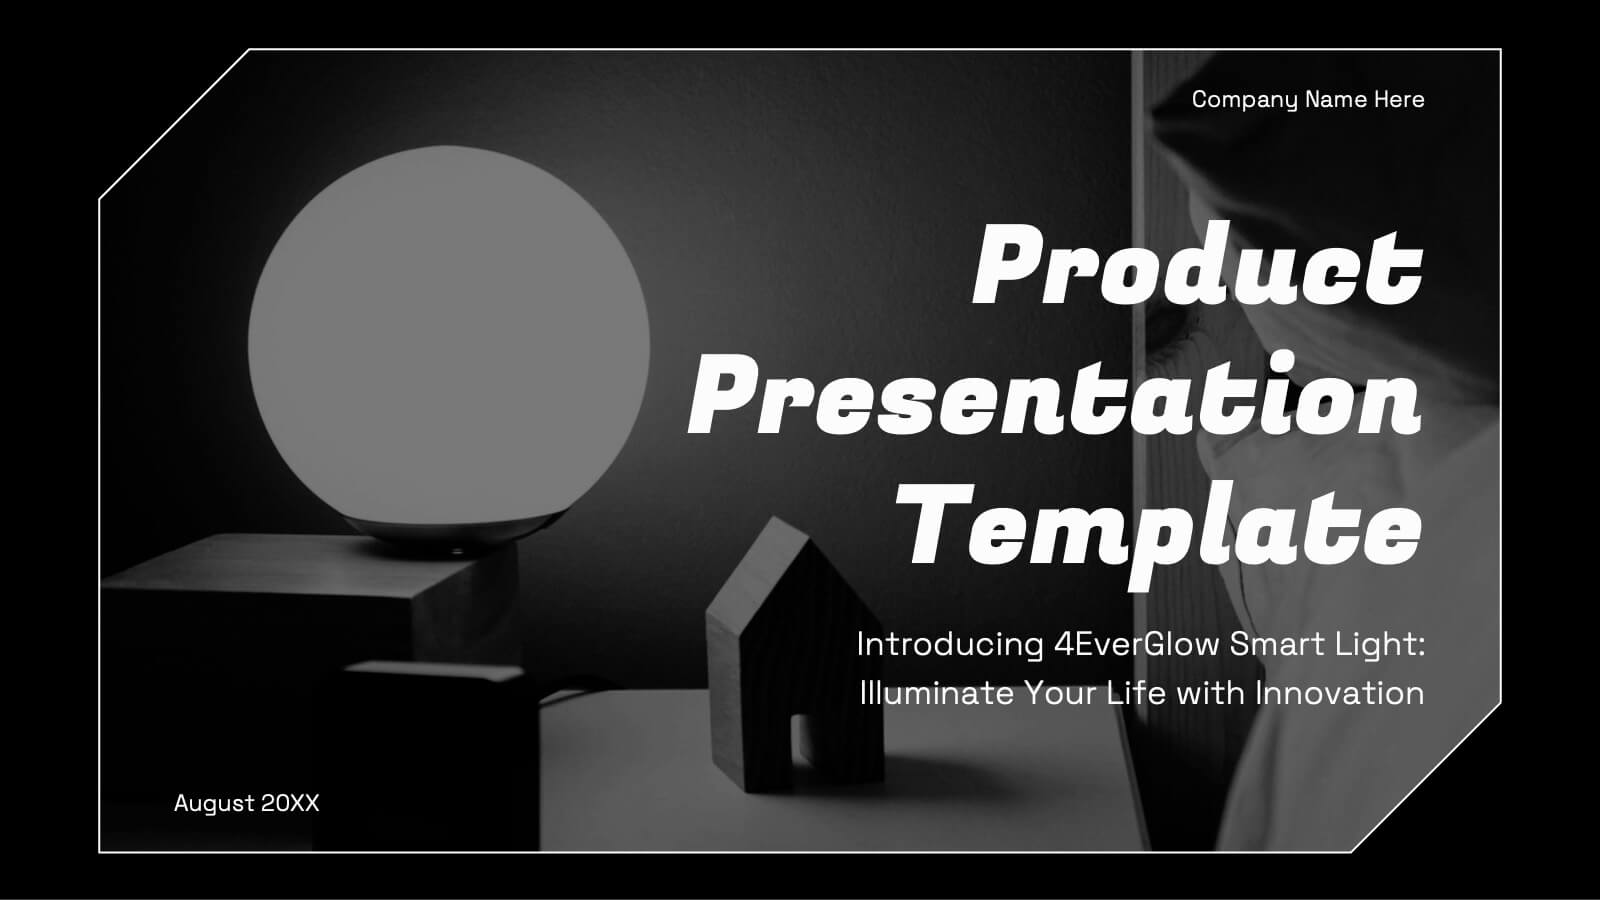
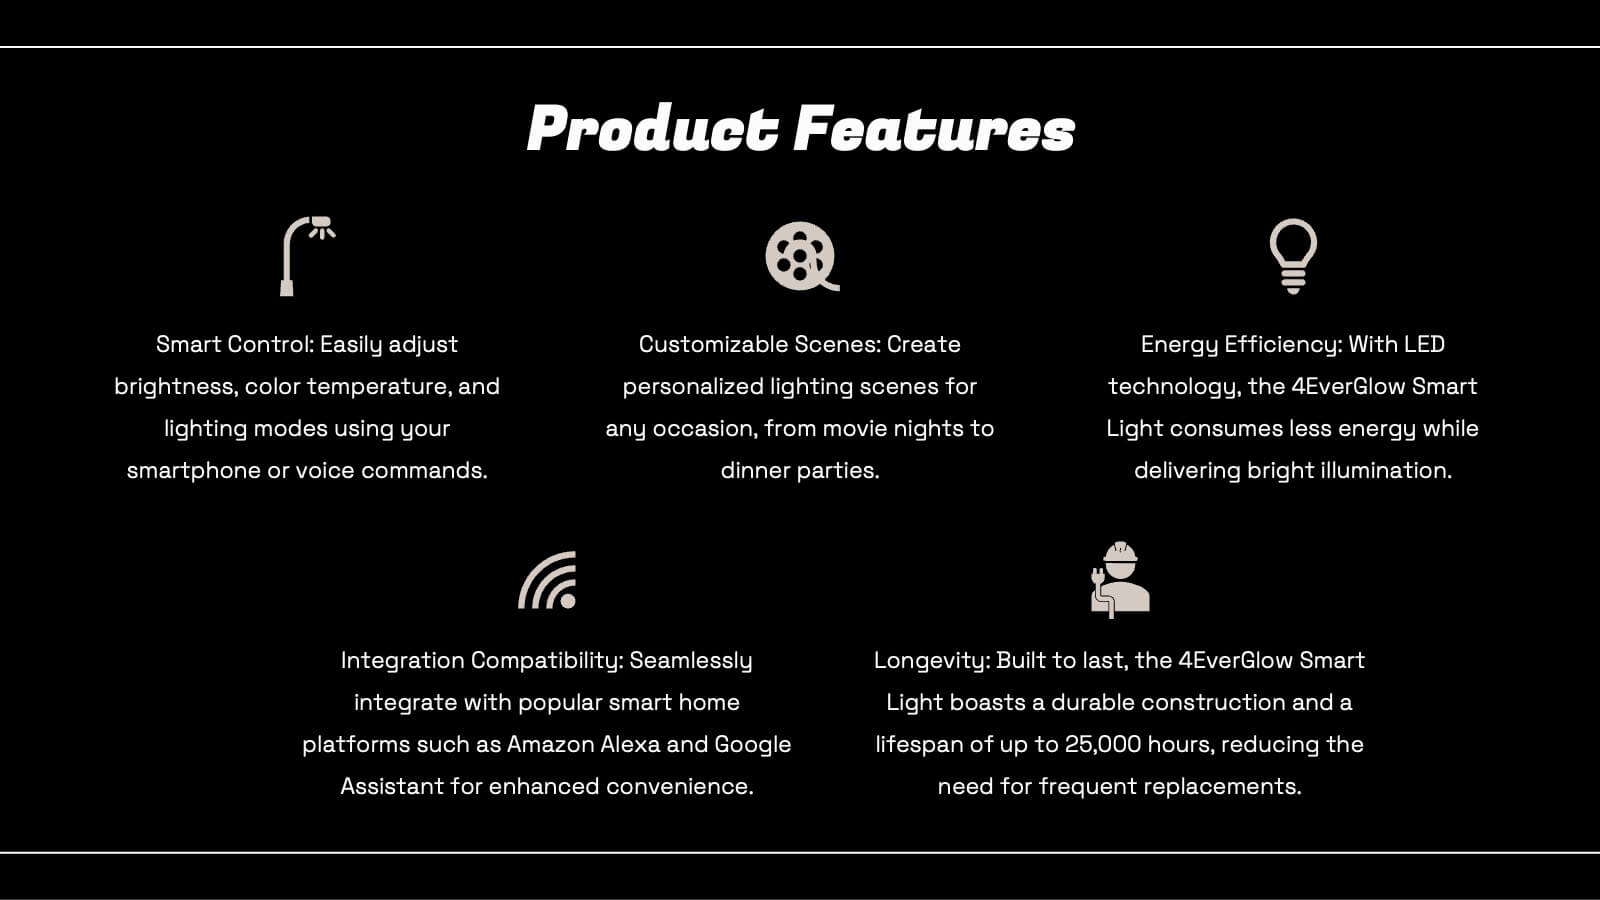
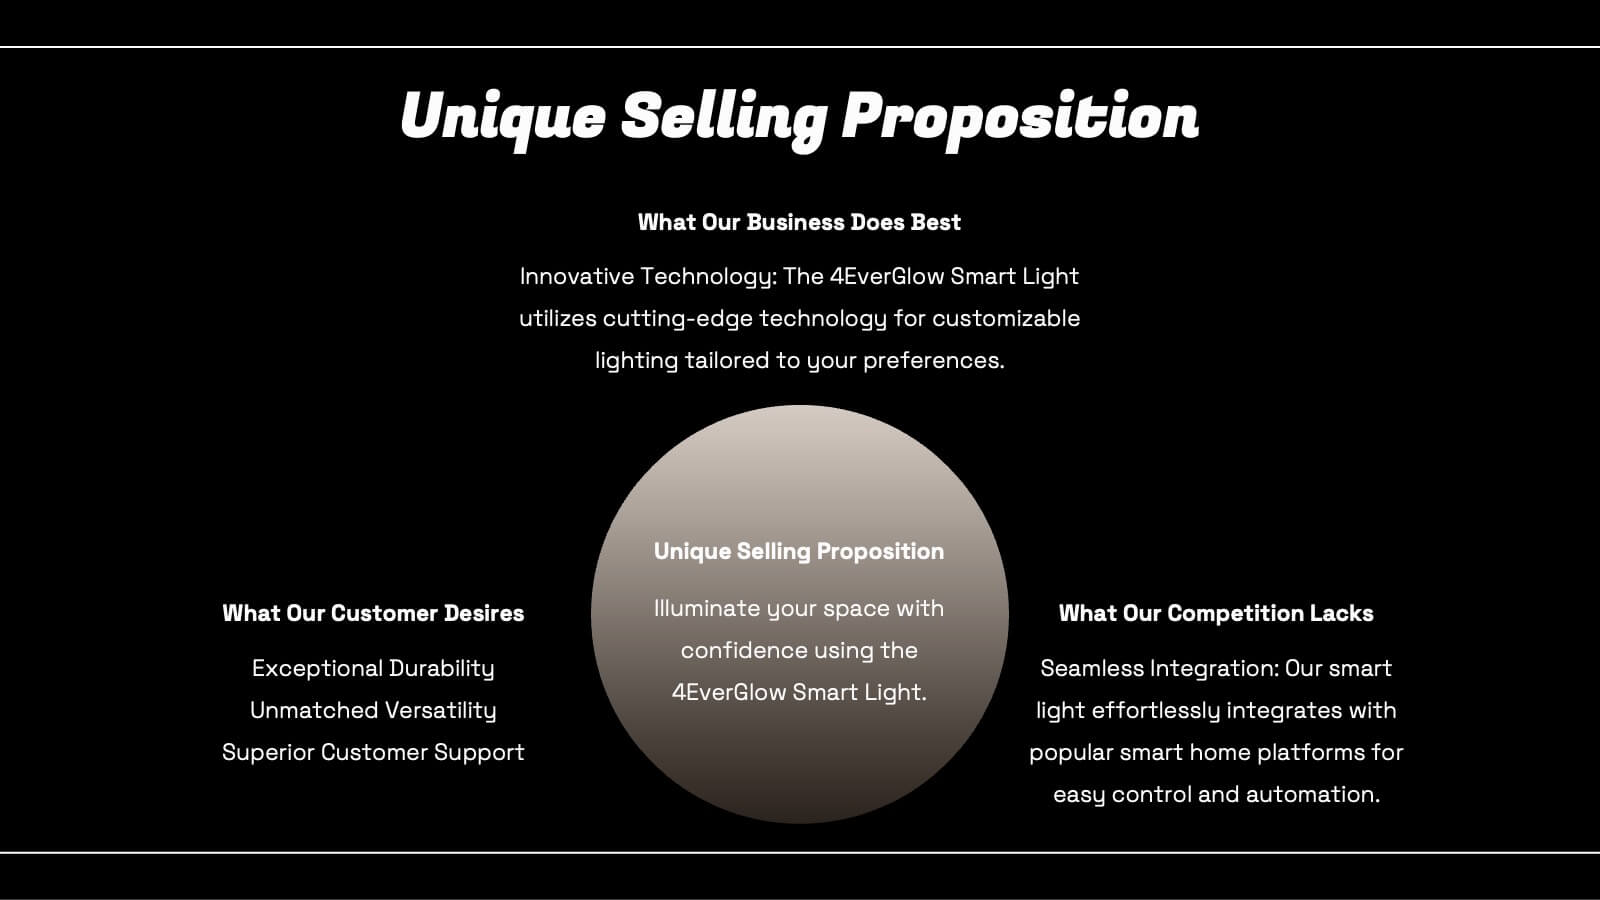
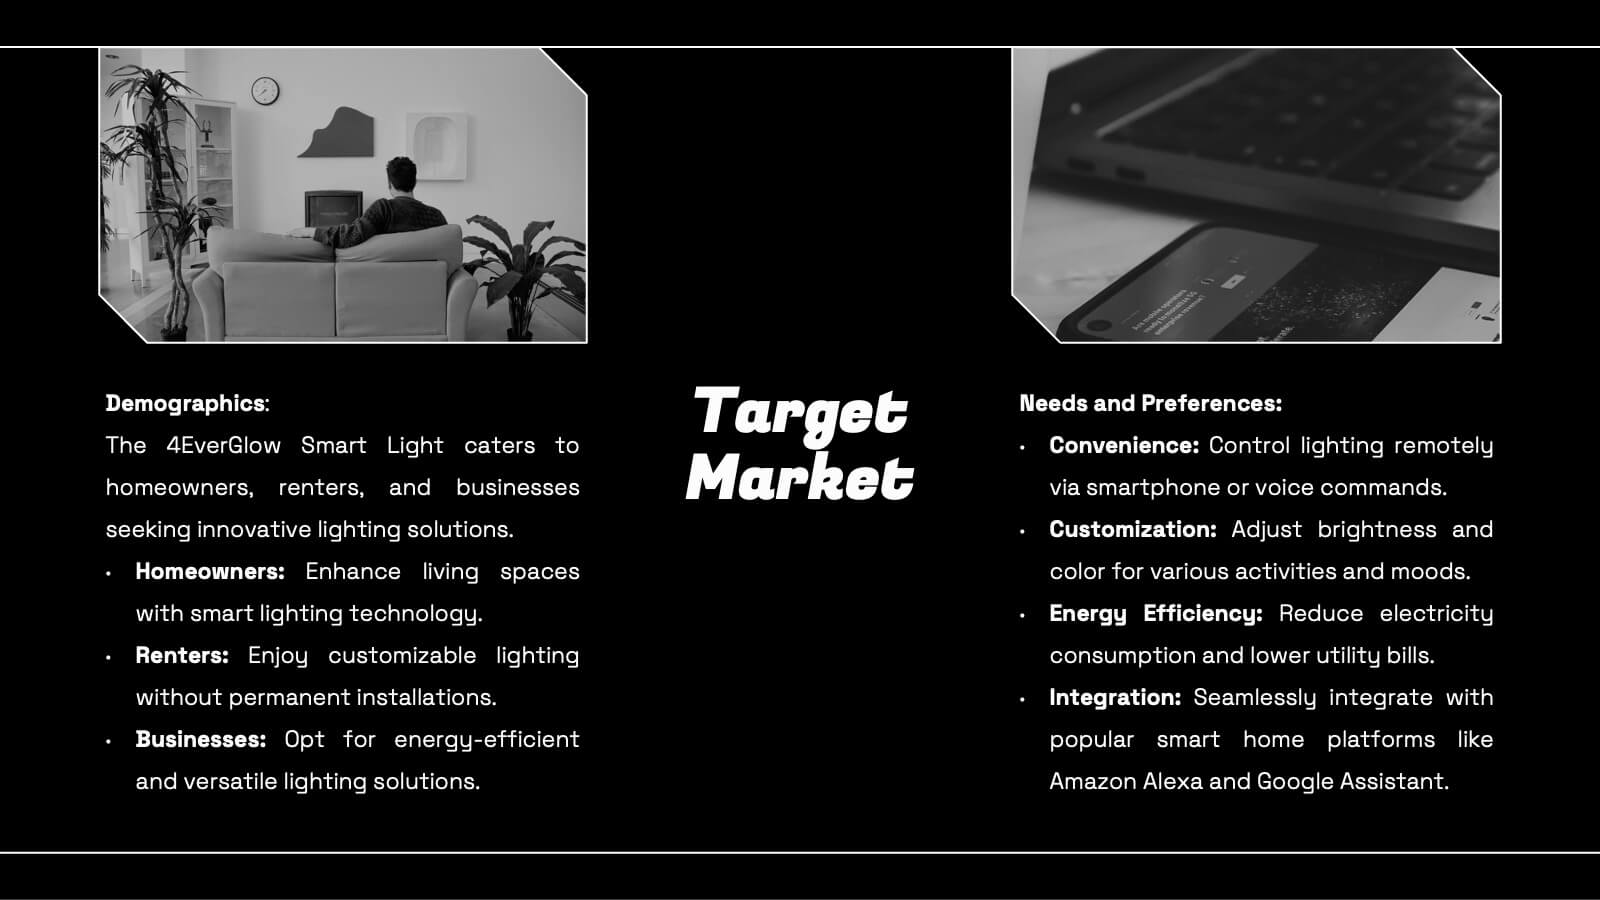
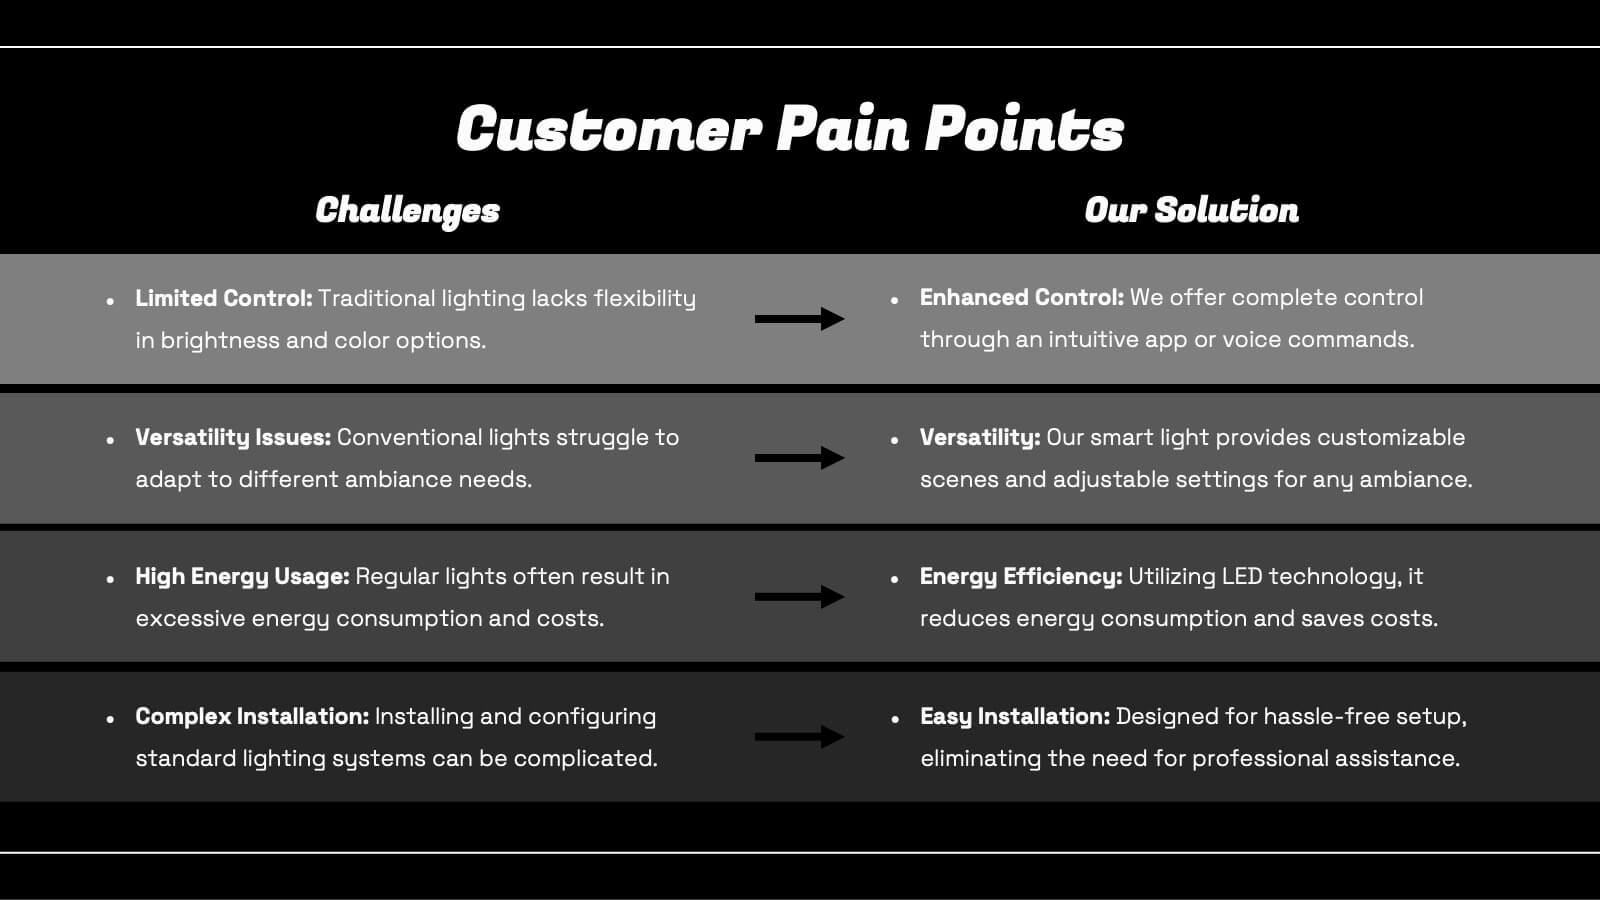
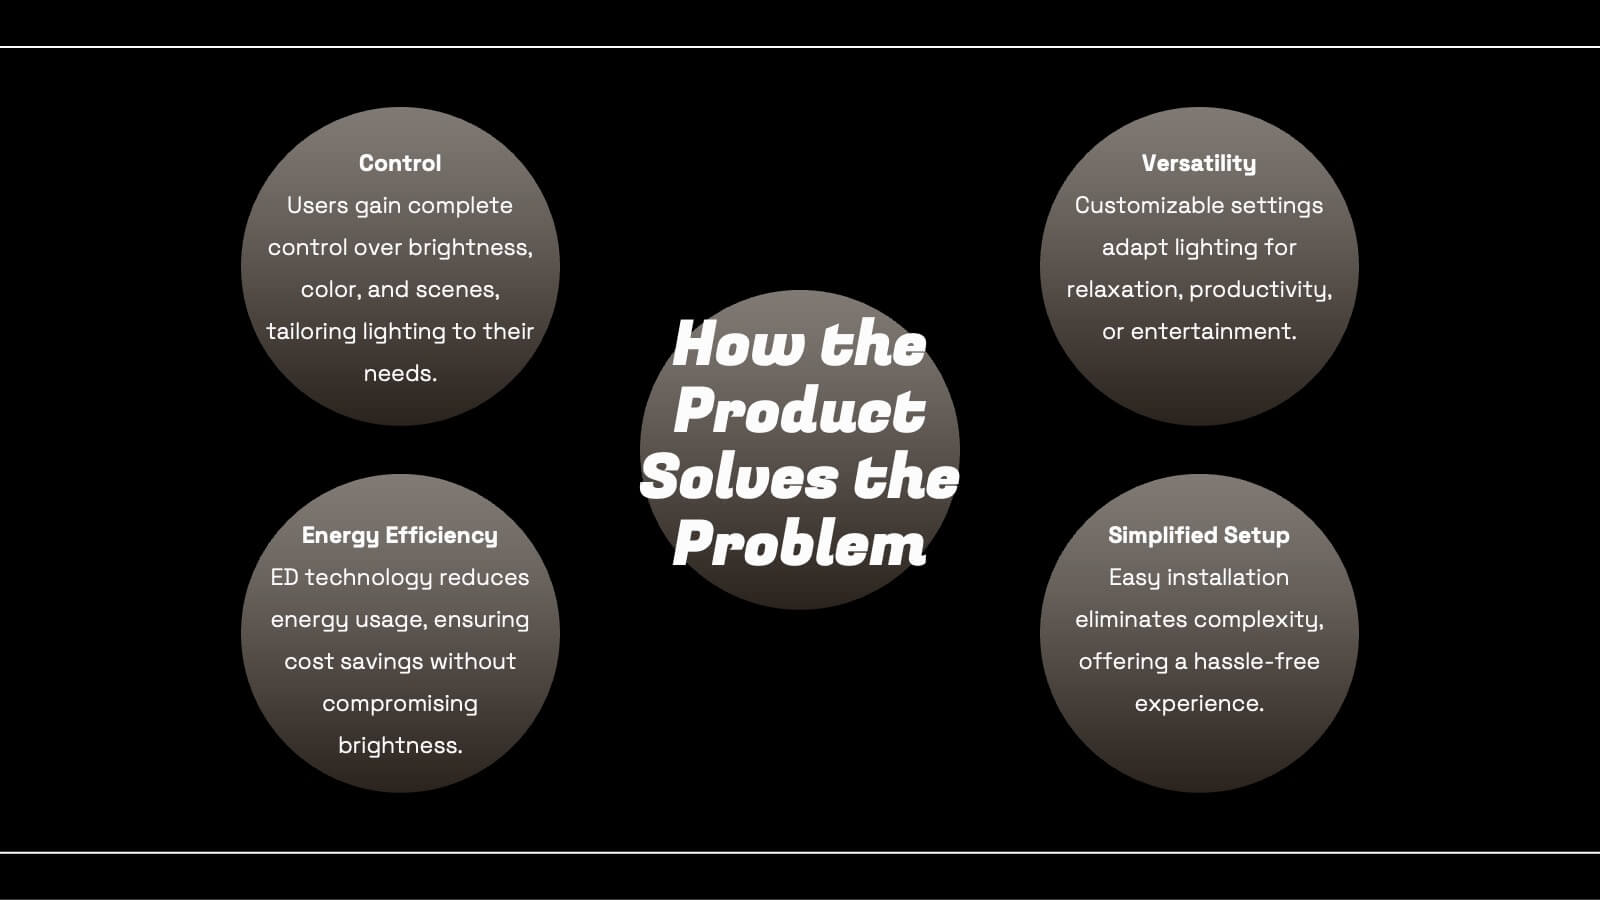
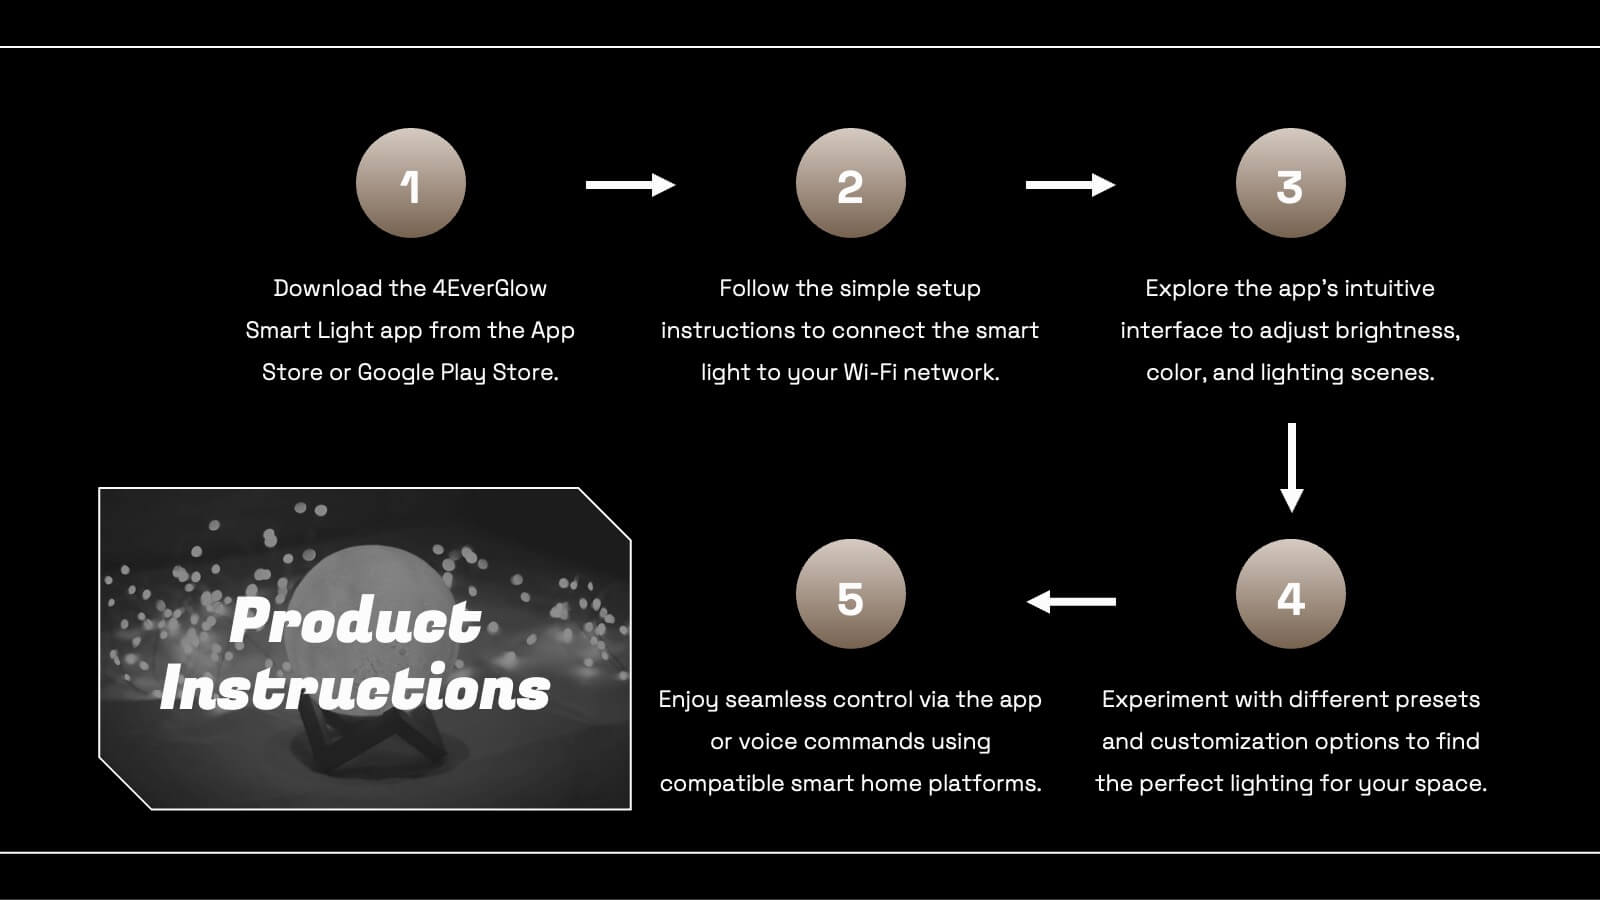
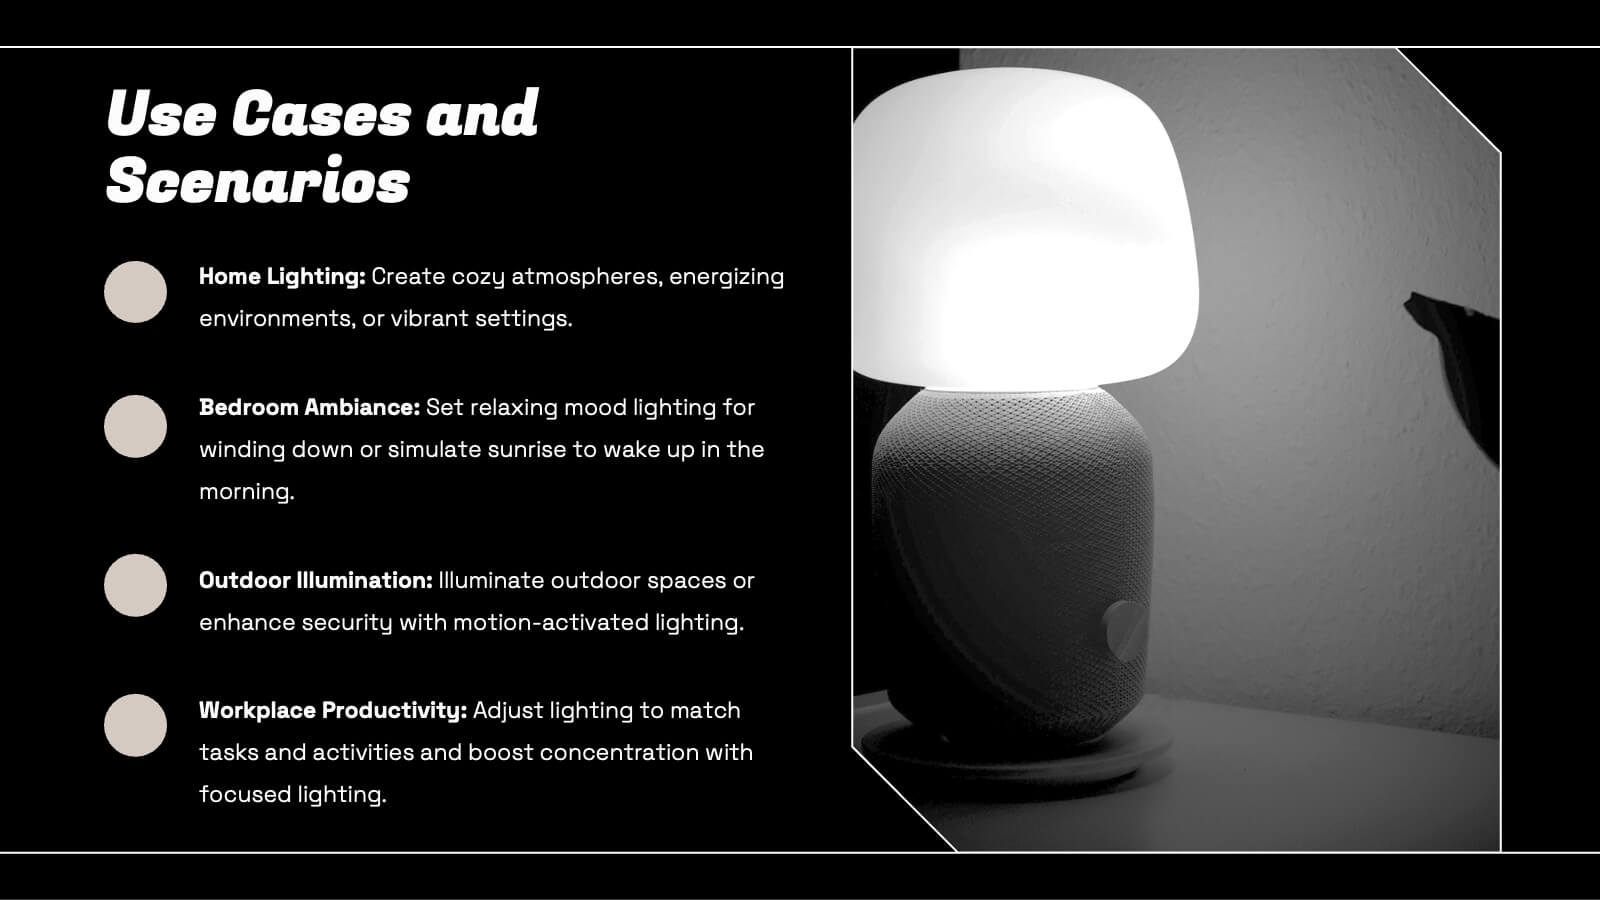
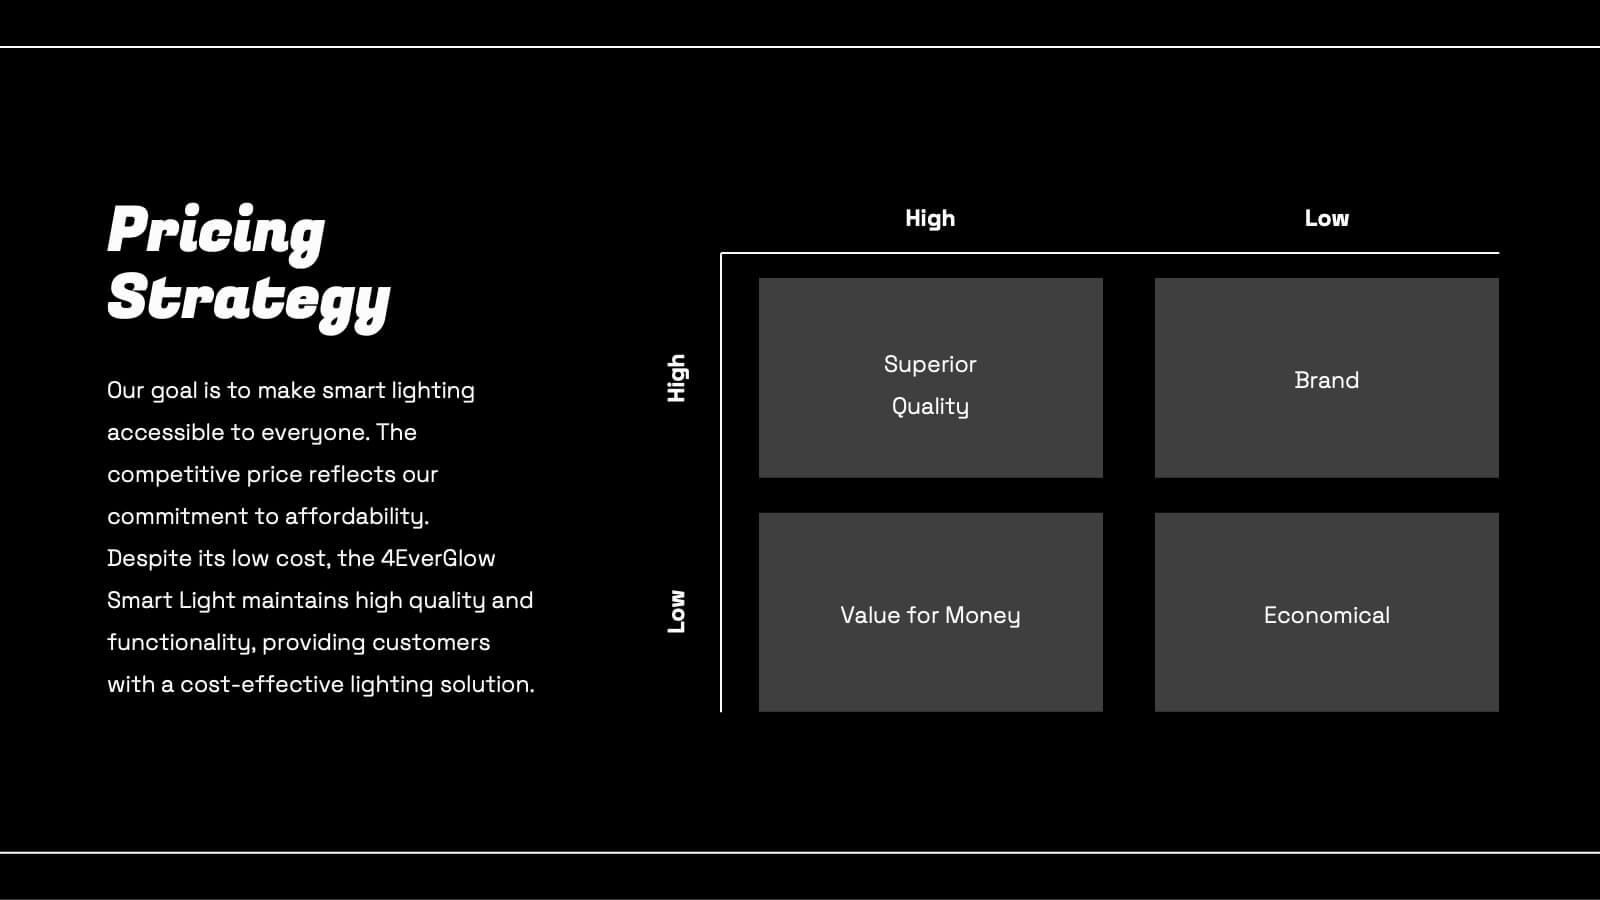
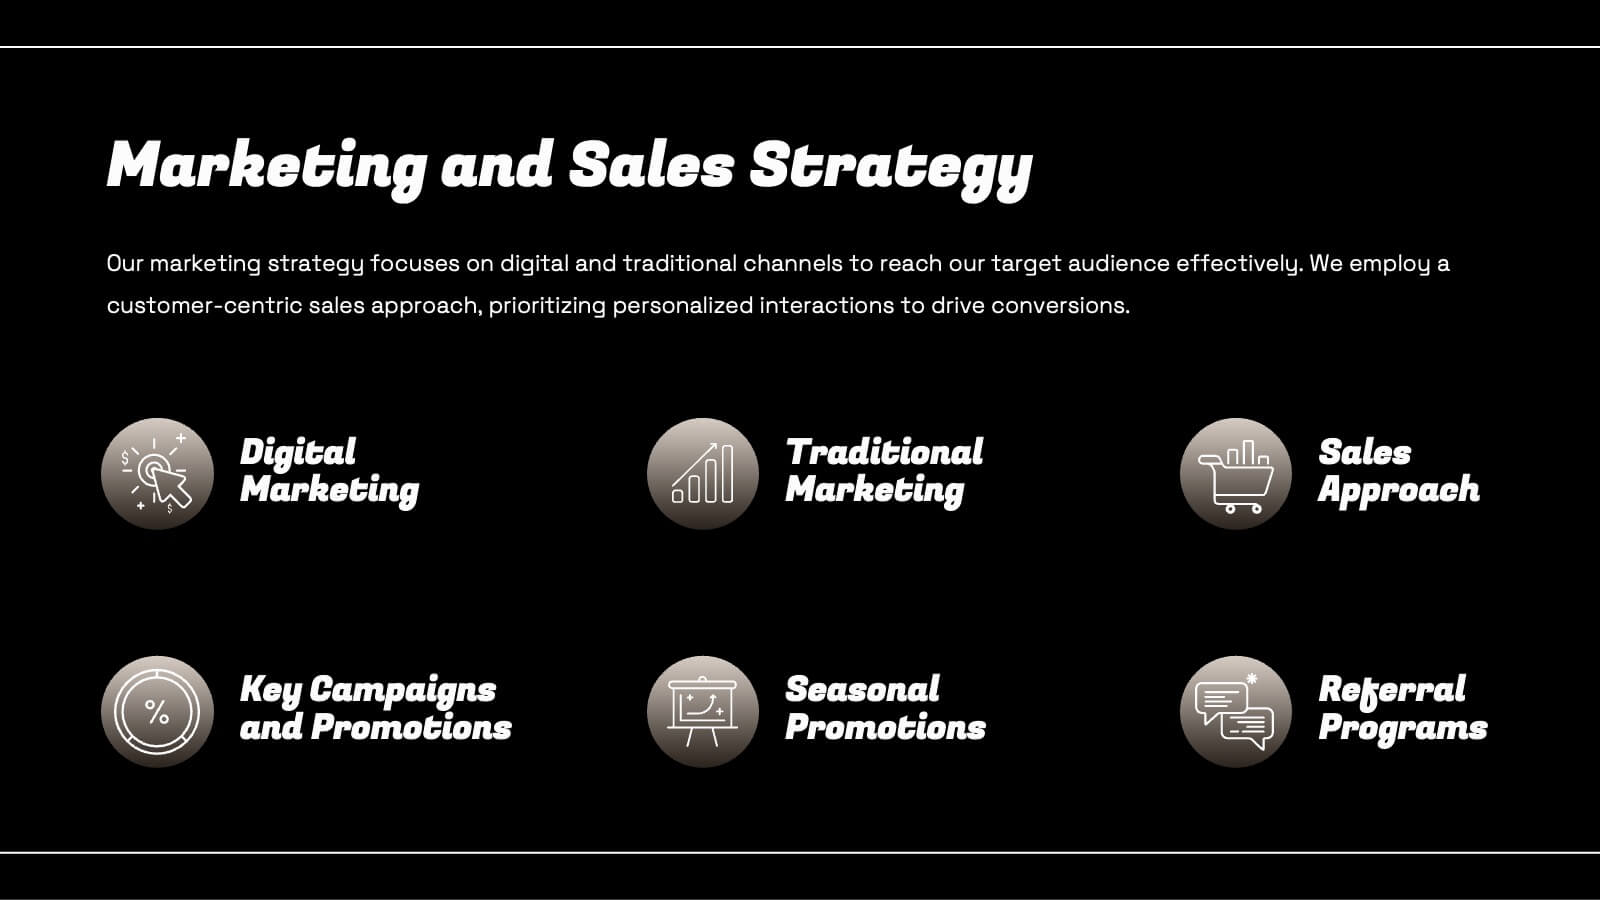
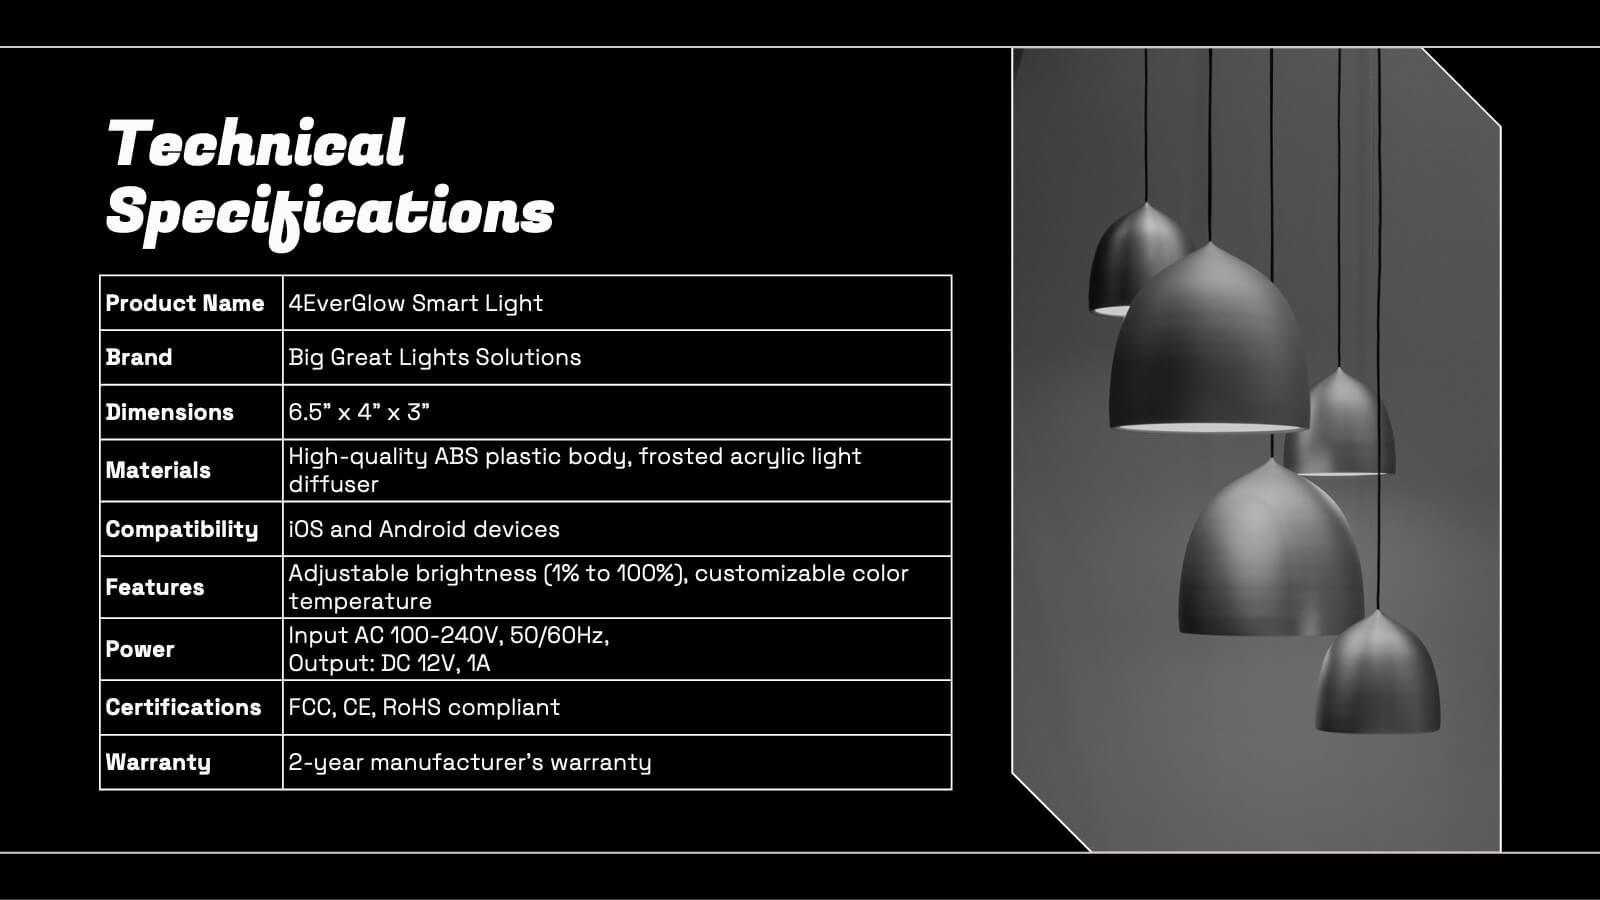
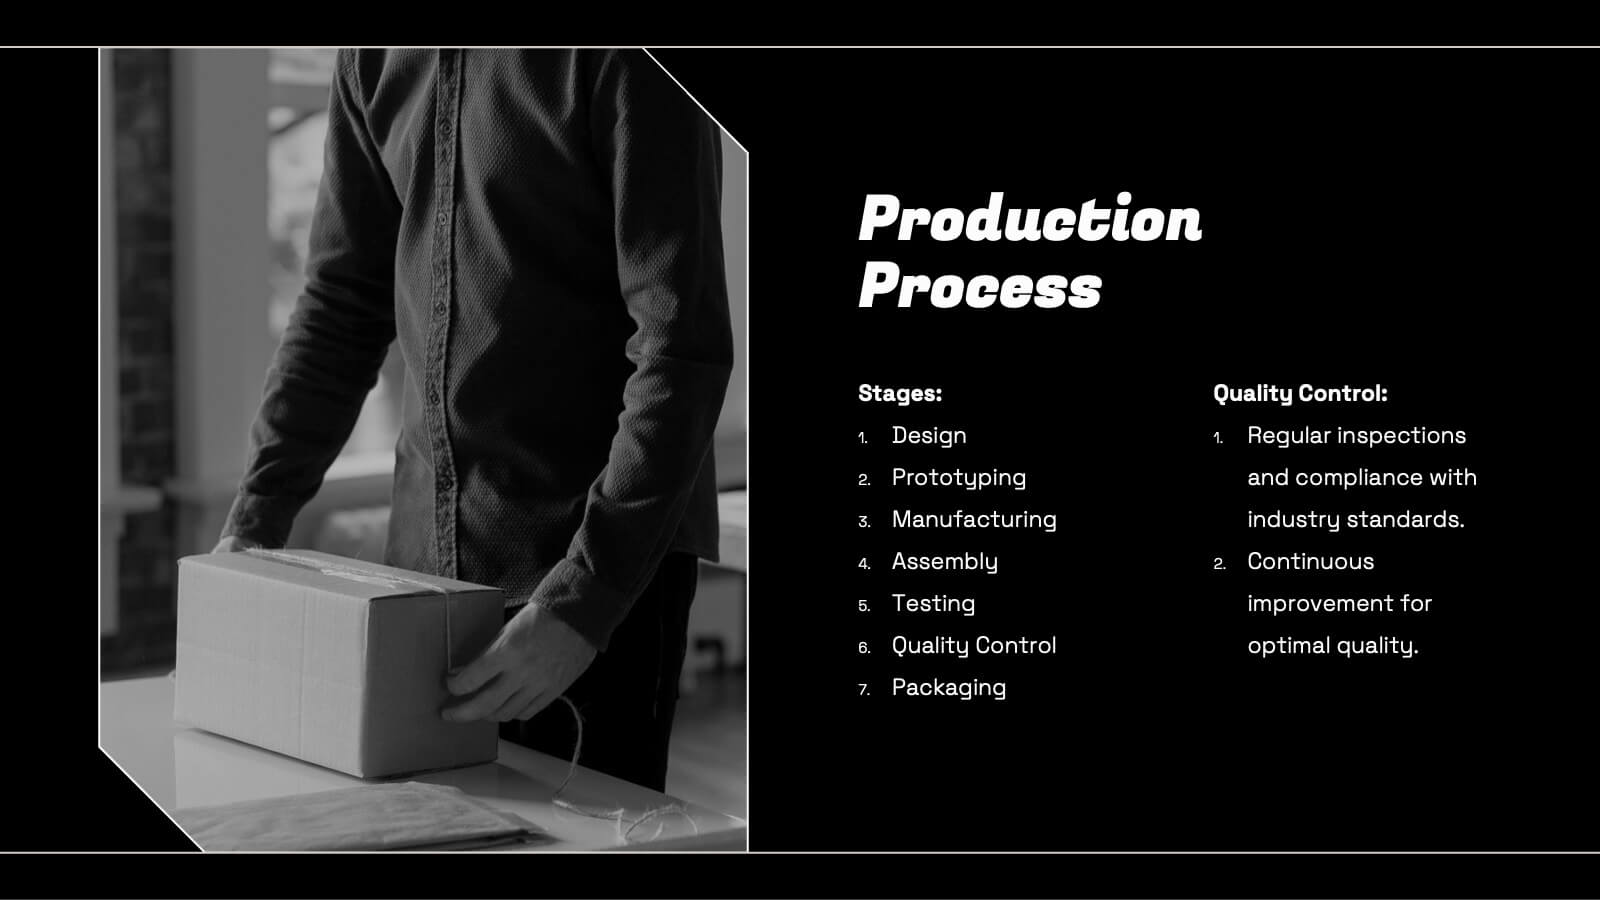
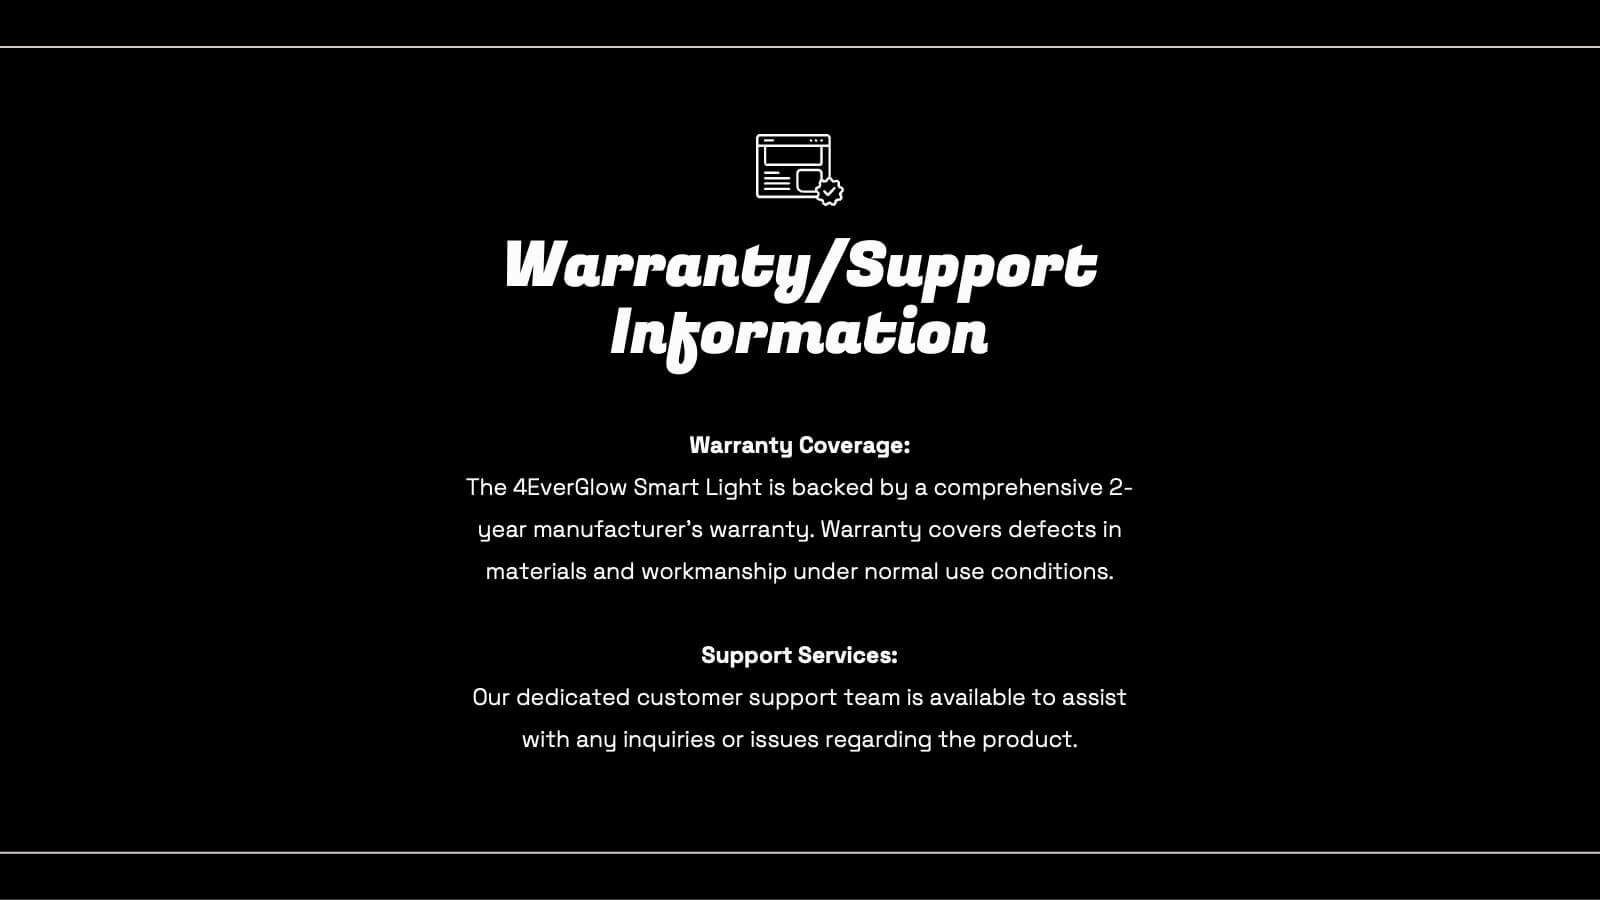
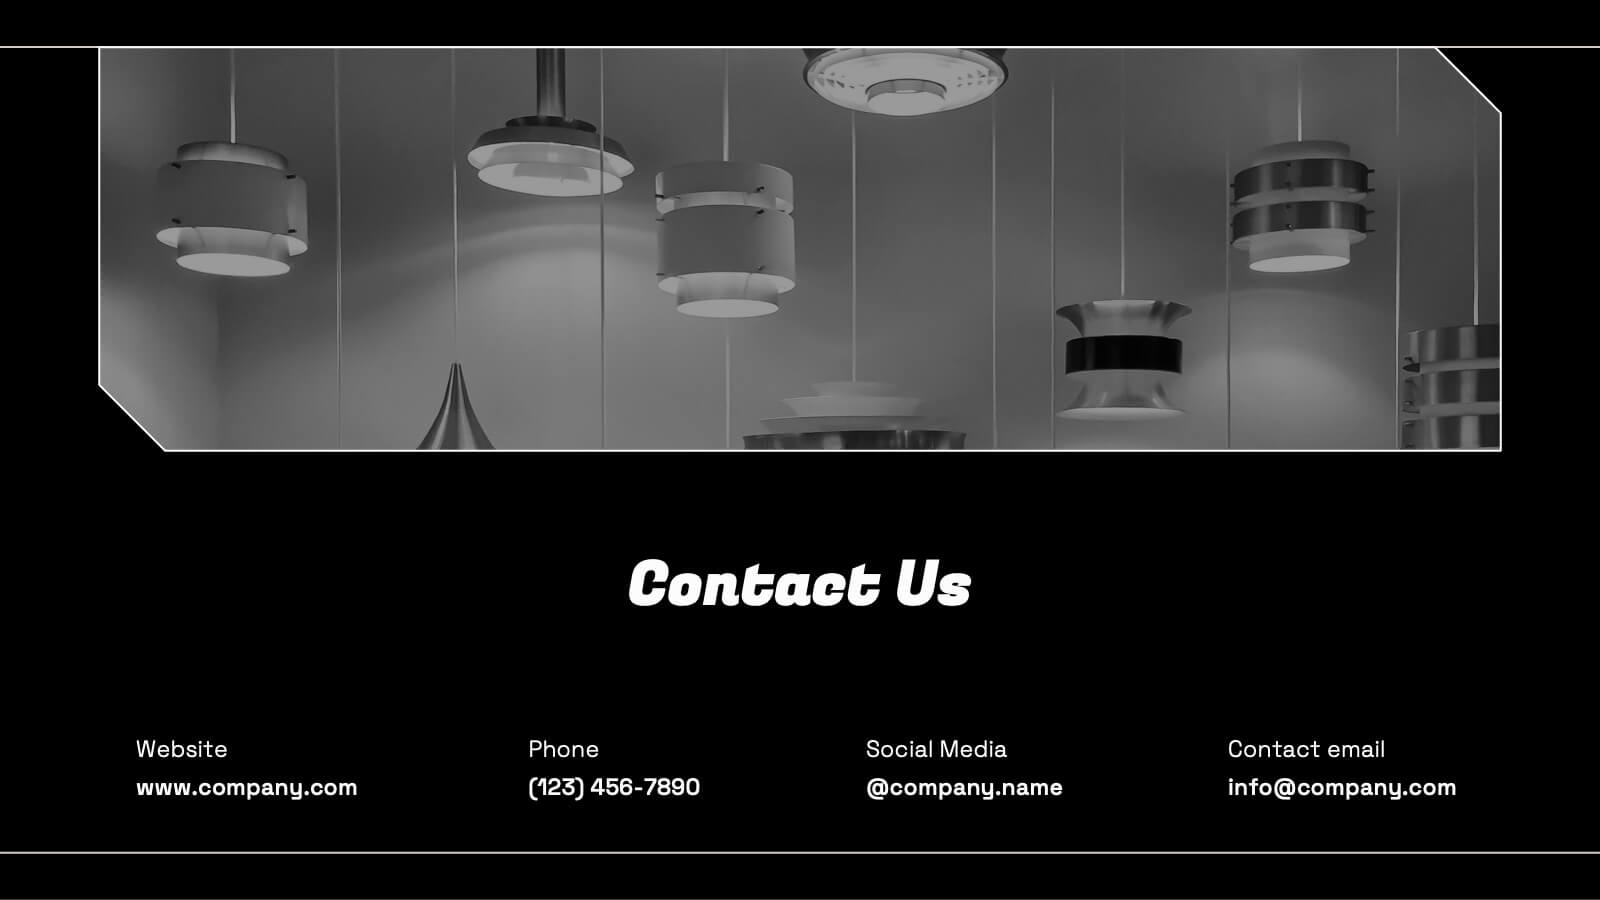
Smart Light Product Presentation
Enhance your product presentations with this Smart Lighting template. Designed for clarity and aesthetic appeal, it includes slides detailing product features, market analysis, technical specifications, and pricing strategies. Ideal for tech products, it's compatible with PowerPoint, Keynote, and Google Slides, ensuring broad accessibility and ease of use.


8 slides
Four-Step Business Strategy Presentation
Break down your plan into clear, actionable steps with the Four-Step Business Strategy Presentation. This structured template highlights key phases, ensuring an easy-to-follow visual representation of your strategy. Perfect for business planning, marketing, and project management. Fully customizable and compatible with PowerPoint, Keynote, and Google Slides.


5 slides
US State-by-State Sales Breakdown Presentation
Visualize regional performance with the US State-by-State Sales Breakdown Presentation. This slide uses a clean U.S. map layout to highlight state-specific sales metrics alongside color-coded legends and icons. Ideal for showcasing key market insights, regional trends, or territory growth. Fully editable in Canva, PowerPoint, and Google Slides.


6 slides
Internal Communication Framework Presentation
Foster stronger collaboration with this visual internal communication framework template. Ideal for showcasing how information flows within departments, this layout helps clarify messaging channels, responsibilities, and feedback loops. Whether you're streamlining communication strategies or presenting team structures, it’s fully editable and works seamlessly with PowerPoint, Keynote, and Google Slides.


10 slides
Data Security and Privacy Measures Presentation
Illustrate your protection protocols clearly with the Data Security and Privacy Measures presentation slide. Featuring a smartphone icon secured with lock, shield, and magnifying glass elements, this layout is ideal for communicating encryption policies, access controls, and compliance steps. Fully editable in PowerPoint, Keynote, and Google Slides.


4 slides
Strategic Planning Gap Assessment
Visualize growth opportunities with this Strategic Planning Gap Assessment template. Perfect for showcasing the gap between actual progression and potential performance over time. Ideal for risk evaluation, diversification, and product development planning. Fully editable for PowerPoint, Keynote, and Google Slides.


2 slides
Stylish Title Cover Presentation for Reports Presentation
Set the tone with a title slide that means business—without being boring. This stylish cover layout gives your report presentations a polished, modern look while keeping the focus clear and professional. Ideal for executive updates or client-facing decks, it’s fully editable and works perfectly in PowerPoint, Keynote, and Google Slides.


20 slides
Egeria Artist Portfolio Presentation
Showcase your artistry with this vibrant portfolio template, featuring sections for project displays, creative process, awards, and testimonials. Perfect for artists seeking a polished presentation of their work. Customizable and suitable for PowerPoint, Keynote, and Google Slides, this template highlights your unique style and professional journey.