


Features
- 5 Unique slides
- Fully editable and easy to edit in Microsoft Powerpoint, Keynote and Google Slides
- 16:9 widescreen layout
- Clean and professional designs
- Export to JPG, PDF or send by email


Do you have any questions?
Recommend


20 slides
Venus Design Proposal Presentation
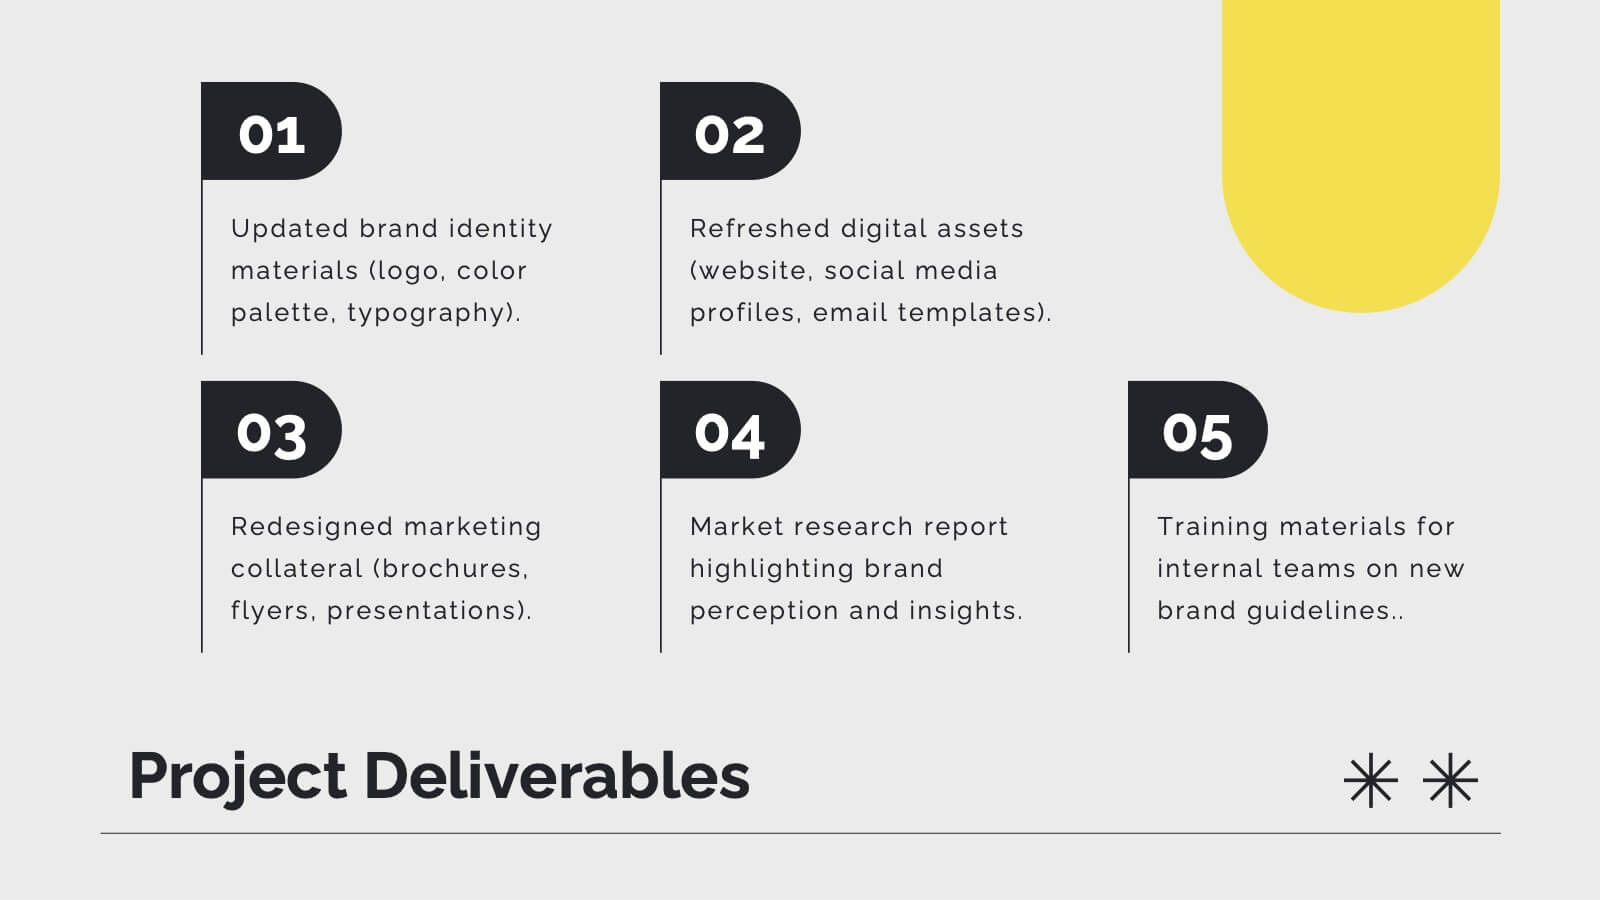
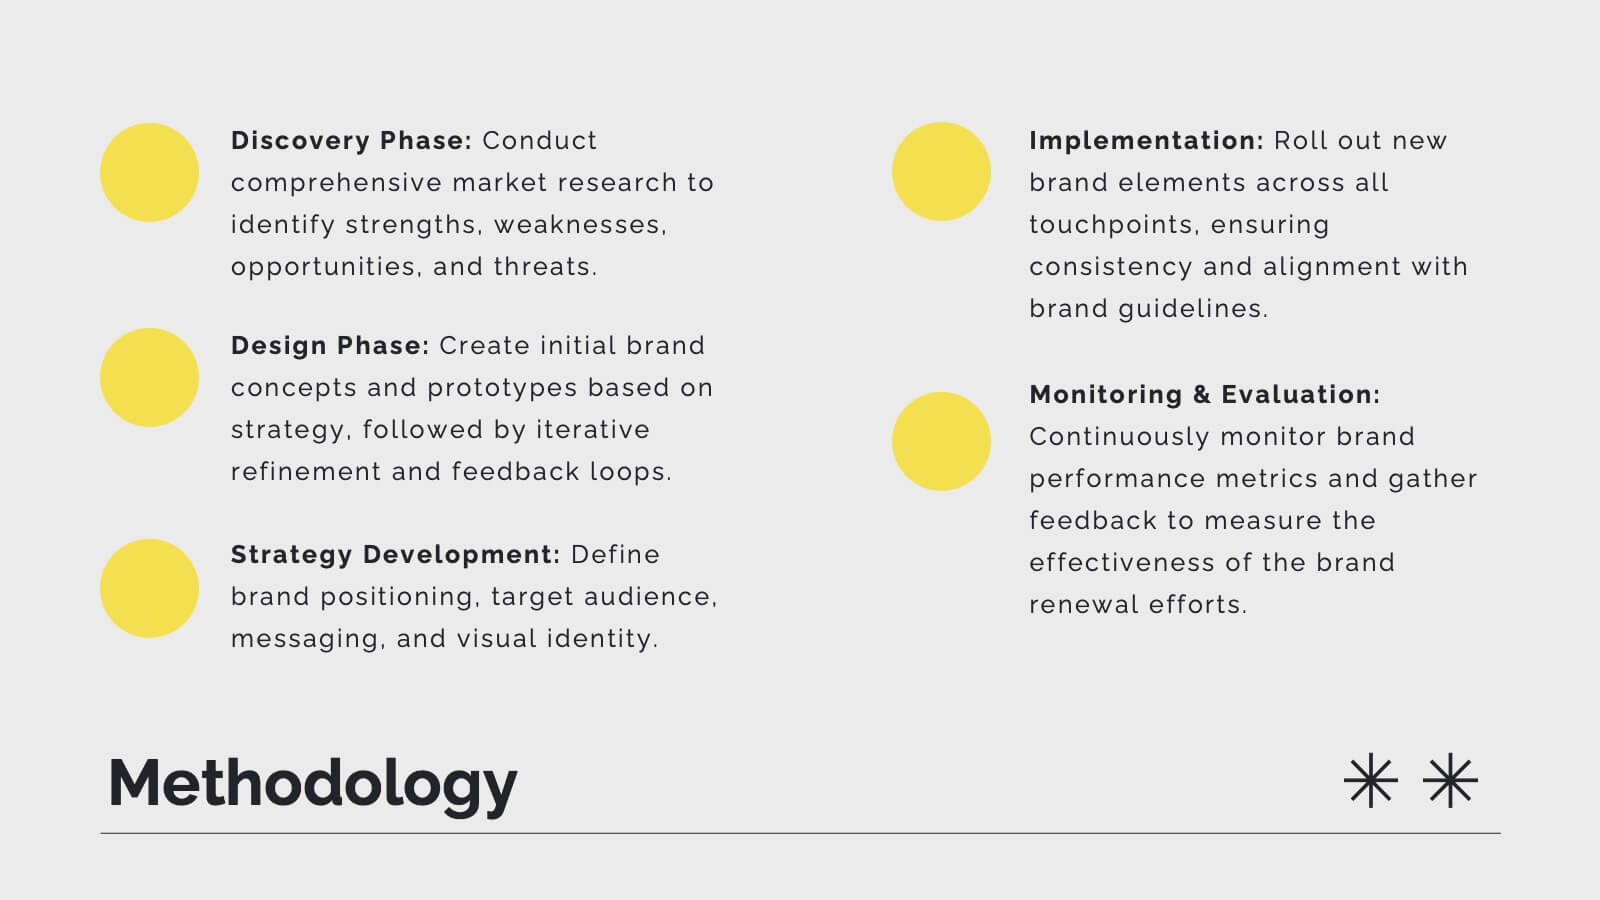
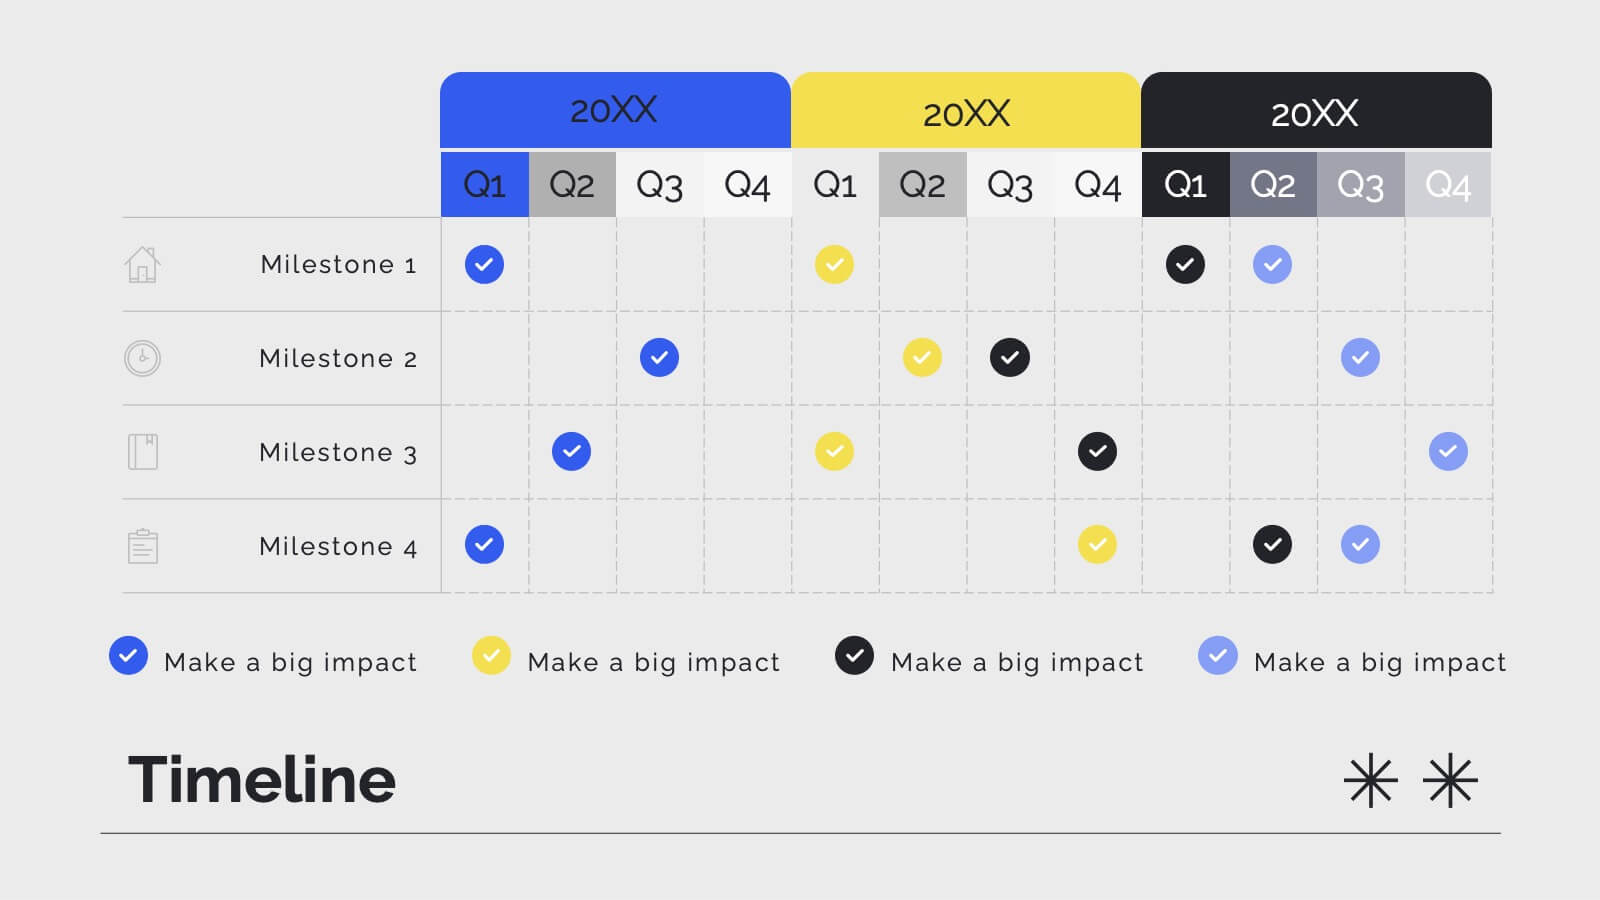
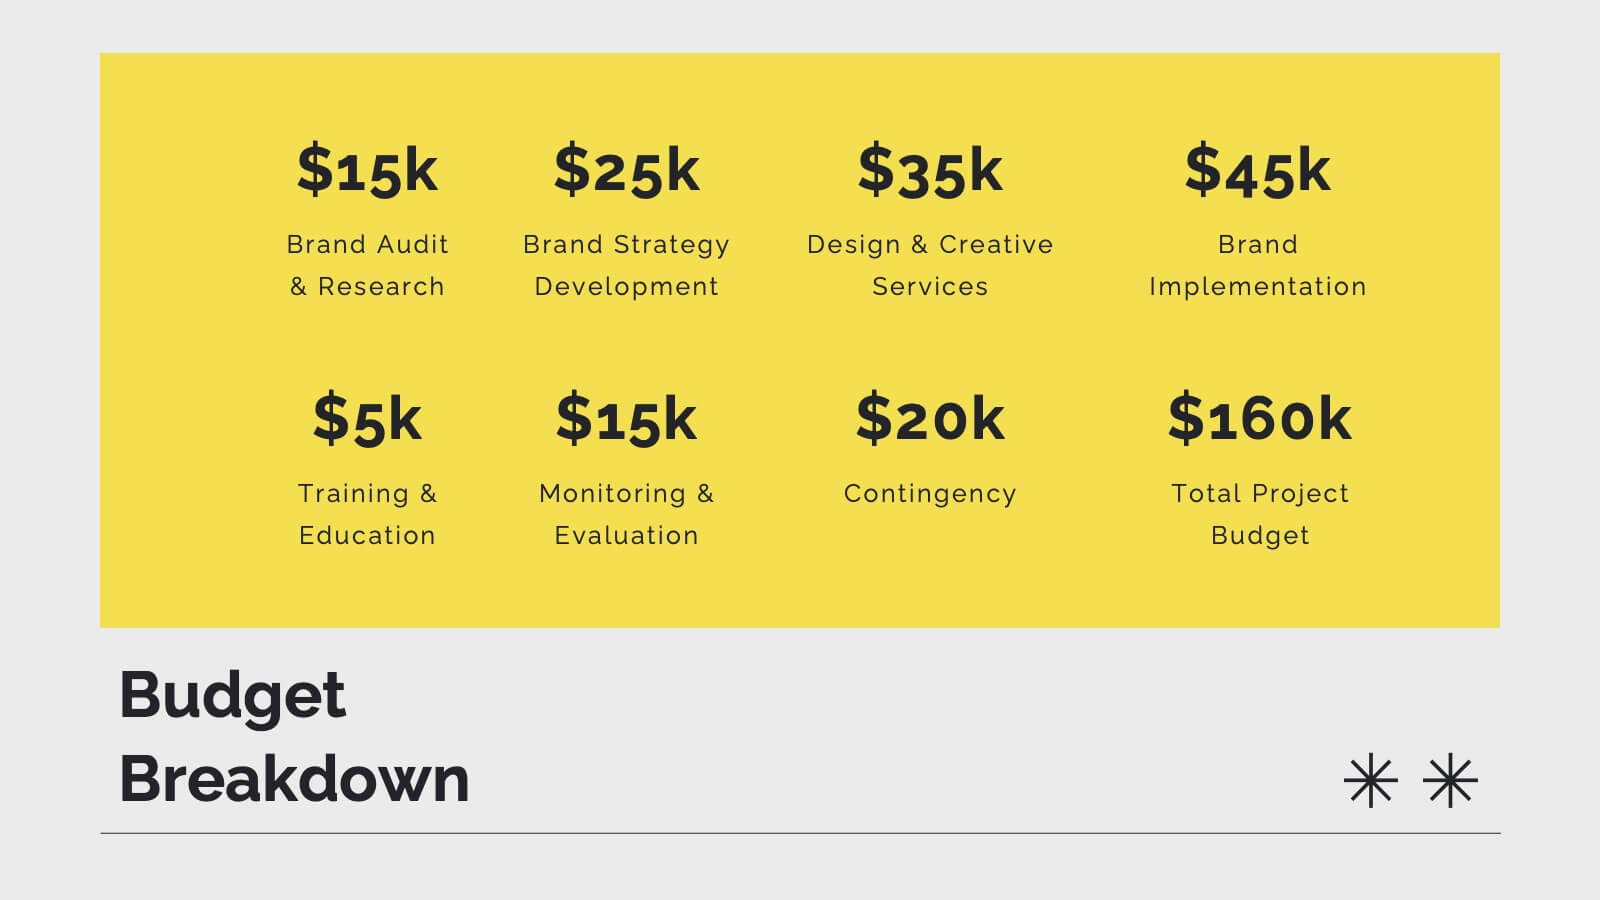
Present your design proposal with confidence using this sleek and professional layout! It includes everything from problem statements and proposed solutions to budget breakdowns, milestones, and team expertise, ensuring every detail is covered. Ideal for client presentations or internal project pitches, this template is fully compatible with PowerPoint, Keynote, and Google Slides.


7 slides
Skills Gap Report Infographic
A skills gap analysis is a systematic assessment of the difference between the skills or competencies that an individual, a team, or an organization currently possess and the skills they need to meet specific objectives or requirements. This infographic template is meticulously designed to present a deep analysis of the skills gap within an organization or industry, offering solutions and pathways to cultivate a skilled workforce. Compatible with Powerpoint, Keynote, and Google Slides. Highlight the skills that are in high demand, providing a clear understanding of where the gap exists.


4 slides
Team Collaboration Strategy
Illustrate cross-functional teamwork with this visually engaging slide. Featuring color-coded team clusters, it's perfect for showcasing group dynamics, collaborative workflows, or project responsibilities. Use this diagram to break down organizational units, collaboration models, or department contributions. Fully editable in PowerPoint, Keynote, and Google Slides.


4 slides
Workplace Collaboration and Team Scenes Presentation
Bring your teamwork story to life with this vibrant, arrow-based layout that guides the viewer through four clear steps. Perfect for visualizing collaboration strategies, team roles, or task flow, this template balances clean design with helpful icons. Easily customize it in PowerPoint, Keynote, or Google Slides for a polished presentation.


6 slides
Growth Through Lifelong Learning Presentation
Visualize personal or organizational development with this creative lifelong learning slide. Featuring a human head silhouette and puzzle piece graphics, it's perfect for illustrating stages of learning, training programs, or growth mindset principles. Fully editable in PowerPoint, Keynote, and Google Slides—ideal for educators, coaches, or corporate development professionals.


7 slides
Lean Business Model Infographic
Step into the dynamic world of lean startup methodology with our lean business model infographic. Utilizing a striking palette of oranges, blacks, and other vivid colors, this infographic simplifies the intricate components of the lean canvas. It's an invaluable asset for entrepreneurs, business educators, and startup enthusiasts. By offering a bird's-eye view of a startup's proposition, it ensures stakeholders align their strategies efficiently. Regardless of the platform - be it PowerPoint, Keynote, or Google Slides - this infographic seamlessly adapts, enhancing your presentation's professional appeal.


8 slides
Sustainable Operation & Ethical Practice Presentation
Illustrate your ethical initiatives and operational sustainability with this water drop flow diagram. Ideal for outlining four key actions or principles, it features a faucet visual and icon-based content drops. Fully customizable in PowerPoint, Keynote, and Google Slides—perfect for ESG reporting, CSR updates, and eco-conscious business presentations.


5 slides
Business Hierarchy Pyramid Presentation
Present your business structure or priorities with clarity using our "Business Hierarchy Pyramid Presentation" template. This infographic elegantly segments different layers or levels within your organization, project, or planning strategy, with a pyramid design that visually emphasizes the foundational to advanced stages. Each level of the pyramid is distinctly colored and labeled, allowing you to easily insert key points or data relevant to each segment. Ideal for corporate presentations, strategic meetings, and management training, this template ensures your key concepts are organized and clearly communicated. Compatible with PowerPoint, Keynote, and Google Slides, it integrates effortlessly into your professional toolkit.


6 slides
Cultural Ecology Infographics
The "Cultural Ecology" infographic template is an insightful and captivating tool, expertly tailored for PowerPoint, Keynote, and Google Slides. This template is a valuable resource for anthropologists, environmentalists, and educators aiming to showcase the intricate relationship between human cultures and their environments in a visually compelling way. This template elegantly maps out the principles of cultural ecology, illustrating how cultural practices, societal developments, and environmental factors are interwoven. It highlights key concepts such as adaptation, sustainability, and the impact of human activities on ecosystems. The layout is designed to facilitate a deep understanding of the ways in which human cultures shape and are shaped by their natural surroundings. The design is as rich and diverse as the field it represents, with a color scheme that echoes the vibrancy of different cultures and the richness of various ecosystems. This not only makes the presentation visually striking but also reinforces the interconnectedness of culture and ecology. Whether used in academic lectures, environmental conferences, or cultural exhibitions, this template ensures that the complex and fascinating world of "Cultural Ecology" is presented in an engaging, educational, and visually arresting manner.

21 slides
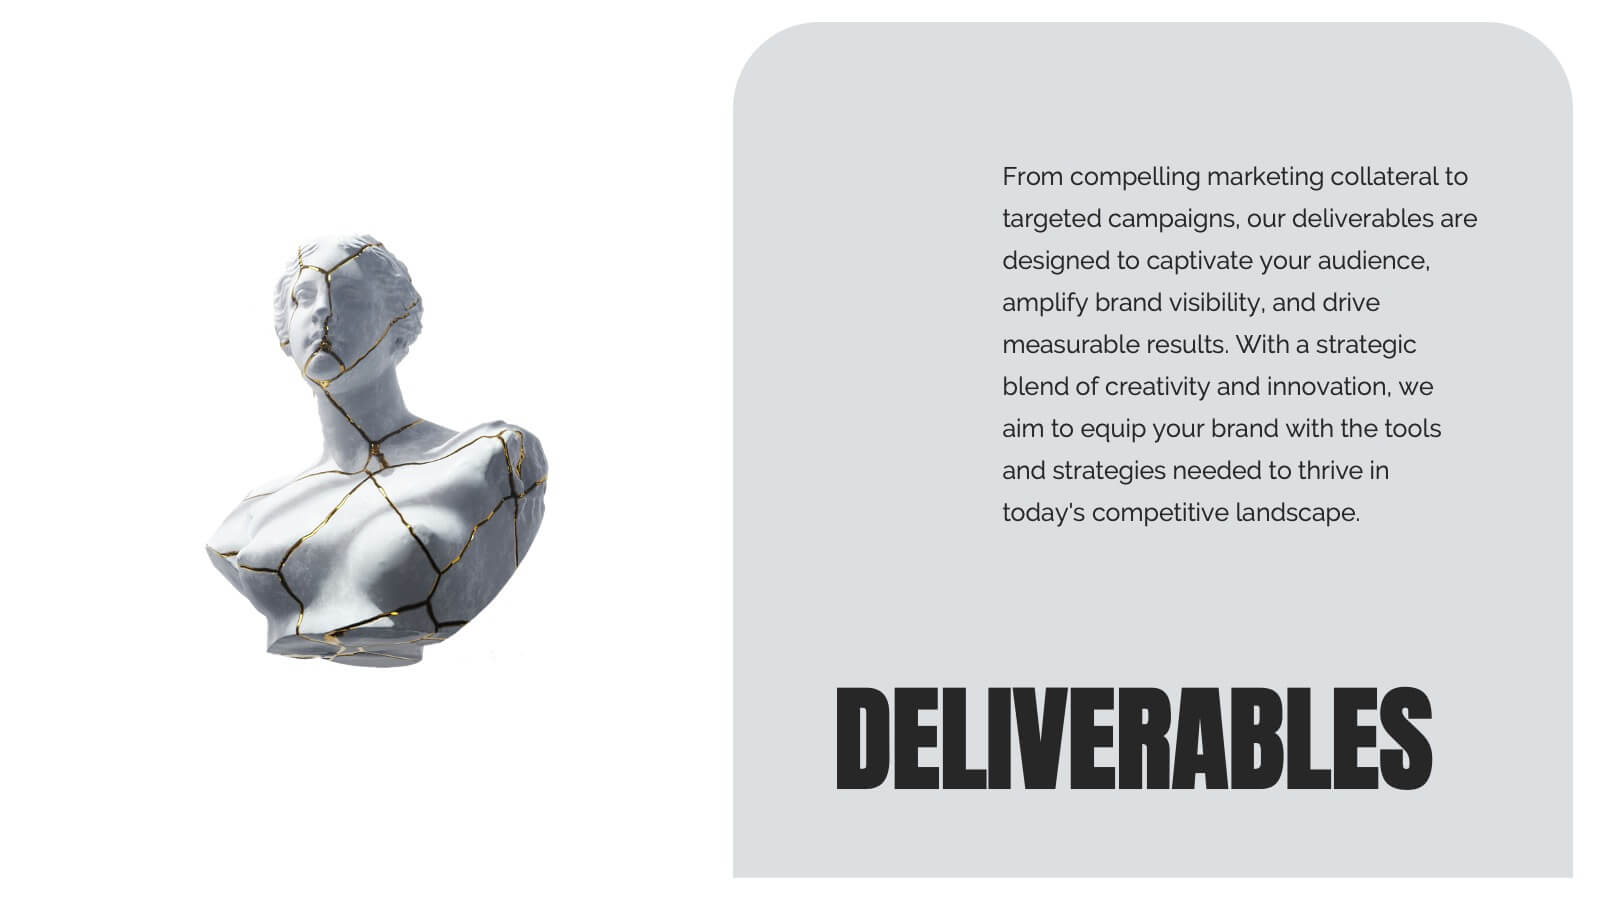
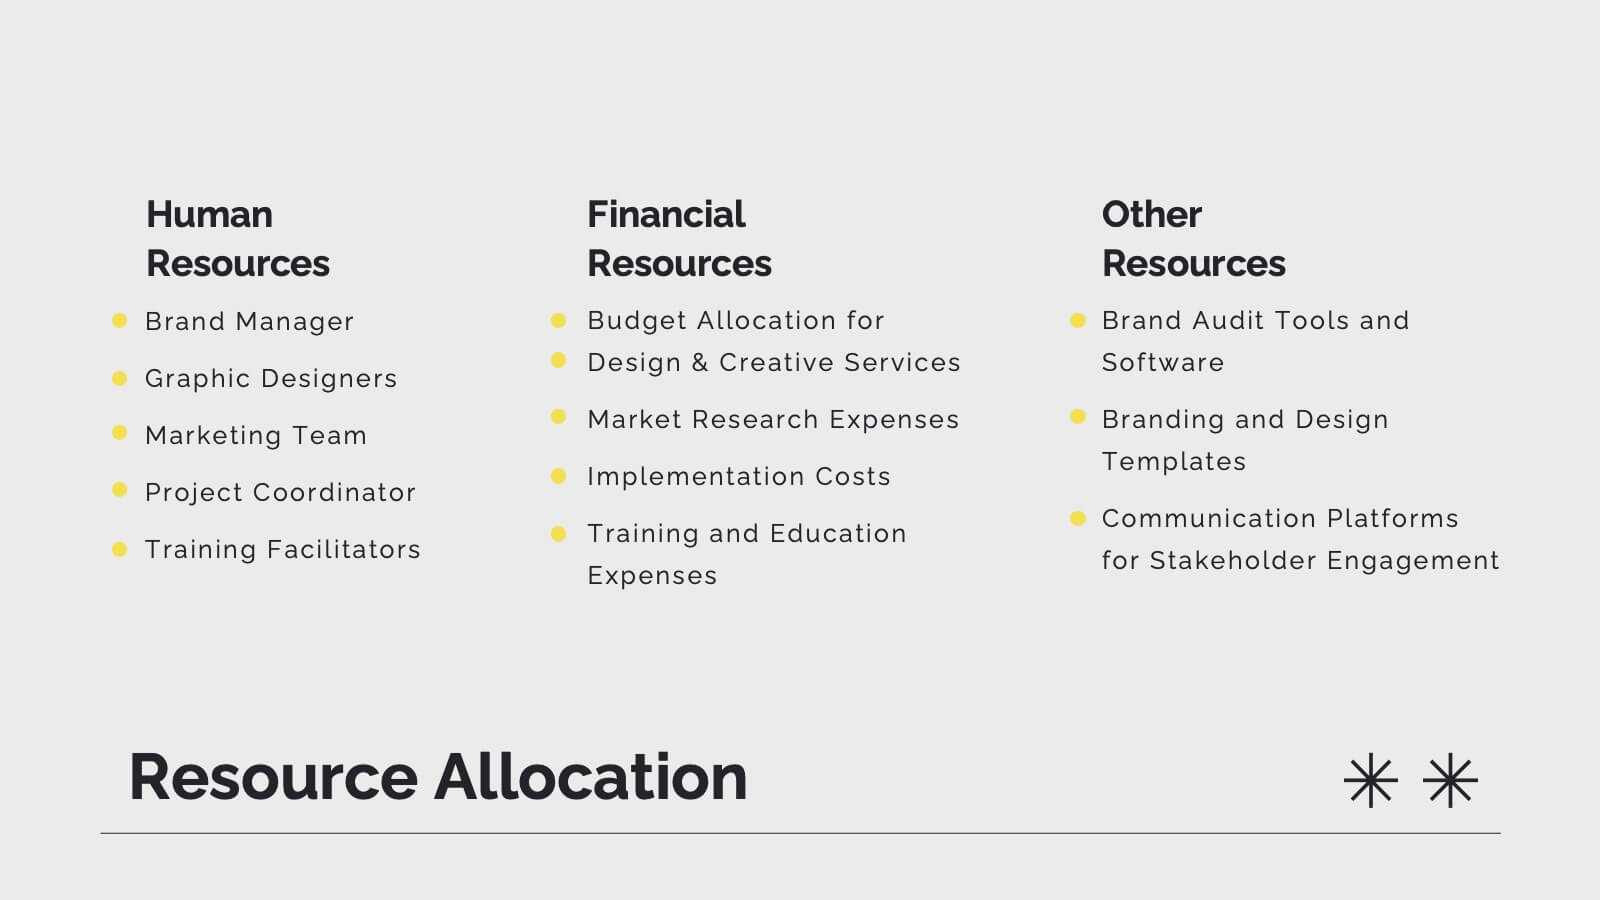
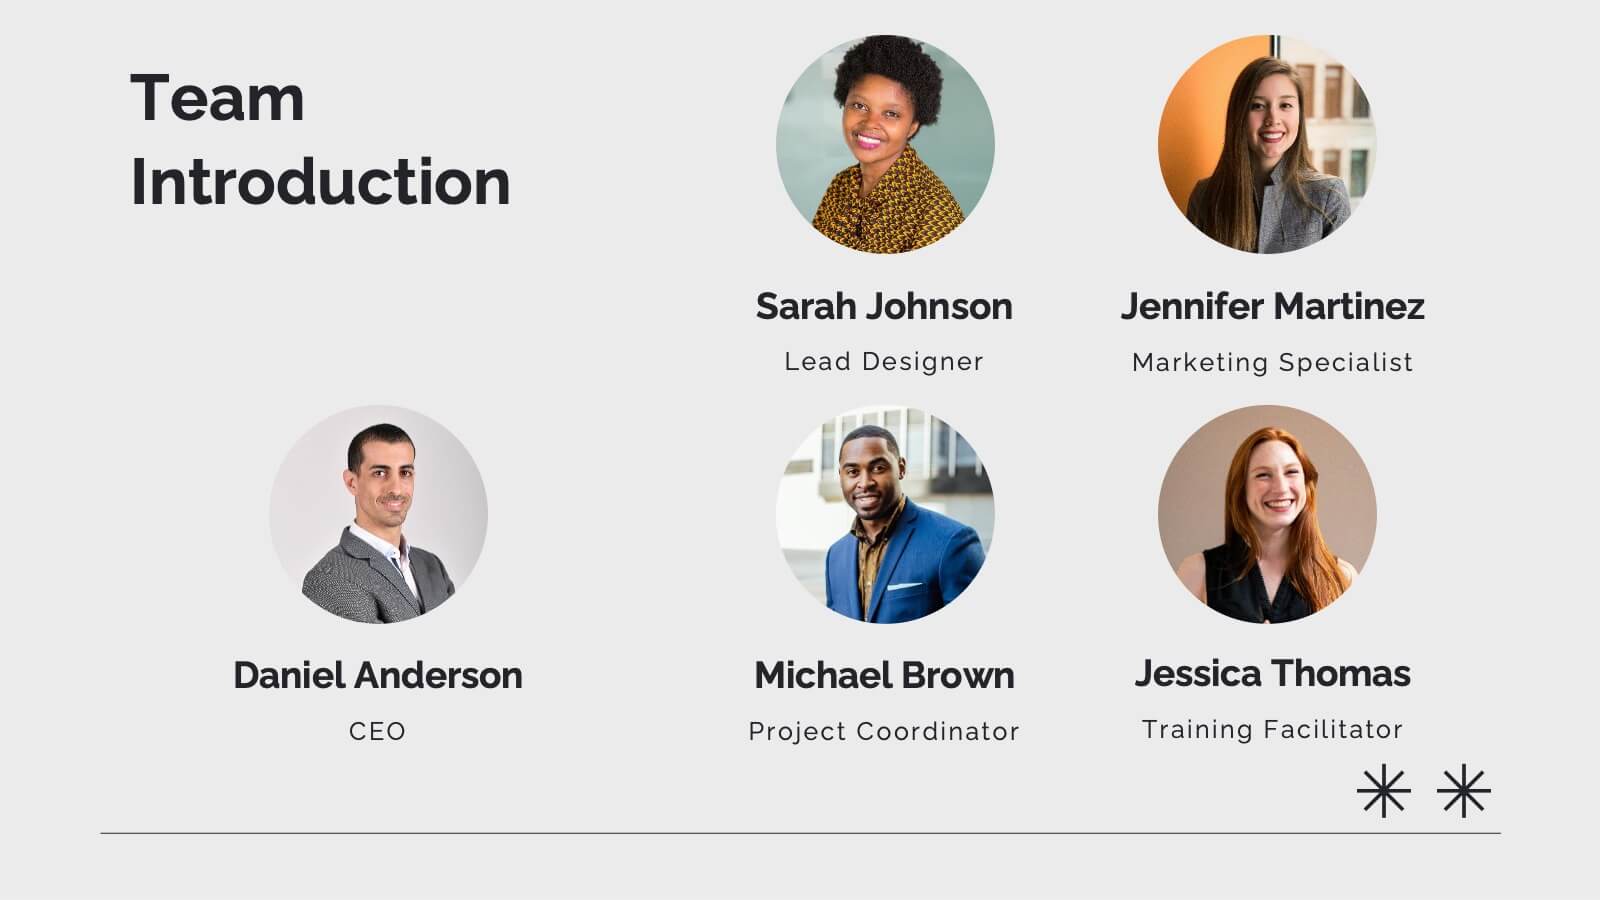
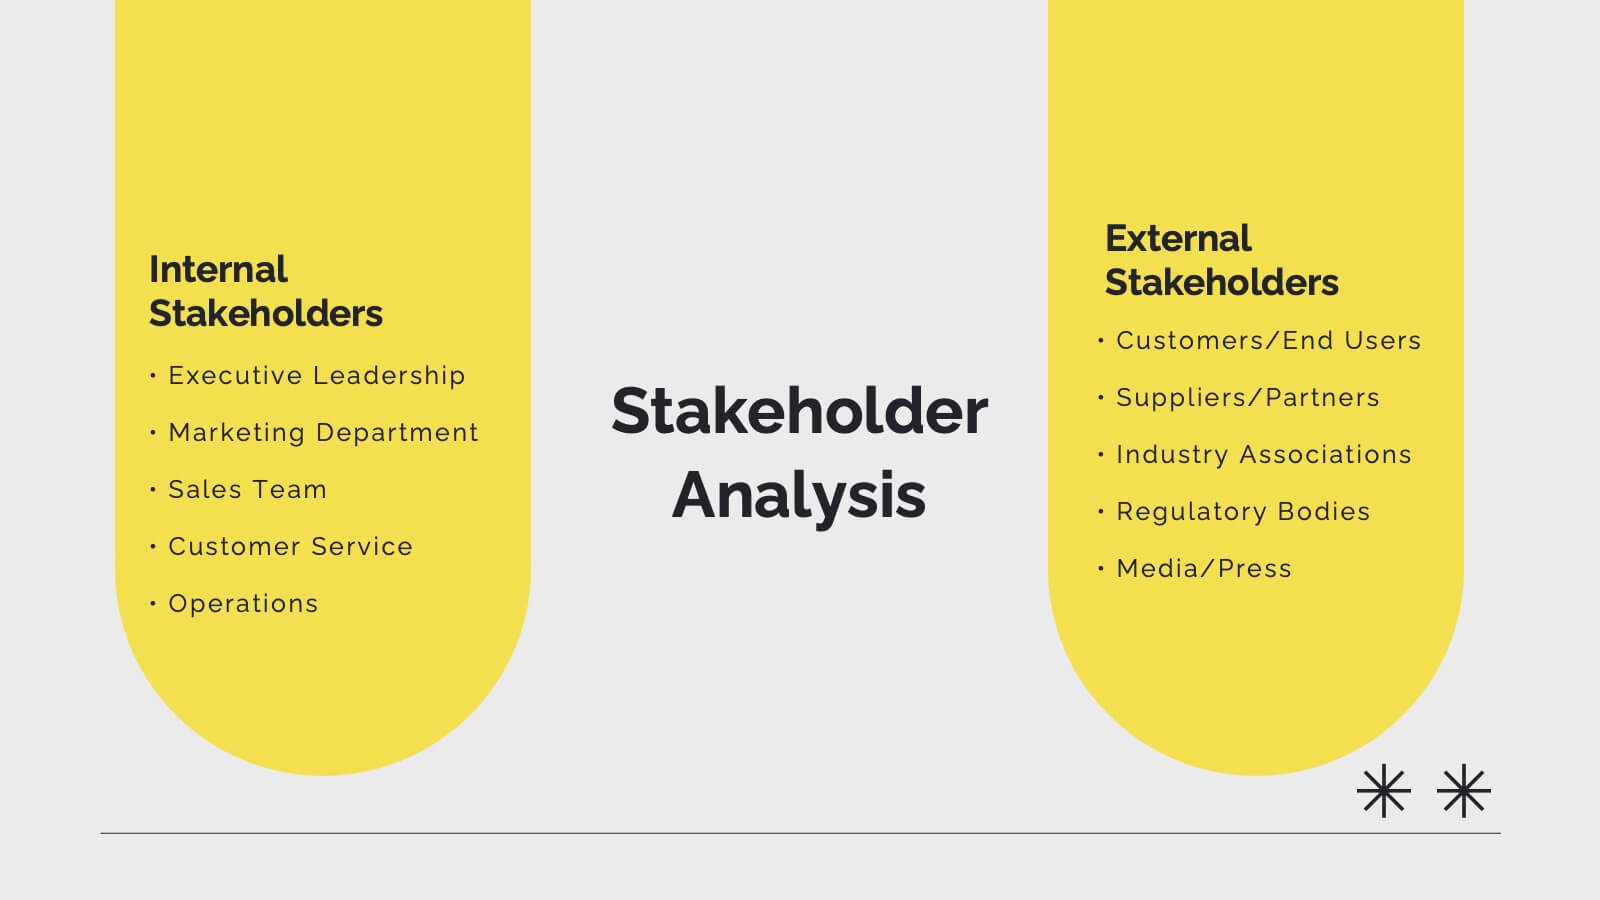
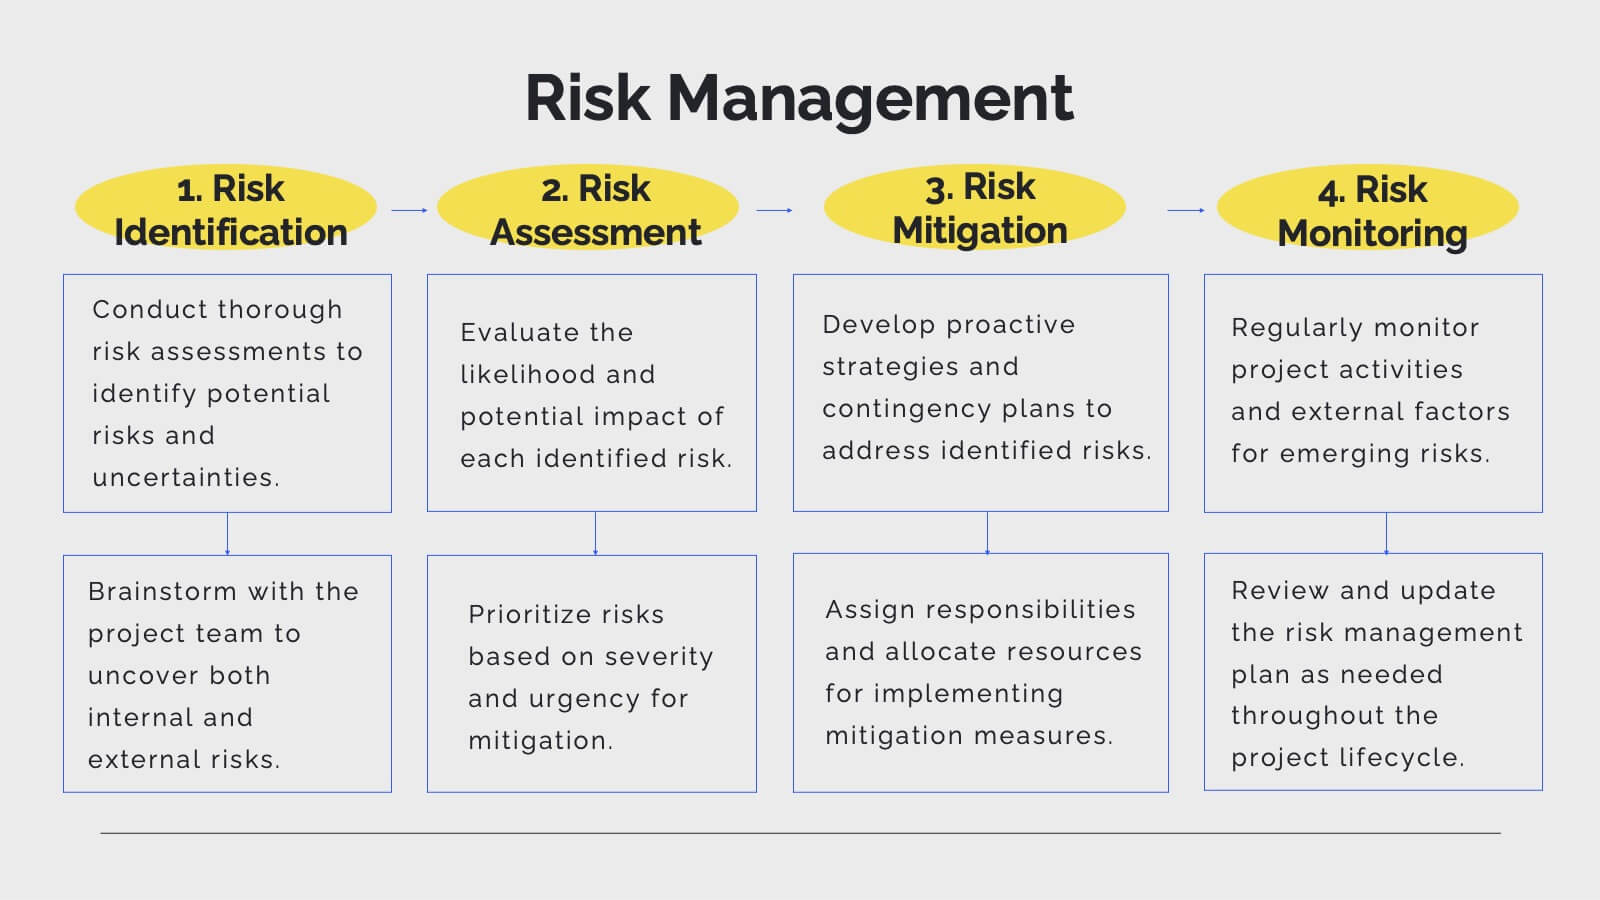
Pulse Project Management Plan Presentation
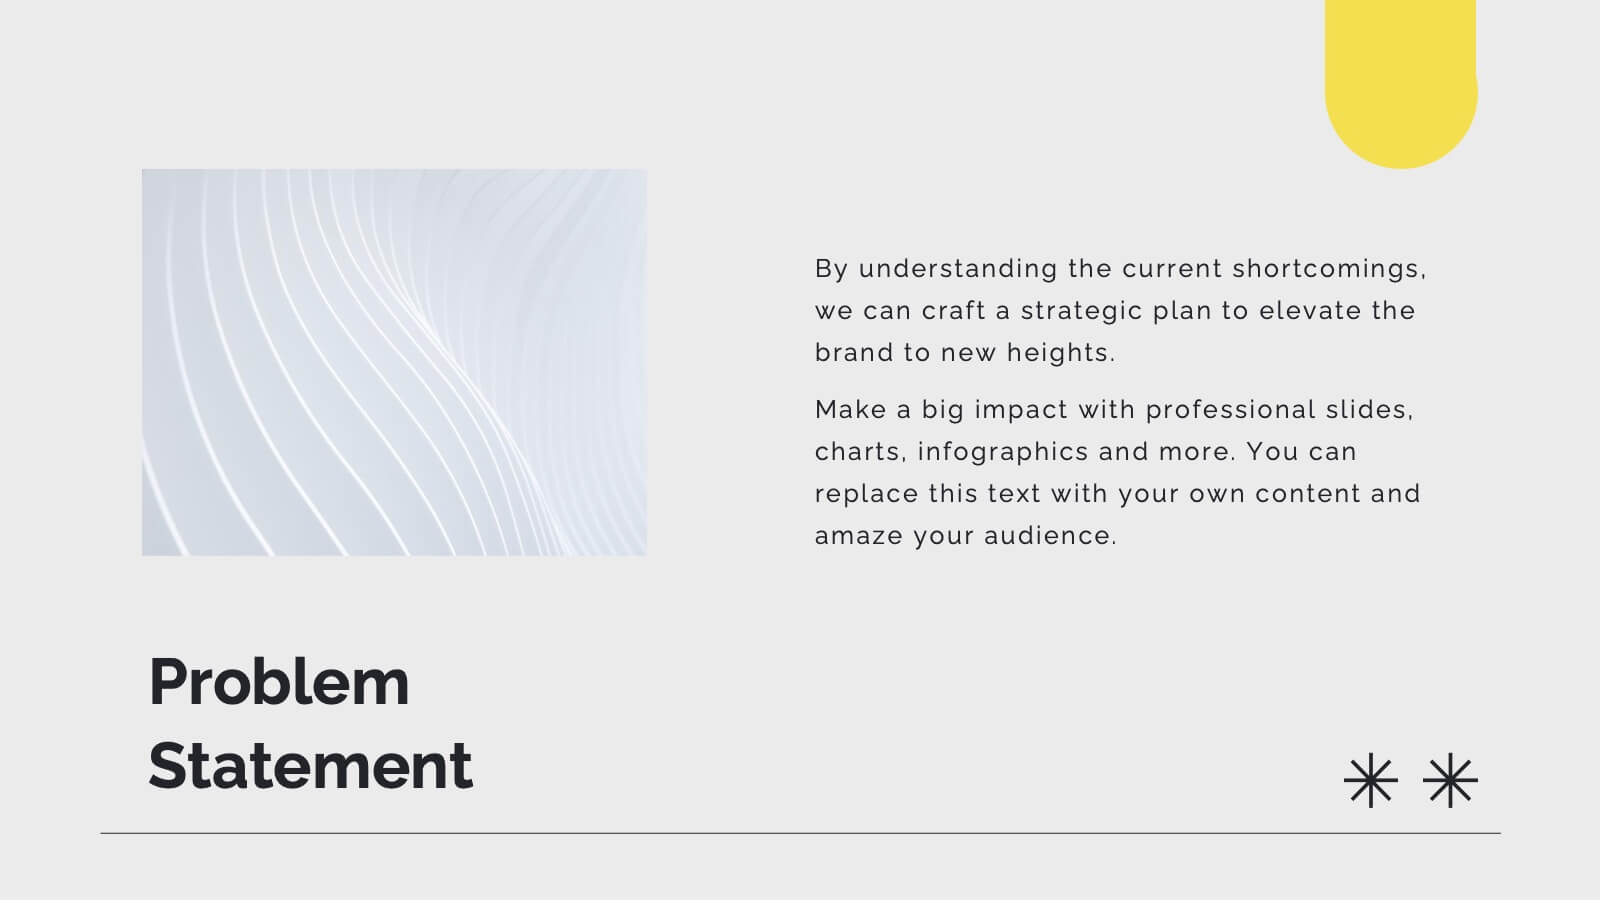
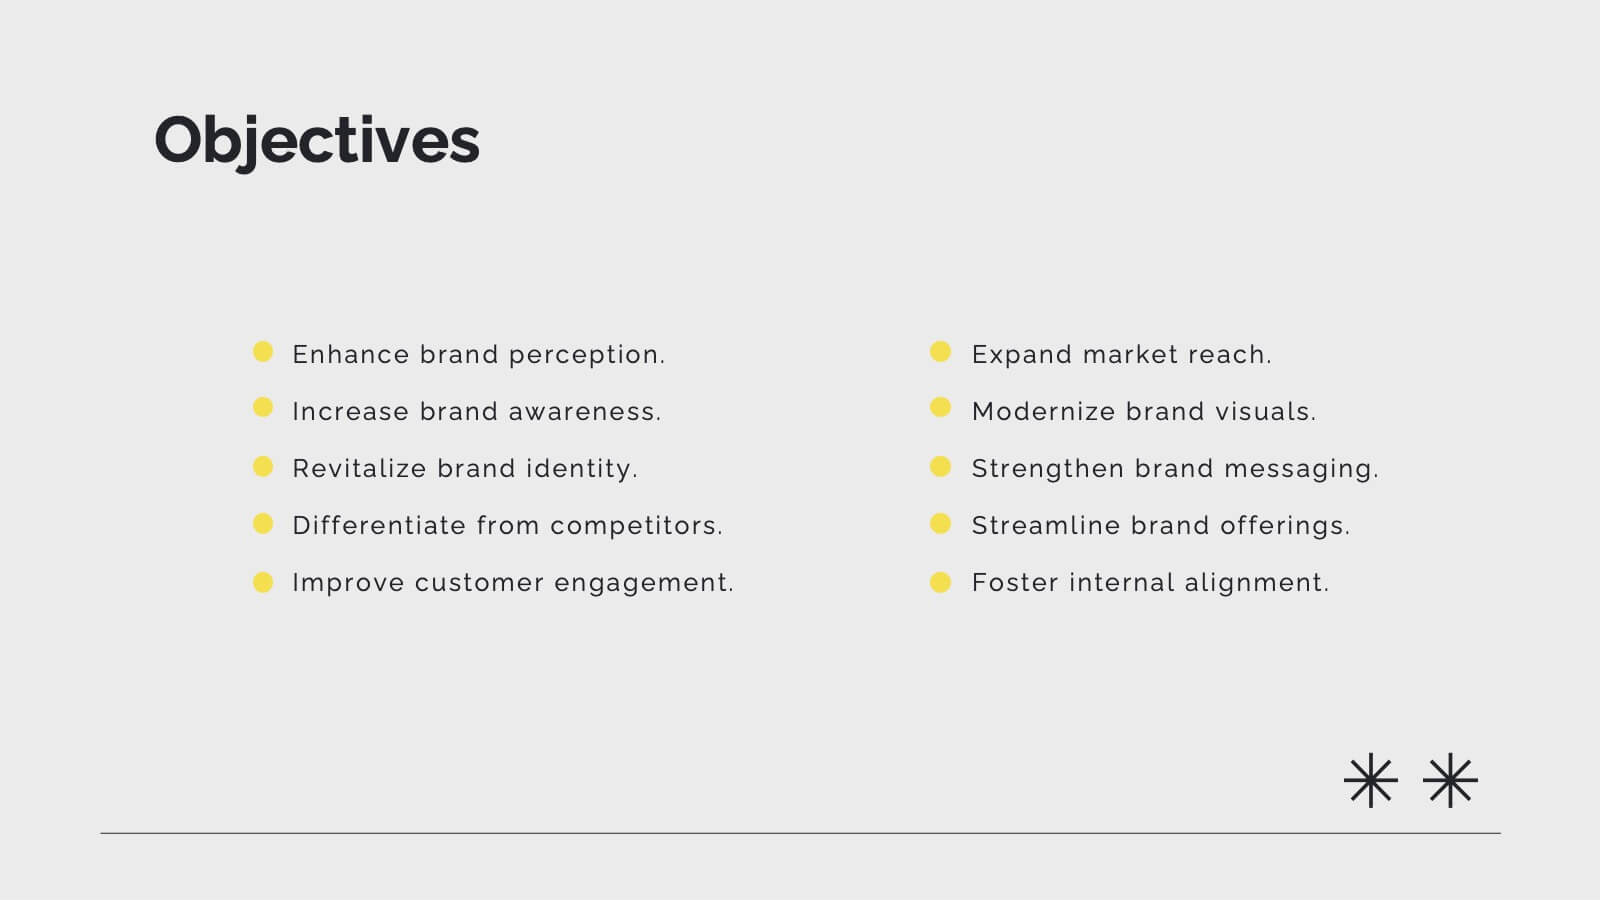
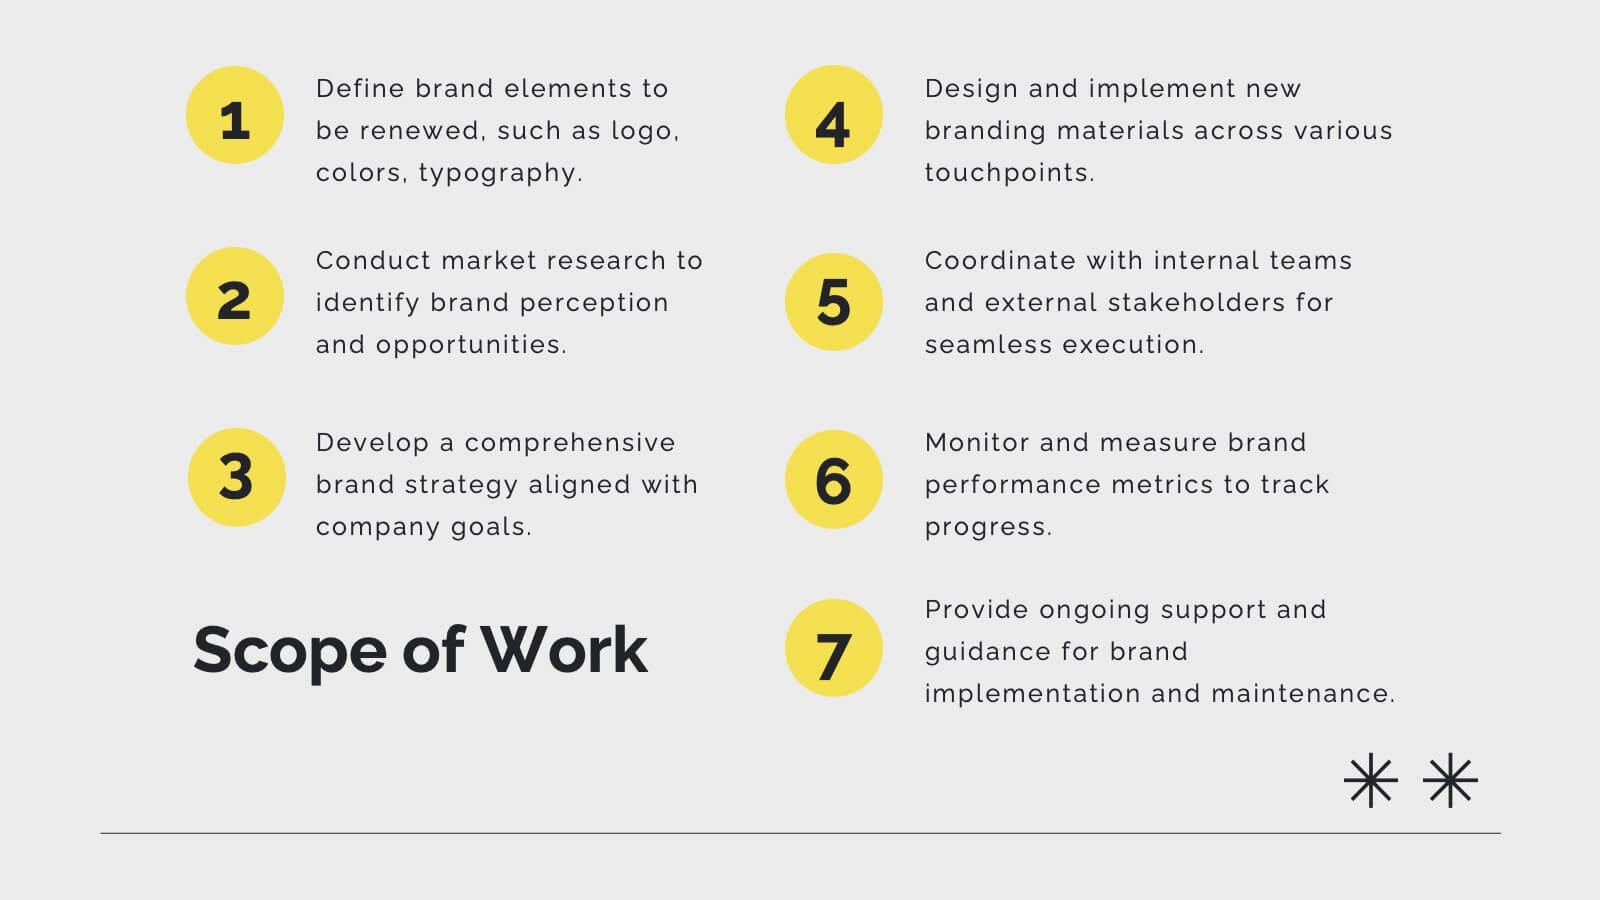
Streamline your project management with this vibrant template. It covers project overview, objectives, deliverables, methodology, timeline, budget, and risk management. Perfect for clear and engaging presentations. Compatible with PowerPoint, Keynote, and Google Slides for seamless customization.


23 slides
Cycladic UX Design Presentation
The Cycladic UX Design Presentation Template is a bold and vibrant choice for showcasing your UX/UI design projects. With its striking pink and black color scheme, this template is designed to grab attention and keep your audience engaged. It covers all essential aspects of UX design, from project overviews and user research to wireframes, prototyping, and UI design principles. Each slide is thoughtfully designed to present your content clearly and effectively, making it ideal for designers who want to highlight their process, showcase their work, and communicate their design thinking.


21 slides
Elixara Startup Funding Proposal Presentation
Give your startup the pitch it deserves with this elegantly designed funding proposal presentation. Covering key areas like business model, competitive analysis, financial overview, and growth strategies, this template helps you present your vision with confidence. Fully customizable and compatible with PowerPoint, Keynote, and Google Slides for a seamless investor-ready experience.


24 slides
Copper Small Business Pitch Deck Presentation
Elevate your business presentations with this clean and professional pitch deck template! Ideal for team meetings, business updates, or investor pitches, it includes sections for collaboration opportunities, performance metrics, and process improvements. The layout ensures clarity and focus, making it perfect for effective communication. It’s fully customizable and works seamlessly with PowerPoint, Keynote, and Google Slides for hassle-free integration.


5 slides
HIV Treatment & Awareness Infographics
Explore the critical realms of healthcare with our HIV treatment & awareness infographics. Rendered in striking shades of red and blue, this vertical, informative, and creatively designed template serves as a profound educational tool. It's intricately crafted for healthcare professionals, awareness campaign coordinators, and community health educators, providing a visual journey through the complexities of HIV understanding. This infographic includes compelling graphics and relevant icons, making it indispensable for those seeking to inform, prevent, and empower communities about HIV. Elevate awareness with clarity and a deep sense of humanity, one fact at a time.


8 slides
Value Creation Strategy
Present your strategic pillars with clarity using this linear, milestone-style layout. Ideal for business consultants, growth strategists, and product teams aiming to showcase value drivers, innovation stages, or competitive differentiators. Fully editable in PowerPoint, Keynote, and Google Slides—customize icons, colors, and text for a branded, professional finish.


26 slides
Building Community Networks Presentation
Strengthen connections and foster collaboration with this engaging presentation on building community networks. Covering key topics like social engagement, resource sharing, grassroots initiatives, and digital networking, this template helps highlight strategies for creating meaningful relationships. Fully customizable and compatible with PowerPoint, Keynote, and Google Slides for a seamless and impactful presentation experience.


6 slides
Staff Integration and Onboarding Journey Presentation
Streamline your onboarding process with the Staff Integration and Onboarding Journey Presentation. This clean, step-by-step layout uses human icons to represent each phase of a new hire's journey—from orientation to full integration. Ideal for HR professionals, it’s fully editable in Canva, PowerPoint, Keynote, or Google Slides for easy customization.