


Features
- 34 Unique slides
- Fully editable and easy to edit in Microsoft Powerpoint, Keynote and Google Slides
- 16:9 widescreen layout
- Clean and professional designs
- Export to JPG, PDF or send by email.


Do you have any questions?
Recommend


4 slides
Veterinary Practice Overview Presentation
Give your veterinary insights a professional touch with this clean, modern infographic layout. Designed to showcase workflows, patient care processes, and team structures, it helps present information clearly and visually. Fully customizable and compatible with PowerPoint, Keynote, and Google Slides for easy editing and seamless presentation design.


20 slides
Whisper Creative Portfolio Presentation
The Creative Portfolio Presentation Template is a visually striking 20-slide design, ideal for showcasing your professional work or services. It features slides for introductions, about us, portfolio overviews, and individual project highlights. Key sections include philosophy, style, creative process, client testimonials, awards, and pricing structures. The vibrant yellow and pink gradient elements provide a modern, creative flair that grabs attention. Fully customizable and compatible with PowerPoint, Keynote, and Google Slides, this template is perfect for designers, agencies, and freelancers aiming to present their work professionally and uniquely.


21 slides
Dreameon Agency Portfolio Presentation
Showcase your agency's expertise with this sleek and modern portfolio presentation template. Designed to highlight your achievements, creative processes, and client success stories, this template offers a comprehensive layout that communicates professionalism and innovation. From introducing your team and services to detailing case studies and market analysis, each slide is meticulously crafted to leave a lasting impression. Display your strategy development, social media impact, and measurement analytics effectively, ensuring a cohesive narrative that resonates with your audience. Easily customizable and compatible with PowerPoint, Google Slides, and Keynote, this template is perfect for agencies looking to pitch their capabilities, attract new clients, or present project achievements with confidence.


5 slides
Procurement Strategy Presentation
ChatGPT PlusBring clarity and structure to your business process with this modern, visually engaging presentation. Perfect for outlining purchasing plans, supplier relationships, and cost-saving strategies, it helps convey information with precision and flow. Fully customizable and compatible with PowerPoint, Keynote, and Google Slides for seamless editing and professional results.


25 slides
Keystone Market Research Presentation
Present your market research with confidence using this stylish, contemporary template. Perfect for detailing research objectives, data collection, and key findings, it features a sleek design with vibrant colors. Highlight critical aspects like market trends, results interpretation, and recommendations to captivate your audience. Compatible with PowerPoint, Keynote, and Google Slides, it ensures seamless presentations on any platform.


21 slides
Somnara Full-Service Agency Project Plan Presentation
Present your agency’s expertise with a comprehensive project plan template designed to impress clients and stakeholders. This sleek and professional layout allows you to outline your mission and vision, highlight team strengths, and showcase core services with clarity. Use the client testimonials and case studies sections to establish credibility and trust. Visualize your strategic approach with dedicated slides for market analysis, creative process, and execution strategy. The template also includes detailed sections for partnership opportunities, social responsibility initiatives, and a future outlook, ensuring a holistic view of your agency’s capabilities and forward-thinking approach. Fully editable and compatible with PowerPoint, Google Slides, and Keynote, this template is perfect for full-service agencies seeking to elevate their presentations. Customize each slide to reflect your unique value and deliver impactful, results-oriented proposals.


5 slides
Overcoming Strategic Business Challenges Presentation
Break down complex obstacles with this step-by-step "Overcoming Strategic Business Challenges" presentation. Featuring a stair-like 3D visual with figures symbolizing progress and setbacks, each slide is divided into four clear milestones. Ideal for showcasing pain points, strategic pivots, or recovery plans. Customize each step with your insights in PowerPoint, Keynote, or Google Slides.


21 slides
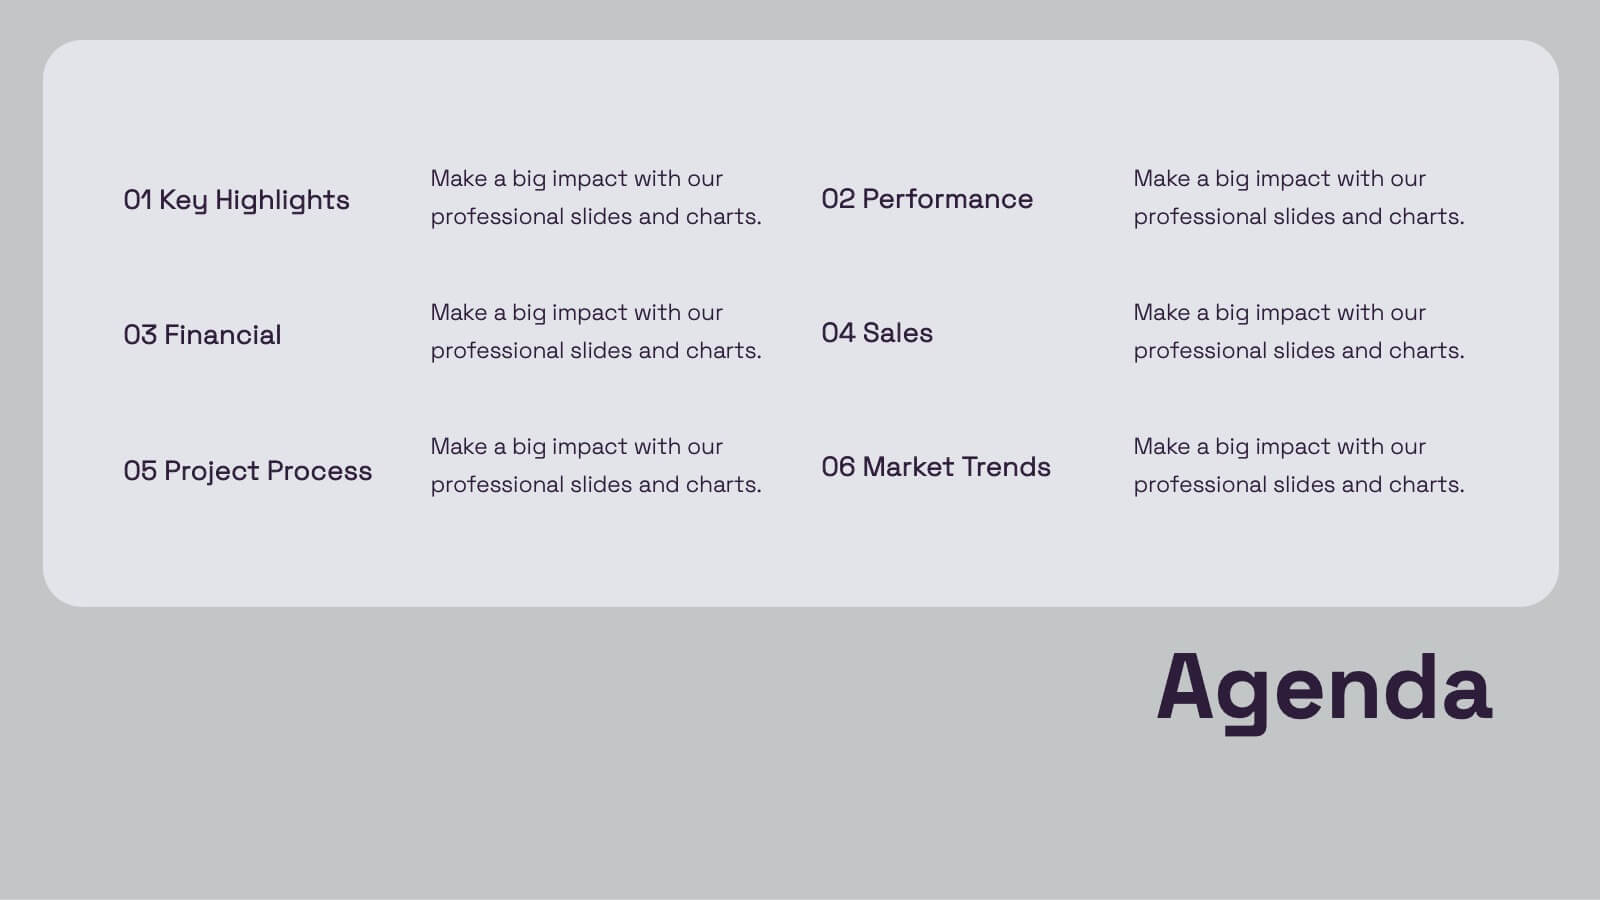
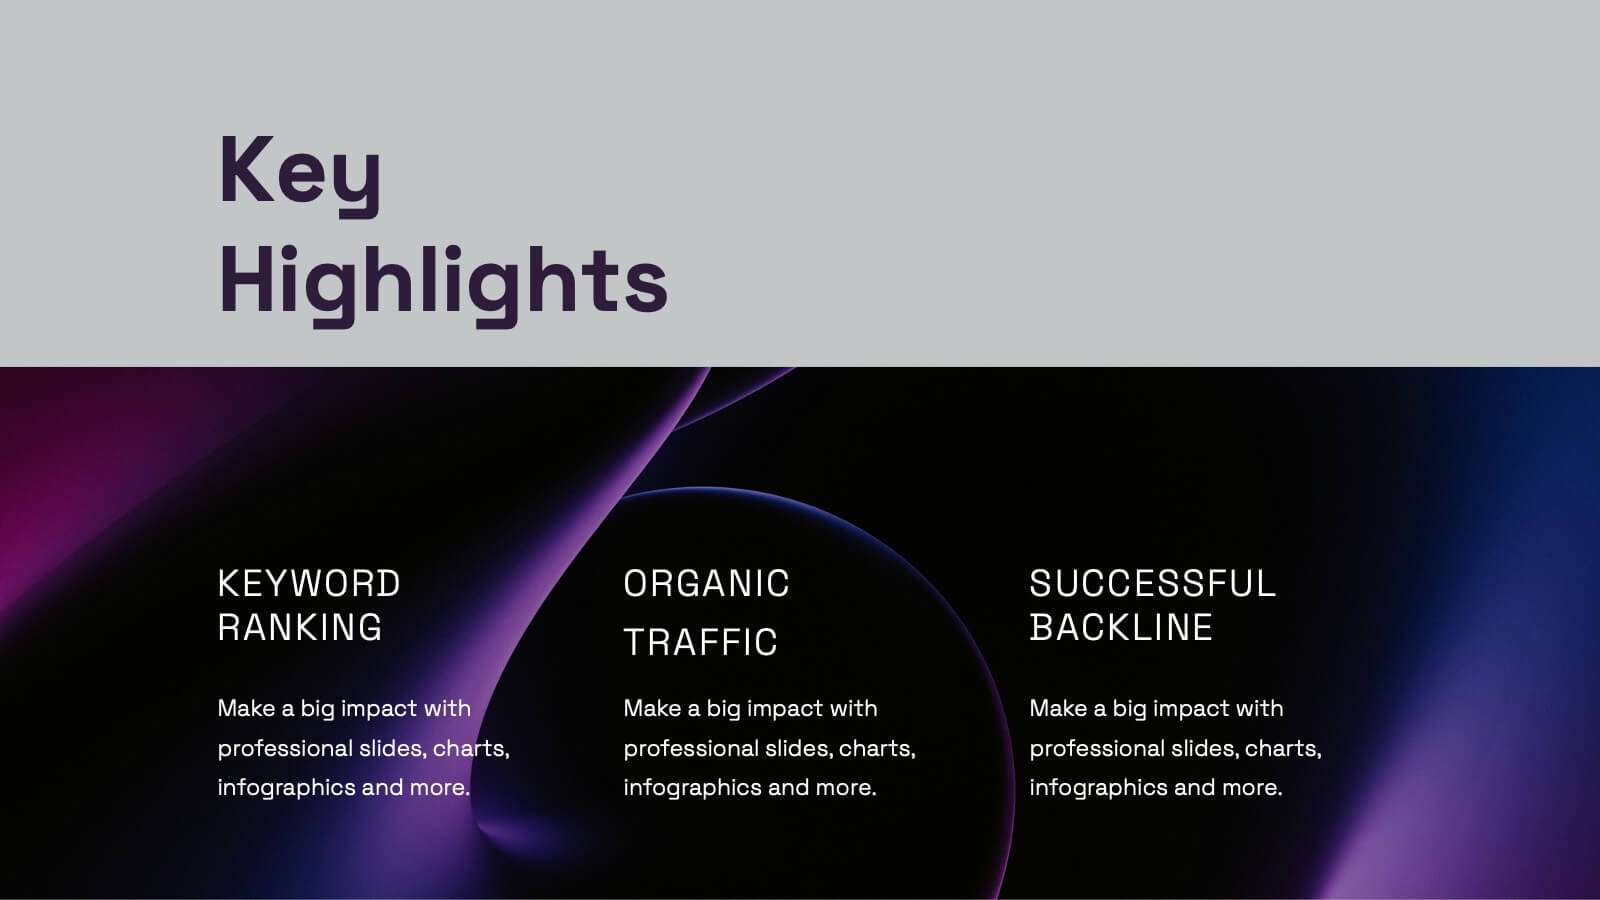
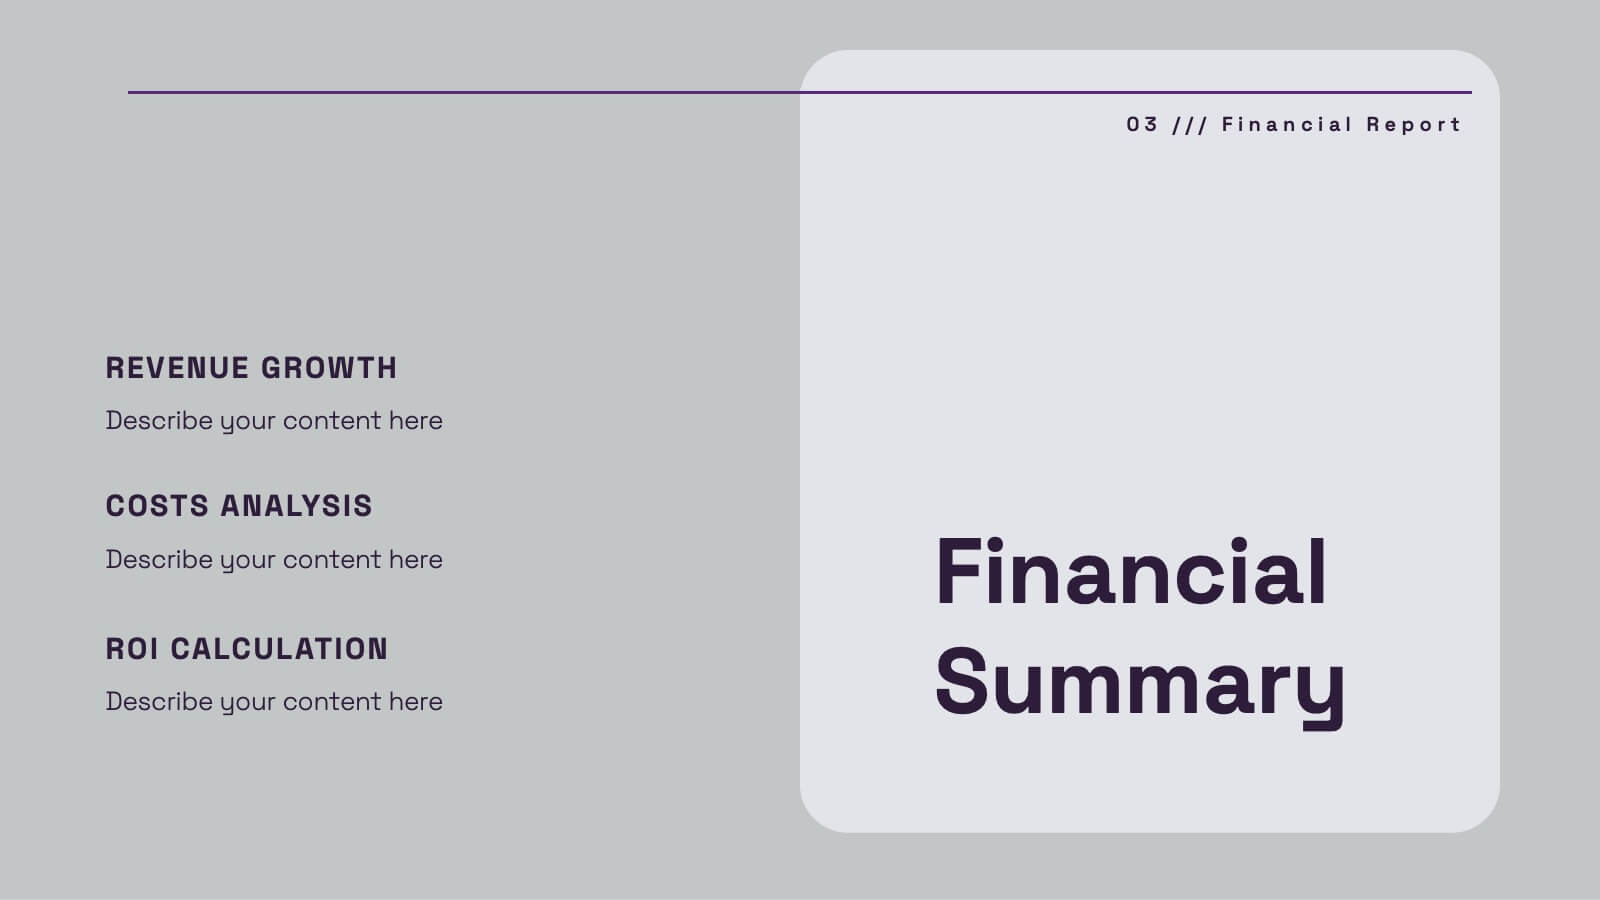
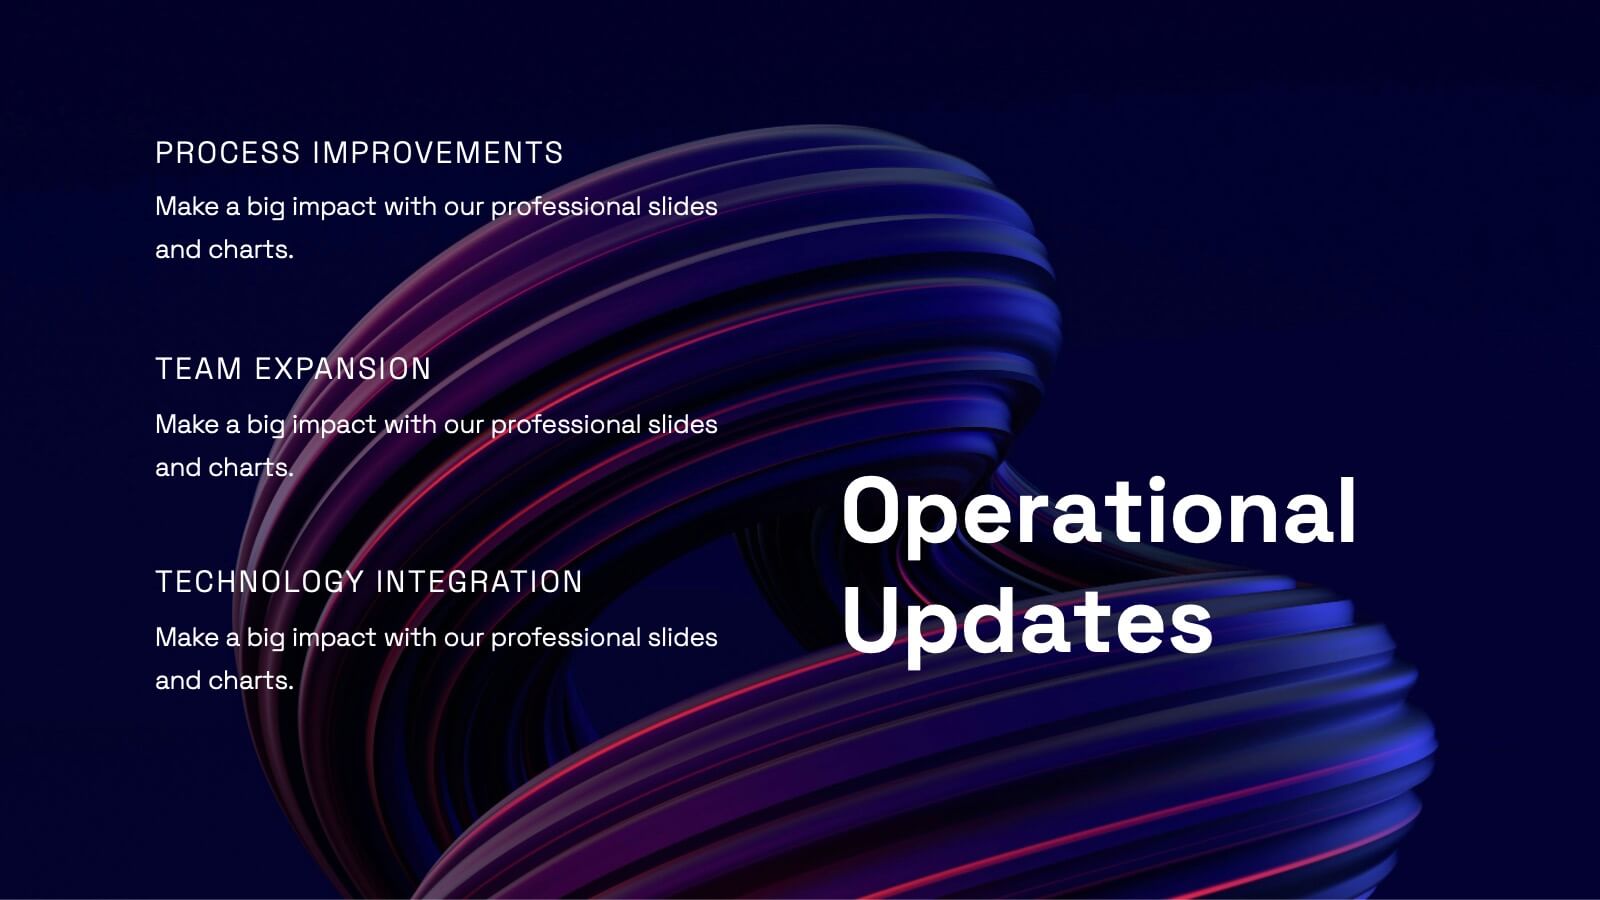
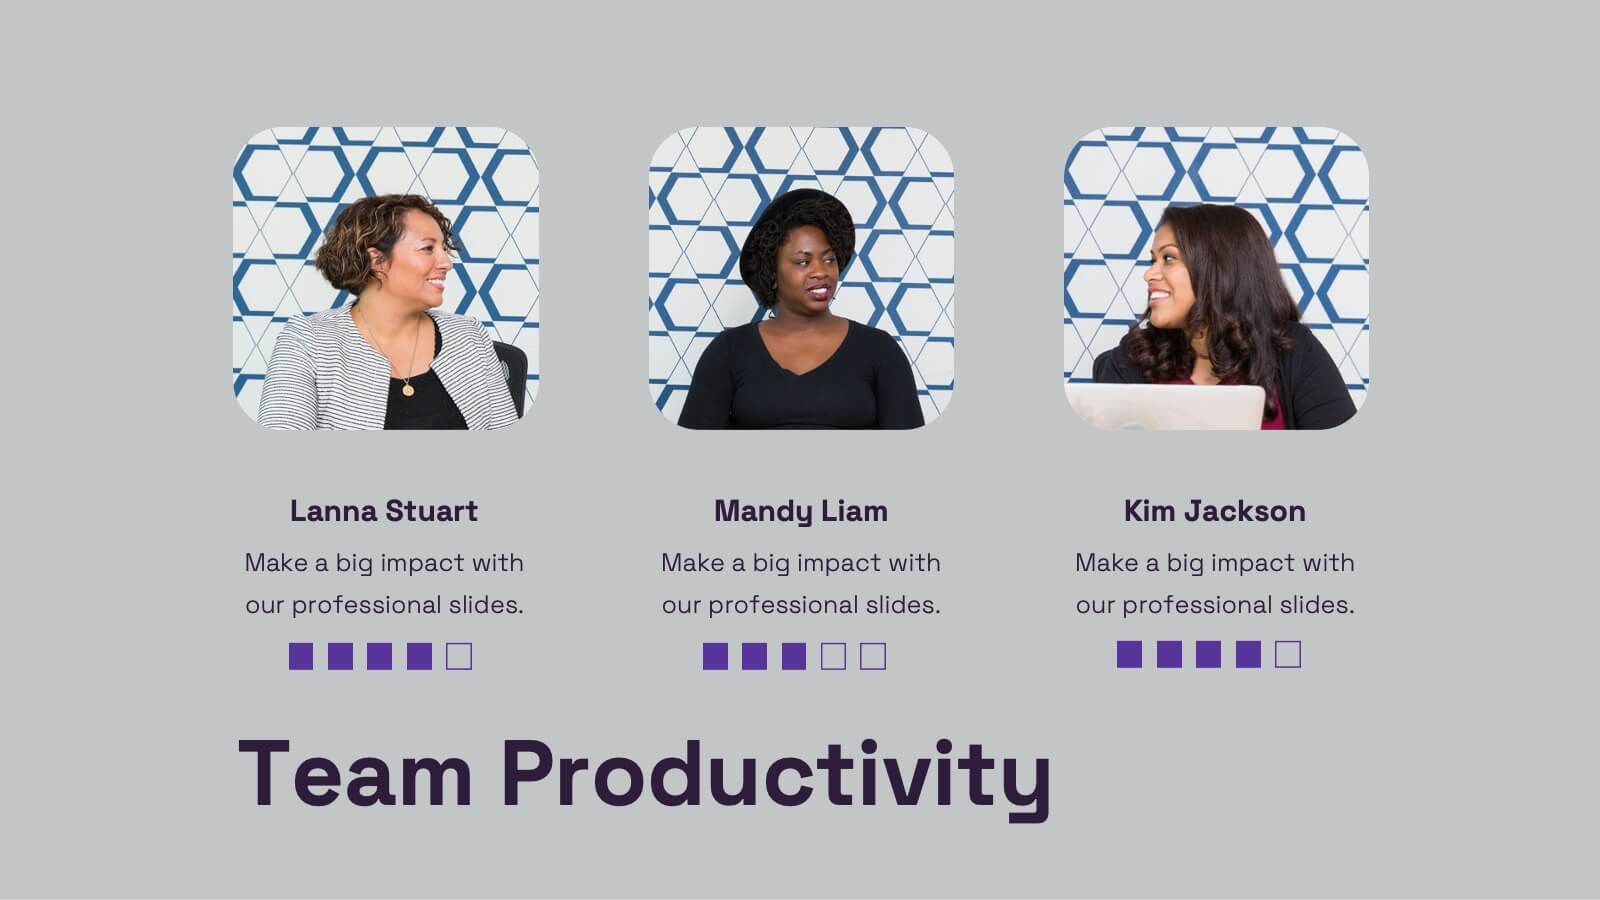
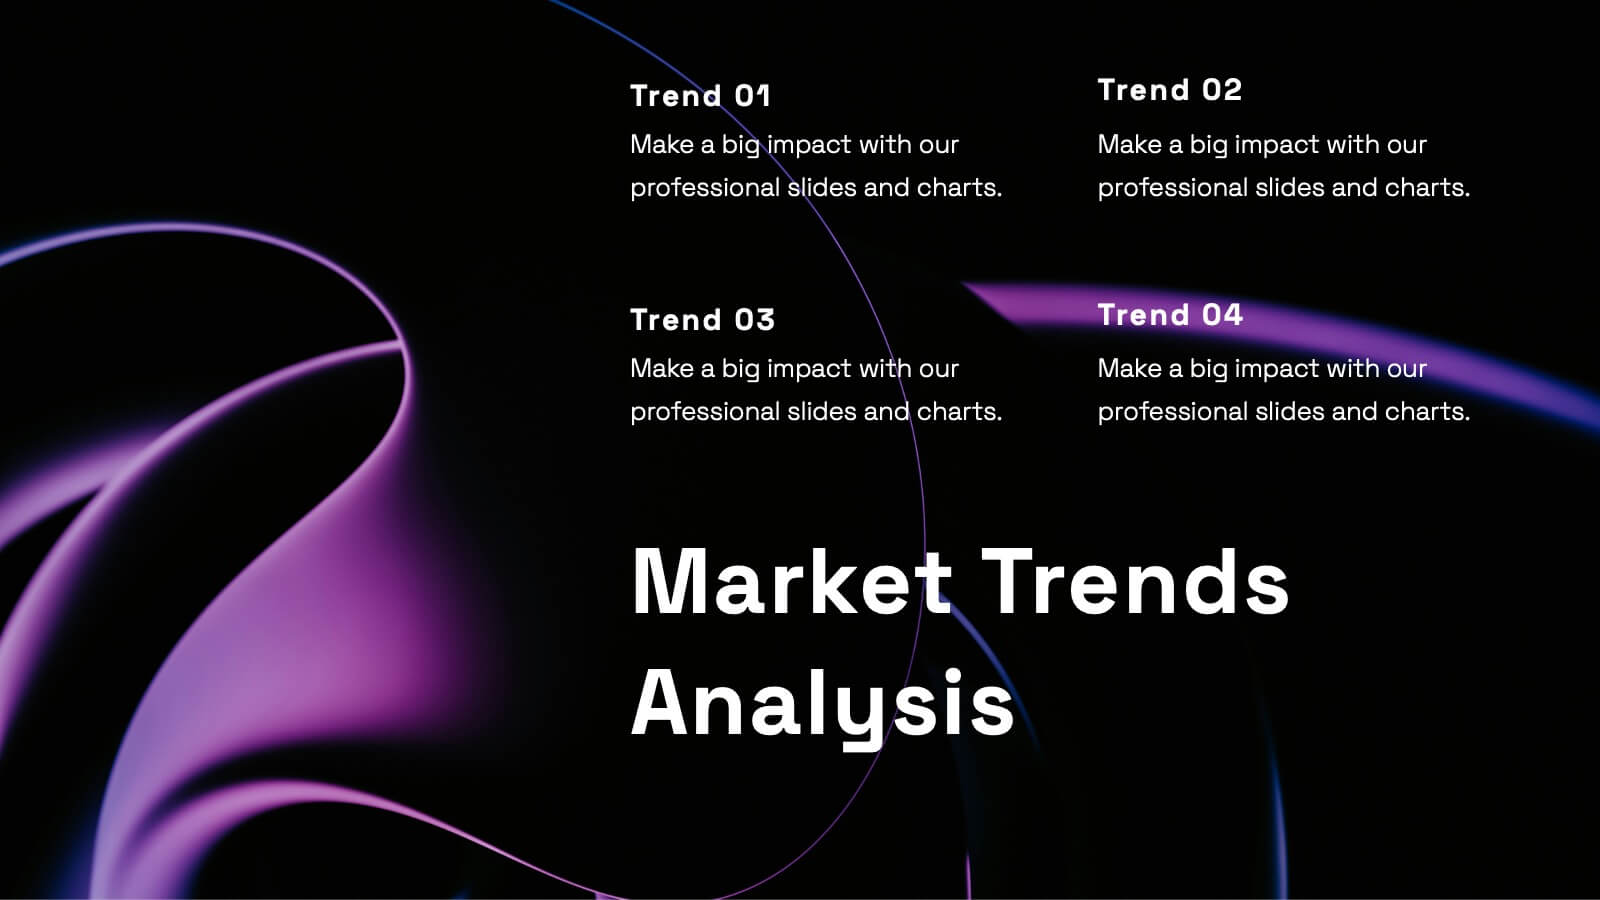
Uplift Financial Report Presentation
Present your financial or business report with this sleek and modern presentation template! It includes essential sections such as performance metrics, financial summaries, project progress, and market trends analysis, ensuring a comprehensive overview. Whether you're discussing key achievements or competitor insights, this template is perfect for delivering a professional and polished report. Compatible with PowerPoint, Keynote, and Google Slides for easy use and customization.


20 slides
Scriptorium Design Portfolio Presentation
Showcase your creative work with a sophisticated design portfolio presentation template tailored for designers and creators. This template includes clean, minimalist slides to highlight your introduction, portfolio overview, design philosophy, and style. Showcase featured projects with dedicated project highlight slides, complete with client testimonials and awards for added credibility. With sections for your design process, services, pricing, and blog integration, this template provides a professional framework for sharing your creative journey. The editable layout ensures seamless customization to reflect your unique brand, making it suitable for freelancers, agencies, or design teams. Compatible with PowerPoint, Google Slides, and Keynote, this versatile template offers an elegant way to communicate your expertise and leave a lasting impression on clients or stakeholders. Tailor it to your needs and take your portfolio presentations to the next level!


8 slides
Beginner's Guide to Stock Market Presentation
Turn complex financial ideas into simple, engaging visuals with this sleek, data-driven design. Perfect for explaining market basics, investment growth, and trading concepts in a way that’s easy to follow and visually appealing. Fully compatible with PowerPoint, Keynote, and Google Slides for effortless editing and presentation customization.


26 slides
Dariux Presentation Template
Travel is one of the most popular themes for businesses, Dariux template is the perfect solution for presentations on travel and tourism. It's tan and blue background makes the right graphical impression and photo templates with a simple but fun design make your presentation perfect. Colorful charts and an animation will make your presentation livelier as well as attract more attention in the audience's mind. Inside this template, you'll find a wealth of material for anything related to beach destinations and travel generally — there are even multiple slides dedicated to give you so many tips!


5 slides
Business Goals Roadmap Presentation
Bring your long-term vision to life with a clear, structured roadmap that highlights each milestone in your business journey. This presentation helps you outline key objectives, track progress, and communicate strategic priorities with ease. Ideal for planning, strategy, and growth discussions. Fully compatible with PowerPoint, Keynote, and Google Slides.


5 slides
Body System Overview Presentation
Visually explain key human body systems with this clean and modern slide. Each section highlights a different organ with labeled points (A–D) for easy reference. Ideal for health education, medical briefings, or anatomy lessons. Fully editable in PowerPoint, Keynote, or Google Slides to suit any professional or academic need.


6 slides
McKinsey Strategy Implementation Model Presentation
Visualize organizational alignment with the McKinsey 7S Model slide. Featuring a clean circular layout, it highlights Strategy, Structure, Systems, Shared Values, Style, Staff, and Skills. Ideal for consulting, planning, or leadership presentations. Fully editable and compatible with PowerPoint, Google Slides, and Keynote for easy customization and branding.


10 slides
Business Growth and Market Statistics Presentation
Showcase key business growth trends and market insights with the "Business Growth and Market Statistics" presentation templates. These visuals are crafted to enhance clarity in communicating growth drivers, market dynamics, and performance metrics effectively. Ideal for corporate presentations, they're compatible with PowerPoint, Keynote, and Google Slides, ensuring a professional look across all platforms.


22 slides
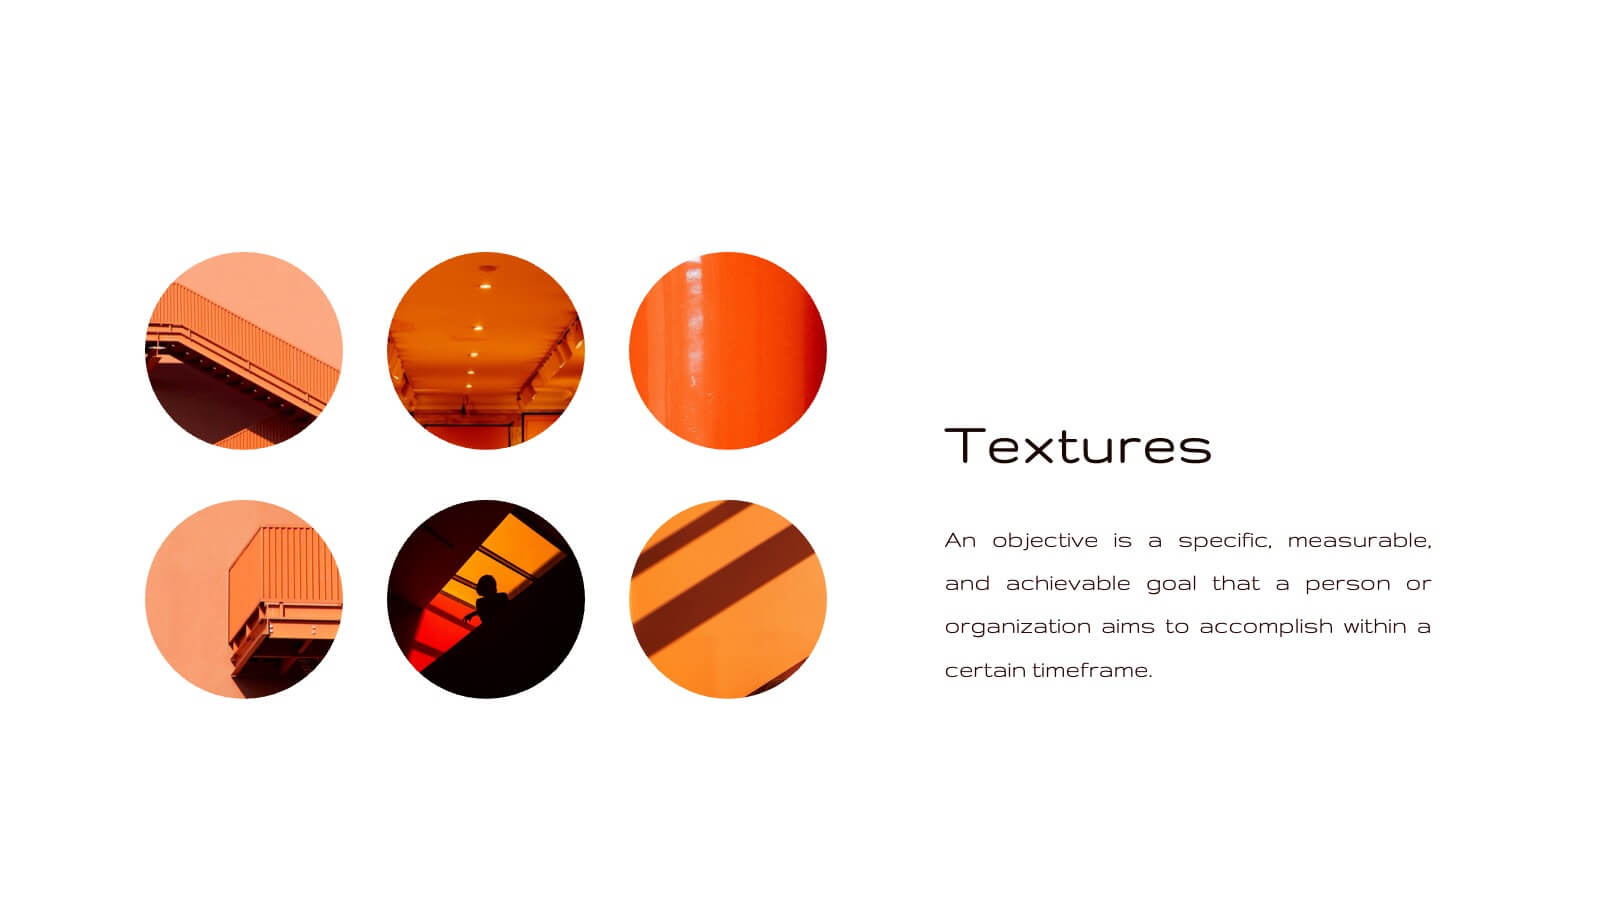
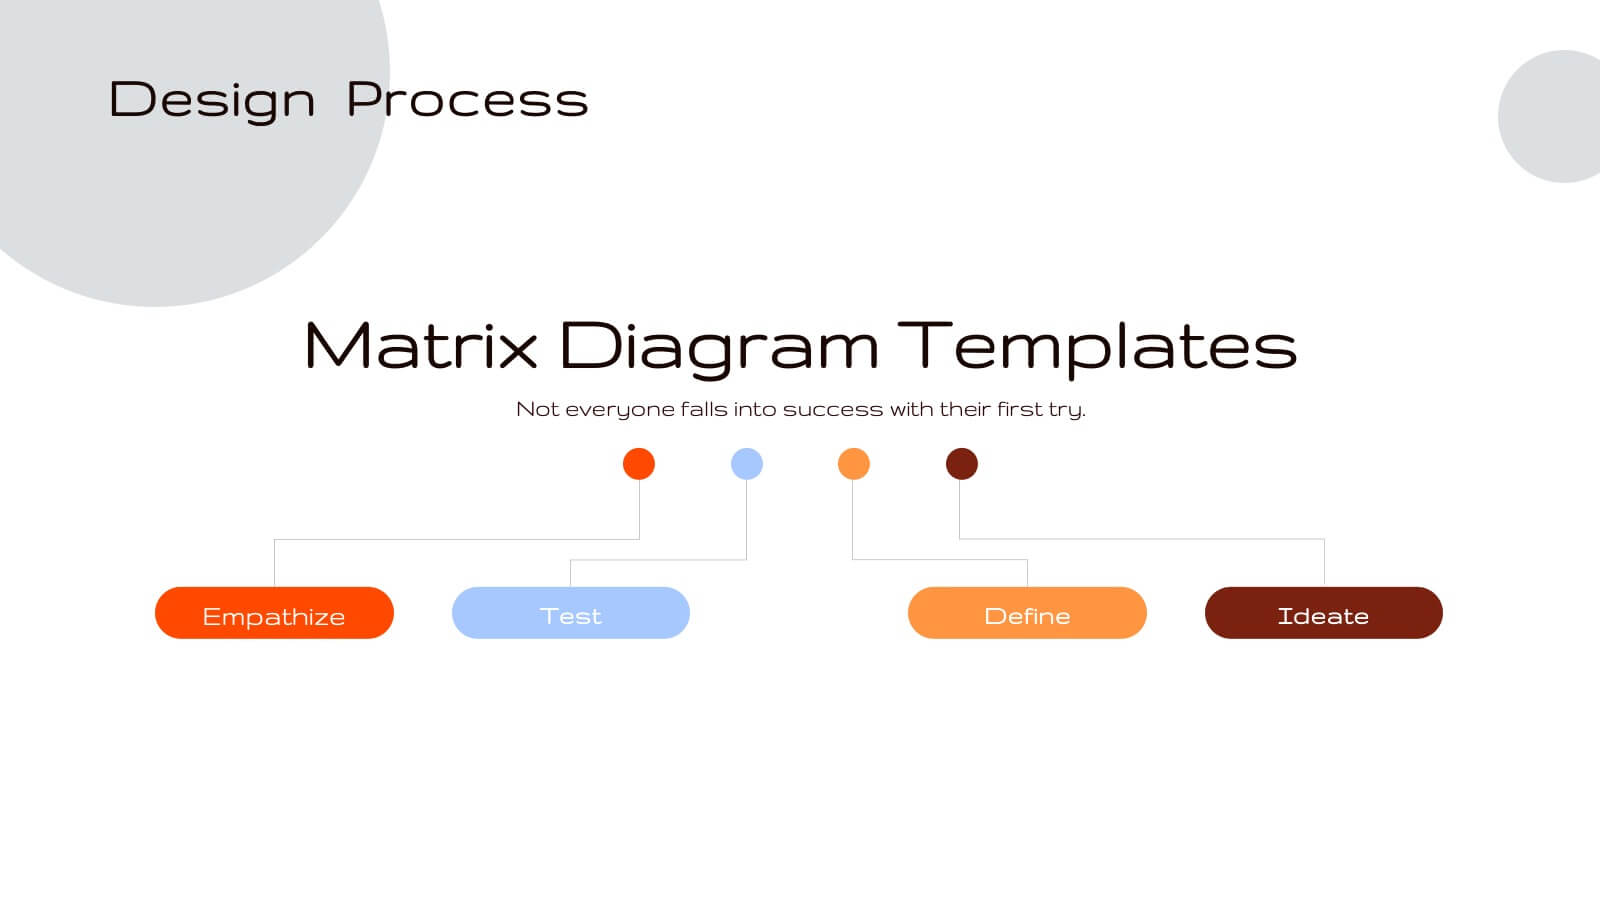
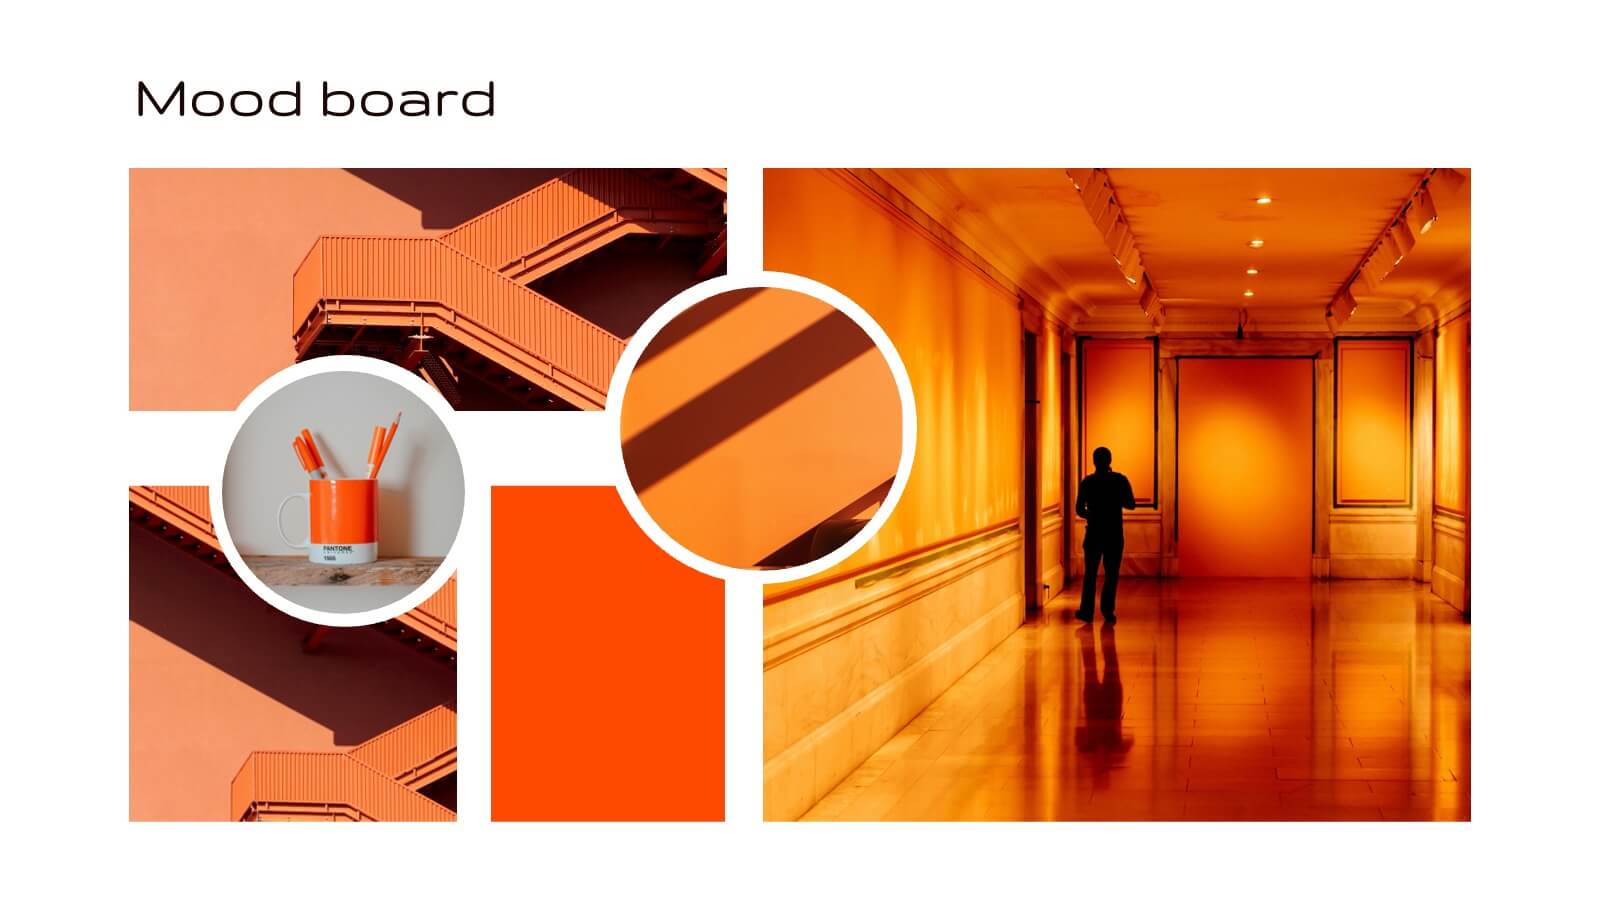
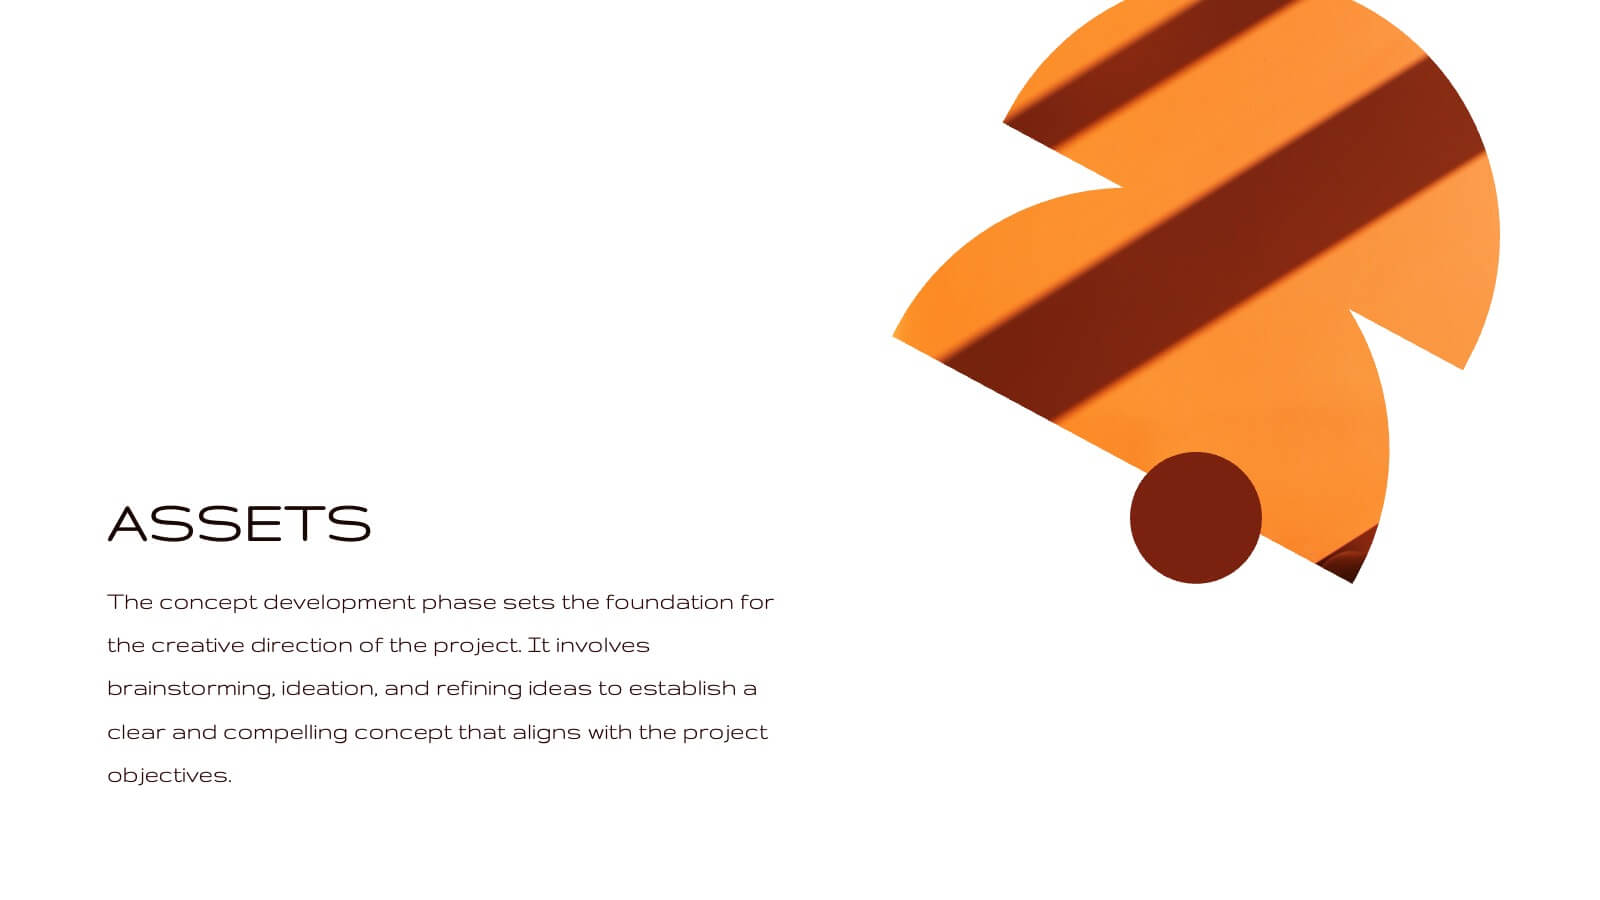
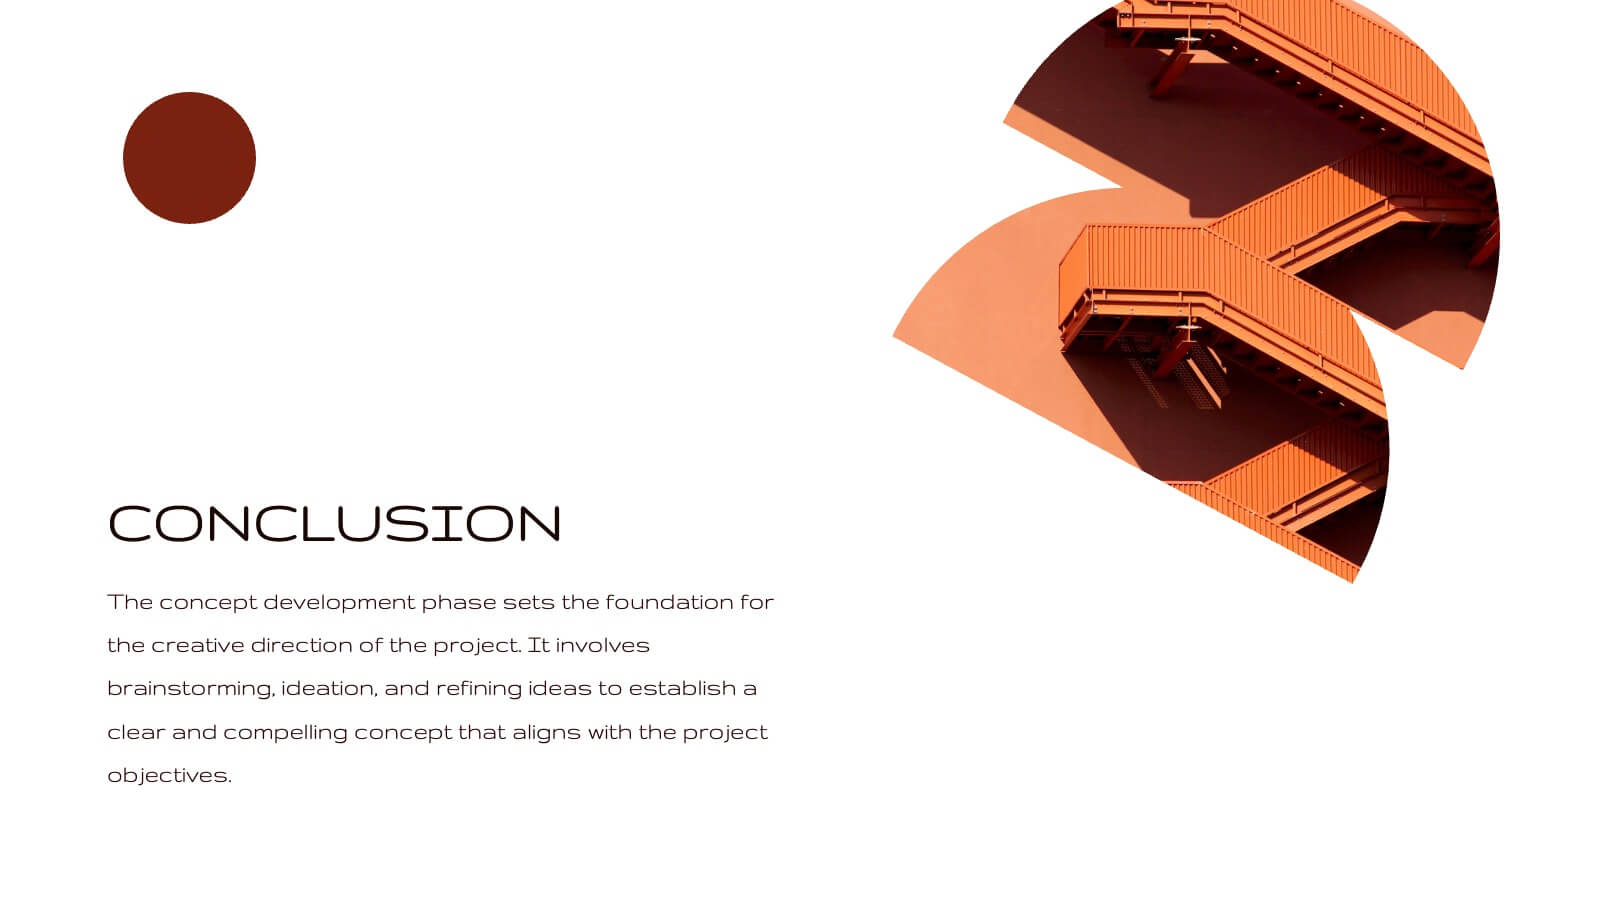
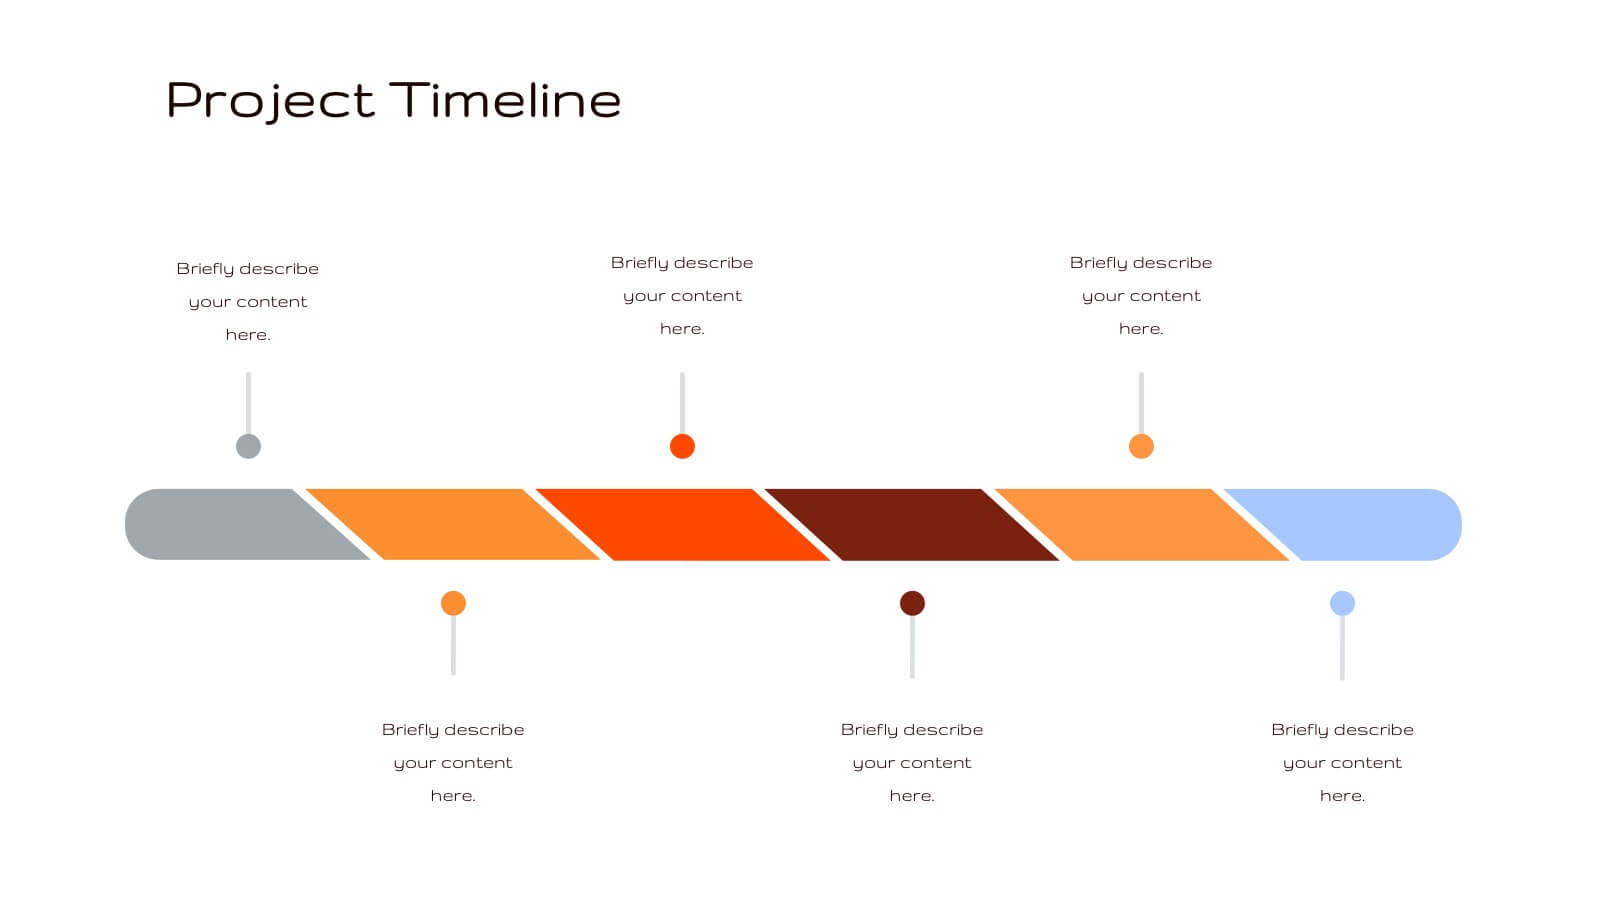
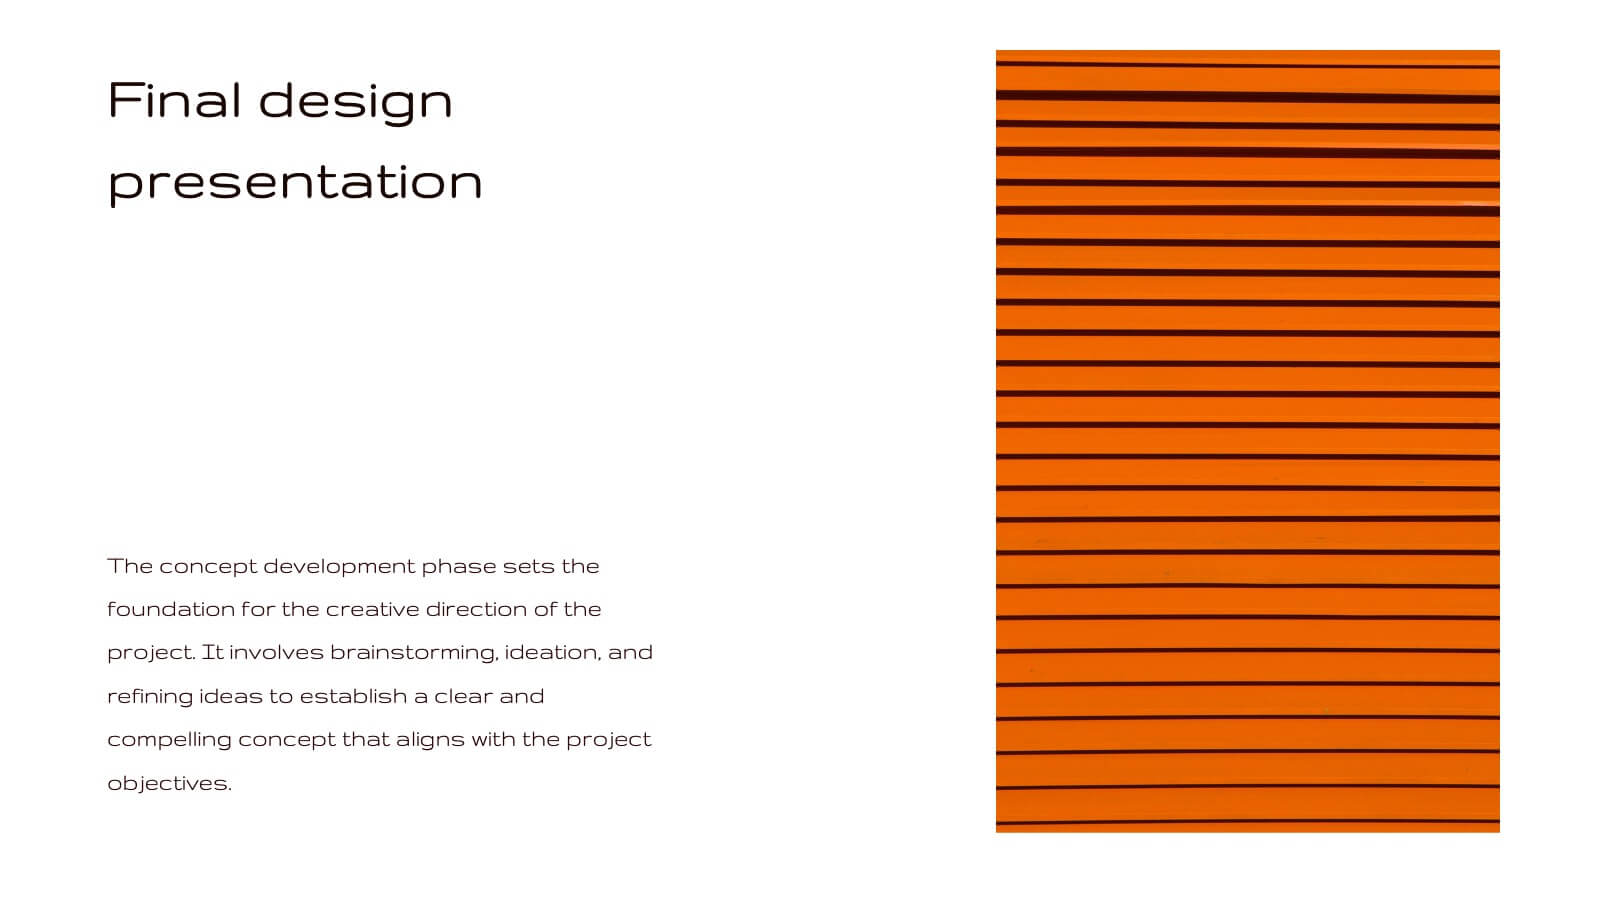
Radiance Creative Design Report Presentation
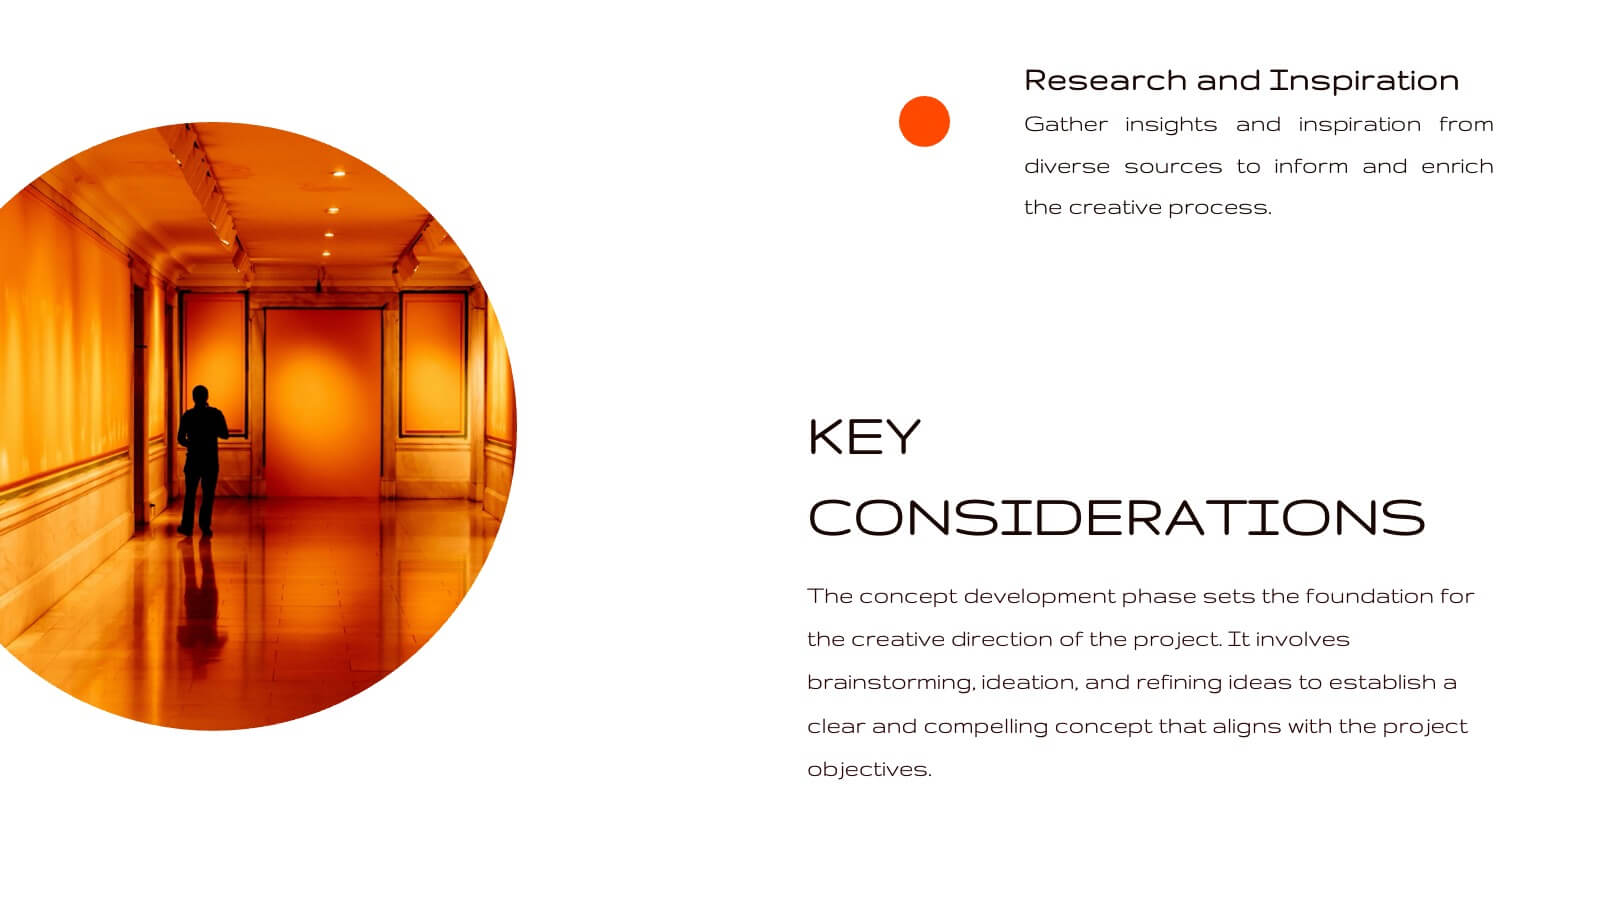
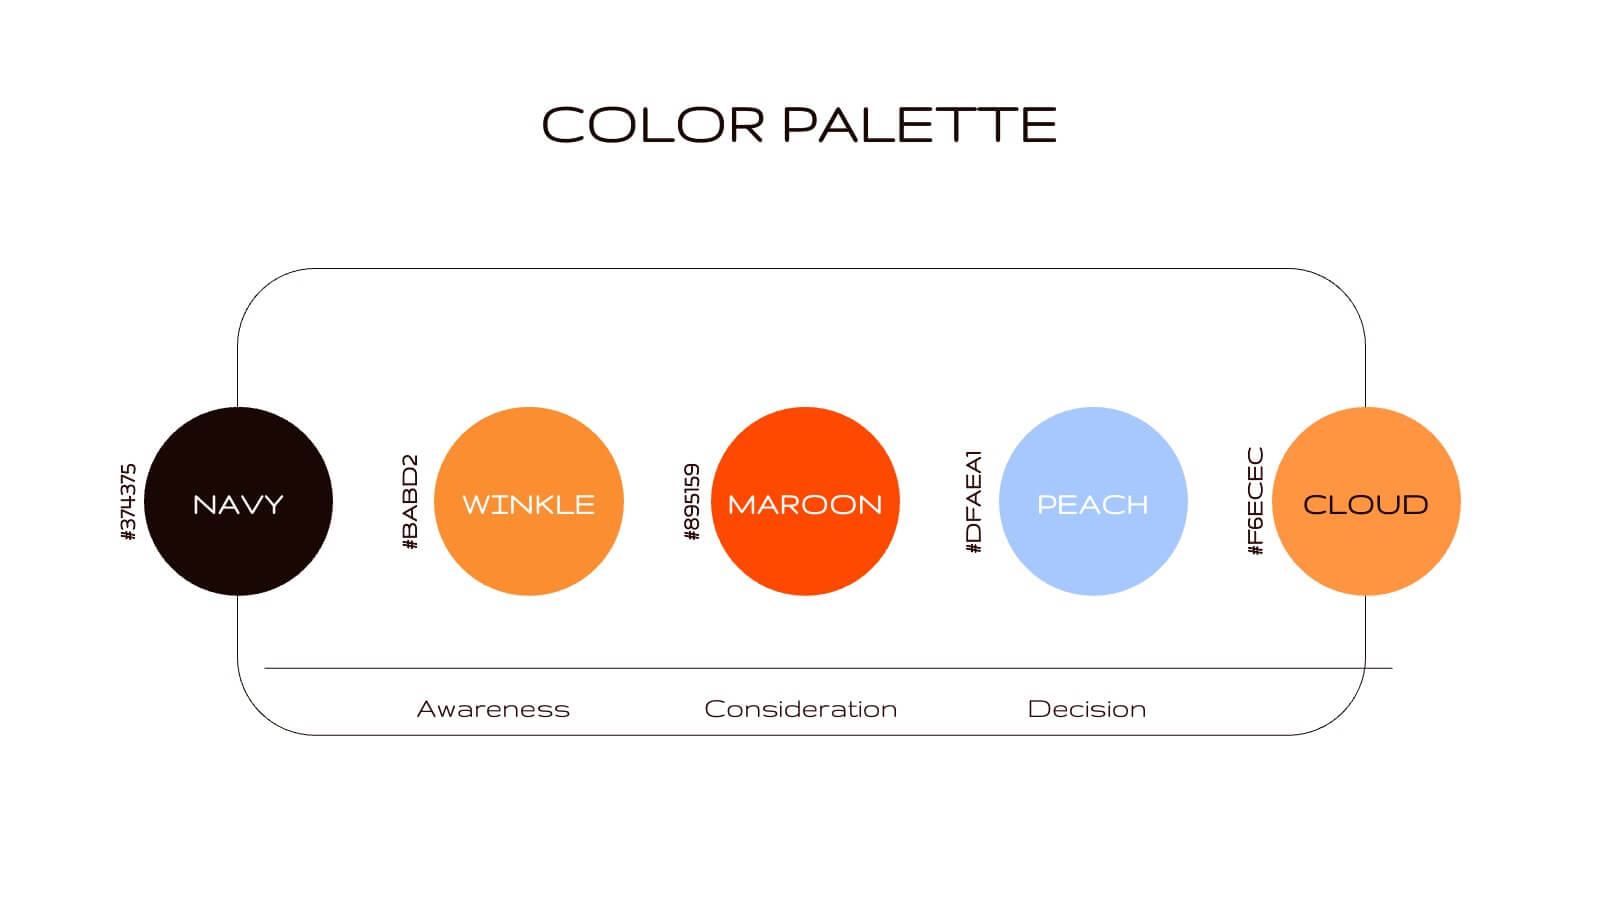
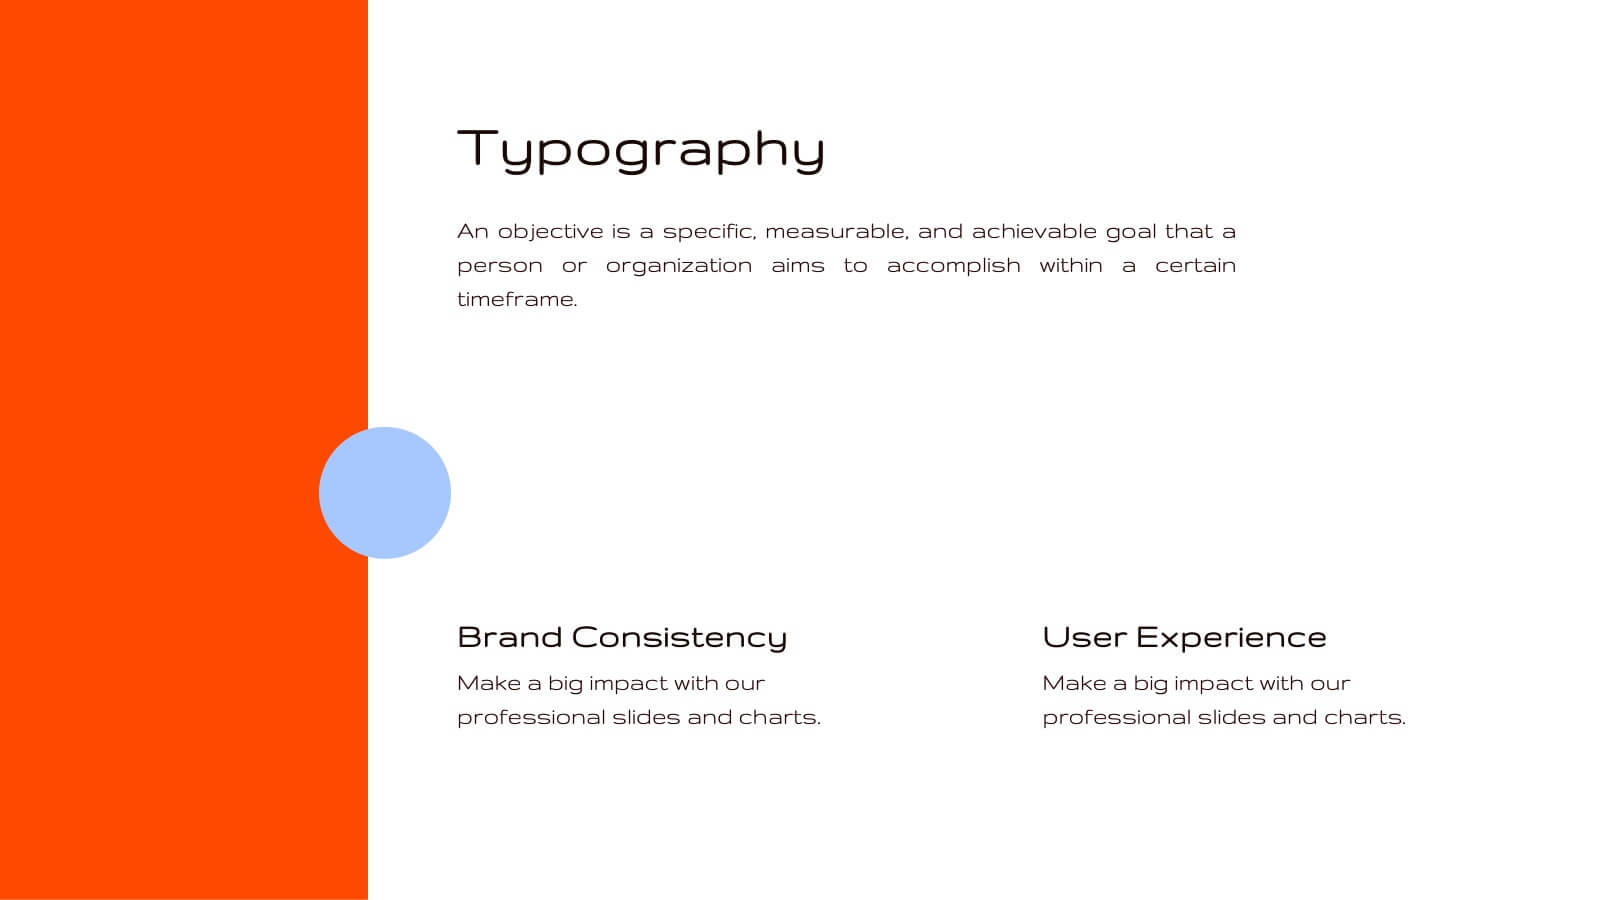
Bring your design ideas to life with this vibrant, engaging presentation template. Ideal for showcasing creative processes, concept development, and project timelines, it features a striking color palette and clean layout. This template is designed to captivate your audience and clearly communicate your design vision. Compatible with PowerPoint, Keynote, and Google Slides, it’s perfect for any platform.


5 slides
Progress and Performance Yearly Review Presentation
Highlight key milestones along your business journey with this winding roadmap-style slide. Designed for annual reviews, it features five flag markers for progress tracking, goals, or achievements. Ideal for reports or team updates. Fully customizable in PowerPoint, Keynote, and Google Slides for seamless adaptation to your yearly metrics.