


Features
- 5 Unique slides
- Fully editable and easy to edit in Microsoft Powerpoint, Keynote and Google Slides
- 16:9 widescreen layout
- Clean and professional designs
- Export to JPG, PDF or send by email


Do you have any questions?
Recommend


3 slides
Company Mission Overview Presentation
Bring your message to life with a bright, modern slide that highlights purpose, direction, and organizational goals in a clean, engaging layout. This presentation helps you communicate mission-driven insights with clarity and visual impact, making it ideal for internal teams or stakeholders. Fully compatible with PowerPoint, Keynote, and Google Slides.


8 slides
Business Value Proposition
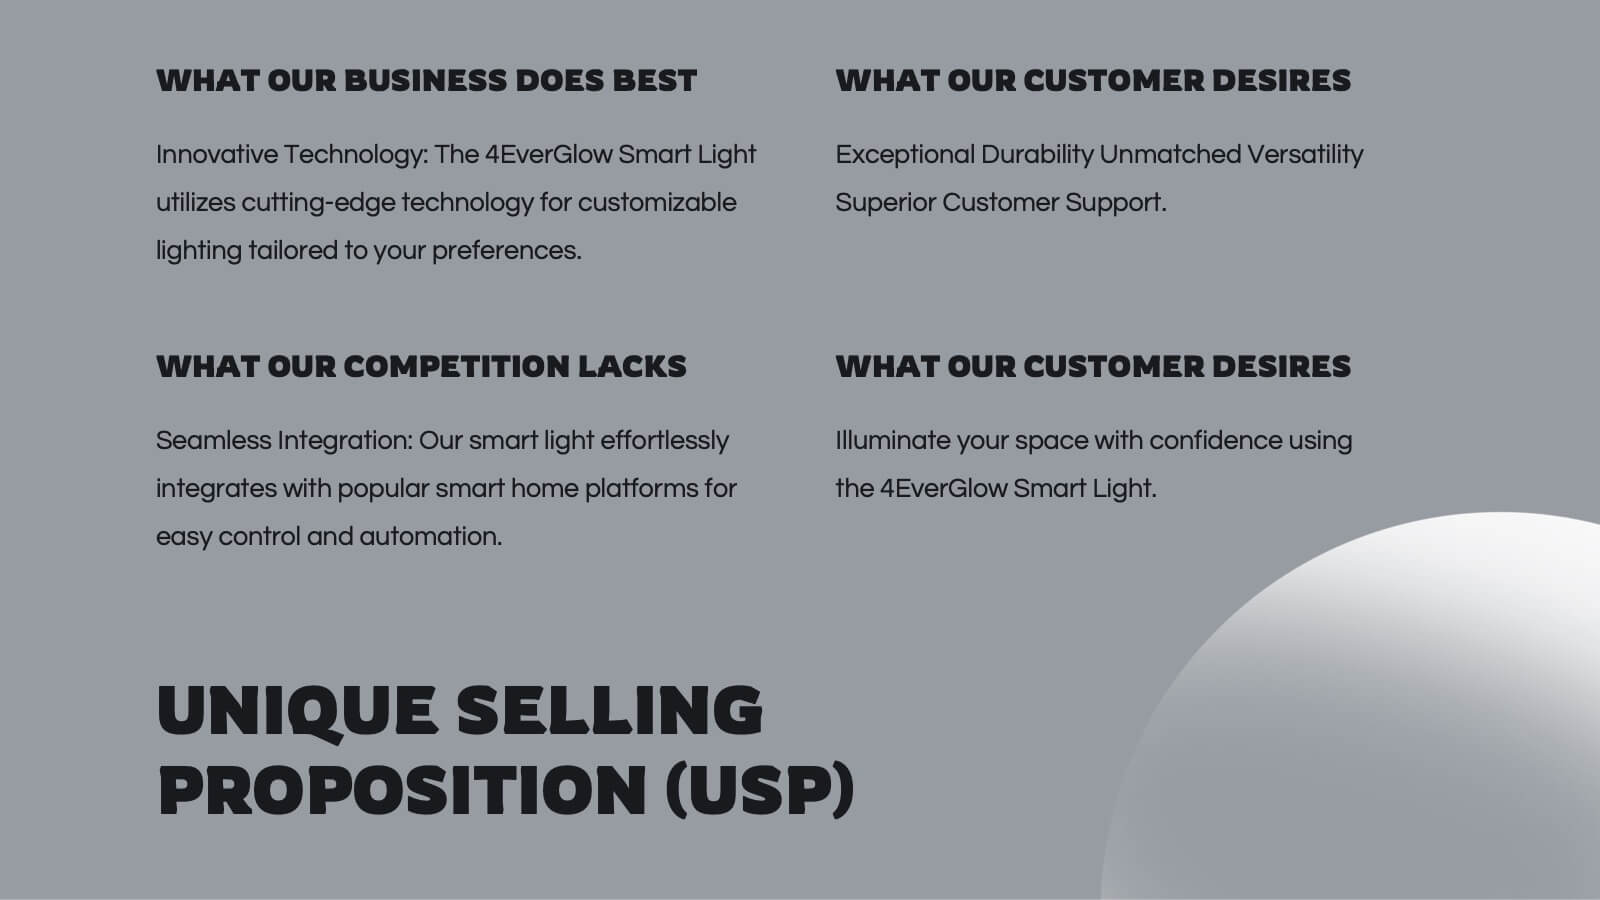
Clearly communicate your brand’s core value with this quadrant-style slide, ideal for pitching key benefits, market differentiators, or service pillars. Designed for product managers, marketers, and business consultants. Fully editable in PowerPoint, Keynote, and Google Slides—customize icons, titles, and layout with ease.


7 slides
E-Learning Infographic Presentation Template
An E-learning Infographic is an informative design that shows all the different ways that e-learning can be used in your classroom, as well as the benefits associated with each one. This infographic illustrates the popularity of e-learning and gives tips for creating compelling learning materials. This template is equipped with all the resources needed to create your e-learning infographic. It comes fully customizable and ready-to-use. This Infographic template provides a bare-bone structure and design, leaving space for you to add your own content and create the best presentation!

21 slides
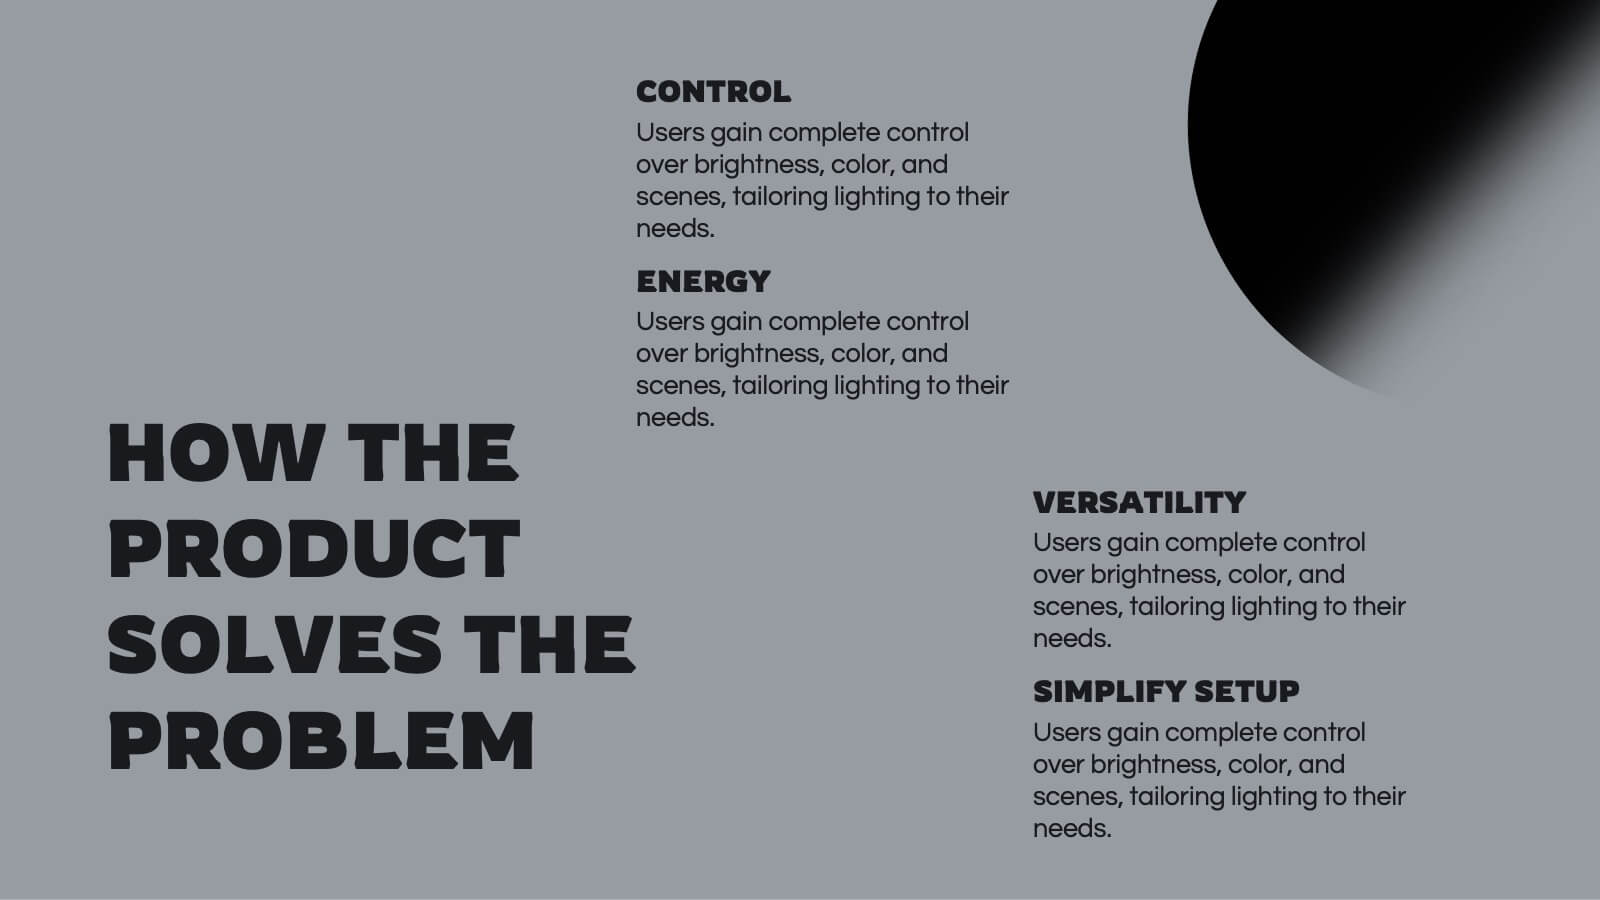
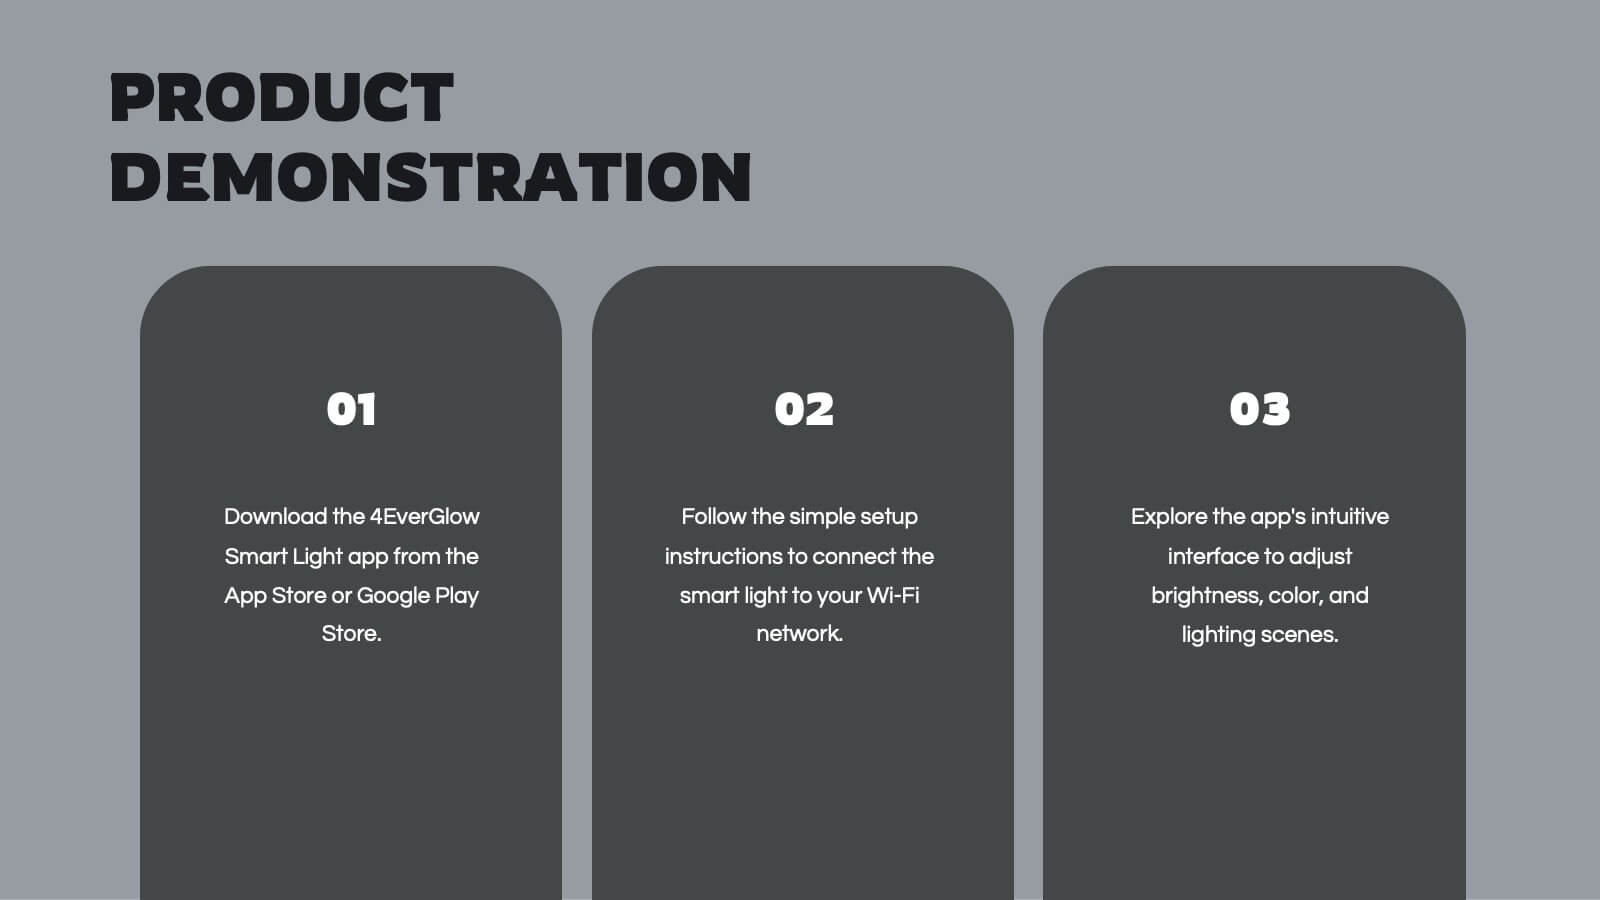
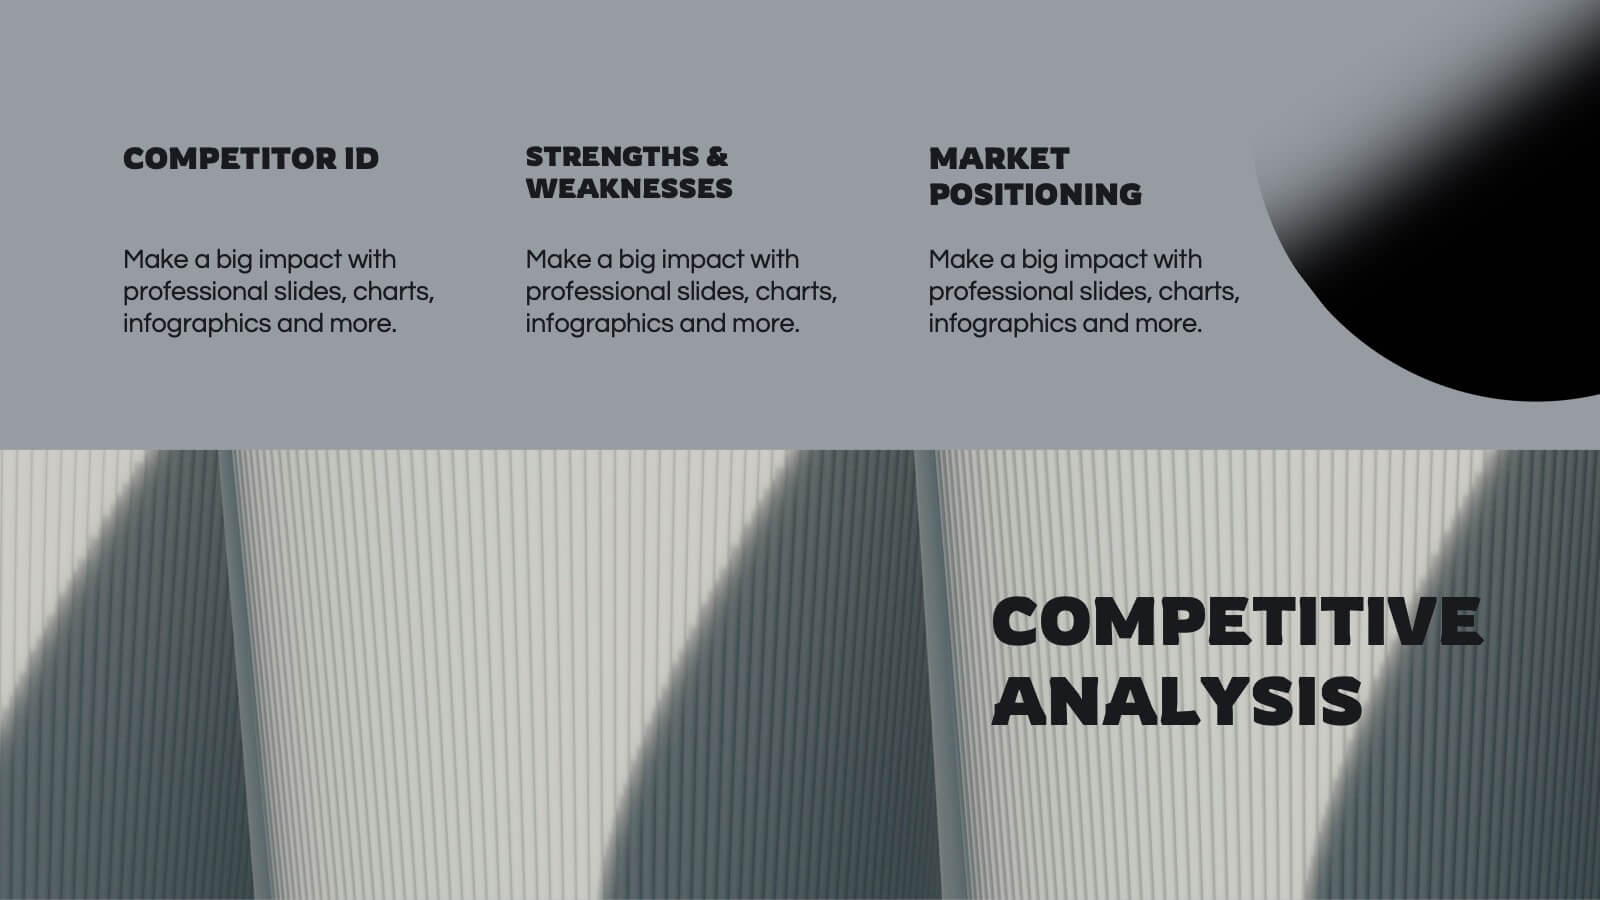
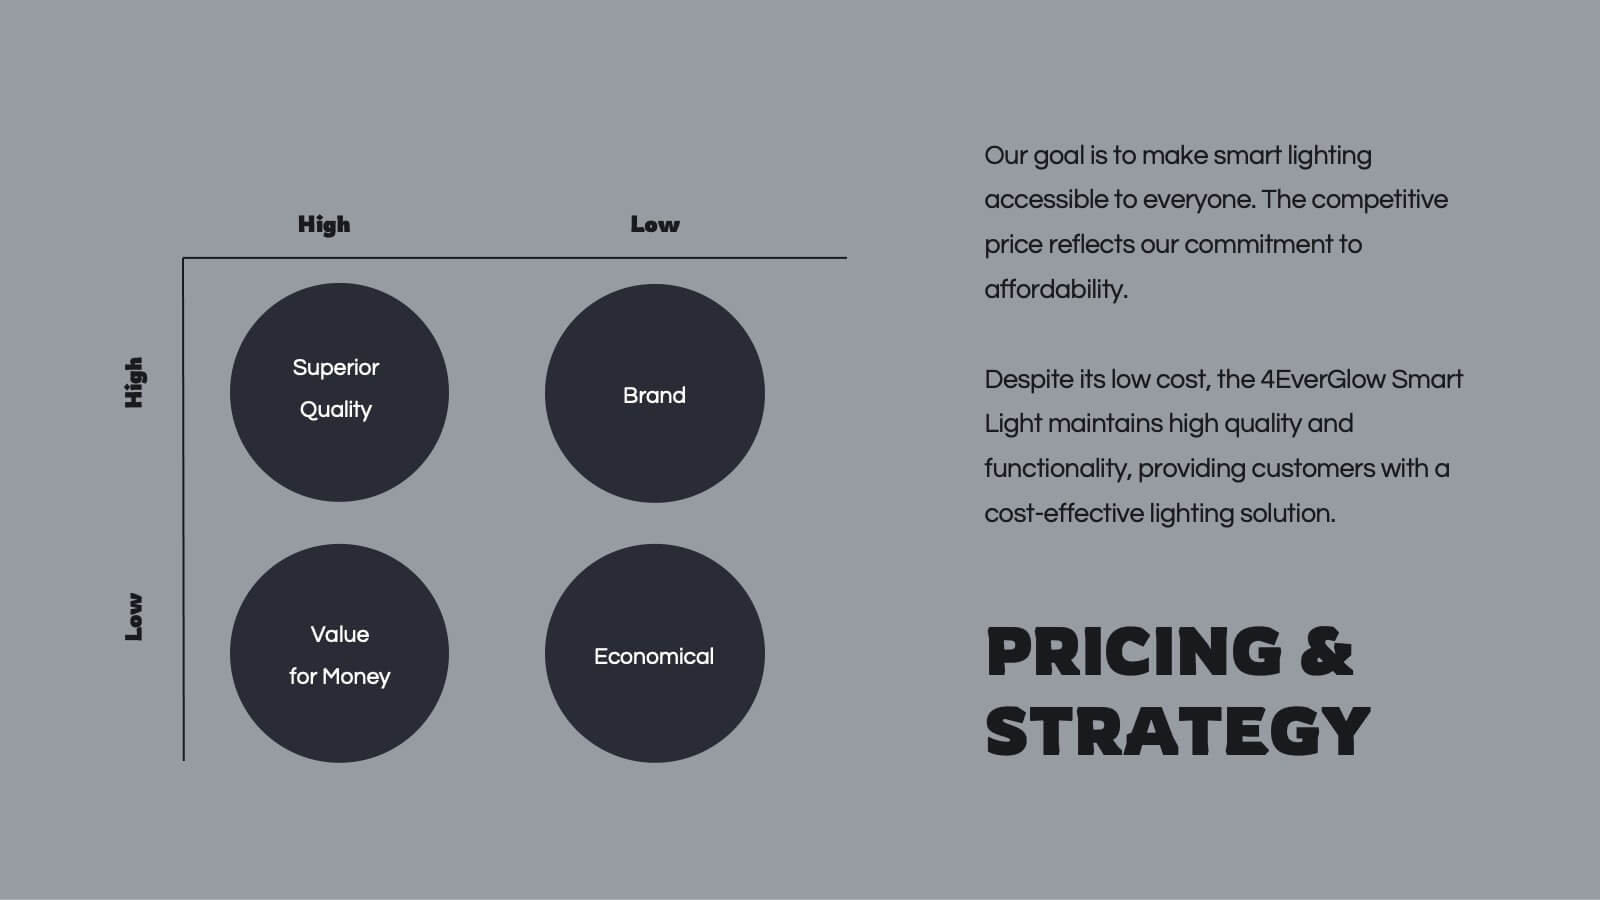
Spinel Product Strategy Report Presentation
Take your product strategy to the next level with this polished, spinel-inspired presentation! Designed to effectively communicate your product's goals, market analysis, and strategy roadmap, this template is both visually striking and easy to navigate. Its sharp design ensures a professional touch. Compatible with PowerPoint, Keynote, and Google Slides.


7 slides
Agenda Infographic
Organize and present your meeting or event agendas with our professionally designed slide templates. Each template is tailored to help you clearly outline the schedule and topics, ensuring that your meetings are both structured and efficient. These templates feature a variety of layouts that can accommodate different types of agendas, from detailed hourly breakdowns to high-level overviews. The use of engaging graphics, bullet points, and timeline visuals aids in presenting the sequence of events or discussion topics in a clear and appealing manner. Color coding and distinct typographic hierarchies make it easy to navigate through the agenda, enhancing readability and viewer engagement. Fully customizable, these slides allow you to adapt the design to your corporate colors, add your logos, and rearrange elements to suit your specific meeting needs. Ideal for business meetings, conferences, workshops, and seminars, these agenda slides are essential tools for keeping your events organized and on track.


4 slides
Editable Table Chart Presentation
Simplify side-by-side evaluations with the Editable Table Chart Presentation. Designed for clear comparisons, this layout uses checkmarks, icons, and a clean structure to display features or data across multiple categories. It's perfect for showcasing product options, service tiers, or strategic alternatives. Fully customizable and compatible with PowerPoint, Keynote, and Google Slides.


6 slides
STEM Education and Discovery Presentation
Showcase your STEM insights with this vibrant puzzle-piece infographic. Each piece highlights a key point in science, technology, engineering, or math—perfect for lesson plans, research summaries, or discovery processes. Fully customizable in PowerPoint, Keynote, and Google Slides, making it ideal for educators, researchers, or curriculum developers.


5 slides
Executive Summary of Business Goals Presentation
Showcase your strategic objectives clearly with this Executive Summary of Business Goals Presentation. Featuring a layered pyramid structure and bold icons, it effectively breaks down five key goals or priorities. Perfect for business reviews, annual plans, or leadership meetings. Fully customizable in Canva, PowerPoint, or Google Slides.
5 slides
Project Progress Milestones Tracker Presentation
Stay on track and make timelines shine with this clean, visual layout. This template helps you clearly showcase task progress, deadlines, and deliverables over time—perfect for project updates, team planning, or stakeholder reporting. Fully editable and easy to use in PowerPoint, Keynote, and Google Slides for seamless collaboration.


6 slides
Financial Report and Charts Presentation
Deliver financial insights with impact using this Financial Report and Charts Presentation Template. Featuring a clean layout with a money bag visual and percentage breakdowns, it’s perfect for showcasing profit distribution, investment categories, or budget summaries. Fully customizable in PowerPoint, Keynote, and Google Slides.


4 slides
Cost Comparison Analysis Chart Presentation
Turn your price evaluations into something visually compelling with this sleek and modern layout. Perfect for showcasing product features, service packages, or market comparisons, it simplifies decision-making with a clear side-by-side design. Fully editable and compatible with PowerPoint, Keynote, and Google Slides for effortless customization.


6 slides
Supply Chain Management Strategy Presentation
Enhance your logistics planning with the Supply Chain Management Strategy template. This visually structured design simplifies key supply chain components, from procurement to distribution, making it ideal for analysts and operations teams. Fully customizable and compatible with PowerPoint, Keynote, and Google Slides for a seamless and professional presentation experience.


5 slides
The Future of Food Waste Infographics
Food Waste refers to the loss or disposal of food that is still edible or could have been consumed. These infographic template are designed with the aim of raising awareness, inspiring change, and empowering individuals and organizations to take action towards a more sustainable food system. These infographics are perfect for anyone interested in understanding the future trajectory of food waste and exploring potential solutions. With these infographic templates, create a presentation that inspires action and foster a collective commitment to combating food waste for a more sustainable future.


5 slides
Tiered Strategy Framework Pyramid Presentation
Break down your plan into clear, actionable steps with this Tiered Strategy Framework Pyramid presentation. Each arrow-shaped tier helps visualize hierarchical strategies, workflows, or growth levels. Use this layout to communicate priorities, initiatives, or milestones in a sleek and modern format. Fully editable in Canva, PowerPoint, or Google Slides.


7 slides
College Statistics Infographic Presentation
A College Statistics Infographic is a visual representation of key data and statistics related to a college. This template can provide a quick and easy-to-understand overview of various aspects of the institution, such as enrollment figures, graduation rates, student demographics, and academic performance metrics. Featured are icons, illustrations, diagrams, and other design elements to enhance the visual appeal of this infographic and make it more engaging for your viewers. This template can be a useful tool for students, teachers, and others interested in learning more about a college.


6 slides
Iceberg Business Infographic
Delve beneath the surface with our Iceberg Business Infographic, perfect for Powerpoint, Google Slides, and Keynote. This infographic is designed to illustrate the underlying factors that impact an organization's success. The iceberg metaphor visually represents the concept that only a small part of a company's situation is visible above the surface, while much more is hidden below. The customizable segments can be used to detail various aspects of business operations, risks, and opportunities that are not immediately apparent. By employing this Iceberg Business infographic, you can effectively communicate the complexities of business strategies.


20 slides
Fluxion Product Launch Pitch Deck Presentation
Launch your next big idea with this sleek and impactful pitch deck! Featuring sections like market opportunities, business model, revenue streams, and team introductions, it ensures a persuasive narrative for investors. Perfect for startup launches or product pitches, this deck works seamlessly with PowerPoint, Keynote, and Google Slides.