


Features
- 7 Unique slides
- Fully editable and easy to edit in Microsoft Powerpoint, Keynote and Google Slides
- 16:9 widescreen layout
- Clean and professional designs
- Export to JPG, PDF or send by email


Do you have any questions?
Recommend


6 slides
Cash Management Strategy Presentation
Break down your financial priorities with a bold, visual approach. This cash management slide uses a segmented dollar symbol to represent key areas like budgeting, reserves, expenses, and more—making it easy to track strategy points at a glance. Ideal for finance teams, planning sessions, or investor decks. Compatible with PowerPoint, Keynote, and Google Slides.


7 slides
Social Media Management Infographic Presentation
Social media is an important part of any business, which is why you need the right tools to stay organized, save time, and boost your productivity. With the template you can design a fun infographic for your presentations, blog posts and social media posts. This is a great way to present Social Media Management topics including: marketing strategy, content creation, engagement, and growth. This template is compatible with Keynote, PowerPoint and Google Slides, so you can customize it in seconds. Download this template, and show your audience how social media can help their business grow!


4 slides
Break-Even Point Financial Analysis Presentation
Clearly define profitability with this break-even point financial analysis template. It visually maps costs, revenue, and profitability, helping businesses assess when they'll cover expenses and start making a profit. Perfect for financial forecasting and business planning. Fully customizable and compatible with PowerPoint, Keynote, and Google Slides for seamless editing and presentation.


7 slides
Psychology Infographic Presentation Template
Featuring our psychology infographic template made to provide you with a beautiful presentation that includes all the necessary elements for learning about psychology. Present your research and analysis in a clear, informative and engaging way with this template. Use the theme to highlight the most important concepts in psychology and explain each one with interesting facts, statistics and charts. Use this template to show information about the main topics or areas of psychology. This template is compatible with powerpoint and fully customizable to meet all your requirements!


6 slides
Editable Puzzle Infographic
Piece together complex data with our Editable Puzzle Infographic, compatible with Powerpoint, Google Slides, and Keynote. This engaging infographic is designed to help presenters visually connect different pieces of information in a cohesive and understandable way. The puzzle pieces are a metaphor for how individual components fit into a larger strategy or concept, making it perfect for collaborative projects or educational models. The infographic is fully customizable, allowing you to adapt the colors, text, and arrangement to fit your specific needs. With this puzzle infographic, you can make your presentations more interactive ensuring your audience can see the big picture every time.


20 slides
Solstice Product Launch Presentation
Introducing our product launch template! Highlight your product’s features, target audience, and unique selling proposition with a sleek, modern design. Showcase marketing strategies, distribution channels, and competitive landscape effortlessly. Ideal for sales teams and marketers. Compatible with PowerPoint, Keynote, and Google Slides.


6 slides
Work from Home Best Practices Presentation
The "Work from Home Best Practices" presentation template is thoughtfully designed to display metrics and insights for remote work effectiveness. Each slide provides visual elements like bar graphs, line charts, and icon grids to represent various data points such as weekly activity percentage, hours worked, and number of projects managed. This setup is ideal for illustrating best practices and benchmarks in remote work environments, enabling clear communication of goals, achievements, and areas for improvement. The template uses a clean and professional layout with plenty of space for customization, making it a versatile tool for remote teams looking to optimize their workflows and productivity.


6 slides
Dynamic Chart Visual Toolkit Presentation
Visualize data at a glance with the Dynamic Chart Visual Toolkit Presentation. This modern slide set combines revenue boxes, line trends, and circular progress charts to showcase performance metrics or KPIs effectively. Clean, minimal, and fully editable in Canva, PowerPoint, Keynote, or Google Slides—perfect for reports, dashboards, and marketing updates.


7 slides
Executive Summary Plan Infographic Presentation
An Executive Summary Infographic is a visual representation of the key points and highlights of a longer report or document. Use this creative template as a way to present complex information in a simplified and visually appealing way, allowing busy executives and decision-makers to quickly understand the main findings and recommendations. This template includes a mix of charts, graphs, and other visual elements, along with text. This template's purpose is to help busy executives and decision-makers understand the main points of a report, without having to read through the entire document.


6 slides
Audience Targeting and Segmentation
Get to know your audience like never before with this human-centered visual layout—ideal for mapping out key segments, demographics, and targeting strategies. Great for marketing plans, user personas, or customer insights presentations, this slide keeps your data visually focused and easy to digest. Fully compatible with PowerPoint, Keynote, and Google Slides.


5 slides
Dynamic SWOT Quadrant Assessment Presentation
Present your strategy with clarity using the Dynamic SWOT Quadrant Assessment Presentation. This clean, four-quadrant layout organizes your Strengths, Weaknesses, Opportunities, and Threats in a visually balanced format, perfect for strategic reviews and planning workshops. The bold quadrant visuals help guide the audience’s focus while allowing for detailed commentary alongside each factor. Fully customizable in PowerPoint, Keynote, and Google Slides.


6 slides
Agenda on Education Infographic
Our Agenda Slide Templates are thoughtfully designed to facilitate clear and structured presentations for any educational context. Each template features a clean, professional design, making them ideal for delivering complex information in a digestible format. The collection includes various layouts from simple and focused to more detailed and infographic-rich, ensuring that every meeting's purpose is supported visually and functionally. These slides are customizable, allowing users to easily adapt them by changing colors, text, and graphics to suit specific branding needs. They are perfect for enhancing communication in settings that demand clarity and precision, providing all the necessary tools to organize content effectively and engage audiences. They are perfect for enhancing communication in settings that demand clarity and precision, providing all the necessary tools to organize content effectively and engage audiences.


4 slides
Differentiation through Blue Ocean Framework Presentation
Make waves with this bold, eye-catching layout built to show what sets your strategy apart. This presentation template explores how to stand out in untapped markets using a simple comparison framework, perfect for teams shifting from competition to innovation. Easily editable and ready for PowerPoint, Keynote, and Google Slides.


21 slides
Runewood Marketing Proposal Template Presentation
The Marketing Proposal Presentation Template provides 21 slides covering core aspects like market presence, growth strategies, and financial highlights. Perfect for agencies and businesses to showcase their marketing strategies effectively. Fully customizable and compatible with PowerPoint, Keynote, and Google Slides.


24 slides
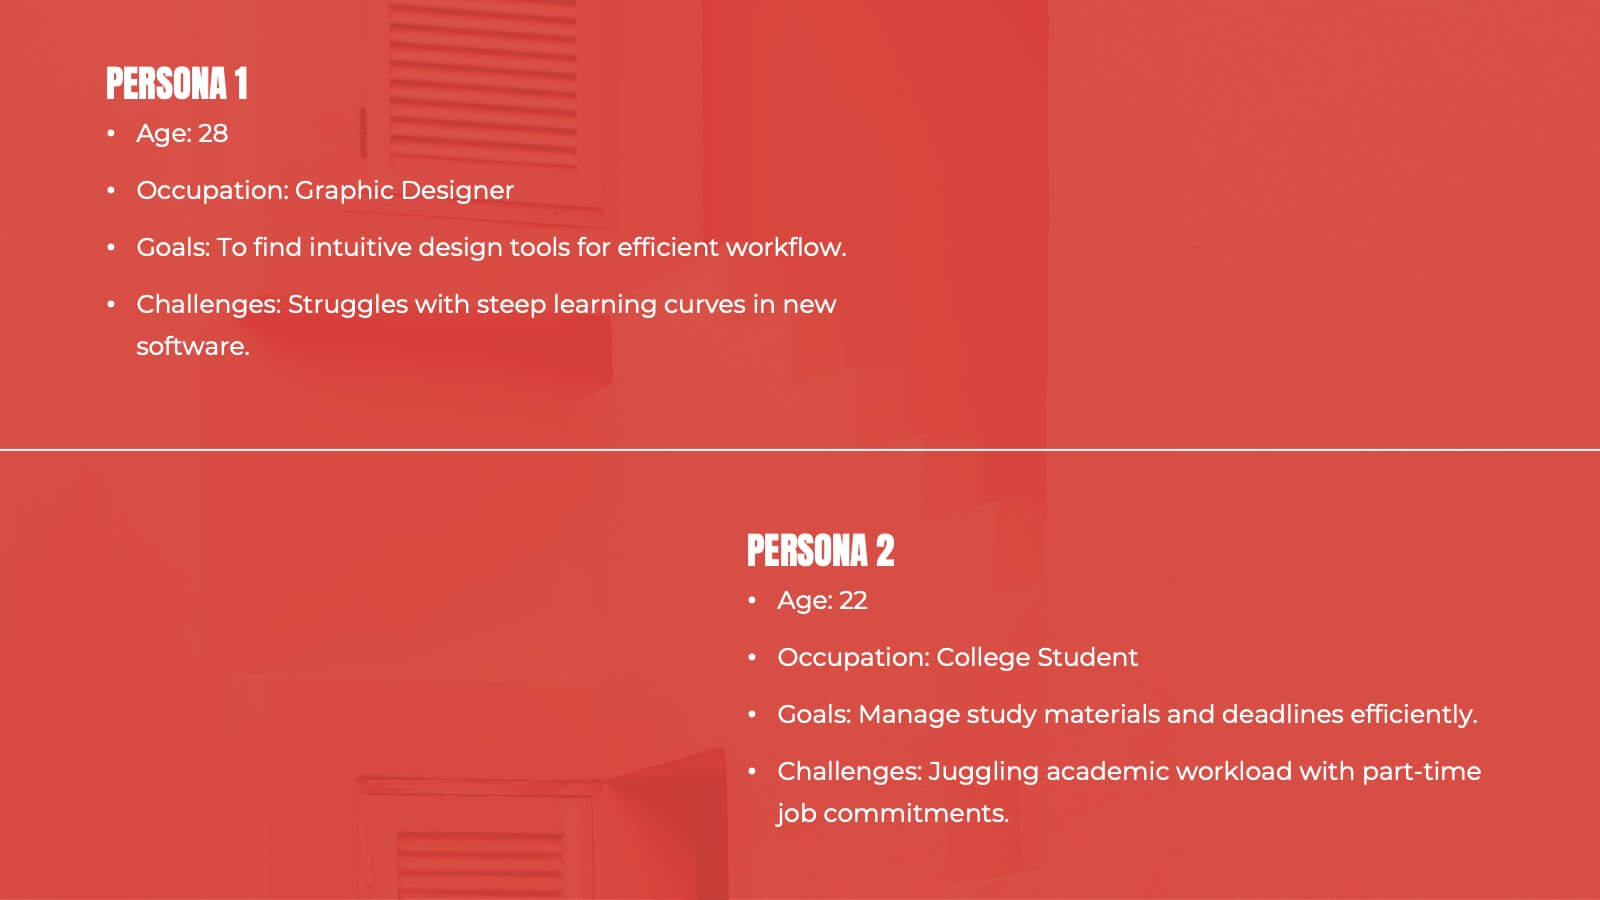
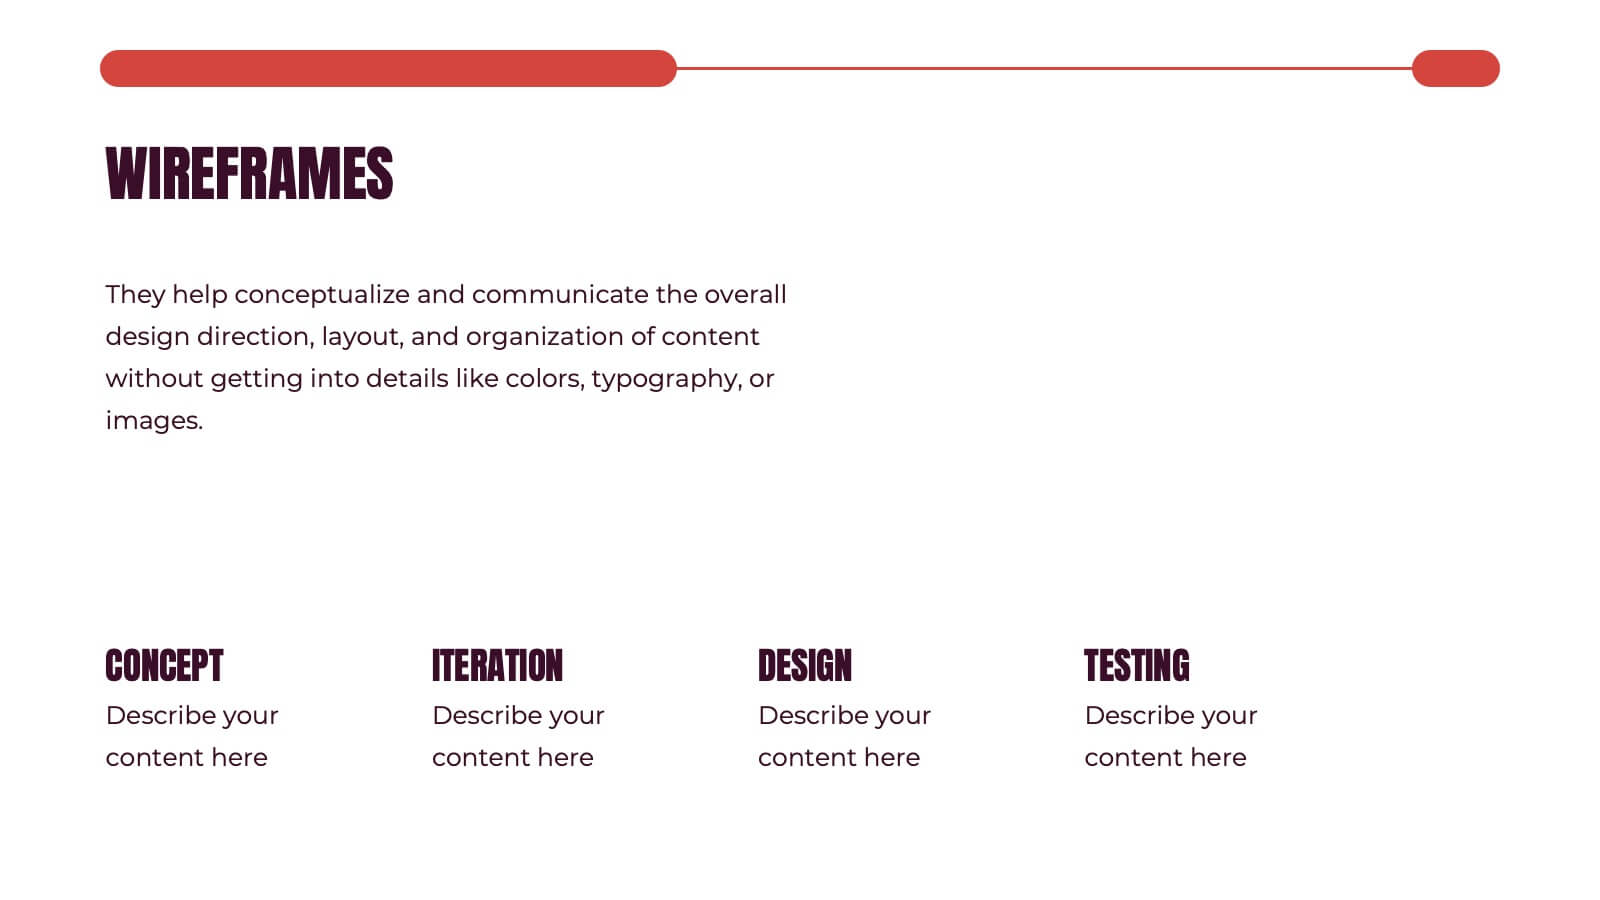
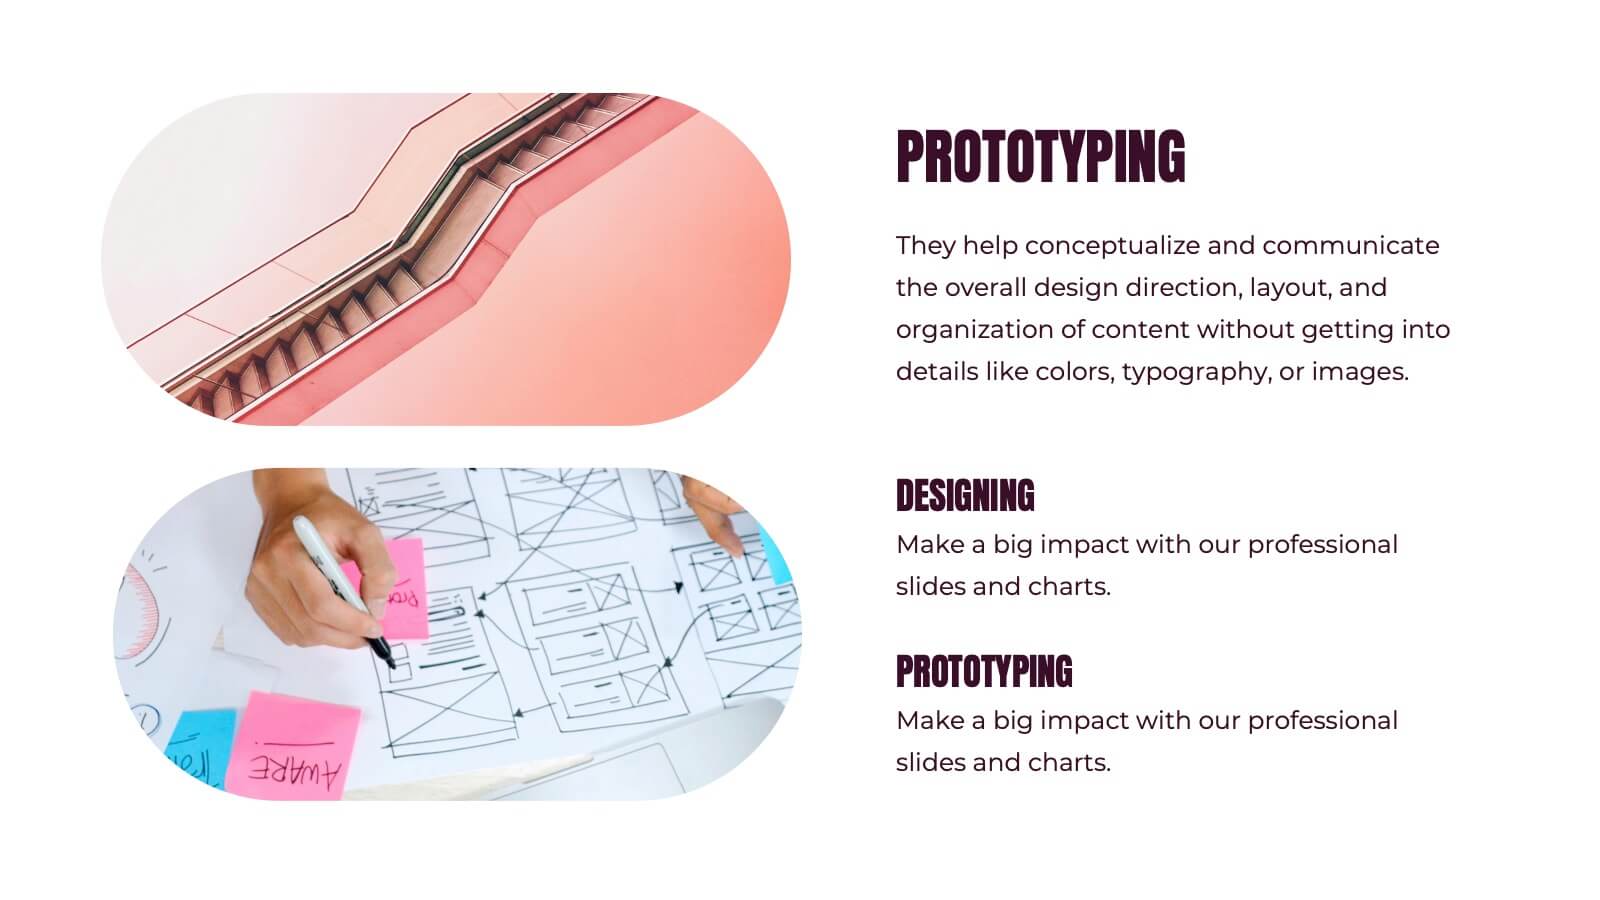
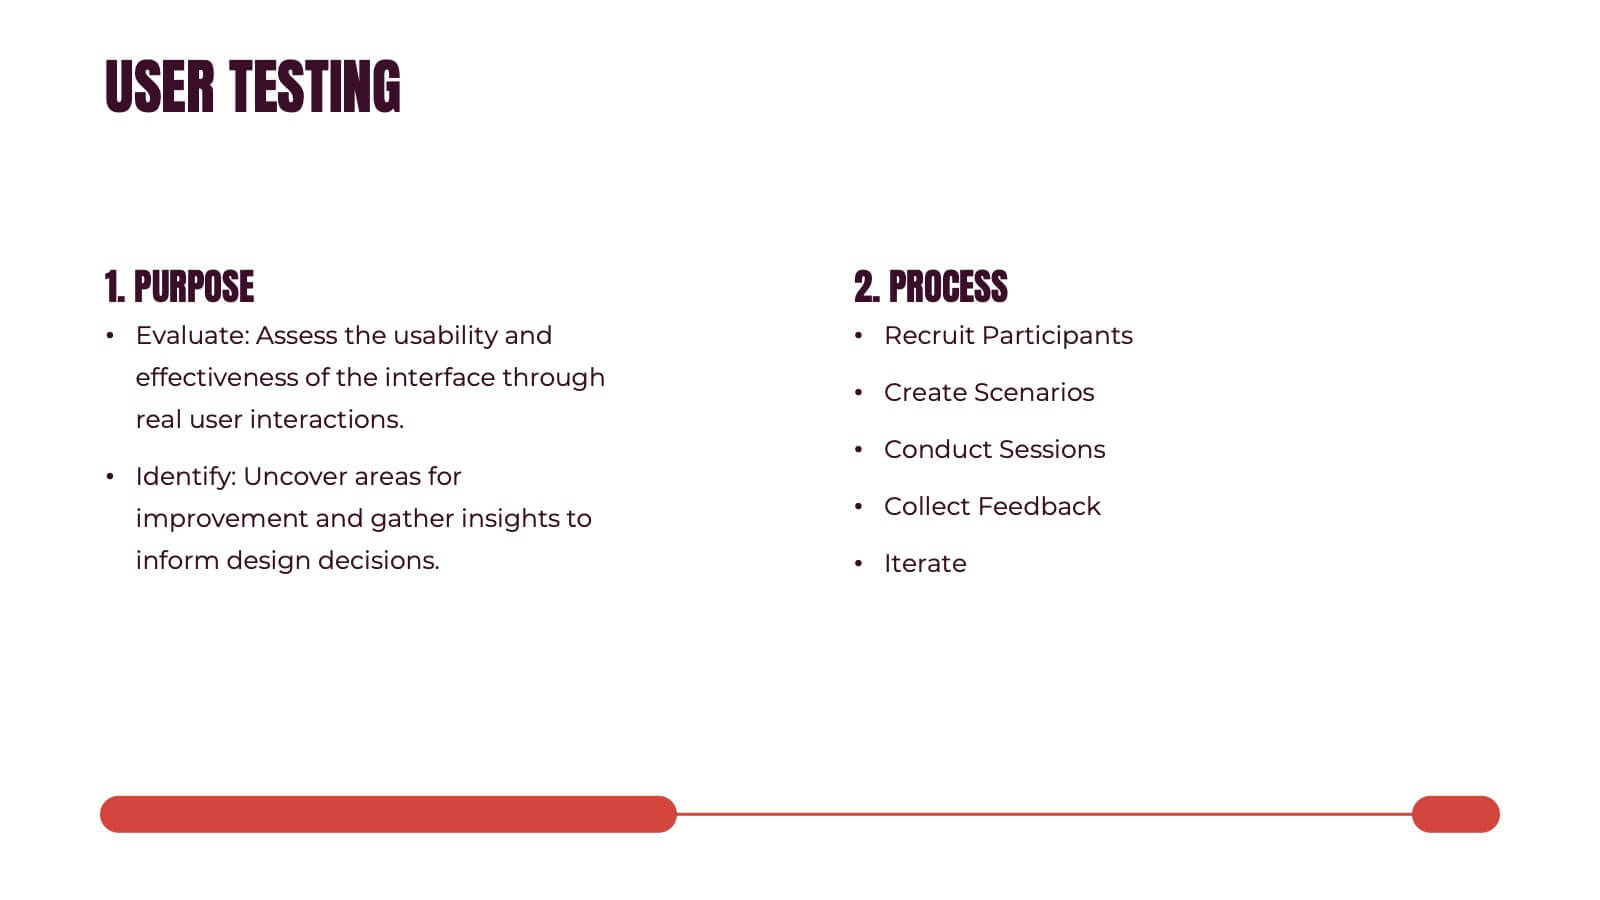
Kismet UX Design Presentation
Dive into the world of design with this stunning presentation template! Perfect for explaining user experience concepts, this template covers everything from wireframes to prototyping. It's designed to captivate your audience with visually engaging slides and clear, concise information. Compatible with PowerPoint, Keynote, and Google Slides for effortless use across platforms.


7 slides
Human Resources Management Infographic Presentation
Human Resources are responsible for ensuring that an organization has the right people in the right roles, with the right skills and knowledge, to achieve its goals and objectives. This template is a great way to tell the story of your company and provide information about it. This template is compatible with Powerpoint, Keynote and Google Slides it includes 7 unique slides that are ready for you to design and customize with your own information, text and graphs. You can easily change the colors to your needs and add images. This is an informative way to highlight your business and its vision.


5 slides
Business Model Canvas and Strategy Presentation
Visualize your entire business model in one clean, structured slide. This presentation template breaks down key areas—Partners, Activities, Value Propositions, Customers, Channels, Costs, and Revenue—into a color-coded layout for strategic clarity. Perfect for startups, consultants, or internal strategy teams. Fully editable in PowerPoint, Keynote, and Google Slides.