


Features
- 6 Unique slides
- Fully editable and easy to edit in Microsoft Powerpoint, Keynote and Google Slides
- 16:9 widescreen layout
- Clean and professional designs
- Export to JPG, PDF or send by email


Do you have any questions?
Recommend


22 slides
Tranquil Project Status Report Presentation
This dynamic project report template delivers key insights with a bold, modern design. From performance metrics to market trends and client feedback, it's crafted for comprehensive yet visually appealing updates. Perfect for team presentations, this template ensures clarity and engagement. Compatible with PowerPoint, Keynote, and Google Slides, it’s ideal for project leaders!


6 slides
DMAIC Six Sigma Framework Presentation
Dive into process perfection with our DMAIC Six Sigma Framework template! This visually appealing guide breaks down each phase—Define, Measure, Analyze, Improve, and Control—making it easier to streamline operations and enhance quality. Fully compatible with PowerPoint, Keynote, and Google Slides, it's designed for professionals dedicated to operational excellence and continuous improvement.


22 slides
Reverium Startup Funding Proposal Presentation
Secure investor interest with this thoughtfully designed startup funding proposal template. Tailored for early-stage ventures, this presentation walks your audience through your business journey, product offerings, market potential, and financial projections in a clear and captivating format. Highlight your unique value proposition, growth strategies, and competitive edge with modern, easy-to-edit slides. Present your founding story, team expertise, and detailed market analysis to build credibility and foster trust. Conclude with a compelling call to action and funding requirements to solidify your pitch. Compatible with PowerPoint, Google Slides, and Keynote, this template ensures seamless customization for any startup looking to present a polished and professional funding proposal. Perfect for pitch meetings, investor decks, and capital raising initiatives.


23 slides
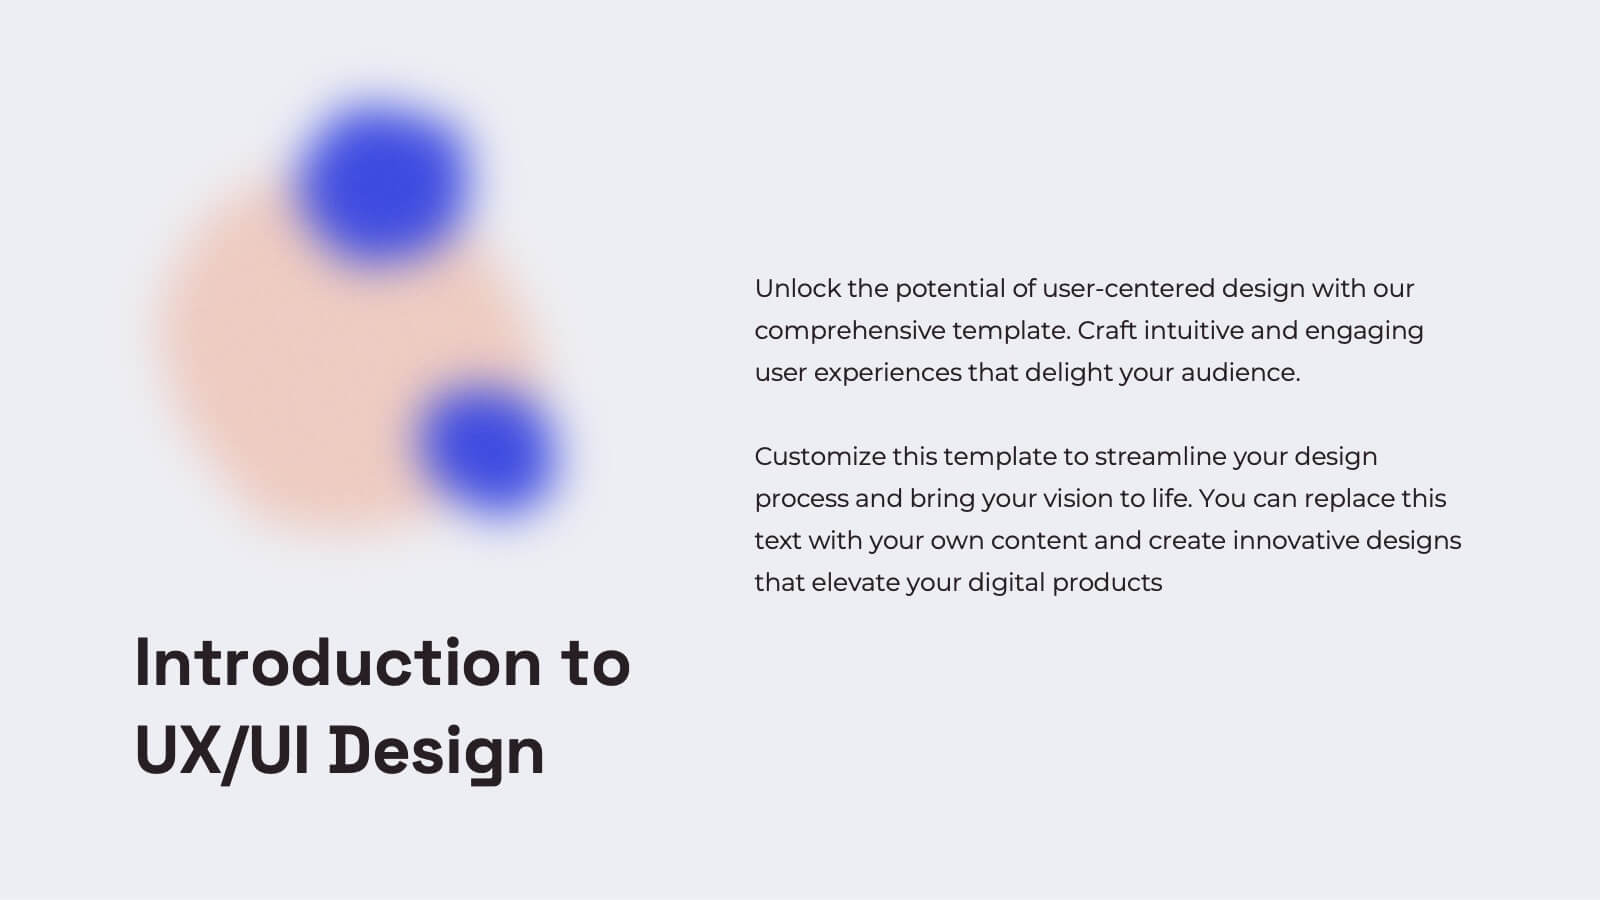
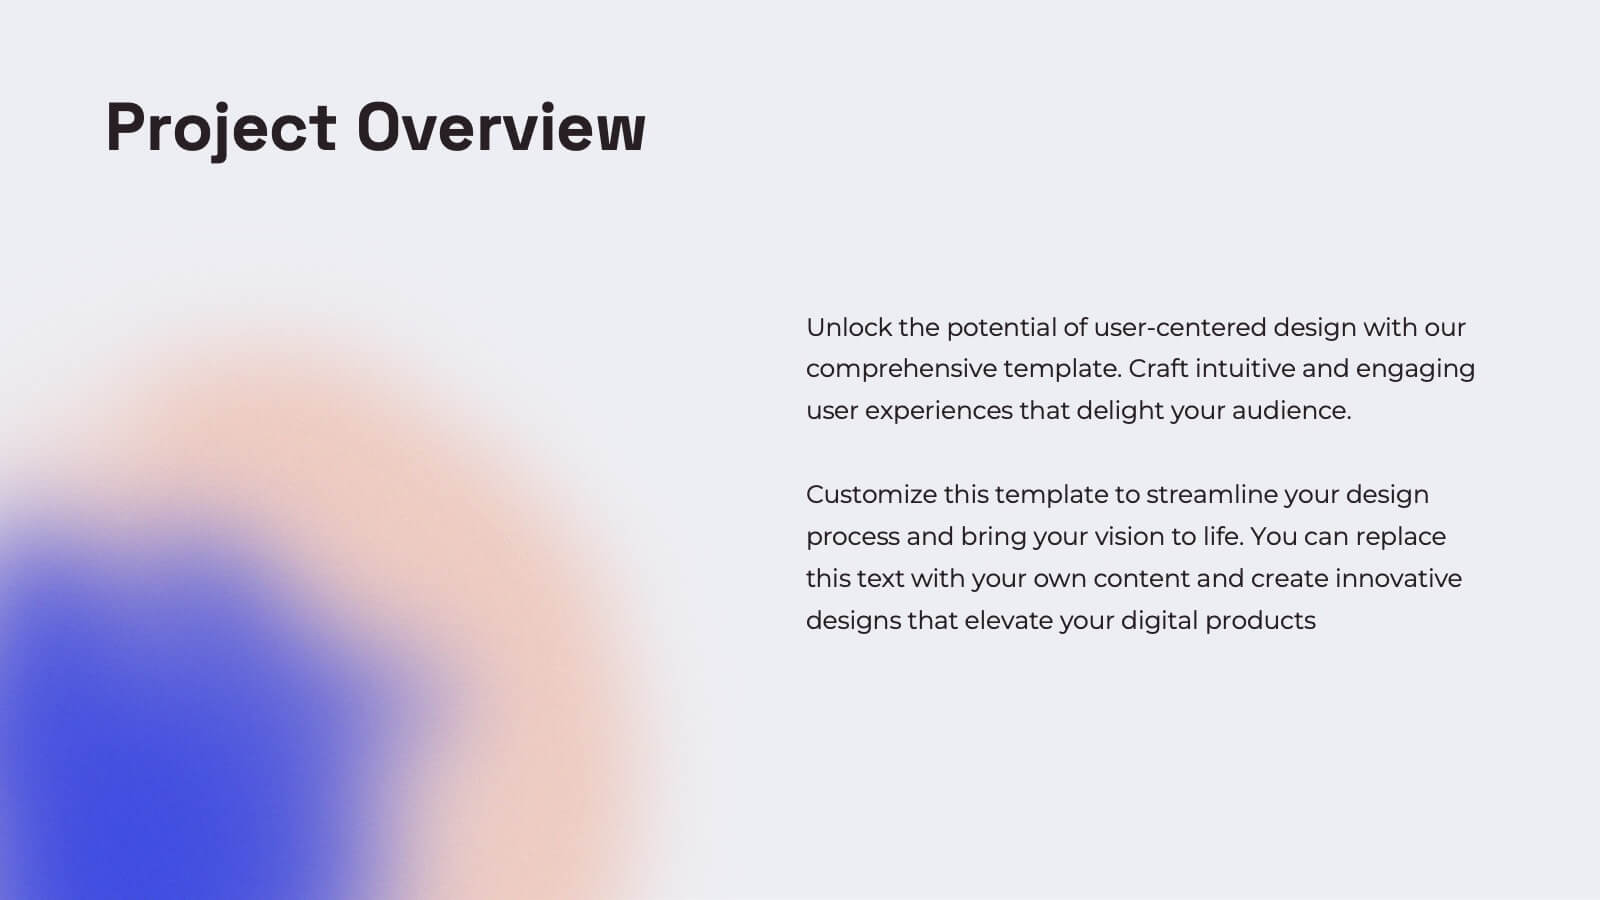
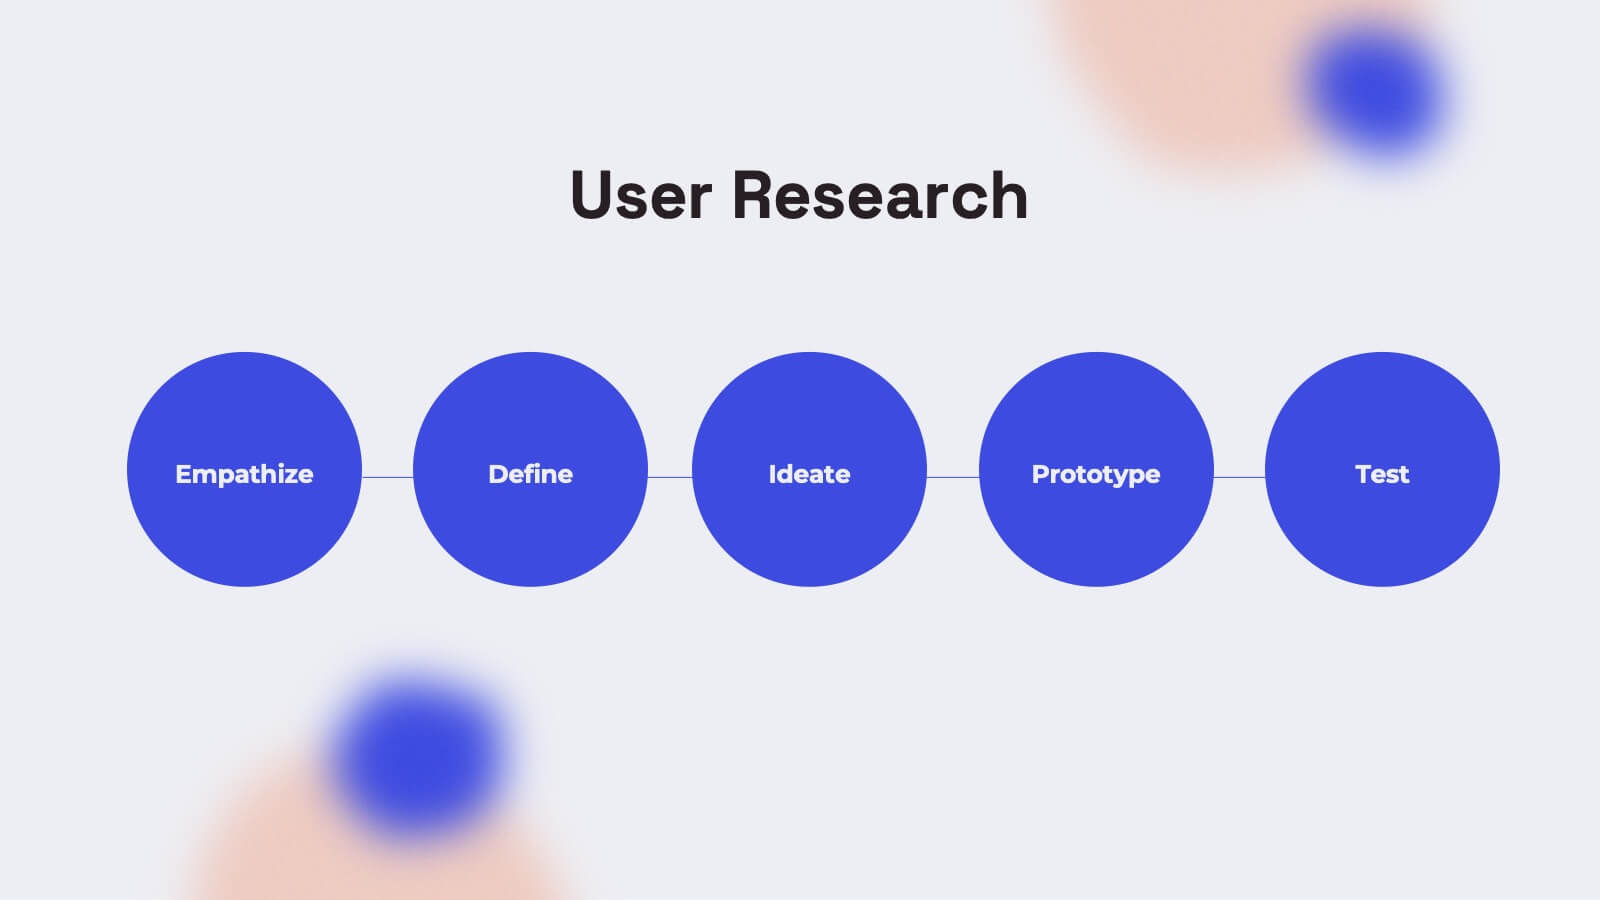
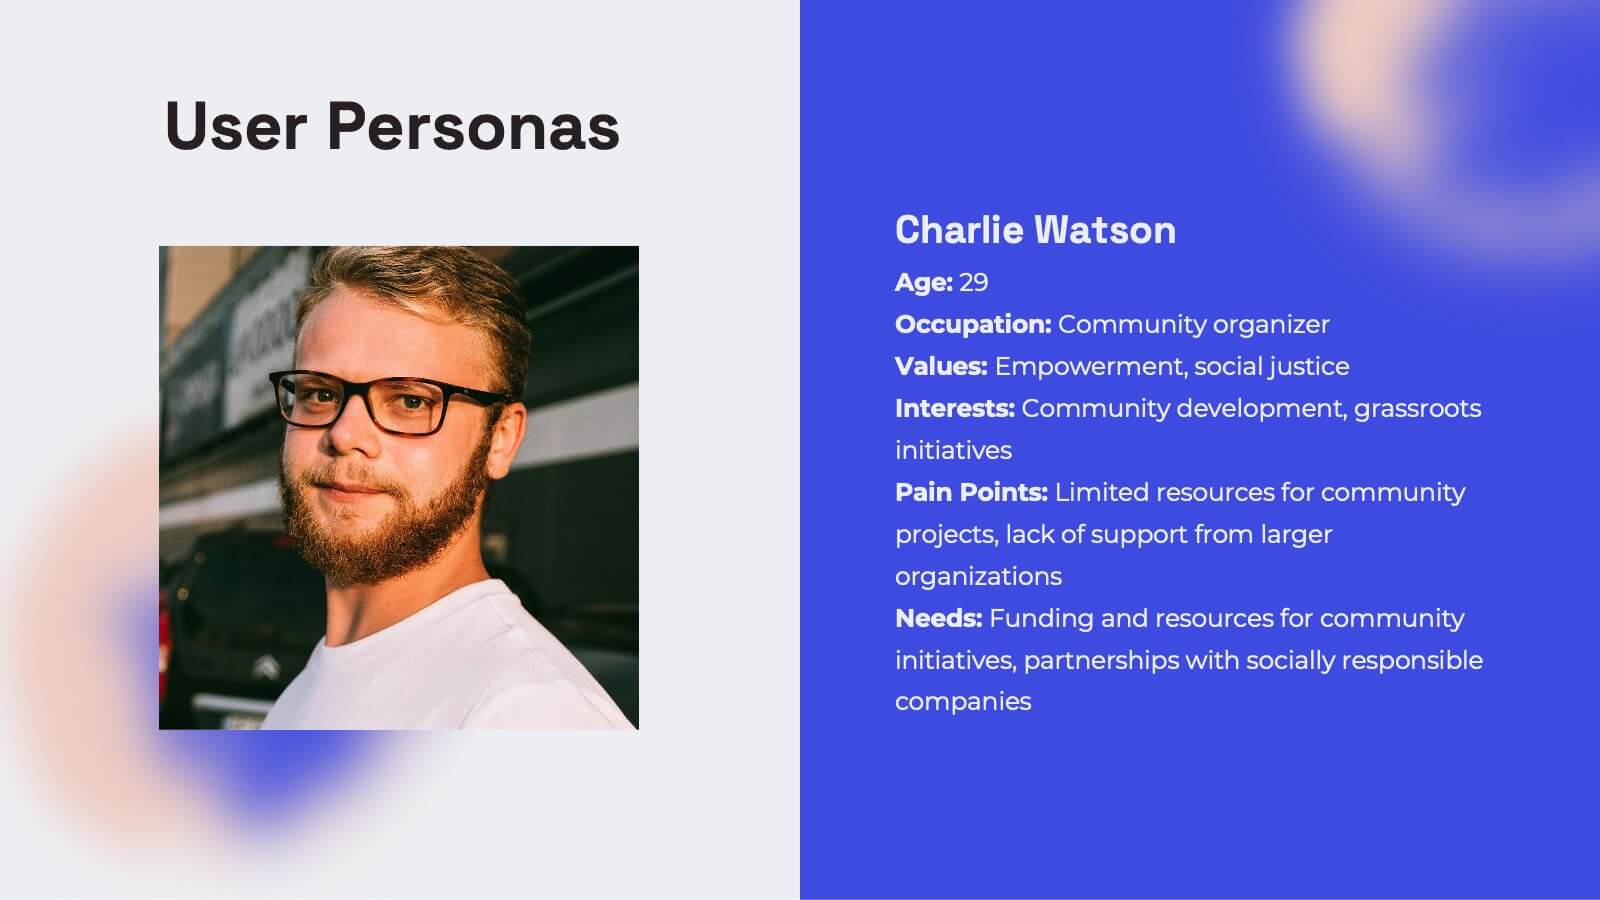
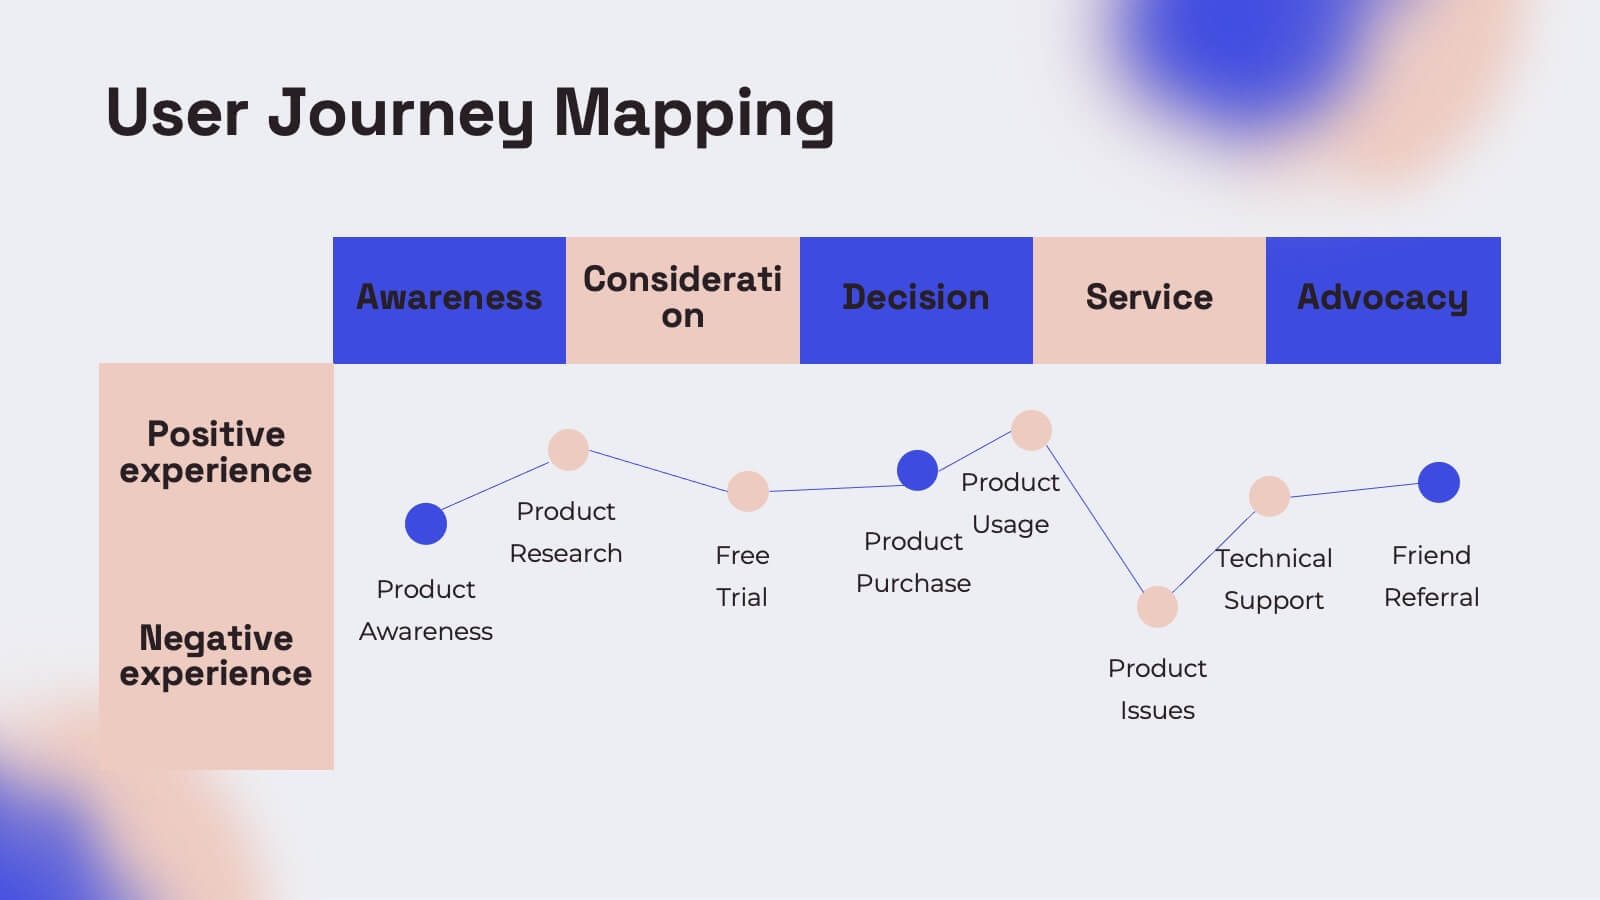
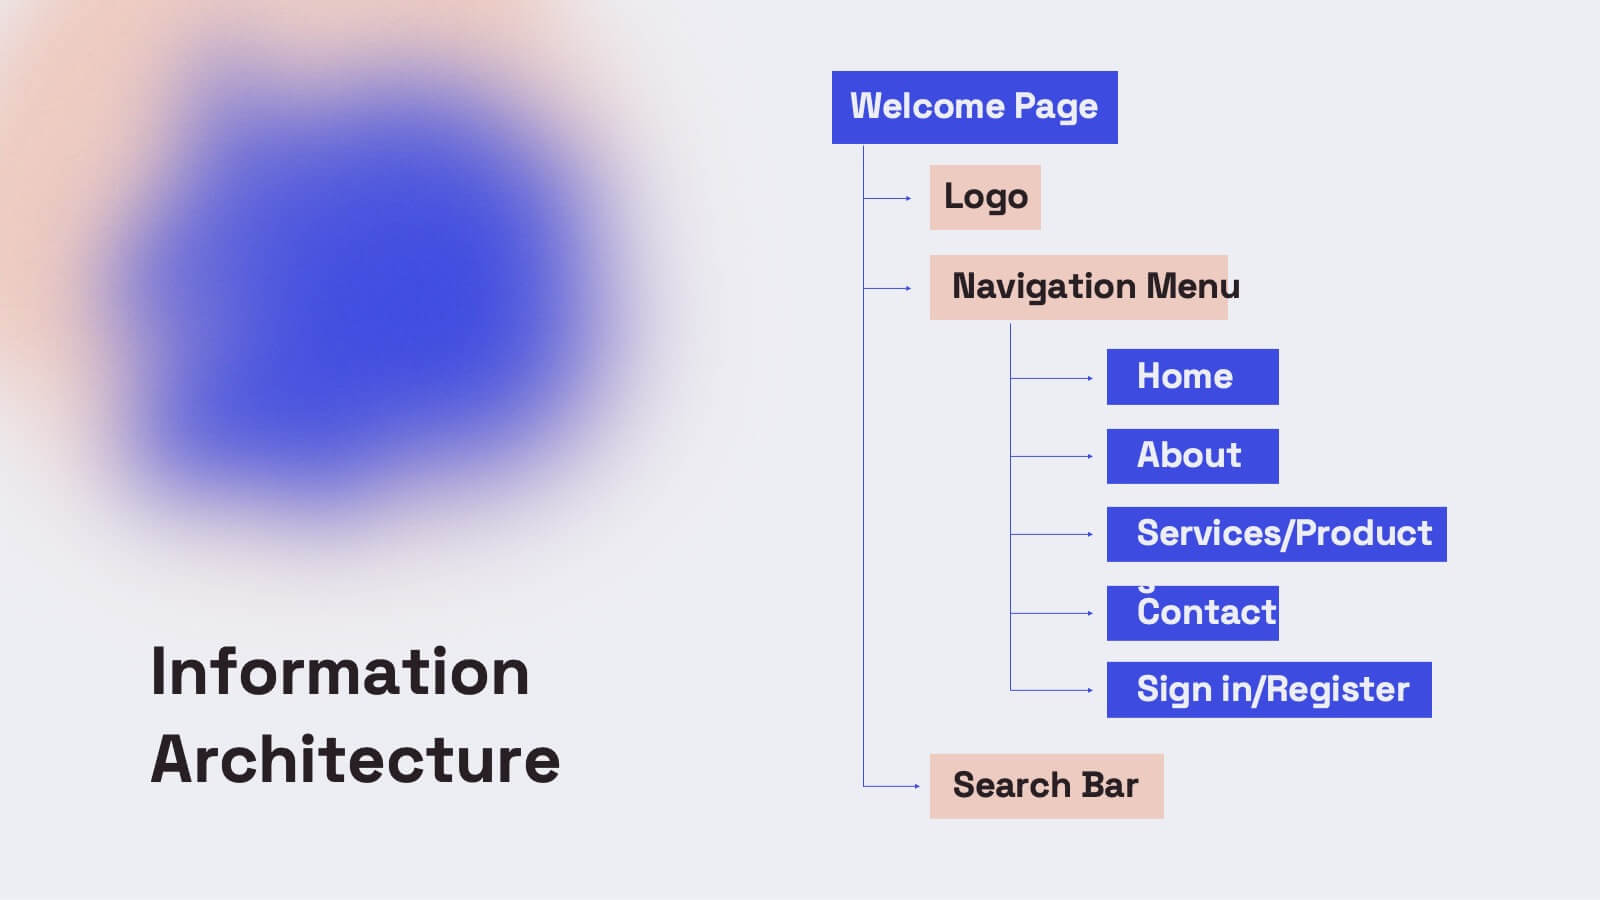
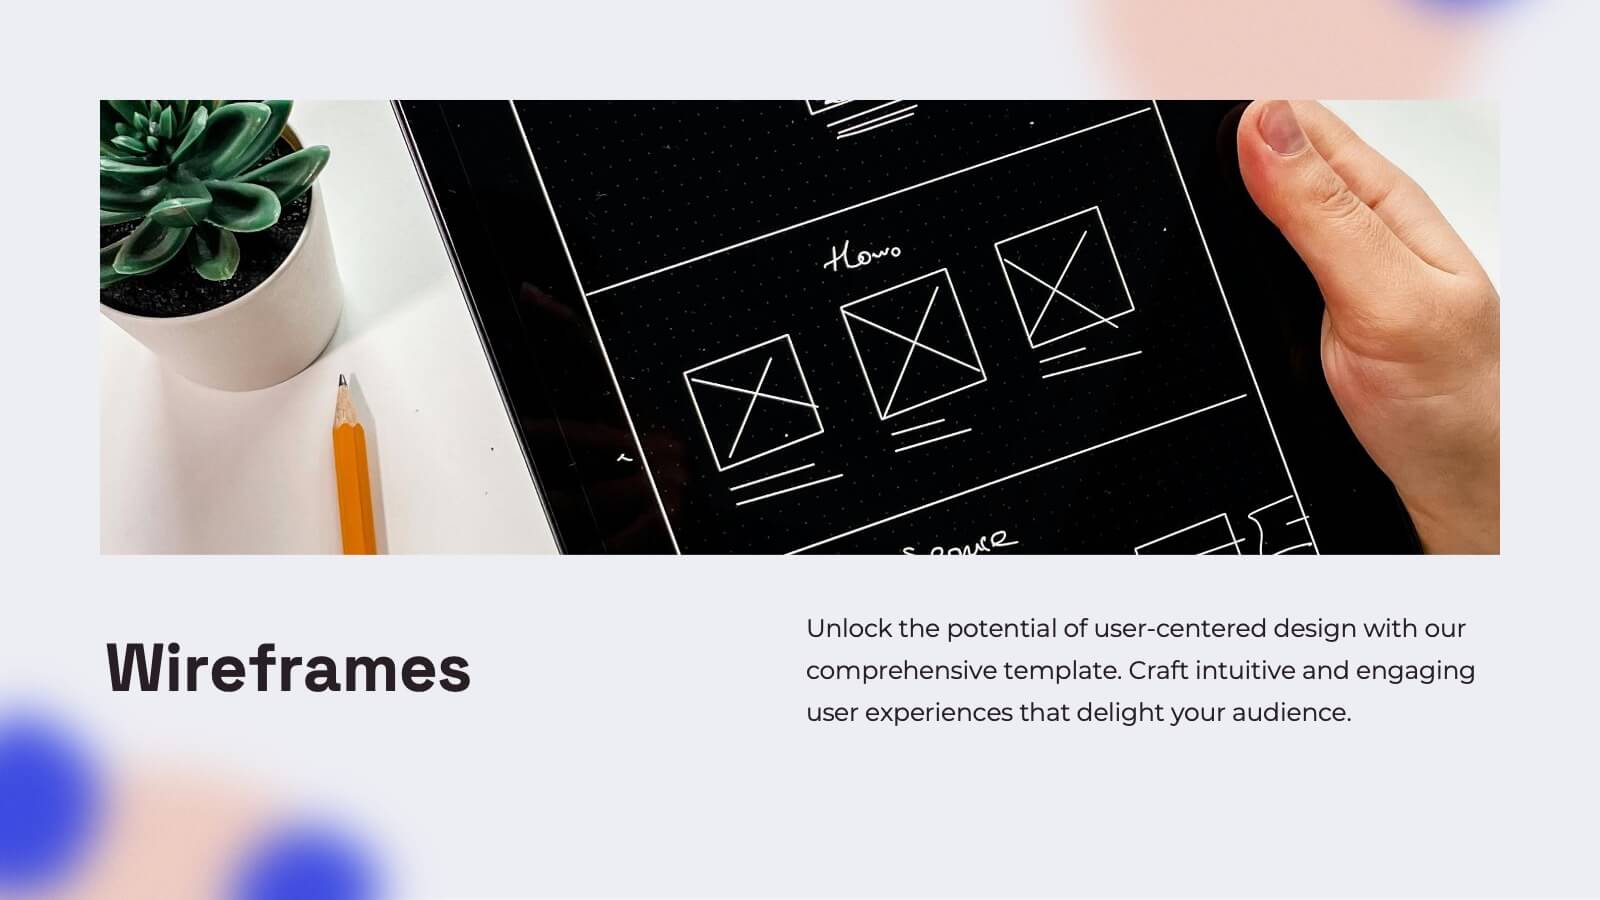
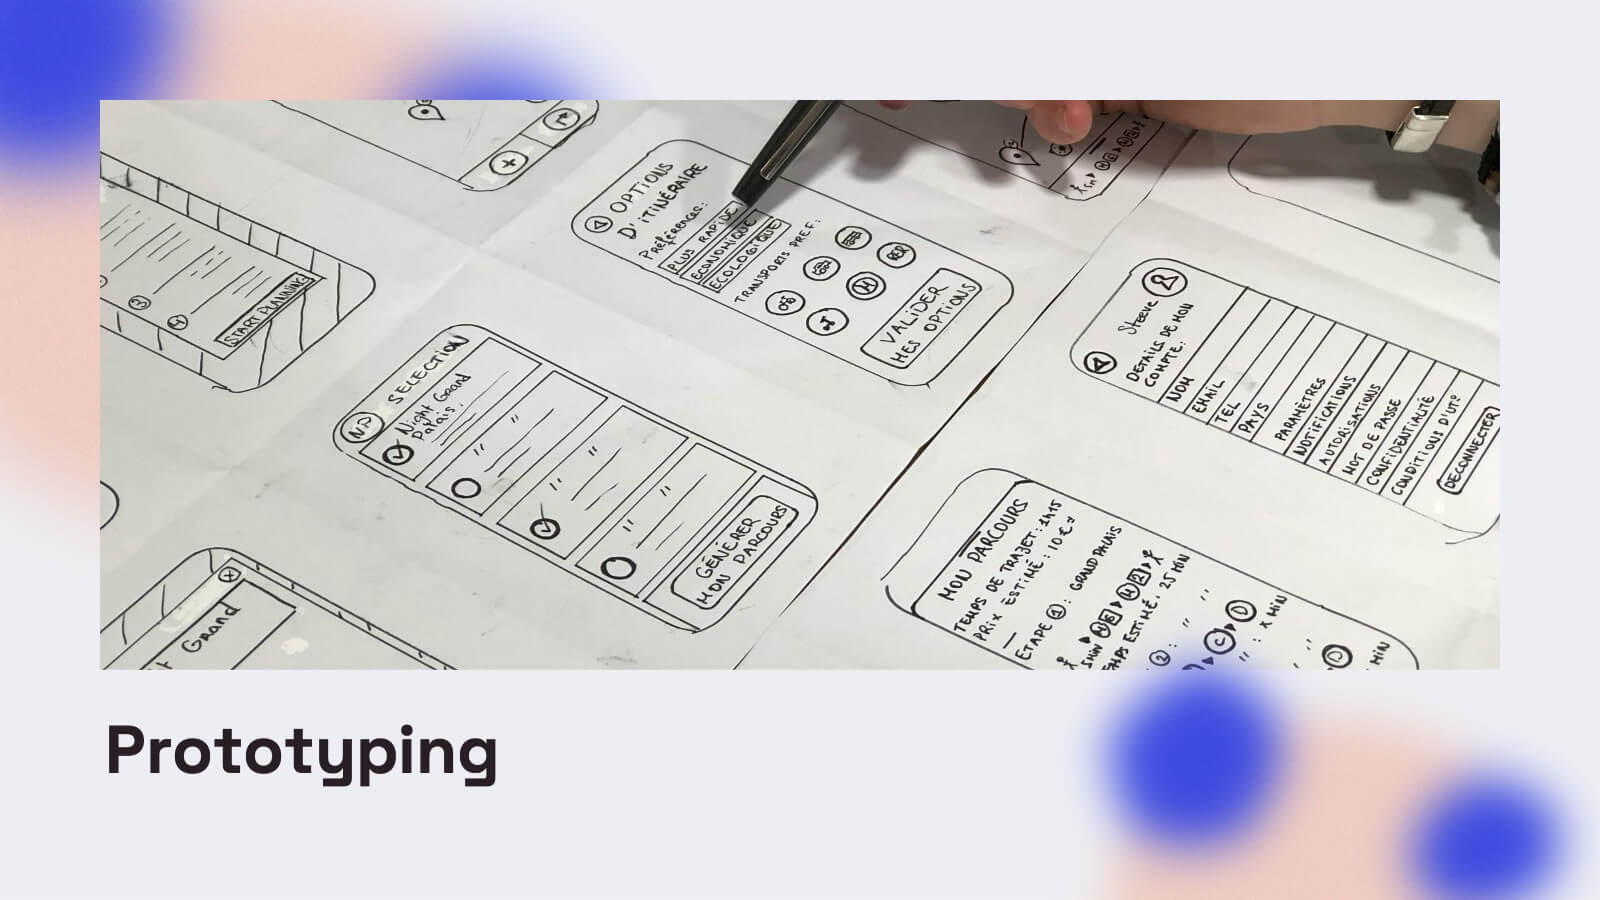
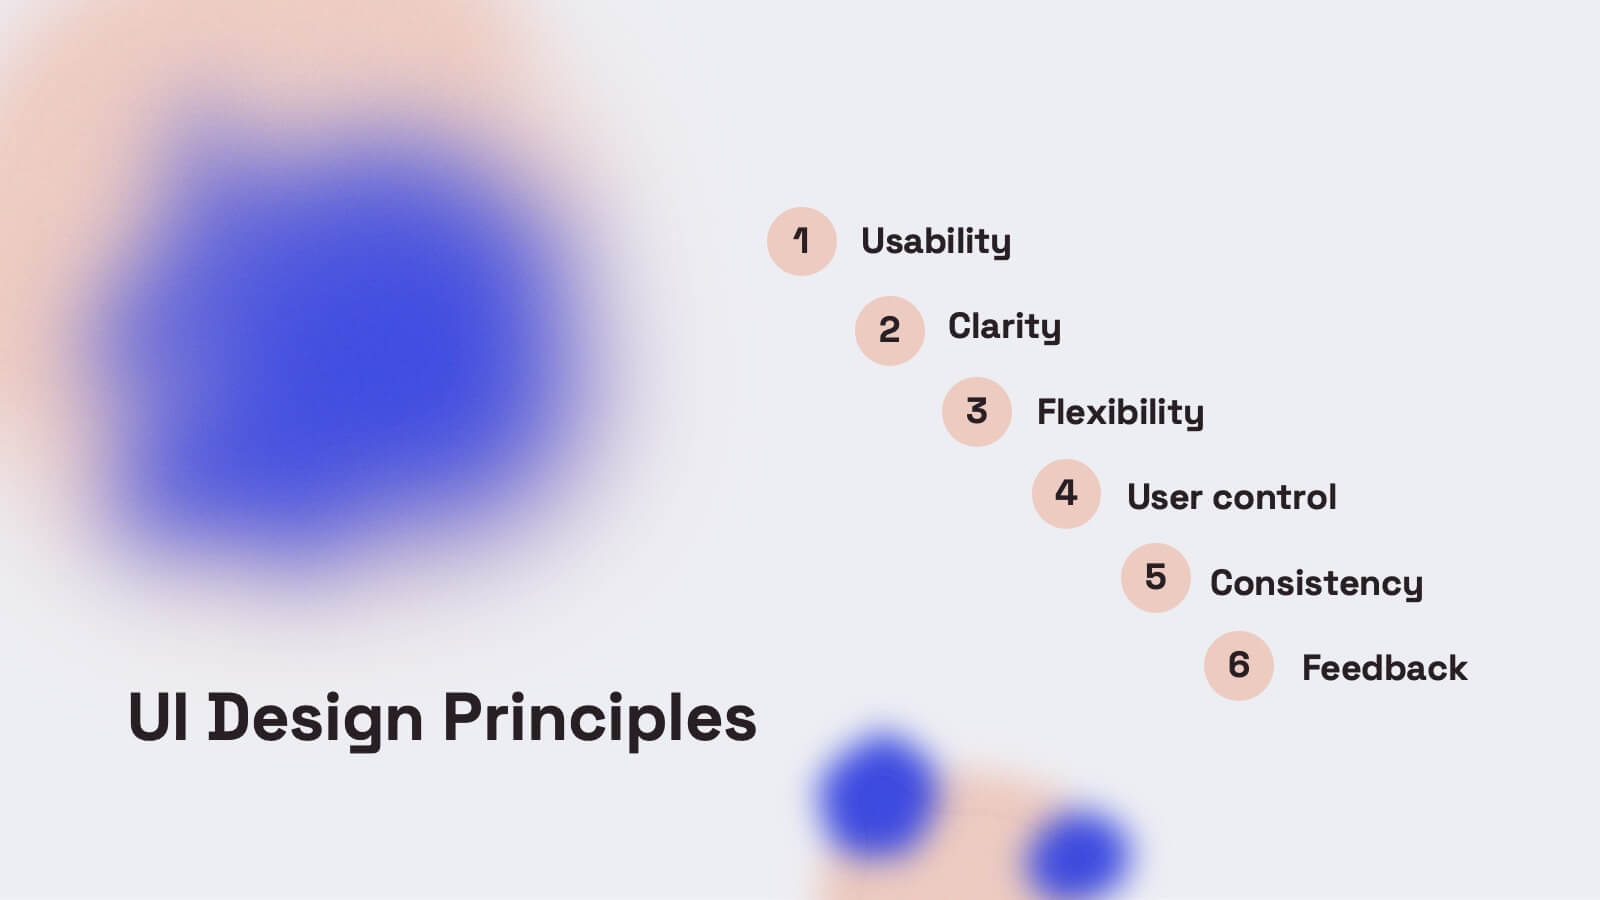
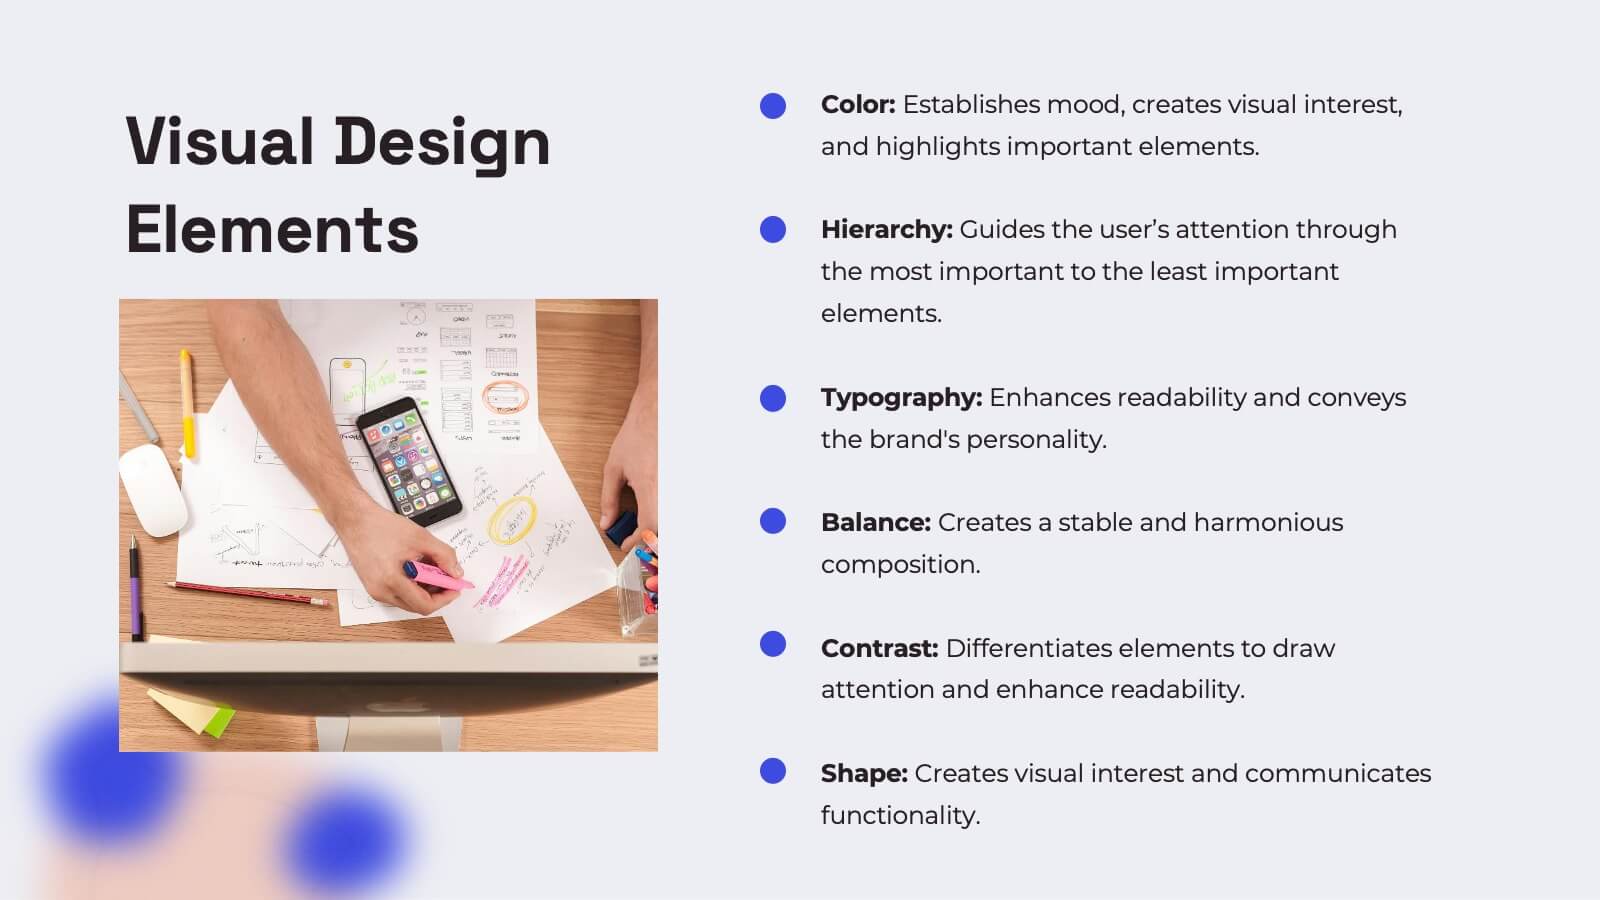
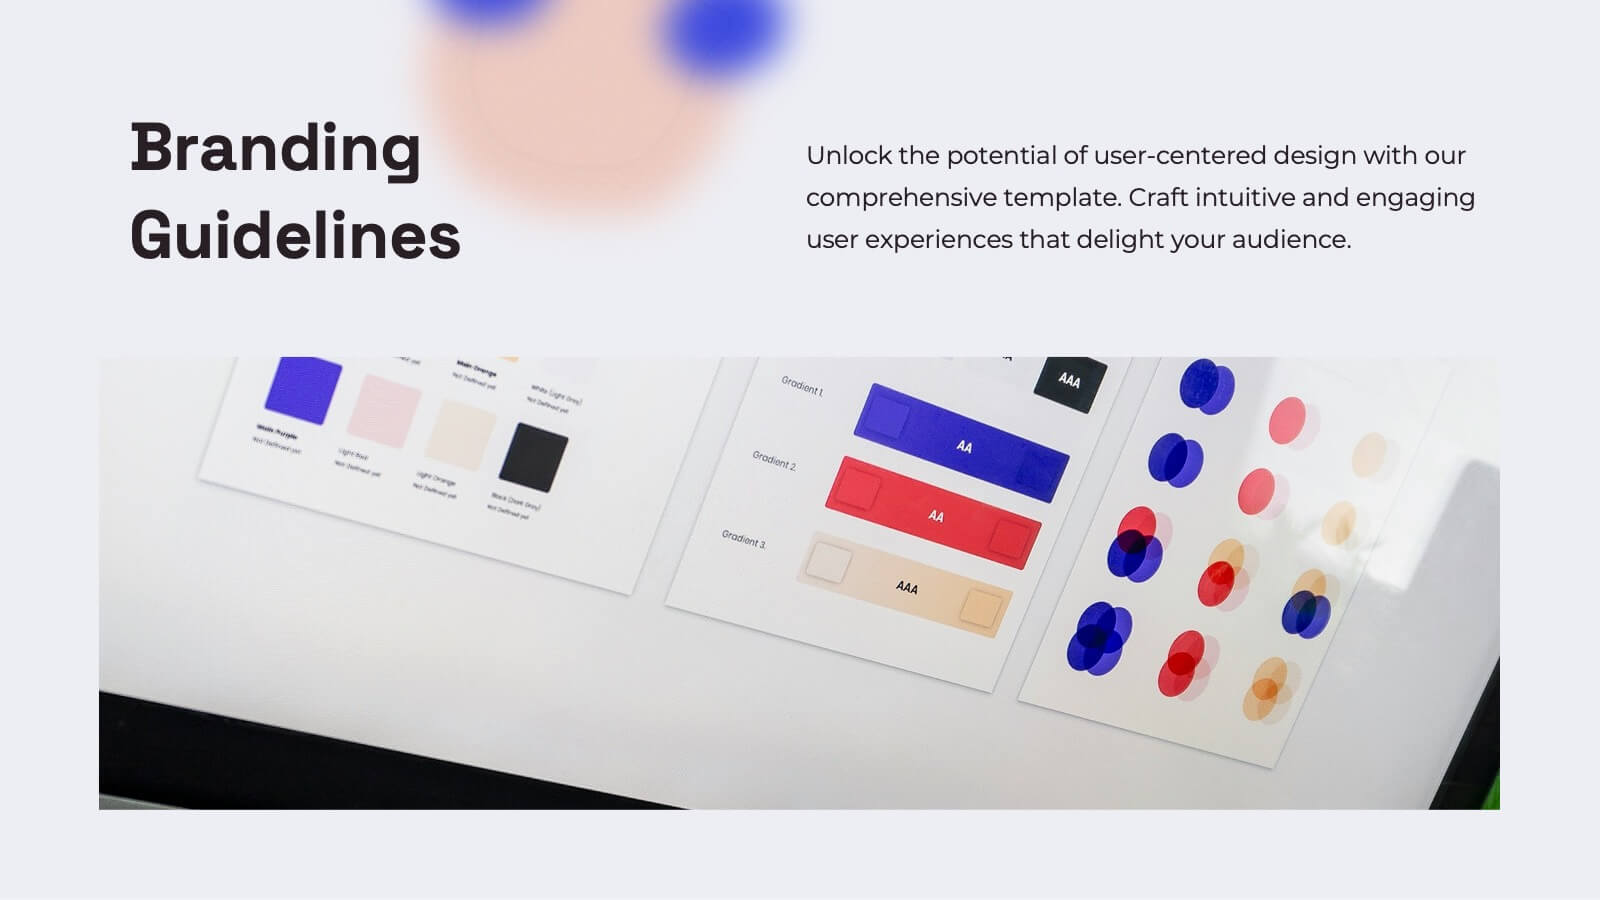
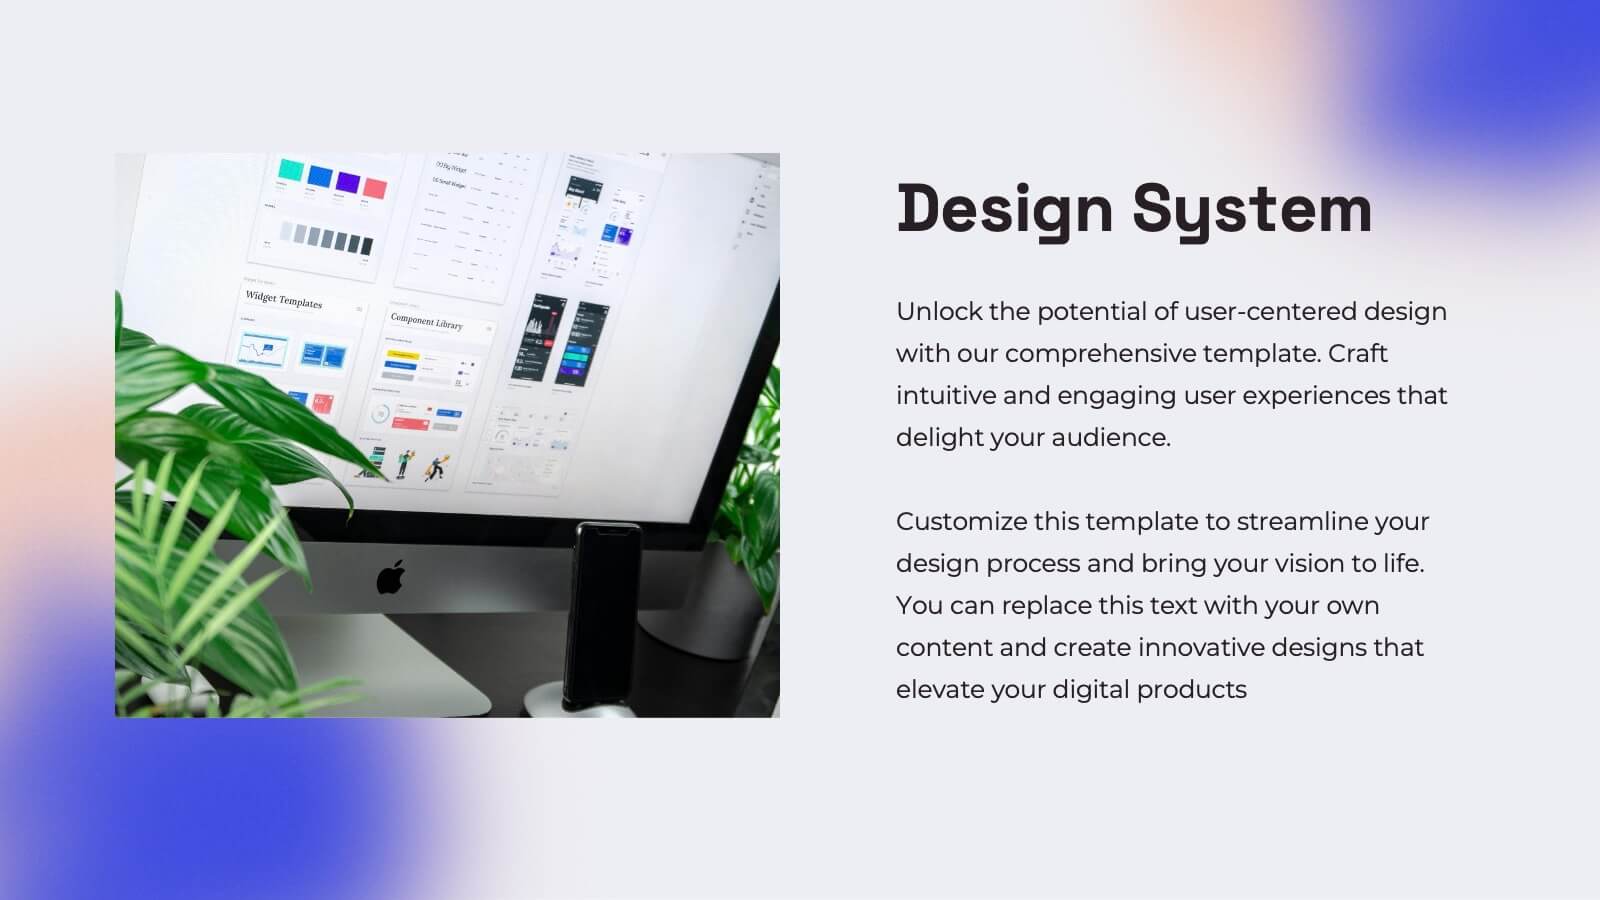
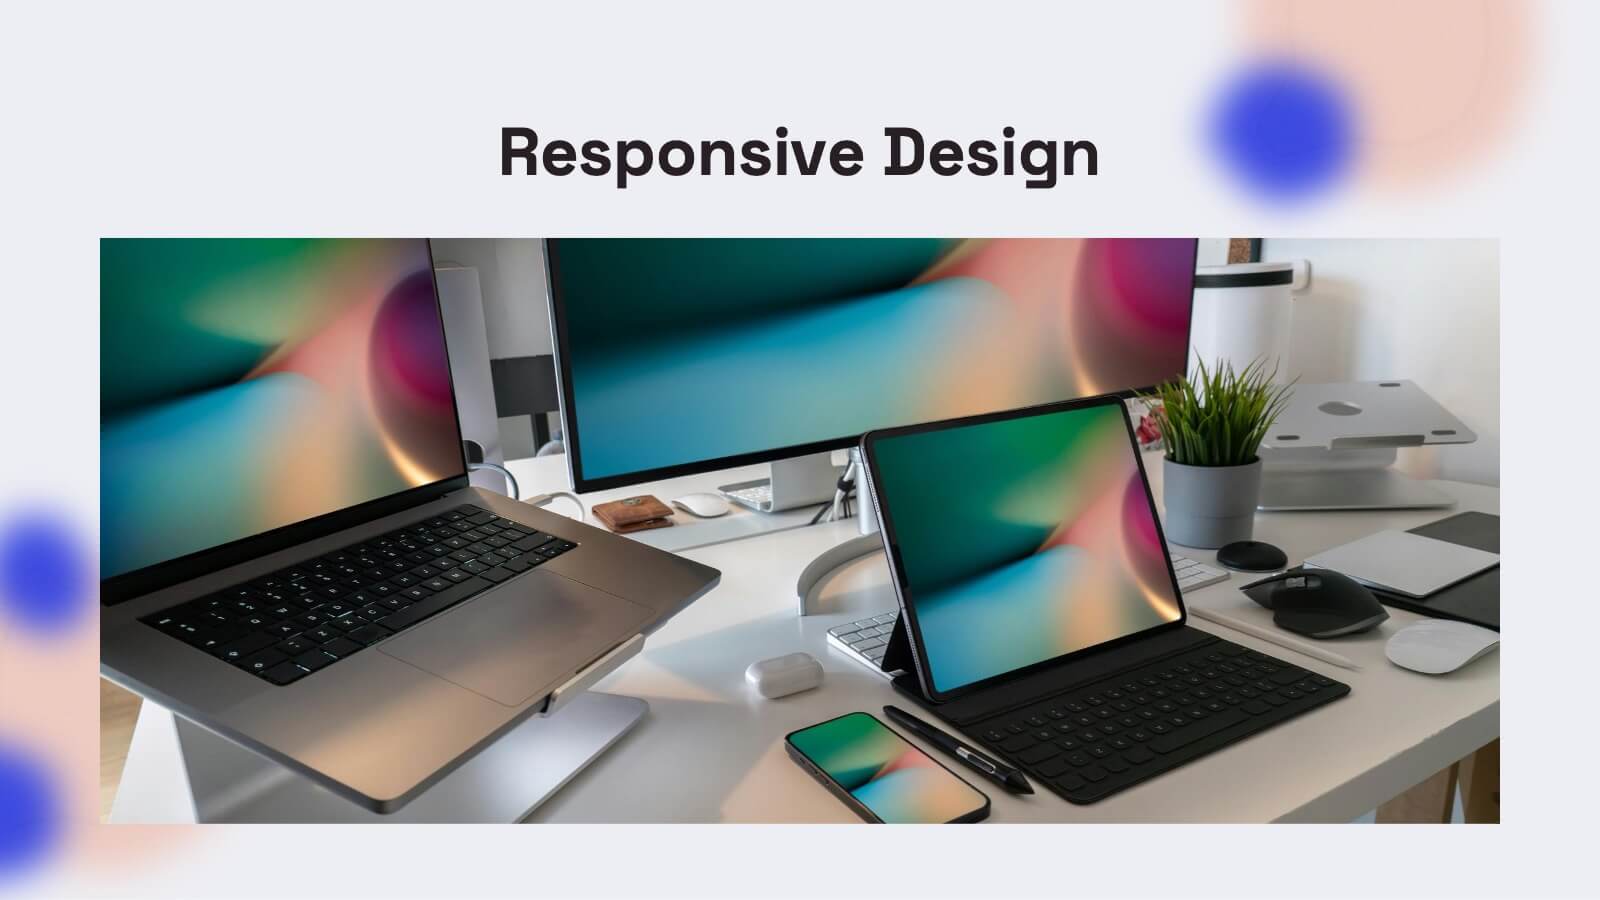
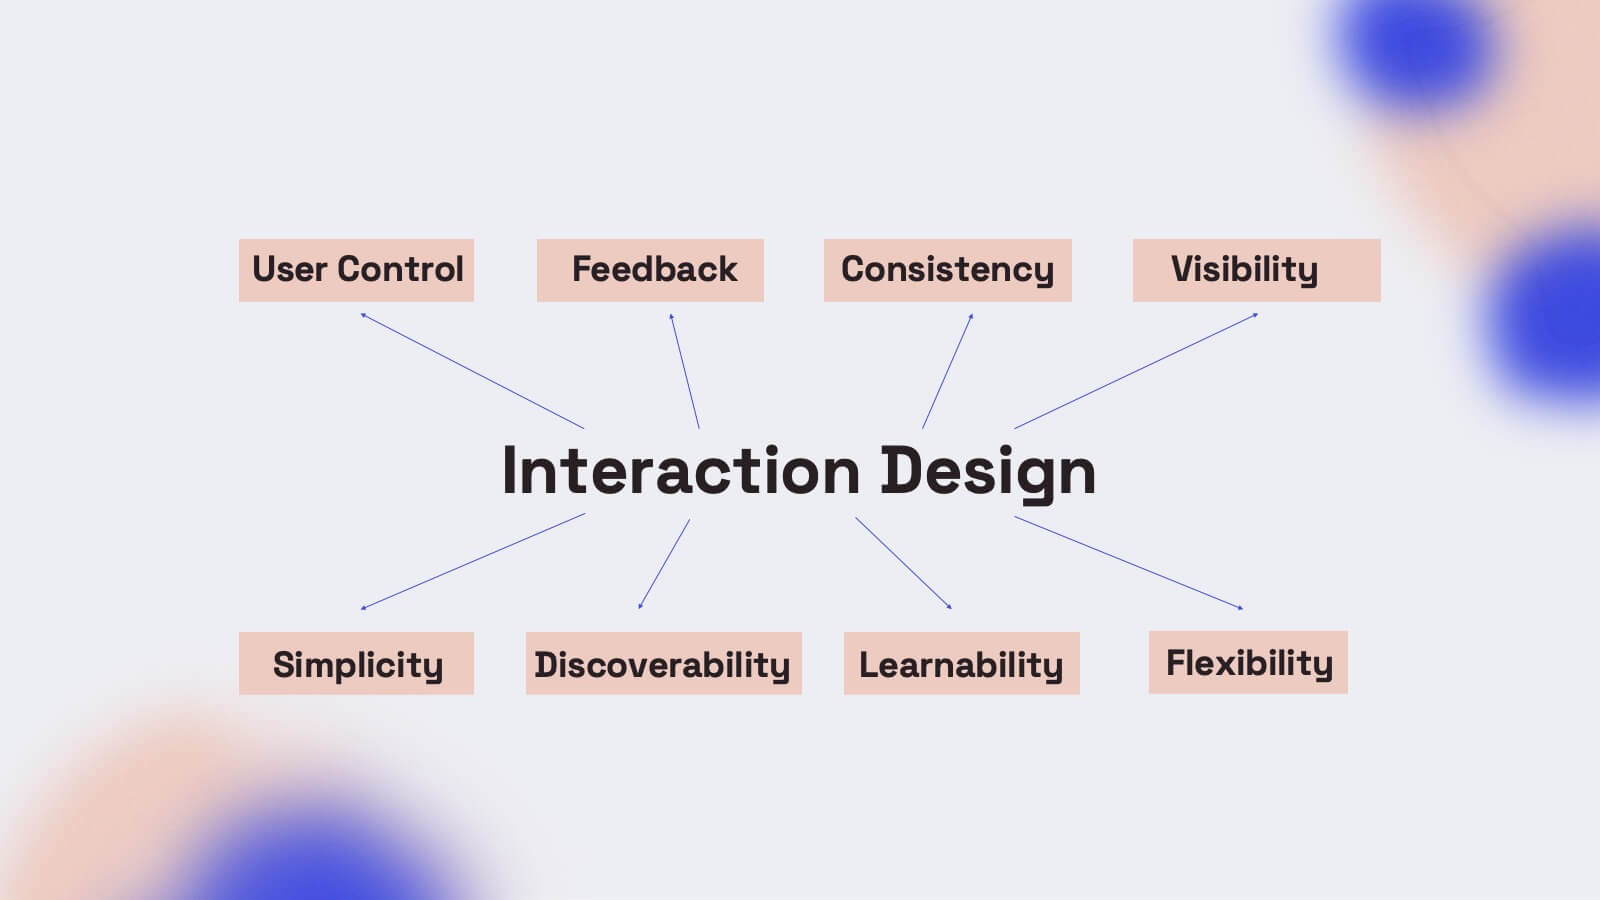
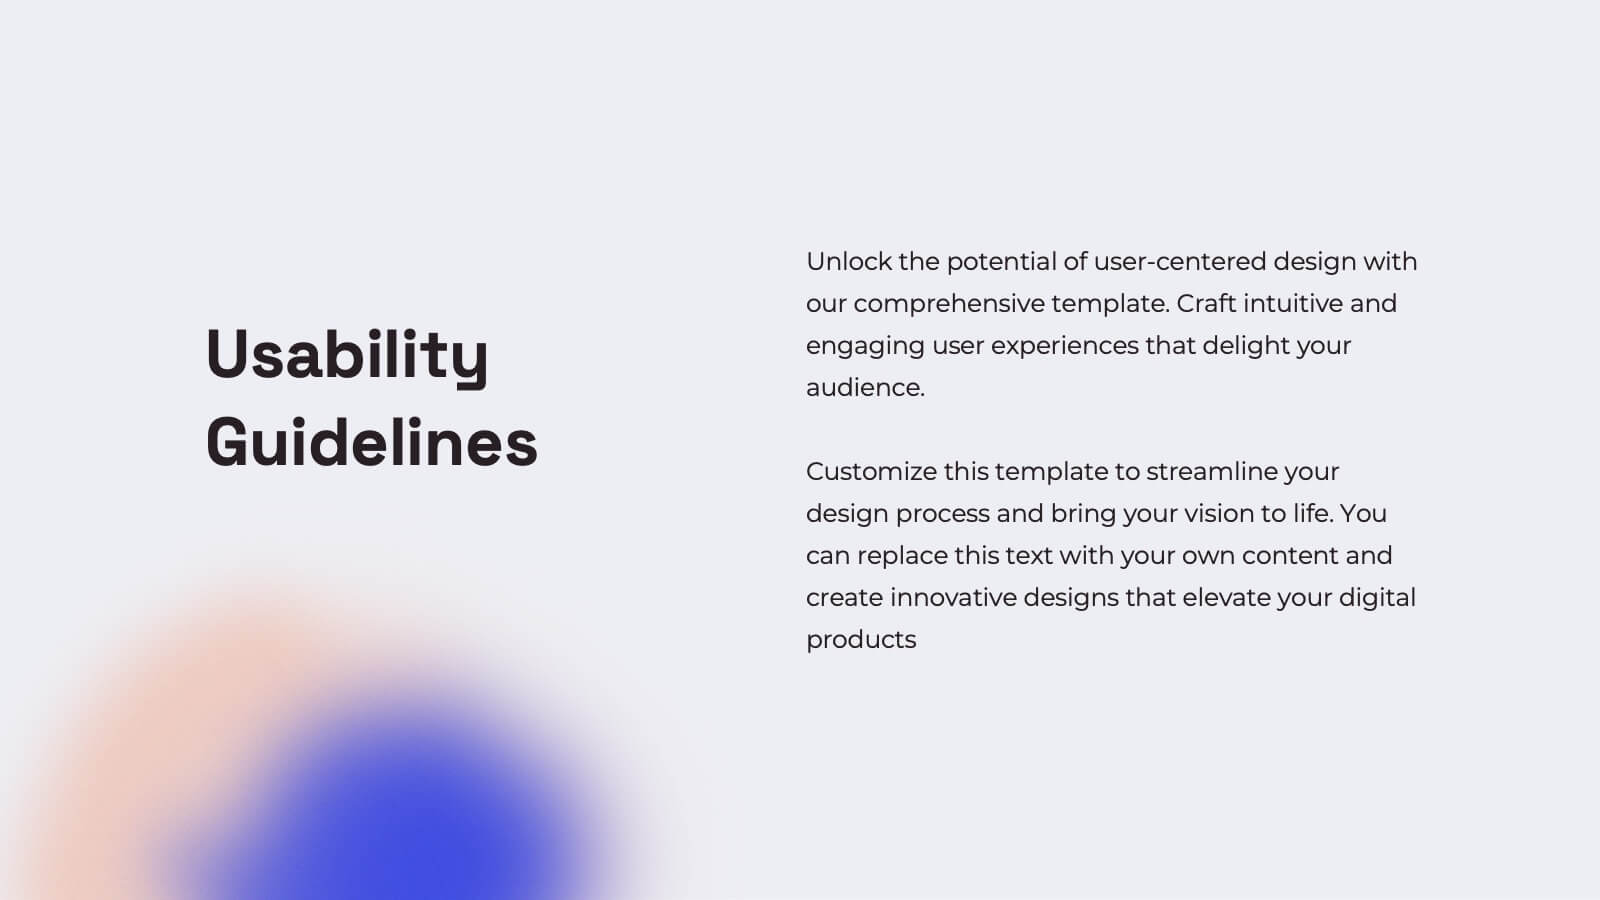
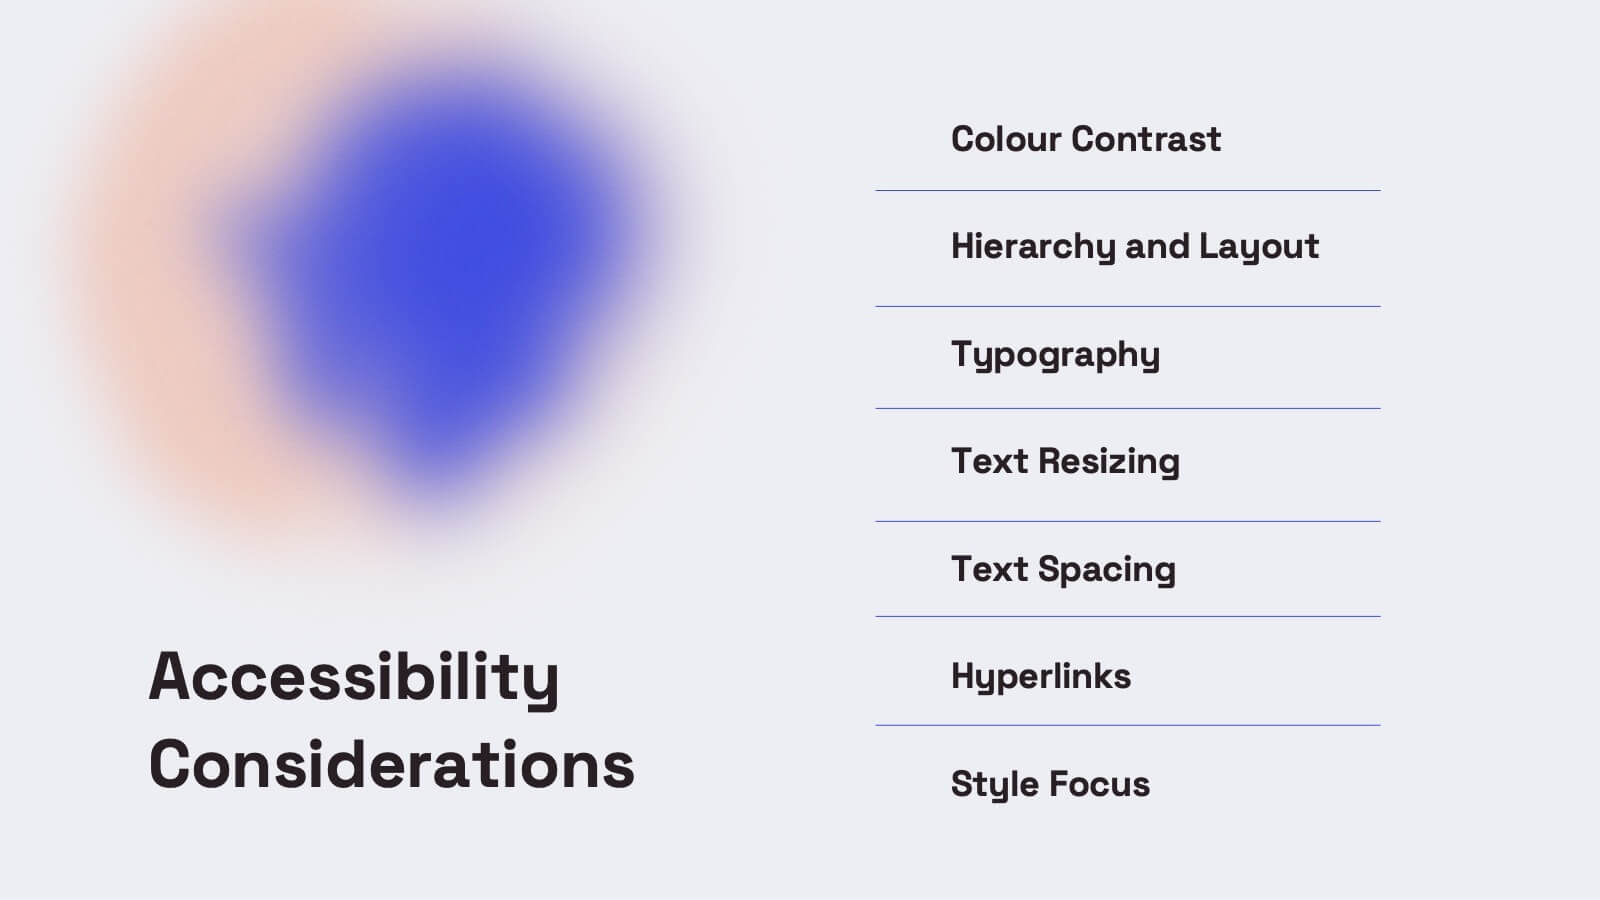
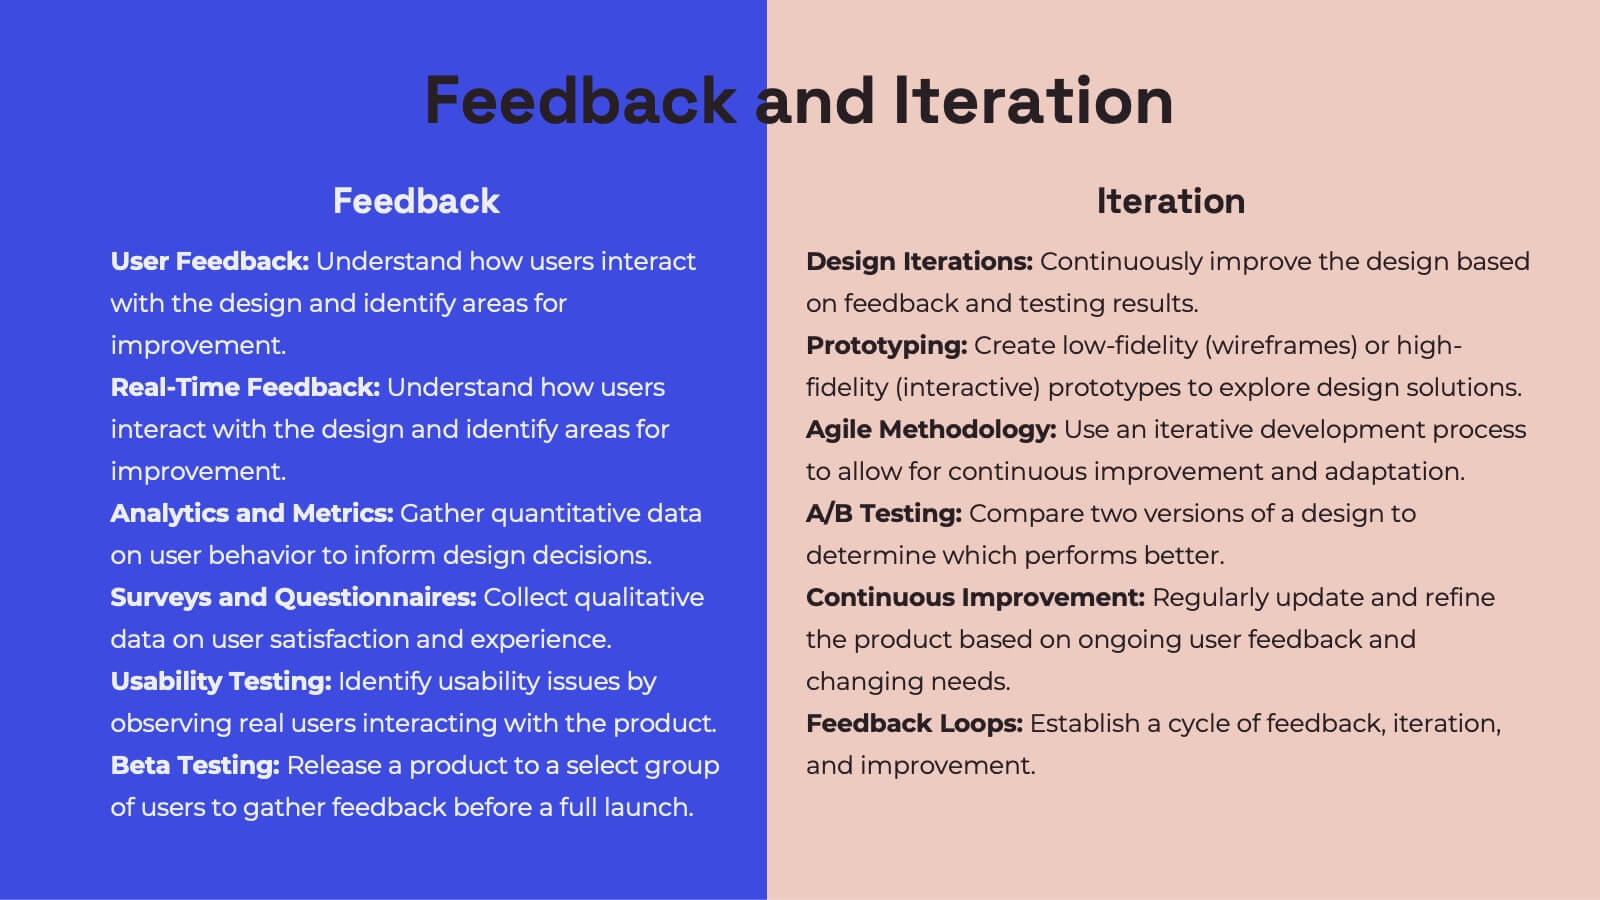
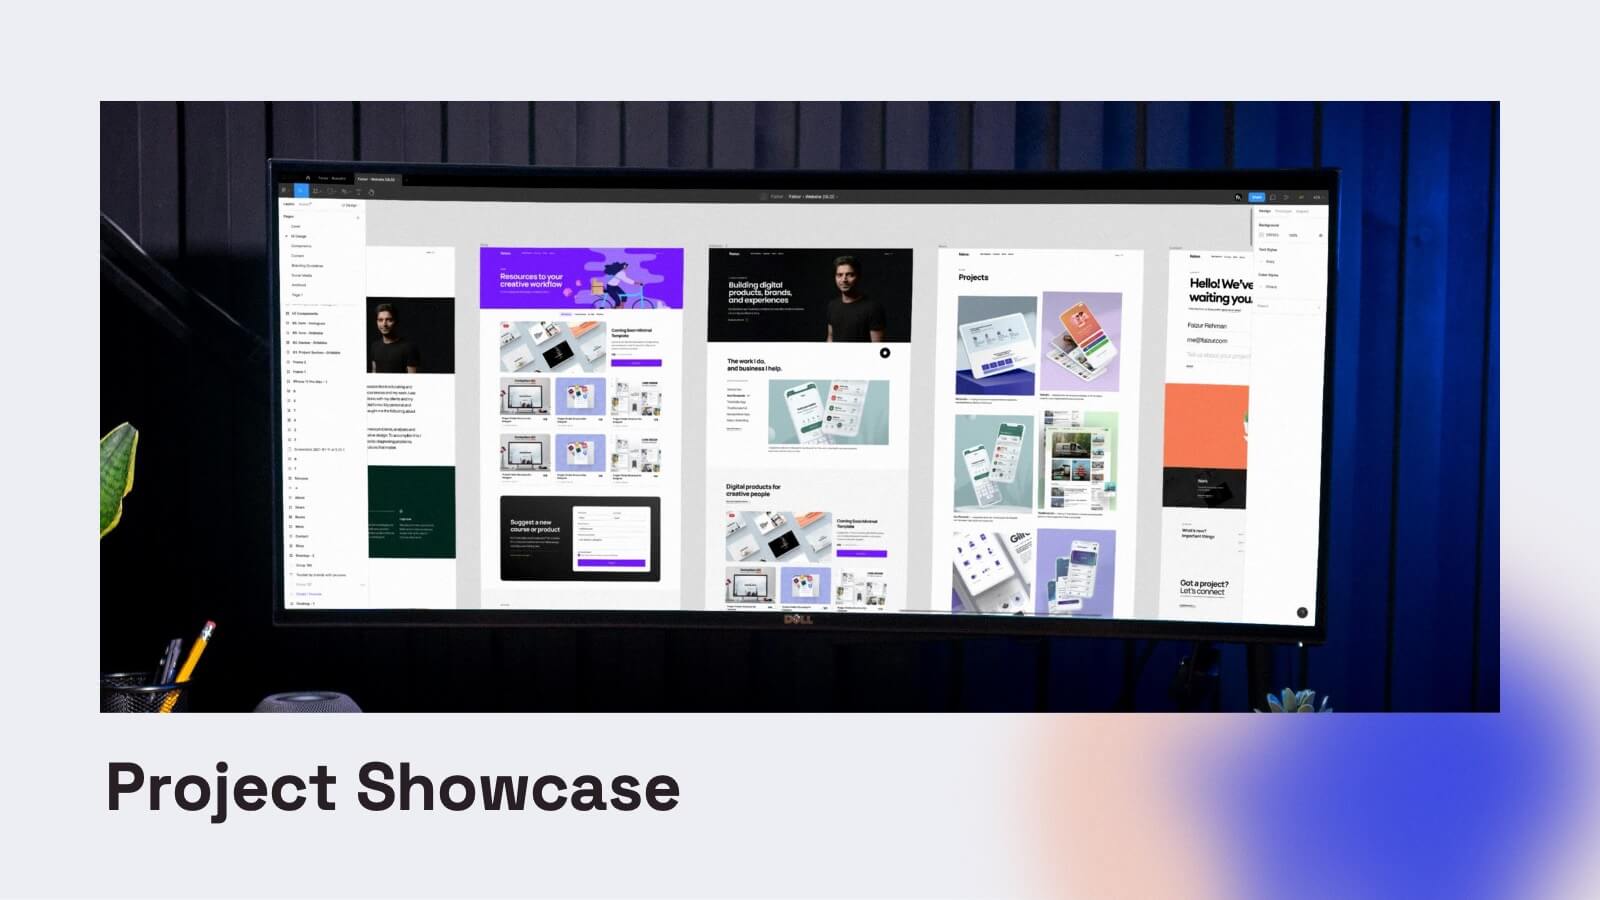
Gemini UX Design Presentation
Enhance your UX presentations with this vibrant and user-friendly template. Designed to cover every aspect of UX design, from user research and personas to wireframes and prototyping, this template ensures a comprehensive and engaging delivery. Its modern design and structured layout make your insights clear and impactful. Compatible with PowerPoint, Keynote, and Google Slides, it's perfect for any platform.


7 slides
Housing Investment Strategy Presentation
Visualize housing strategies with this clean, key-focused layout. Featuring a central house-and-key icon flanked by six sections, this slide is perfect for outlining investment stages, market insights, or project milestones. Fully editable in Canva, PowerPoint, and Google Slides—ideal for real estate professionals, developers, or analysts presenting actionable housing strategies.


10 slides
Brain Function Infographic Presentation
Explore cognitive processes with the Brain Function Infographic. Featuring a layered human head design, this visual template highlights four key functions, making it ideal for psychology, neuroscience, and decision-making presentations. Fully customizable with editable colors, text, and icons. Compatible with PowerPoint, Keynote, and Google Slides for seamless presentation use.


20 slides
Vesta Photography Portfolio Presentation
Showcase your photography skills with this elegant portfolio template, designed to highlight featured projects, creative process, client testimonials, and services offered. With sections for awards, pricing, and social media links, this template captures your unique style and professionalism. Compatible with PowerPoint, Keynote, and Google Slides for easy customization.


6 slides
Bubble Map Ideas Infographics
Visualize your ideas creatively with our Bubble Map Ideas infographic template. This template is fully compatible with popular presentation software like PowerPoint, Keynote, and Google Slides, allowing you to easily customize it to brainstorm and organize your concepts using a bubble map format. The Bubble Map Ideas infographic template offers a visually engaging platform to brainstorm and categorize ideas, concepts, and relationships in a structured and visually appealing manner. Whether you're a creative thinker, project manager, or educator, this template provides a user-friendly canvas to create informative presentations and visualizations of your ideas. Elevate your idea generation and organization with this SEO-optimized Bubble Map Ideas infographic template, thoughtfully designed for clarity and ease of use. Customize it to map out your ideas, prioritize them, and identify key connections, ensuring that your creative process becomes more organized and productive. Start crafting your personalized infographic today to bring your ideas to life.


20 slides
Wyrmwood Design Proposal Presentation
The Startup Funding Proposal Presentation Template includes 20 sleek and professional slides covering problem statements, solutions, pricing structures, and team expertise. With its modern black-and-white aesthetic, it ensures clarity and impact. Fully editable and compatible with PowerPoint, Keynote, and Google Slides, it's perfect for startups seeking investment opportunities and partnerships.


7 slides
30 60 90 Business Plan Infographic
A 30-60-90 day plan is a strategic outline of goals and objectives that a person plans to achieve within specific timeframes—30, 60, and 90 days. Dive into the heart of strategic planning with our 30 60 90 business plan infographic. This bold and dynamic template is a visual roadmap, guiding you through the critical phases of a business plan and setting a solid course for success. Compatible with Powerpoint, Keynote, and Google Slides. This infographic is a powerful tool, illustrating the journey from inception to triumph in 90 days. Explore each crucial phase in crafting an effective business plan.


10 slides
AI Impact on Business and Innovation Presentation
Deliver insights with precision using this data-driven presentation template tailored for machine learning, AI, and analytics topics. Featuring a central hub-and-spoke design, this layout allows you to showcase key components like algorithms, tools, processes, or data sources. Each segment includes clean icons and customizable titles for seamless editing. Ideal for data scientists, tech professionals, and academic presentations. Fully editable in PowerPoint, Keynote, and Google Slides.


6 slides
Formal Numbers Infographics
Enter the world of formal numbers, a vital concept in mathematics and science! This infographic acts as your gateway to comprehending the structure and significance of formal numbers. From the fundamental properties of natural numbers to the intricate details of real and complex numbers, we unveil the secrets that underpin these mathematical entities. Discover the mathematical significance of formal numbers across various fields, from algebra to calculus and beyond. Explore how these numbers are used in practical applications, including engineering, physics, and computer science. Gain an appreciation for the elegance and versatility of formal numbers in solving real-world problems. With this informative infographic, compatible with PowerPoint, Keynote, and Google Slides, sharing your understanding of formal numbers becomes seamless. Empower yourself with the knowledge to navigate the intricate world of mathematics. Dive into the realm of formal numbers and embark on a journey of mathematical exploration and enlightenment.


7 slides
Investment Group Infographic
An investment group, is a collective of individuals or entities that pool their financial resources to invest in various financial instruments or assets. This infographic template is a high-octane journey through the dynamic world of investments, designed to empower and energize your financial understanding. Prepare to take you audience through a thrilling ride through the investment cosmos, where your money takes center stage and financial growth is the ultimate goal. This Investment Infographic isn't just about numbers and charts, it's a thrilling expedition through the realms of finance.


6 slides
Global Sourcing and Distribution Presentation
Present your supply strategy with clarity using the Global Sourcing and Distribution Presentation. This slide features a central sourcing hub with segmented groups to illustrate regional or functional distribution channels. Ideal for global logistics, procurement planning, or stakeholder reporting. Fully editable in PowerPoint, Keynote, and Google Slides.


5 slides
Meeting Schedule and Agenda Layout Presentation
Plan, track, and communicate multi-day meetings with this Meeting Schedule and Agenda Layout presentation. Ideal for organizing conference sessions, workshops, or internal team agendas, this layout lets you present key topics by day and time. Clean, structured, and fully editable in Canva, PowerPoint, and Google Slides for easy customization.


20 slides
Uplift Content Marketing Pitch Deck Presentation
This content marketing presentation is designed to elevate your strategies to the next level! It covers everything from industry insights to the latest consumer behavior trends and SEO strategies. It helps streamline influencer marketing, data-driven approaches, and even includes sustainability in marketing. Perfect for PowerPoint, Keynote, and Google Slides presentations!


5 slides
Mission and Values Alignment
Align your purpose with progress using this clean, directional layout that maps your mission, core values, and strategic focus in a unified flow. Perfect for internal briefings or culture decks, this slide visually connects each value to your organizational journey. Fully compatible with PowerPoint, Keynote, and Google Slides.