


Features
- 5 Unique slides
- Fully editable and easy to edit in Microsoft Powerpoint, Keynote and Google Slides
- 16:9 widescreen layout
- Clean and professional designs
- Export to JPG, PDF or send by email


Do you have any questions?
Recommend


7 slides
Blue Ocean Methodology Infographic
Unveil the strategy of untapped market spaces with our blue ocean methodology infographic. Elegantly presented in shades of blue and white, this infographic offers a deep dive into the innovative strategy that focuses on creating new demand in non-contested market areas. Ideally tailored for business strategists, entrepreneurs, and innovators, it sheds light on the significance of venturing beyond the saturated marketplaces and the competition. Designed for PowerPoint, Keynote, and Google Slides, this comprehensive template provides a crystal-clear framework, aiding in crafting groundbreaking strategies and capturing fresh market space.


26 slides
Simplified Home Decor Presentation
Bring a breath of fresh air to interior design with this elegant presentation template, perfect for unveiling the beauty of simplified home decor. The template's clean lines and soft color palette evoke the minimalist charm and serene ambiance of modern living spaces. Each slide offers a harmonious blend of imagery and text, showcasing tranquil interiors that speak volumes about the less-is-more philosophy. From showcasing key principles of minimalist design to offering tips on decluttering and organizing, this template guides viewers through the transformative process of creating a peaceful home environment. Infographics lend themselves to discussing color schemes, space functionality, and the impact of natural light, making this a comprehensive tool for interior designers, home organizers, or decor enthusiasts. Fully compatible with PowerPoint, Keynote, and Google Slides, this template is a canvas for creativity, ready to inspire and engage audiences in the art of living simply and stylishly.


26 slides
Doriyan Presentation Template
Doriyan is a beautiful, colorful, professional and descriptive presentation. This template has wonderful colors and graphics that are engaging and conveys the information to the audience. This template is suitable for all types of businesses especially those that are investors, realtors or other companies involved in investment advice. Charts, timelines and easy to edit text makes this template perfect for businesses seeking to introduce there business and services to make a great impression. Doriyan offers a way to boost your business. Present your information with this efficient template!


5 slides
Fishbone Diagram for Root Cause Analysis Presentation
Identify and Solve Business Problems with Precision using this Fishbone Diagram for Root Cause Analysis presentation template. Designed to visually map out potential causes, this template enhances problem-solving, decision-making, and process improvement. Featuring a clear fishbone structure, customizable icons, and text placeholders, this template is perfect for business analysts, strategists, and operations teams. Fully editable and compatible with PowerPoint, Keynote, and Google Slides, ensuring a seamless and professional presentation experience.


21 slides
Talestra Startup Pitch Deck Presentation
Make a strong first impression with this clean and modern startup pitch deck. Covering key areas such as mission and vision, market analysis, business model, growth plan, and financial overview, it's designed to captivate investors and stakeholders. Fully customizable and compatible with PowerPoint, Keynote, and Google Slides.


10 slides
Customer Market Segmentation Strategy Presentation
Define and visualize your audience with the Customer Market Segmentation Strategy Presentation. This slide layout helps you categorize customer types using clean iconography and a central persona model. Ideal for marketing teams, sales strategists, or startup pitches. Customize easily in Canva, PowerPoint, Google Slides, or Keynote.


7 slides
Stock Market Futures Infographic
The stock market, also known as the equity market or share market, is a platform where buying, selling, and issuing shares of publicly-held companies take place. This infographic template serves as your compass through the intricate landscape of stocks and futures, empowering you with the knowledge to steer your investments towards a prosperous horizon. Compatible with Powerpoint, Keynote, and Google Slides. The striking visualizations present the clash between the bullish and bearish market forces, symbolizing the constant struggle that drives market movements. Easily showcase the latest stock prices with this template.


20 slides
Fenrir Investor Pitch Presentation
Deliver a compelling and persuasive pitch with this sleek and professional investor pitch deck! It covers essential sections like problem and solution, market opportunity, business model, financials, and growth strategy to ensure your vision is clearly communicated. Ideal for startup fundraising or business presentations, this template is fully compatible with PowerPoint, Keynote, and Google Slides.


6 slides
Process Direction Flow Mapping
Showcase linear progress with clarity using the Process Direction Flow Mapping Presentation. This layout features a clean, step-by-step directional flow with five stages, ideal for outlining project phases, business workflows, or timeline milestones. Each stage is color-coded with editable text areas, making it easy to customize and adapt for PowerPoint, Keynote, or Google Slides.


5 slides
Project Management Plan Presentation
Bring structure and clarity to every phase of your workflow with this clean, arrow-based layout designed to outline tasks, milestones, and key deliverables. This presentation makes planning feel organized, engaging, and easy to follow for any audience. Fully editable and ready to use in PowerPoint, Keynote, and Google Slides.


7 slides
Annual Summary Infographic
Revitalize your year-end reports with our expertly designed Infographic Templates! Tailored for professionals keen on showcasing annual achievements and insights, this collection offers a dynamic array of layouts that cater to varied presentation needs. From streamlined bar graphs and intricate circle diagrams to engaging icon lists, these templates are engineered to translate complex annual data into digestible, visually appealing content. Customize colors, fonts, and text to mirror your organization’s branding, ensuring a consistent and professional appearance across all communications. Compatible with PowerPoint, Google Slides, and Keynote, our templates simplify the creation of presentations that not only inform but inspire. Ideal for executives, team leaders, and marketers, these templates are indispensable tools for illustrating yearly progress, highlighting significant outcomes, and strategizing for future success. Enhance your professional presentations and make your annual summary not just seen, but remembered.


5 slides
Education Jobs Infographics
Education Jobs encompass a wide range of roles and responsibilities focused on providing education, training, and support to learners of all ages. This template is designed to showcase the diverse range of careers available in the education sector. Use this template to inform and inspire individuals interested in pursuing a career in education, whether as teachers, administrators, counselors, researchers, or other specialized roles. With its visually engaging design and comprehensive information, this template will help your audience navigate the world of education jobs and make informed career decisions.


6 slides
5-Step Investment Planning Presentation
Guide your audience through a clear, structured journey with a modern layout that turns each financial step into a simple, visual milestone. This presentation helps you explain goals, outline processes, and communicate actionable insights with ease and clarity. Fully editable and compatible with PowerPoint, Keynote, and Google Slides.


7 slides
E-Learning System Infographic
E-Learning, short for electronic learning, refers to a learning system or educational approach that utilizes electronic technology, particularly the internet and digital devices, to deliver educational content and facilitate learning. This infographic template is crafted to guide and inspire educators, learners, and e-learning enthusiasts alike. Explore the facets that make up a successful e-learning ecosystem, providing a roadmap for seamless digital education delivery. Compatible with Powerpoint, Keynote, and Google Slides. This infographic is your guide to navigating the digital educational landscape.


20 slides
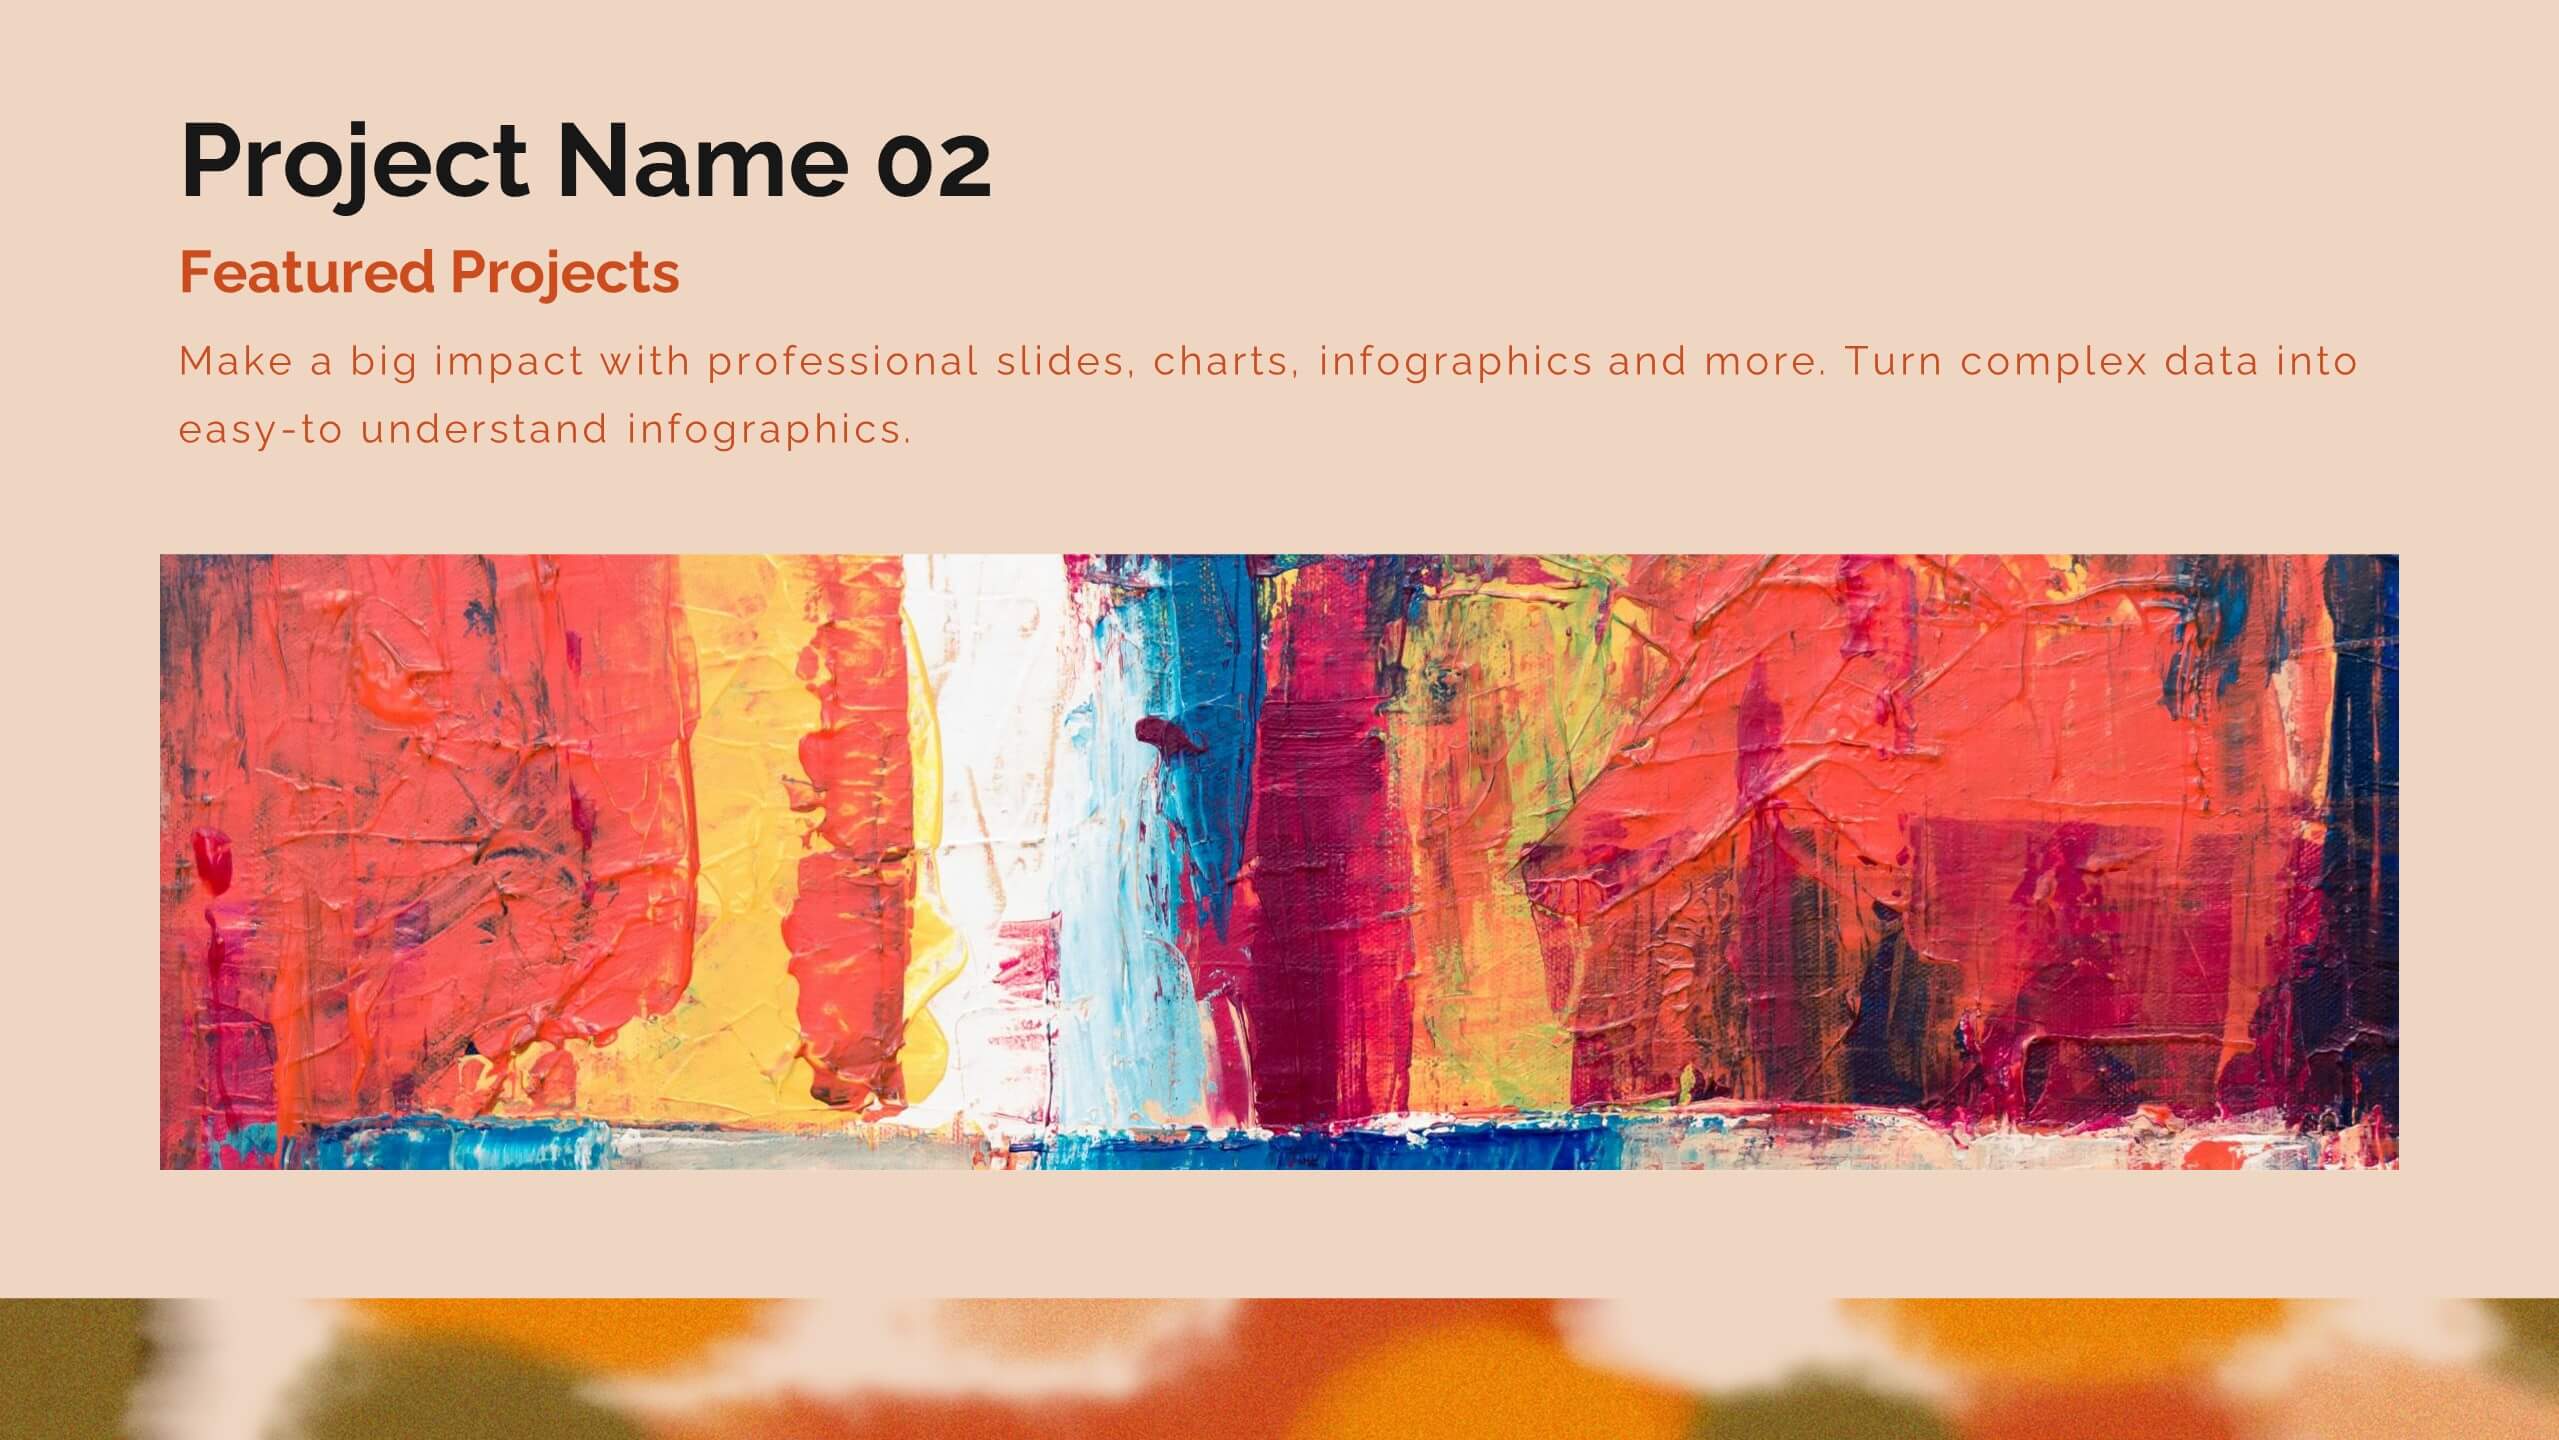
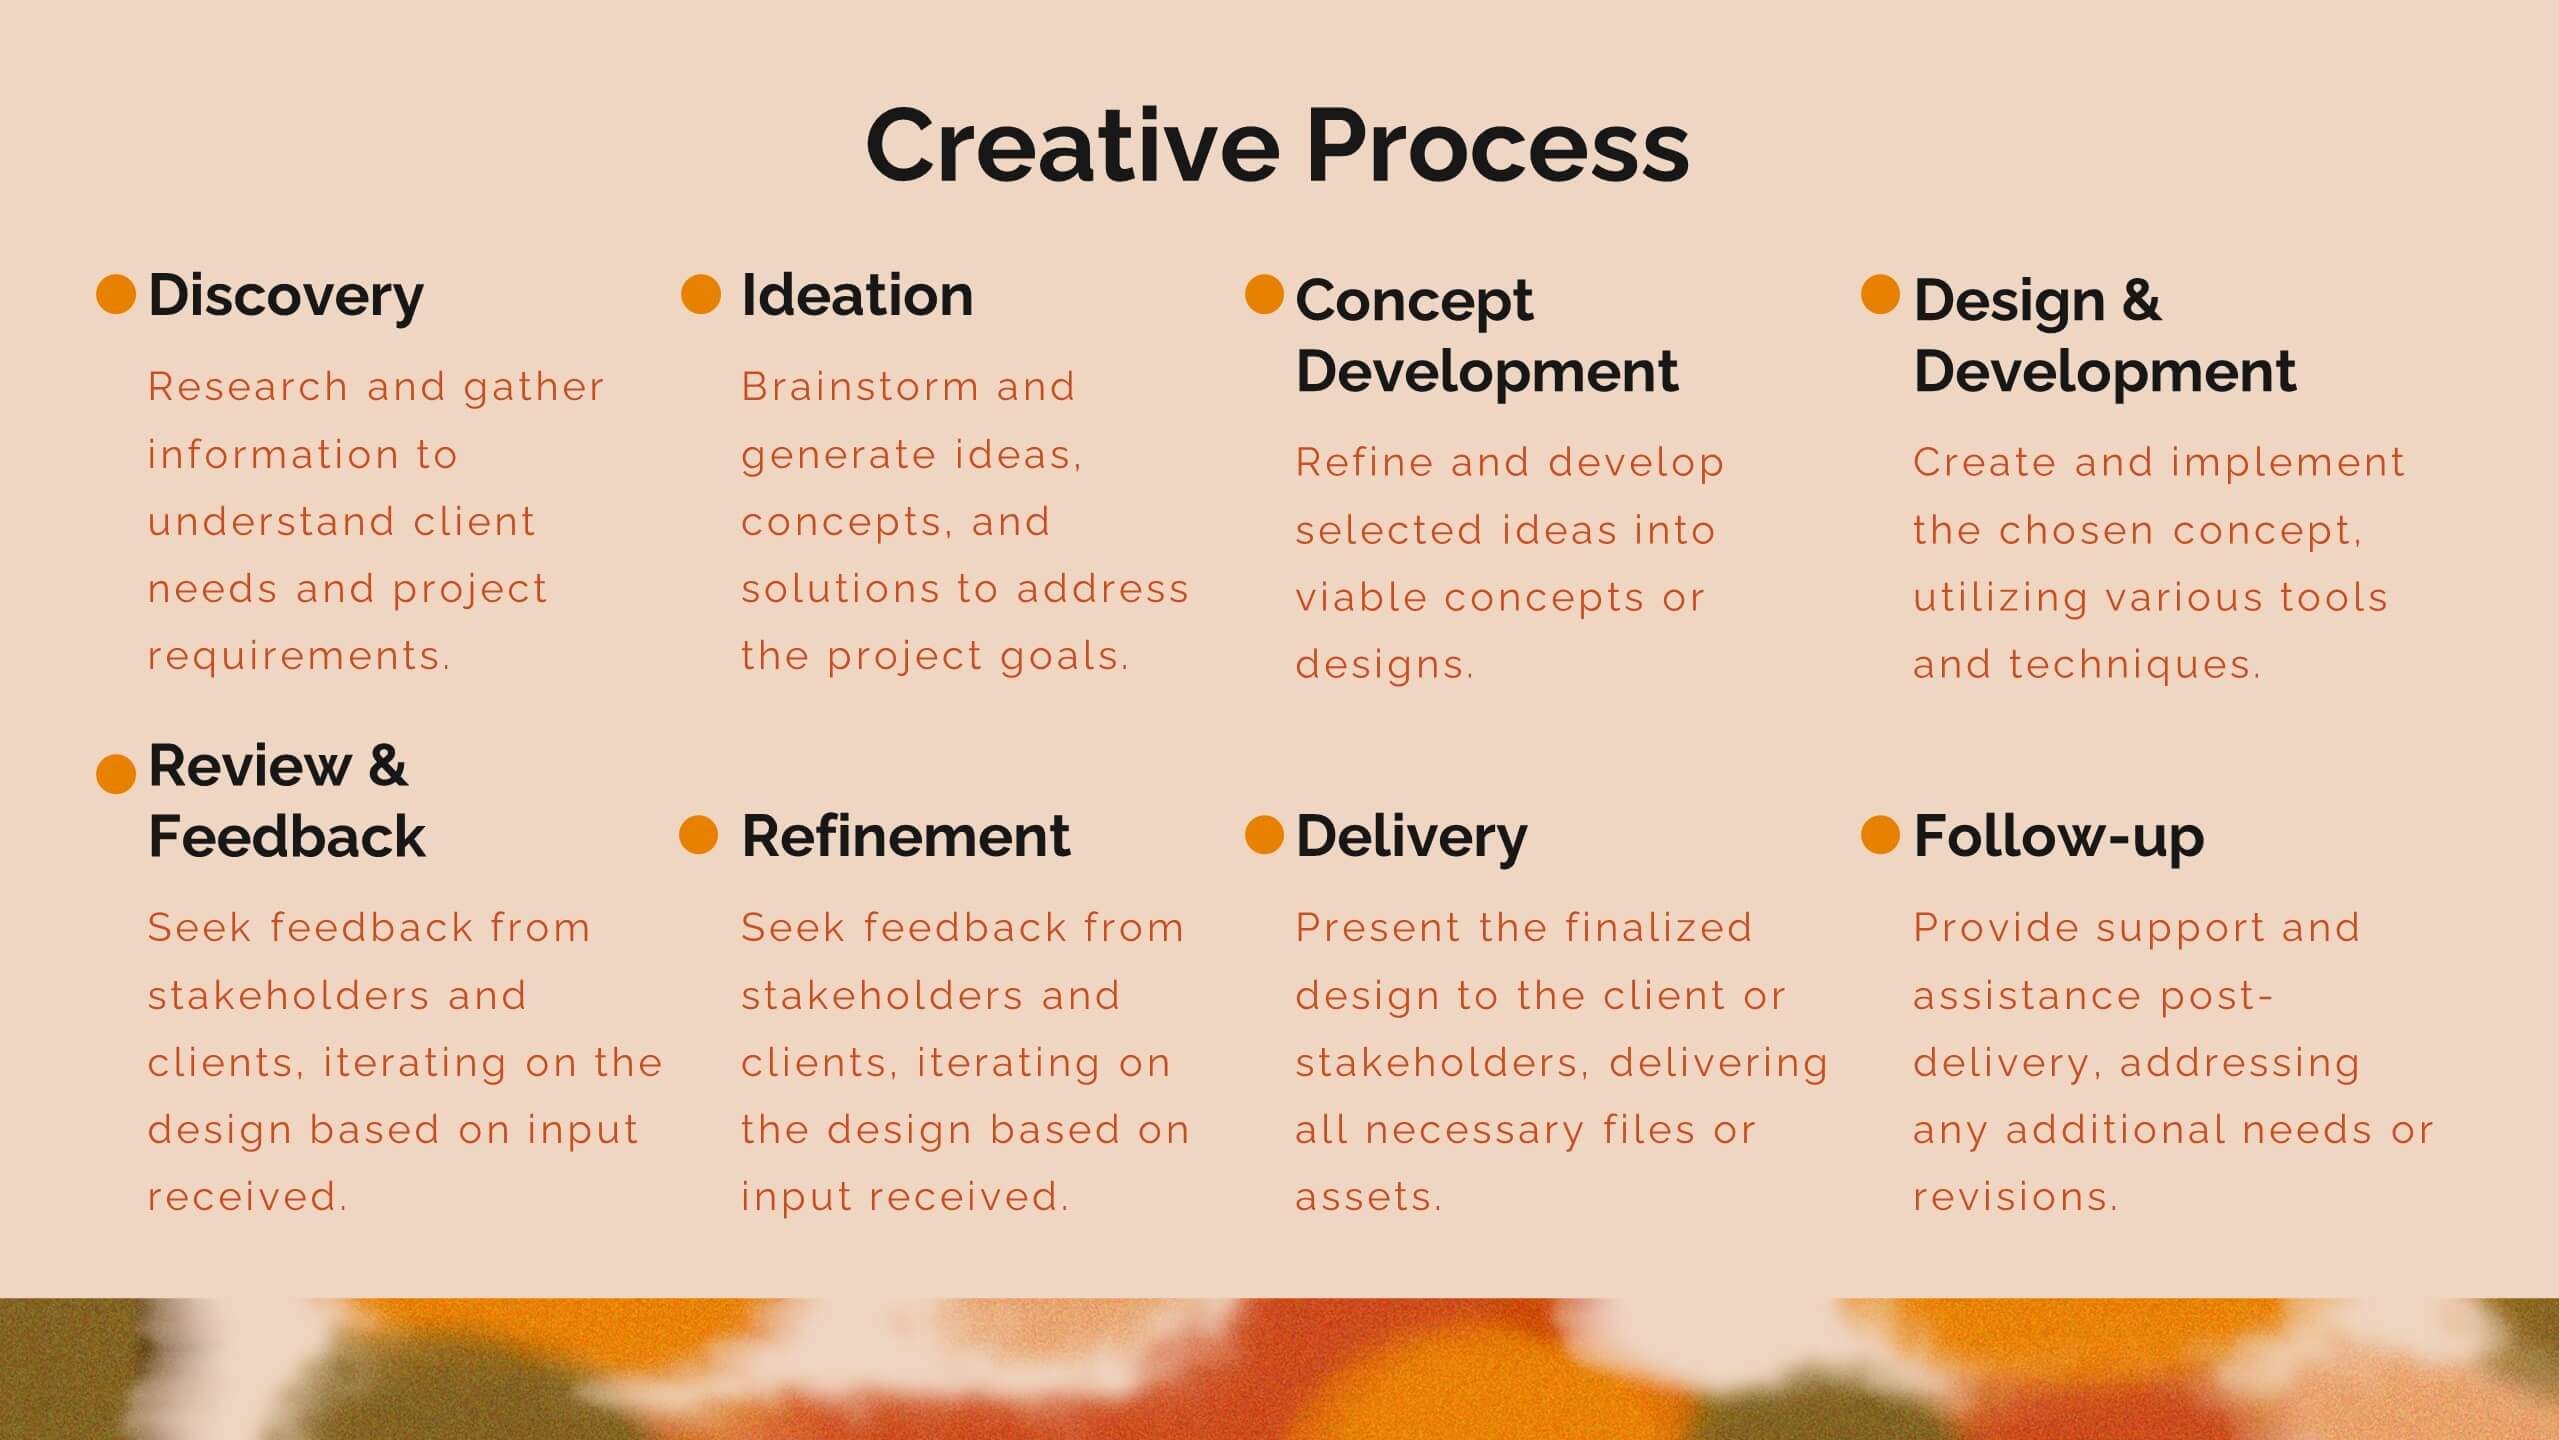
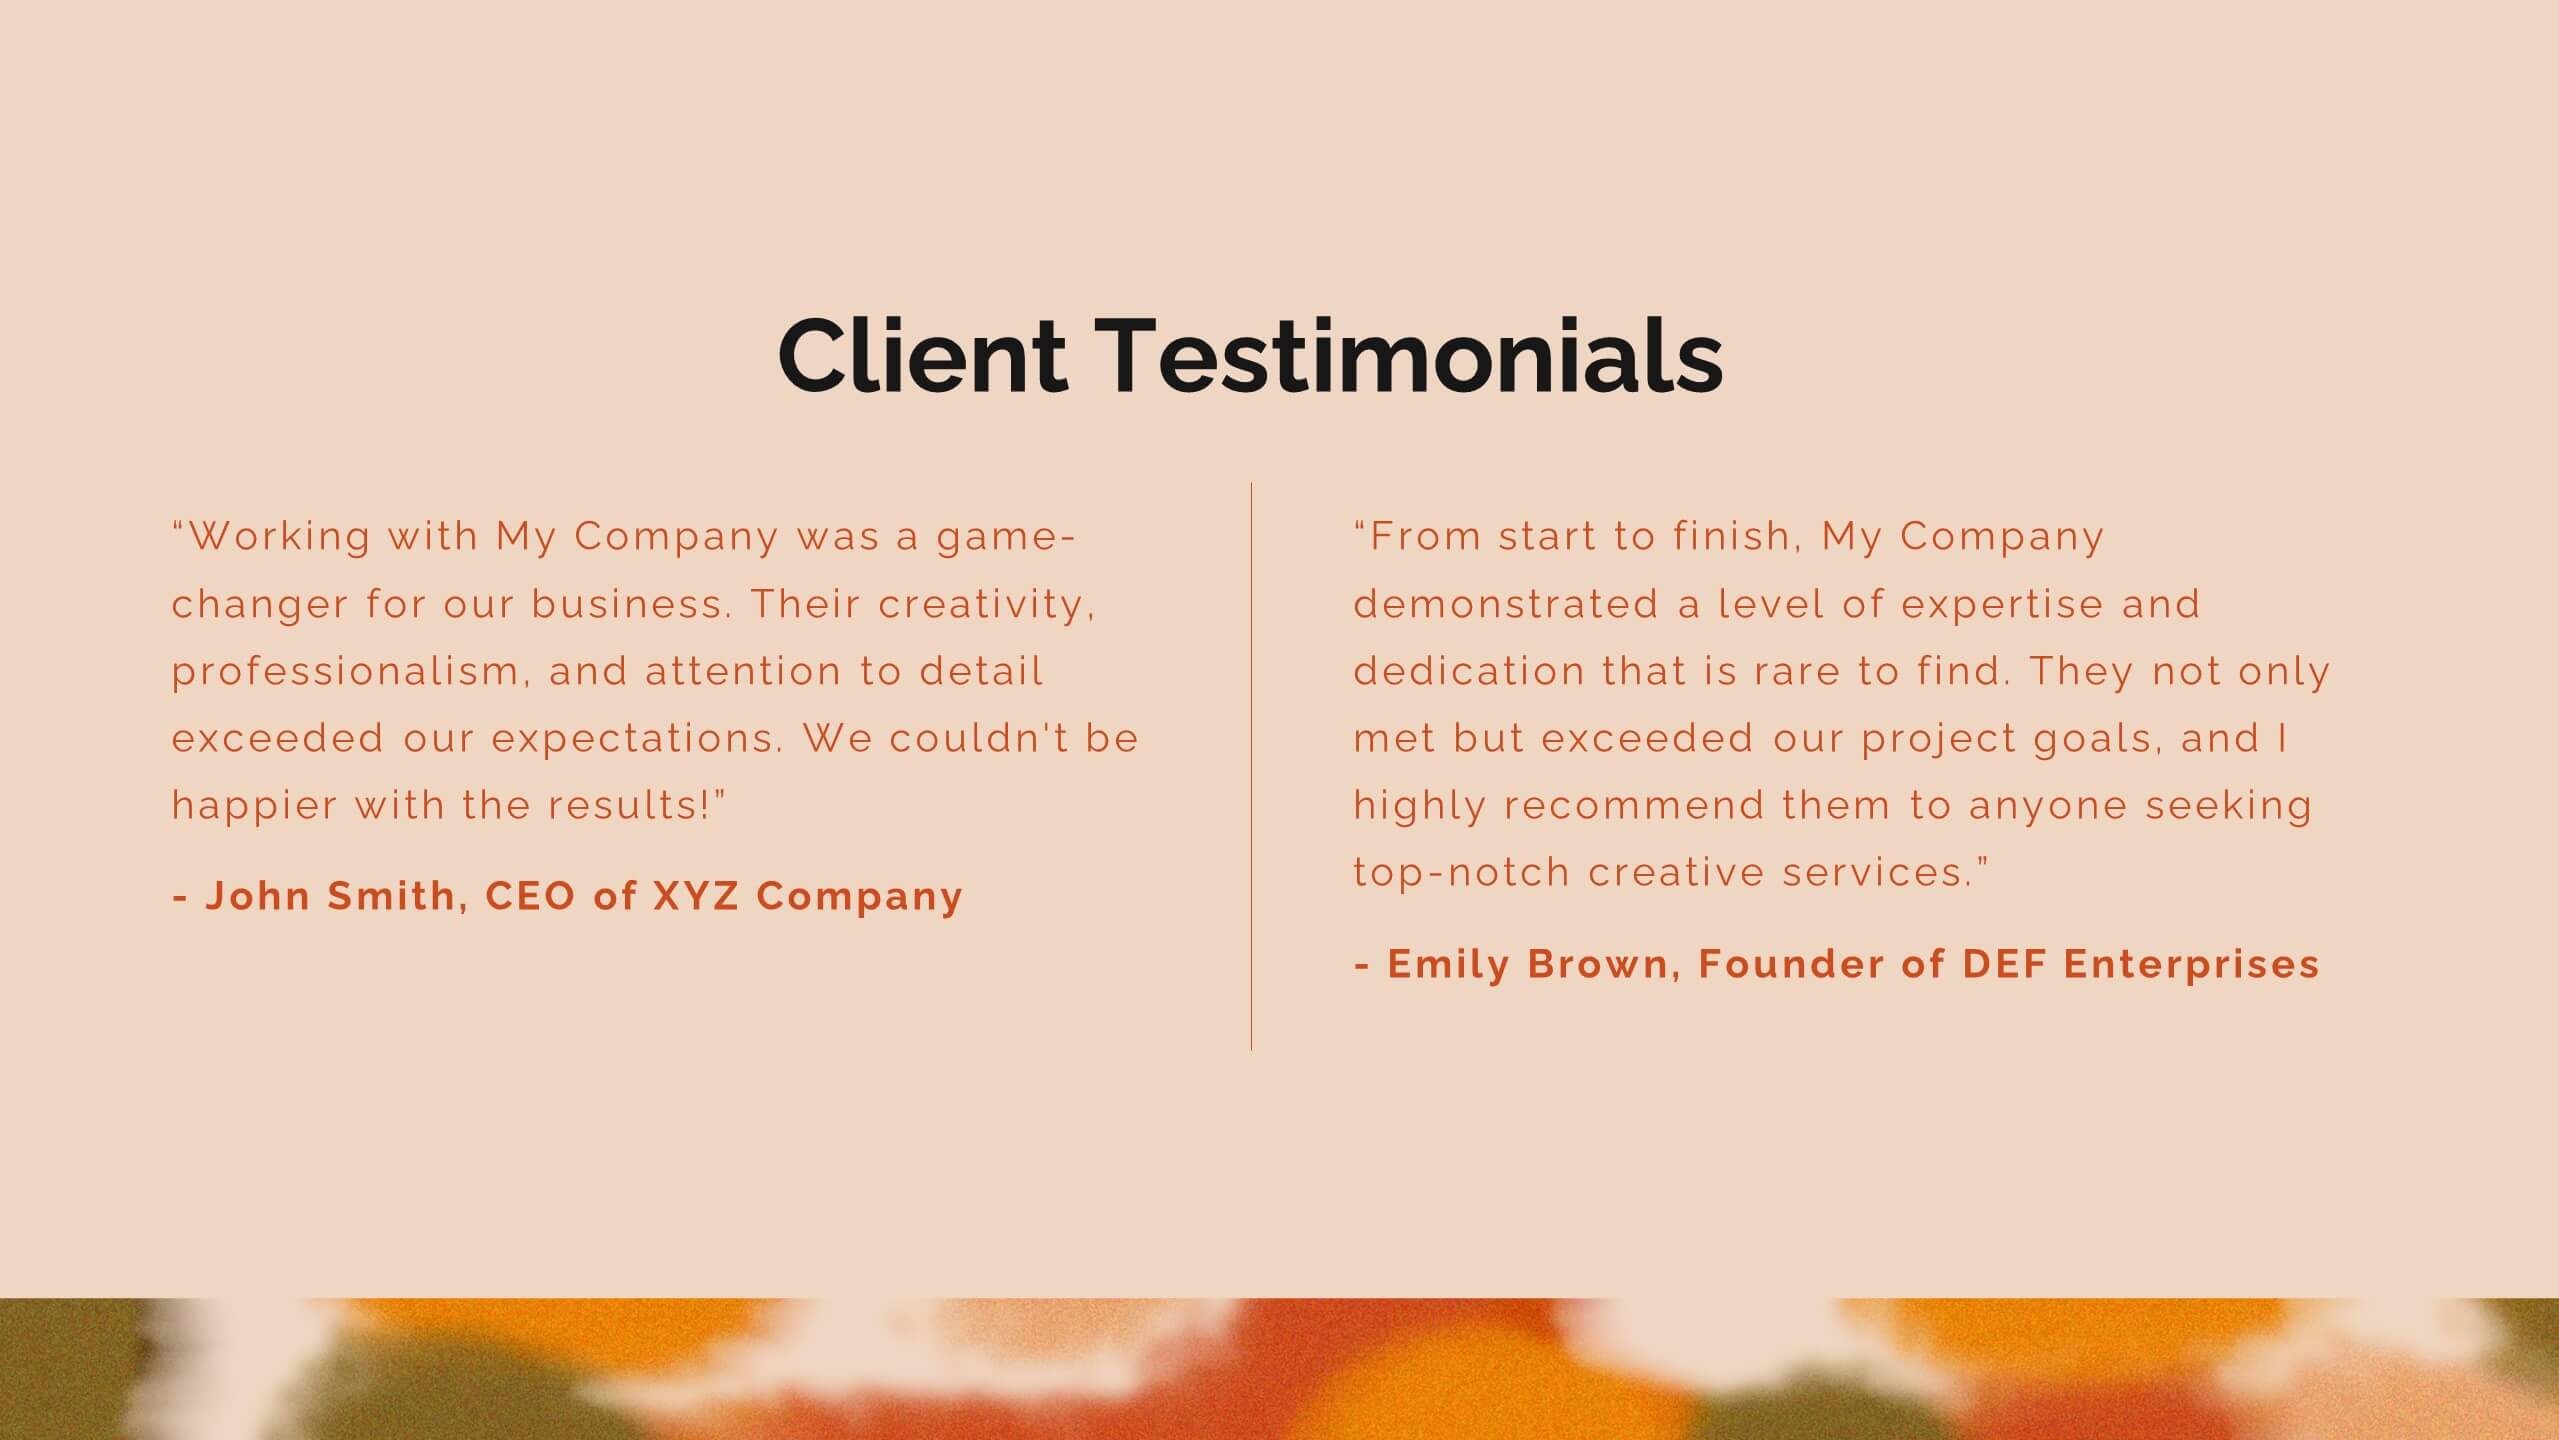
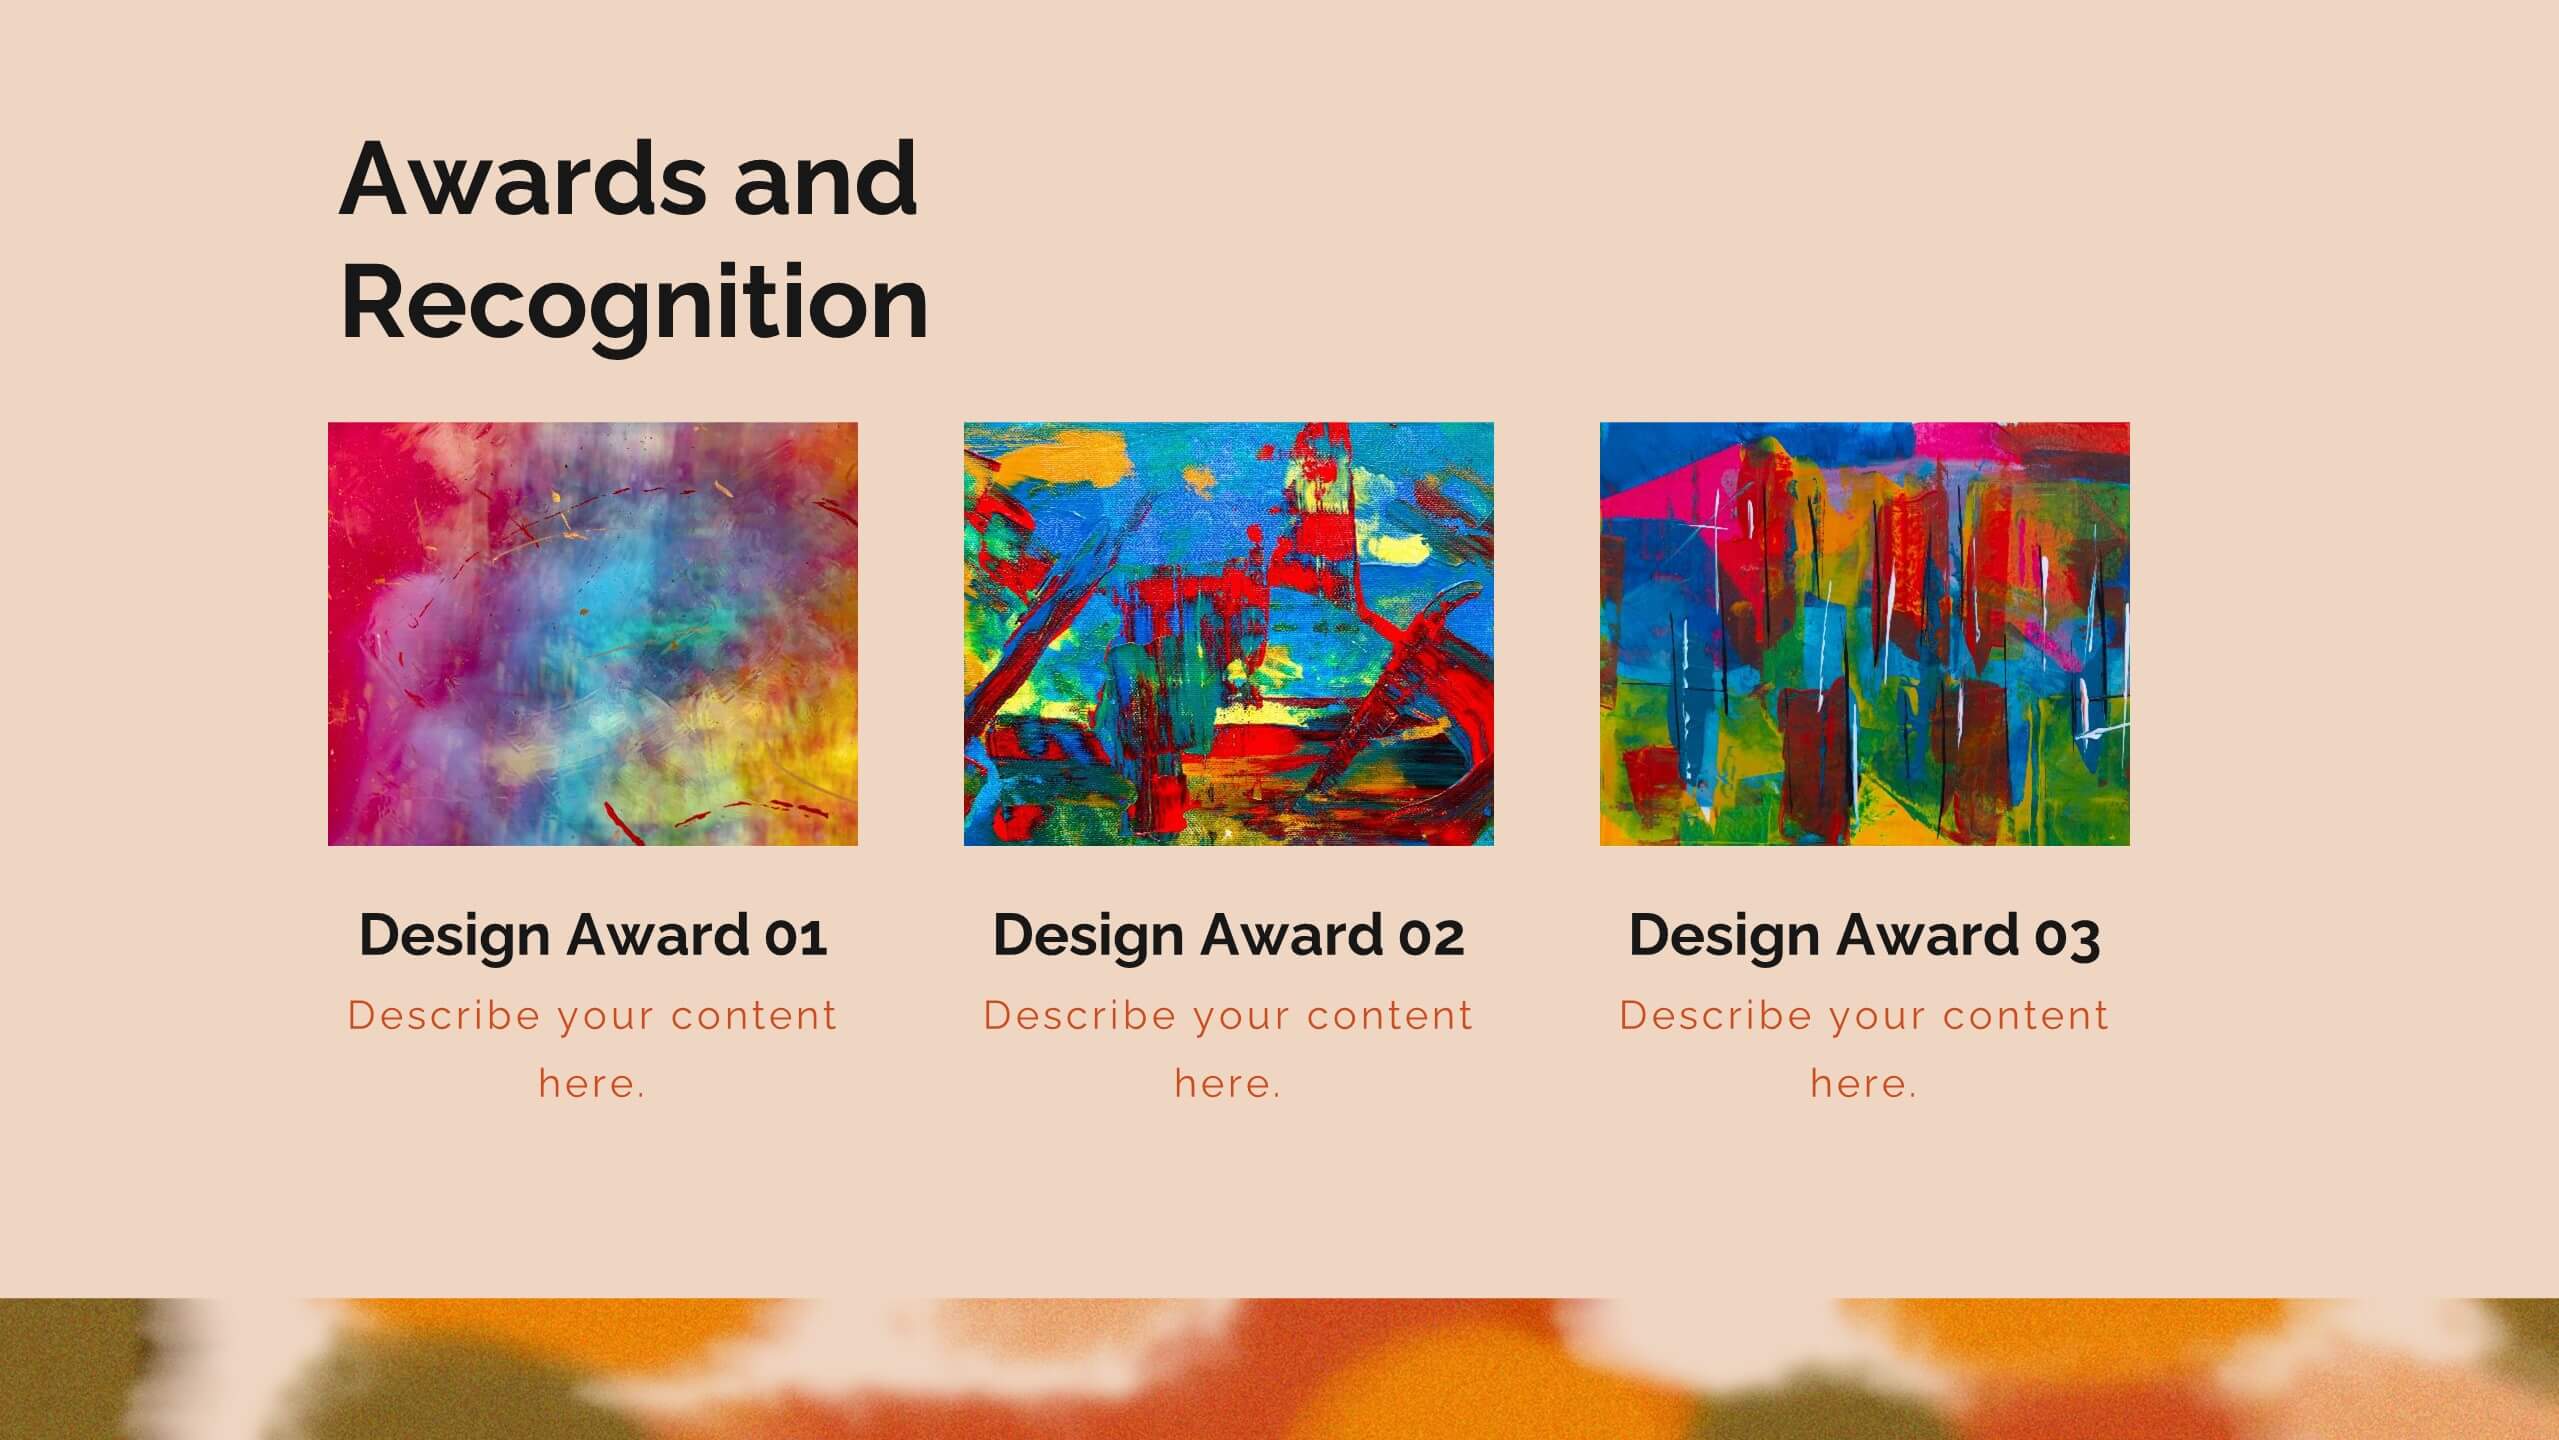
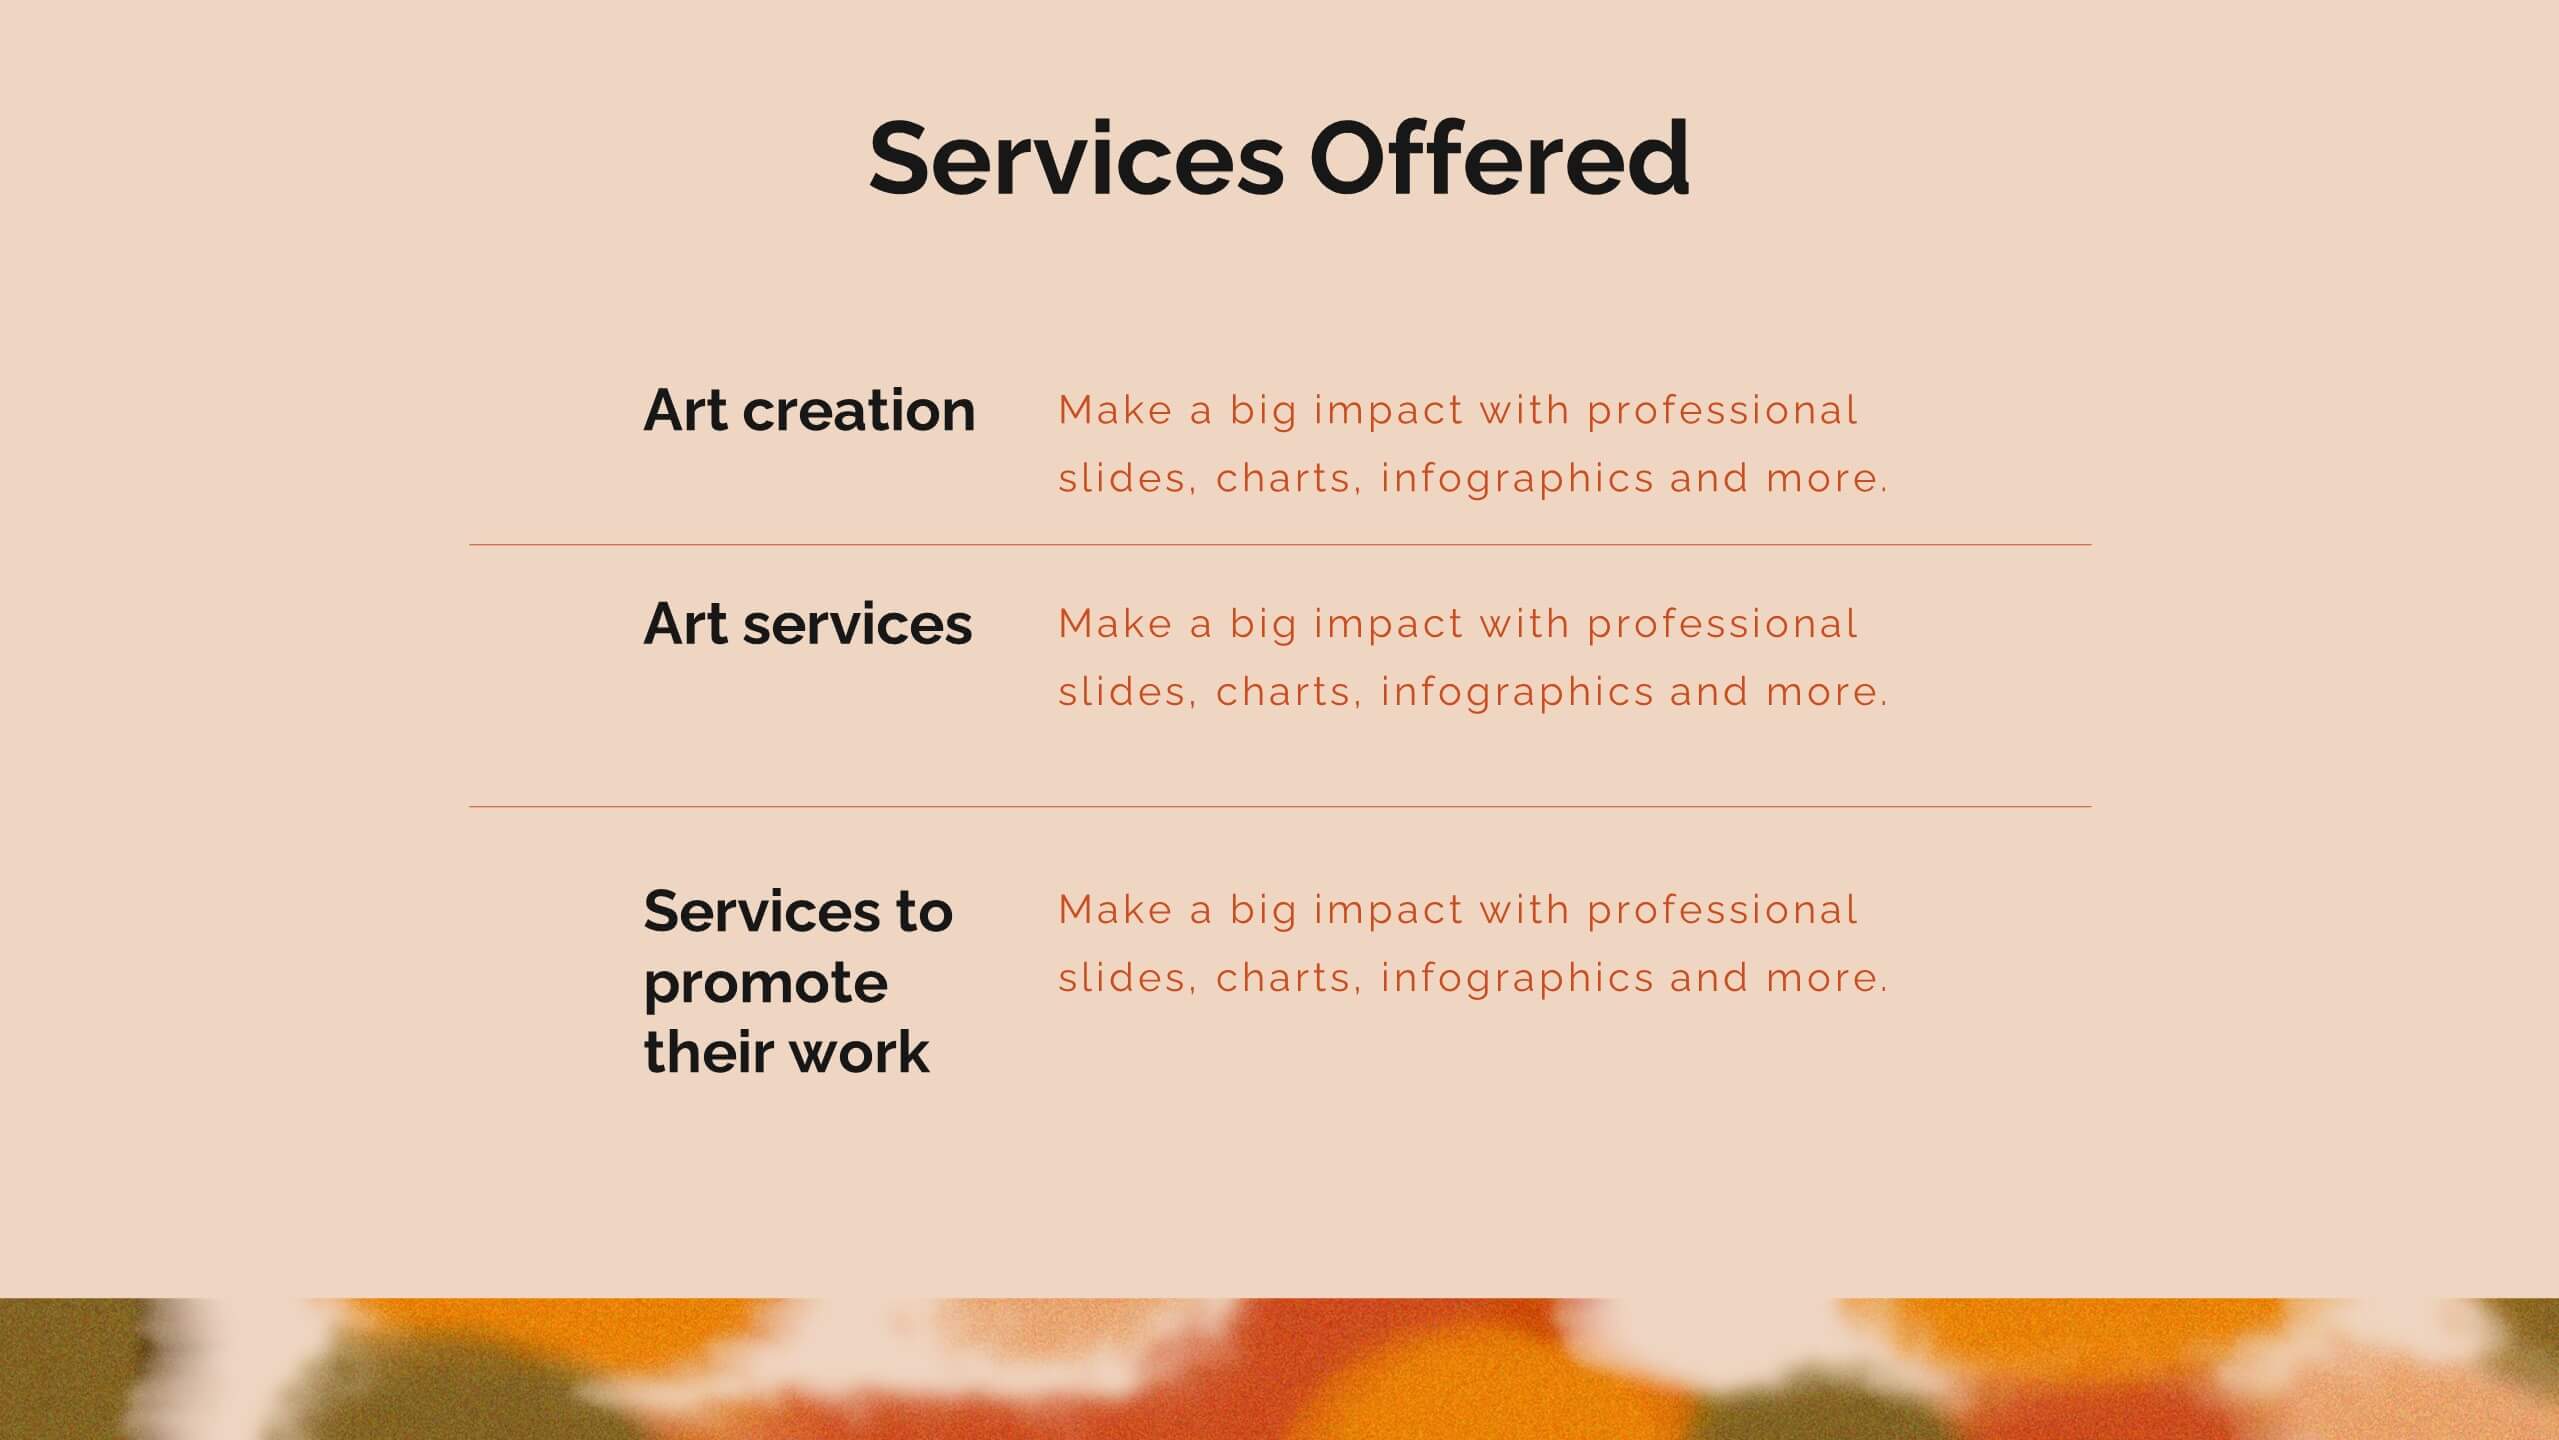
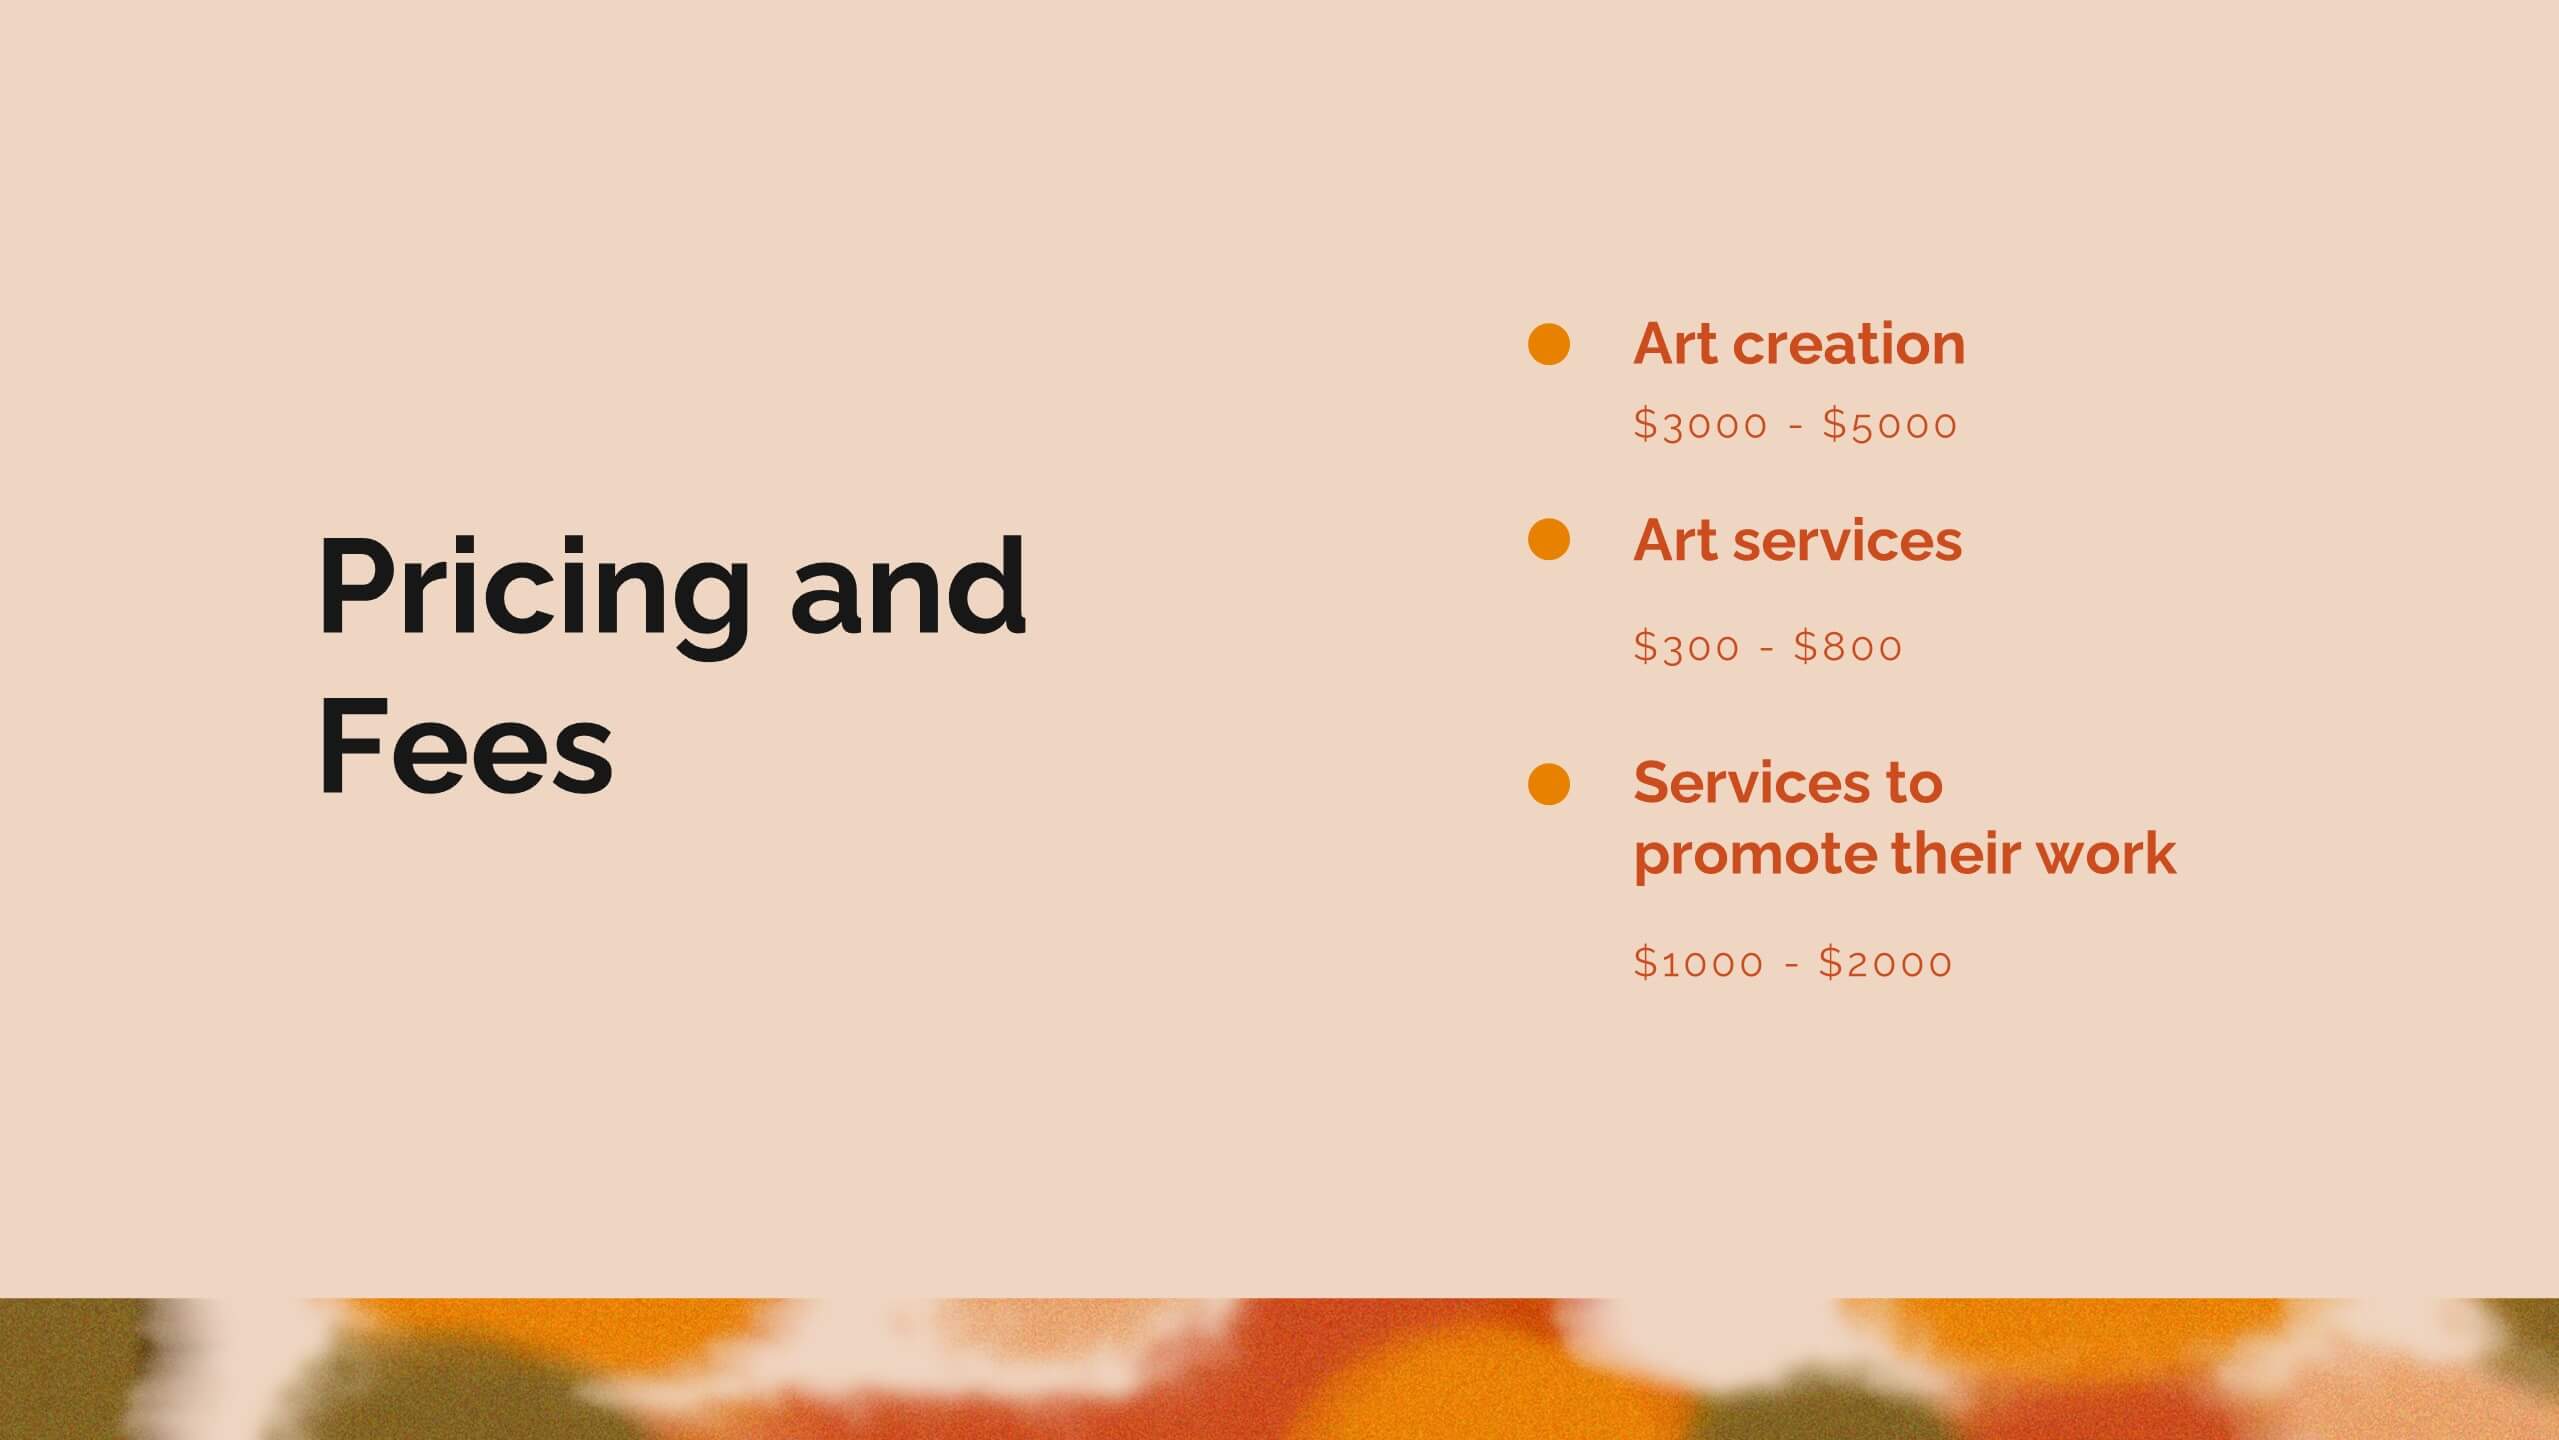
Zenith Artist Portfolio Presentation
Showcase your artistic journey with this captivating portfolio template! Perfect for presenting your projects, creative process, and client testimonials. Ideal for artists aiming to highlight their work and achievements. Compatible with PowerPoint, Keynote, and Google Slides, this template ensures your portfolio is visually stunning and professionally presented. Make your art stand out!


10 slides
Hospital Services Overview Presentation
Bring your healthcare message to life with a clean, modern layout that makes complex hospital services easy to understand. This presentation helps you outline key departments, care processes, and essential service details with clarity and confidence. Designed for smooth communication in medical settings, it works seamlessly in PowerPoint, Keynote, and Google Slides.


6 slides
Business Challenges and Solutions Presentation
Address challenges with strategic solutions using this Business Challenges and Solutions template. Featuring a clear side-by-side layout, this design helps visualize business obstacles and their corresponding solutions for effective decision-making. Perfect for problem-solving discussions, strategy meetings, and brainstorming sessions, this template ensures your content remains structured and impactful. Fully customizable for PowerPoint, Keynote, and Google Slides.